Article

Sprinkler Irrigation Is Effective in Reducing Nitrous Oxide Emissions from a Potato Field in an Arid Region: A Two-Year Field Experiment

1
Inner Mongolia Potato Engineering and Technology Research Center, College of Life Sciences, Inner Mongolia University, Hohhot 010021, China
2
Inner Mongolia Key Laboratory of Environmental Chemistry, Inner Mongolia Normal University, Hohhot 010022, China
3
Institute of Geographic Sciences and Natural Resources Research, Chinese Academy of Sciences, Beijing 100101, China
4
College of Water Conservancy and Civil Engineering, Inner Mongolia Agricultural University, Hohhot 010018, China
*
Author to whom correspondence should be addressed.
Atmosphere 2019, 10(5), 242; https://doi.org/10.3390/atmos10050242
Submission received: 1 April 2019 / Revised: 25 April 2019 / Accepted: 29 April 2019 / Published: 1 May 2019
(This article belongs to the Special Issue Nitrous Oxide Emission in the Atmosphere)

Abstract

:
In arid and semi-arid regions, water-saving irrigation is the primary mode of local agricultural production. Since the chemical fertilizer is the principal source of nitrous oxide (N2O) emissions, we present results from a two-year (2016–2017) field experiment on a potato field to verify the general influence of water-saving irrigation on N2O emissions. A split-plot experiment was established with two irrigation systems and two fertilizer treatments, which give a total of four treatments. Two different irrigation systems were investigated: (i) flood irrigation with nitrogen fertilizer (NF-FI) combined with a control without any fertilizer (C-FI) and (ii) overhead sprinkler irrigation with a nitrogen fertilizer (NF-SI) accompanied with a control without any fertilizer (C-SI). The N2O emissions of the fertilizer treatment were greater than those of the control under each irrigation system. In plots where the fertilizers were applied, using overhead sprinkler irrigation reduced the average cumulative N2O emissions between 40.72% and 59.65% compared with flood irrigation. This was mainly due to the lower amount of water applied and the lower availability of NO3-N and NH4+-N of soil associated with an overhead sprinkler irrigation. This work shows that the overhead sprinkler irrigation is an effective strategy to use to save water and mitigate emissions of the atmospheric pollutants N2O in comparison to flood irrigation.

1. Introduction

Nitrous oxide (N2O) is one of the most important long-lived greenhouse gases in the atmosphere. Especially from 2007 to 2011, the N2O concentration in the atmosphere had increased linearly at an annual rate of 6% [1]. Between 1750 and 2011, the atmospheric N2O concentration increased from 270 ppbv (10−9 volume ratio) to 324 ppbv, which results in an increase in global radiative forcing of 0.17 W m−2 [2]. Fertilizer nitrogen use in agricultural production is the primary source of N2O emissions [3], with agricultural emissions accounting for about 60% to 80% of the total anthropogenic atmospheric N2O emissions [4]. An irrigation strategy is one essential factor that affects the emissions of N2O from agricultural soils. In irrigated soils, the amount of water used and its distribution in the soil influences moisture temporally and spatially [5]. Consequently, irrigation practices can have a significant impact on nitrogen cycles in the soil such as the amount of N transport, N mineralization, and other processes, such as NO3-N leaching, within the soil. The changes in the differences in nitrogen cycles affect the temporal and spatial distribution for various forms of nitrogen in the soil and the formation of N2O. The different soil conditions of different irrigated crops greatly affect soil microbial processes of nitrification and denitrification, which control N2O production in soils [6,7].
In arid and semi-arid regions, FI is the most popular traditional surface irrigation system in China [5]. Under FI, crops are planted in raised beds and water is supplied at high volumes to the plant row area through the soil surface in between the rows. The applied fertilizers in raised beds dissolve rapidly because of large quantities of water that were absorbed [6]. Following irrigation with long intervals and large application depths, water flows through soil macropores, and most of the soil volume is wetted, which temporarily create a high ratio of anaerobic microsites, even if a small area of the ridge top may remain dry.
Soil N2O emissions has been shown to be very sensitive to water-saving irrigation techniques [8]. SI is one of the water-saving irrigation techniques after flooding and the difference between them is crucial to analyze [9], as it offers the precise control of irrigation water amount and uniformity to decrease water and N losses in comparison to FI [10,11]. In SI, water is applied using shorter irrigation intervals and a lighter water application. Irrigation water reaches the surface of the soil after it passes through the developed crop canopy, which is similar to precipitation. The wetted front of infiltration into the soil moves primarily under gravity gradients, and only a small part of the soil volume is nearly saturated due to the uniformity of irrigation [6,12]. The size and shape of the wetted volume in the soil under SI and FI systems mainly depends on the quantity and flow rate of water application [13]. The hydraulic properties of the irrigated soil resulting from SI and FI systems determine the horizontal and vertical infiltration of water [14,15]. Water productivity and water use efficiency can be higher with SI in comparison to FI (18–57% and 21–81%, respectively) [5].
Although the influences of moisture on crop growth have been very well recorded in SI and FI systems [16,17], there have been few reports in previous studies on the effects of different soil wetting patterns on soil N2O emissions. The fertigation treatments that used the water pressure as a driving force to suck up the fertilizers from the tank and mix them homogeneously with the irrigation water have been shown to lead to reductions in N2O emissions in irrigated maize cropping areas with respect to SI of 80% and 78% for calcium ammonium nitrate and urea fertigation, respectively [18]. The potential of irrigation technologies to mitigate soil N2O mitigation from drip irrigation (DI) is higher (even above 50%) than FI during a melon crop season [19,20]. Yield-scaled N2O emissions in rain fed Mediterranean agro-ecosystems were significantly higher in barley (2.30 g N2O-N kg aboveground N uptake−1) than in vetch (0.97 g N2O-N kg aboveground N uptake−1) [21]. The use of the micro-sprinkler with one 20 L h−1 flow was shown to reduce the growing-season N2O emissions by 29% from vineyards. The annual area-scaled N2O emissions using drip irrigation were around 1.8 times larger than the emissions obtained using micro-sprinklers [22]. The lower amounts of water applied in drip irrigation through more frequent irrigation events lowers the overall soil moisture, increases well aerated soil conditions, and favors nitrification over denitrification in a semi-arid climate [20]. Emission factors of nitrogen fertilizer ranged from 0.15% to 1.1% of added N fertilizer emitted as N2O-N from overhead sprinkler-irrigated cotton in Maricopa, AZ. The results of David et al. on Greenhouse gas (GHG) emissions from agricultural soils in the Canadian Prairie region indicate that N2O emissions from soil using irrigated cropping systems under a wheat–dry bean–canola sequence are overestimated by the current Canadian National GHG Inventory Reporting [23]. China is currently one of the largest contributors to GHG emissions, with potentially serious implications for its population. However, the actual N2O dynamics from soils irrigated with Low Energy Precision Application (LEPA) sprinklers and overhead sprinklers in a semi-arid region are not well understood, since there have been few potato field-based studies in such regions. SI is widely used for potato production. Currently, there is little information about the differences in N2O emissions between sprinkler-irrigation and flood-irrigation soils.
Based on the previously mentioned literature review, it is expected that the FI and overhead SI methods will influence N2O emissions due to the different wetted forms in the soil. In sprinkler-irrigated soil that is always wet controlled by tension-meters, the low water application amount may favor a more aerobic, rather than a more anaerobic, environment that is controlled by conditions of low moisture in the soil. However, anaerobic soil microsites from the flood-irrigated regions may play a predominant role in intensively managed and irrigated systems [24]. Therefore, it is doubtful that the differences in water distribution between soils irrigated with SI and FI may lead to different N2O production processes. In this work, the objectives were to compare the differences in N2O emissions from the soil of a potato field using flood-irrigation and sprinkler-irrigation, and to assess how the two irrigation systems modulated the N2O emissions and the N2O emission factor. The results will help develop strategies to mitigate N2O emissions from soils fertilized with chemical fertilizers in an irrigated agriculture.

2. Experiments

2.1. Description of Study Site

The experiment was implemented from 2016 to 2017 at an experimental potato farm in the suburbs of Hohhot, Inner Mongolia, China (40°45′34″ N, 111°41′56″ E), in the middle of the Inner Mongolia Plateau, which is located in the hinterland of the Asian continent. The soil was a Calcic Haploxerept with a sandy clay loam texture [25]. The particle size distribution of the soil in the experimental field were measured in Table 1, which was measured using a Mastersizer 2000 laser particle size analyzer (Malevern Instruments, Ltd., Malvern, UK). Selected physicochemical properties of the upper horizon of the soil are summarized in Table 2. The mean annual precipitation in the study area is 335 mm and the mean annual temperature is 6.7 °C (averages for 2004–2018).

2.2. Experimental Design and Field Management

The experiment was arranged according to a split-plot design. Two main plots (600 m2) were selected in the experimental field, and were subjected to two treatments. The two main plots were equipped with different irrigation systems, known as FI and SI. Each main plot was also split according to the fertilizer treatment applied, namely: (i) N, P, and K compound fertilizer and urea as a chemical fertilizer (NF, 390 kg N ha−1) and (ii) a control without any fertilizer (Control). Each main plot was divided into six subplots (5 × 10 m) in a randomized complete block design for the NF and control fertilizer treatments with three replicates, respectively. The amount of applied fertilizer is within the local range used by farmers for potato crops (360–410 kg N ha−1). Fertilizers were applied by hand and immediately incorporated into the upper 15 cm of the soil using a rotovator. SI is often used to apply soluble fertilizers in small amounts (9.75 kg N ha−1 (10 mm)−1) during irrigation. Each subplot included four overhead sprinkler irrigation lines spaced 90 cm apart, and each sprinkler irrigation line was fitted with a solid set consisting of four LEPA sprinklers with a wetting radius of 1.5 m, spaced 2.8 m apart, and mounted on 1.30 m risers. A water meter (LXS-20C, TEFEN Manufacture, Nahsholim, Israel) was installed in the main pipe to measure the amount of water applied to each experimental plot. This practice for the SI is popular with the local farmers in the study region.
For the flood-irrigated experimental site, five furrows were made in each subplot, using a seeding machine. The furrows were spaced 90 cm apart and ploughed to a depth of 30 cm. The furrows were located at the end of each experimental site, since irrigation water was intercepted to prevent it from flowing out of the field. The subplots were independent. However, the subplots were irrigated at the same time. The amount of applied irrigation water was recorded by an LXS-20C water meter in each irrigated subplot after fertilizer application.
A potato crop (Solanum tuberosum L. cv. Favorita) requiring about 105 days to reach maturity was planted by a potato seeder on 25 May, 2016 and 15 May, 2017. The potatoes were planted on raised beds 0.3 m high and 0.6 m wide, with a 0.3 m-wide bed top, a 0.20 m spacing between plants in a row, and a sowing rate of 2250 kg ha−1. The potatoes were harvested in September 2016 and September 2017.

2.3. Irrigation Management

The first irrigations were performed on 25 May 2016 and 15 May 2017, immediately after the potatoes were planted. The intensity of water application in the first irrigation was 40 mm for SI. After the potatoes revived, the SI was controlled by tension-meters. The irrigation was triggered when the mean soil matric potential (SMP) at a depth of 0.2 m directly under the sprinklers decreased to about −24.5 kPa. The irrigation was stopped when the amount of water applied during each irrigation event was about 10 mm. The distribution of the main potato-root zones was used to determine the duration of irrigation, which was usually about 1.5 min, with about 10 mm of water applied each time at a pressure of 0.1 MPa via automatic computer control. SI was stopped 20 days before harvesting.
For FI, the timing and amount of water application were determined based on local irrigation practices. Irrigation was uniformly applied three times throughout the crop growing season: when potatoes were planted, a second time in the tuber set stage, and a third time during the tuber bulking stage. The amount of water applied in each irrigation event was about 200 mm. The total amounts of water applied for SI and FI during the study period were, respectively, 200.7 and 601.8 mm in 2016 and 205 mm and 593.7 mm in 2017. In the sprinkler-irrigated field, the irrigation frequency was higher, while the total amount of irrigation water was lower, than in the furrow irrigated field. Total precipitation was less than 200 mm during the crop growing season. Precipitation data were collected from a portable weather station located in the potato experimental farm.

2.4. Sampling and Analysis of N2O

N2O fluxes from each sprinkler-irrigated and flood-irrigated plot were simultaneously measured in situ using a static opaque chamber method [26]. The chamber headspace was a 125l cube (50 × 50 × 50 cm). There are 12 chambers in all. The outer layer of the chamber was covered with sponge and aluminum foil in order to prevent the chamber from being heated by sunlight. The chambers were placed inside square stainless-steel collars (50 × 50 cm) to ensure a good seal without destroying the compactness of the soil. The square stainless-steel collars were inserted into the ground, to a depth of 15 cm. The collars covered the ridge and furrow in the field. The measurement of gas fluxes considered the field variation between the ridge and the furrow, and, thus, can represent the field average level of the N2O flux. On a day before gas sampling, the collars were removed in order to not disturb the water distribution during irrigation. The chambers were closed for 60 min, between 8:00 a.m. and 9:00 a.m. At 9:00, 9:05, 9:10, 9:15, and 9:20 a.m., gas samples (100 mL) were collected in evacuated three-part polypropylene syringes. Measurements were taken once per week throughout the potato growing season from planting to harvesting. A temperature sensor measured the air temperature inside the chambers during the sample collection. Field soil temperature was monitored using a portable digital thermometer (JM 624, JinMing Instrument Co. Ltd., Tianjin, China) inserted into the soil, and the temperature data were stored in a data logger. Soil moisture in the upper horizon of the soil was measured using a TDR350 soil moisture meter (SPECTRUM Inc., St. Petersburg, FL, USA). The length of the soil moisture measurement rods is 12.5 cm. Soil moisture was averaged over the region from the surface to a depth of 12.5 cm.
The N2O in the samples was measured within 12 h using an Agilent 6820D gas chromatographer (Agilent Corporation, Shanghai, China) using two detectors: an electron capture detector (ECD) and a hydrogen flame ionization detector (FID). The configuration described by Jiao (2015) was implemented for the N2O analysis [27].

2.5. Soil Analysis

After N2O sampling, the soil in each stainless-steel collar was simultaneously collected, and levels of soil NO3-N and NH4+-N were determined, using a micro-Kjeldahl procedure [28], by extracting 8 g of fresh soil with 60 mL of deionized water and 50 mL of KCl (0.01 M), respectively. Soil organic carbon (SOC) was determined by analyzing soil extracts using a total organic carbon (TOC) analyzer (Sievers 5310 C, GE Analytical Instruments, USA) [29].

2.6. Calculation Method of the N2O Emission

The N2O fluxes were estimated within the closed chamber based on the linear increase of gas concentration over sampling times of 0, 5, 10, 15, and 20 min. The sample sets were rejected if they did not yield a linear regression value of R2 ≥ 0.9 for N2O [27]. Gas concentrations were converted to mass per unit volume (µg N2O μL−1) using the Ideal Gas Law at the chamber air temperature measured during each sampling event and at 0.101 MPa. N2O Fluxes were computed using the formula below.
F = ΔC/Δt × V/A ×∝
where F is the N2O flux (µg N2O–N/ m−2 h−1), ΔC/Δt denotes the increase or decrease of gas concentration in the chamber (µg L−1 h−1), V is the volume of the chamber (L), A is the covered surface area (m2), and ∝ is a conversion coefficient for elemental N (28/44 for N2O). Gas fluxes that failed the linearity criterion were not included in the data analysis. These accounted for <2% of the total data set. Gas fluxes that failed significance and detection tests were set to zero flux. A complete discussion of the chamber flux measurement method is described in Reference [30].

2.7. Data Statistics and Analysis

N2O emissions were estimated by the successive linear interpolation of N2O emissions from the soils subjected to the different irrigation systems. Statistical analyses were performed using the SPSS version 22.0 software (SPSS Inc., Chicago, IL, USA). A one-way analysis of variance (ANOVA) was used to evaluate the differences in the seasonal and annual cumulative emissions of N2O between the different irrigation techniques. Tukey’s multiple range tests were used to determine whether significant differences occurred between the different irrigation treatments at a significance level of 0.05. A two-way ANOVA was used to analyze the effects of the irrigation treatments and their interactions on N2O emissions. Data drafting was run in the SigmaPlot 13 and Excel 2016 software.

3. Results

3.1. Changes in Precipitation and Temperature

The frequency of rainfall in the 2016 crop growing season was higher than that in the 2017 crop growing season. However, there was no significant difference in the total rainfall in the crop growing seasons of 2016 and 2017 (p > 0.05), which were 196.6 mm and 198.8 mm, respectively. The atmospheric temperature showed a consistent change trend from May to September in both 2016 and 2017. The temperature began to increase gradually in April and was higher from July to August than in other months (Figure 1).

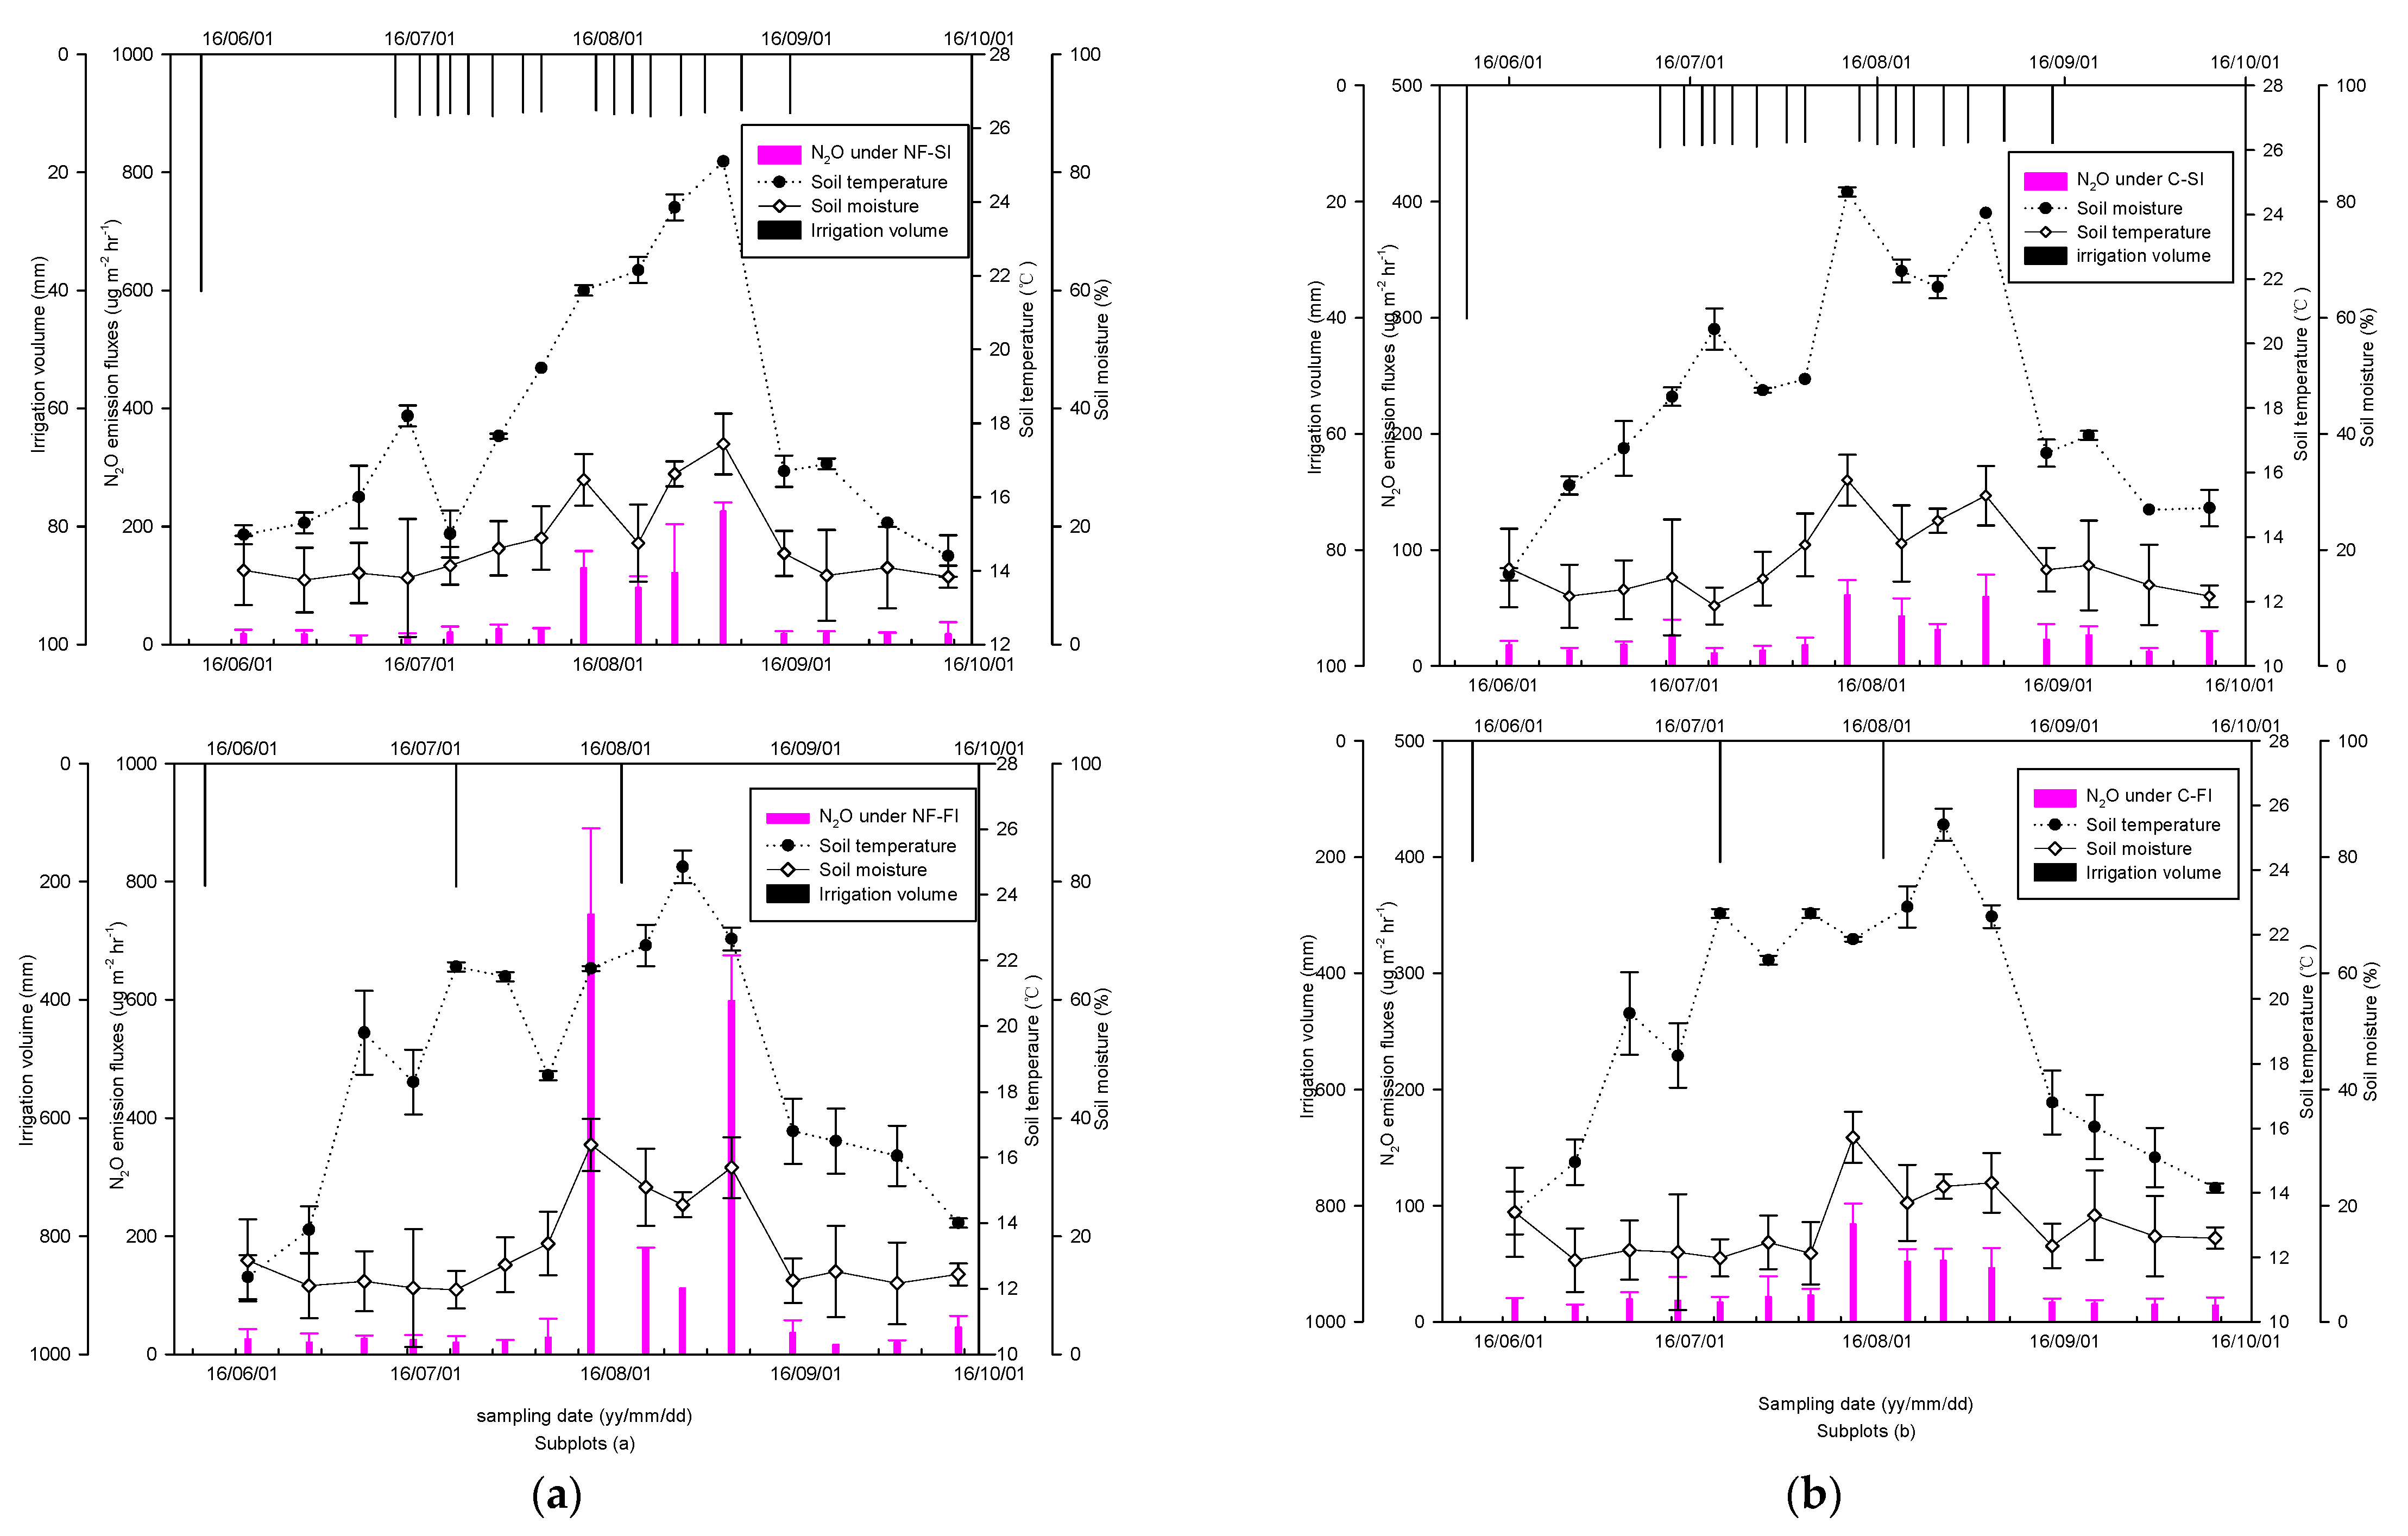
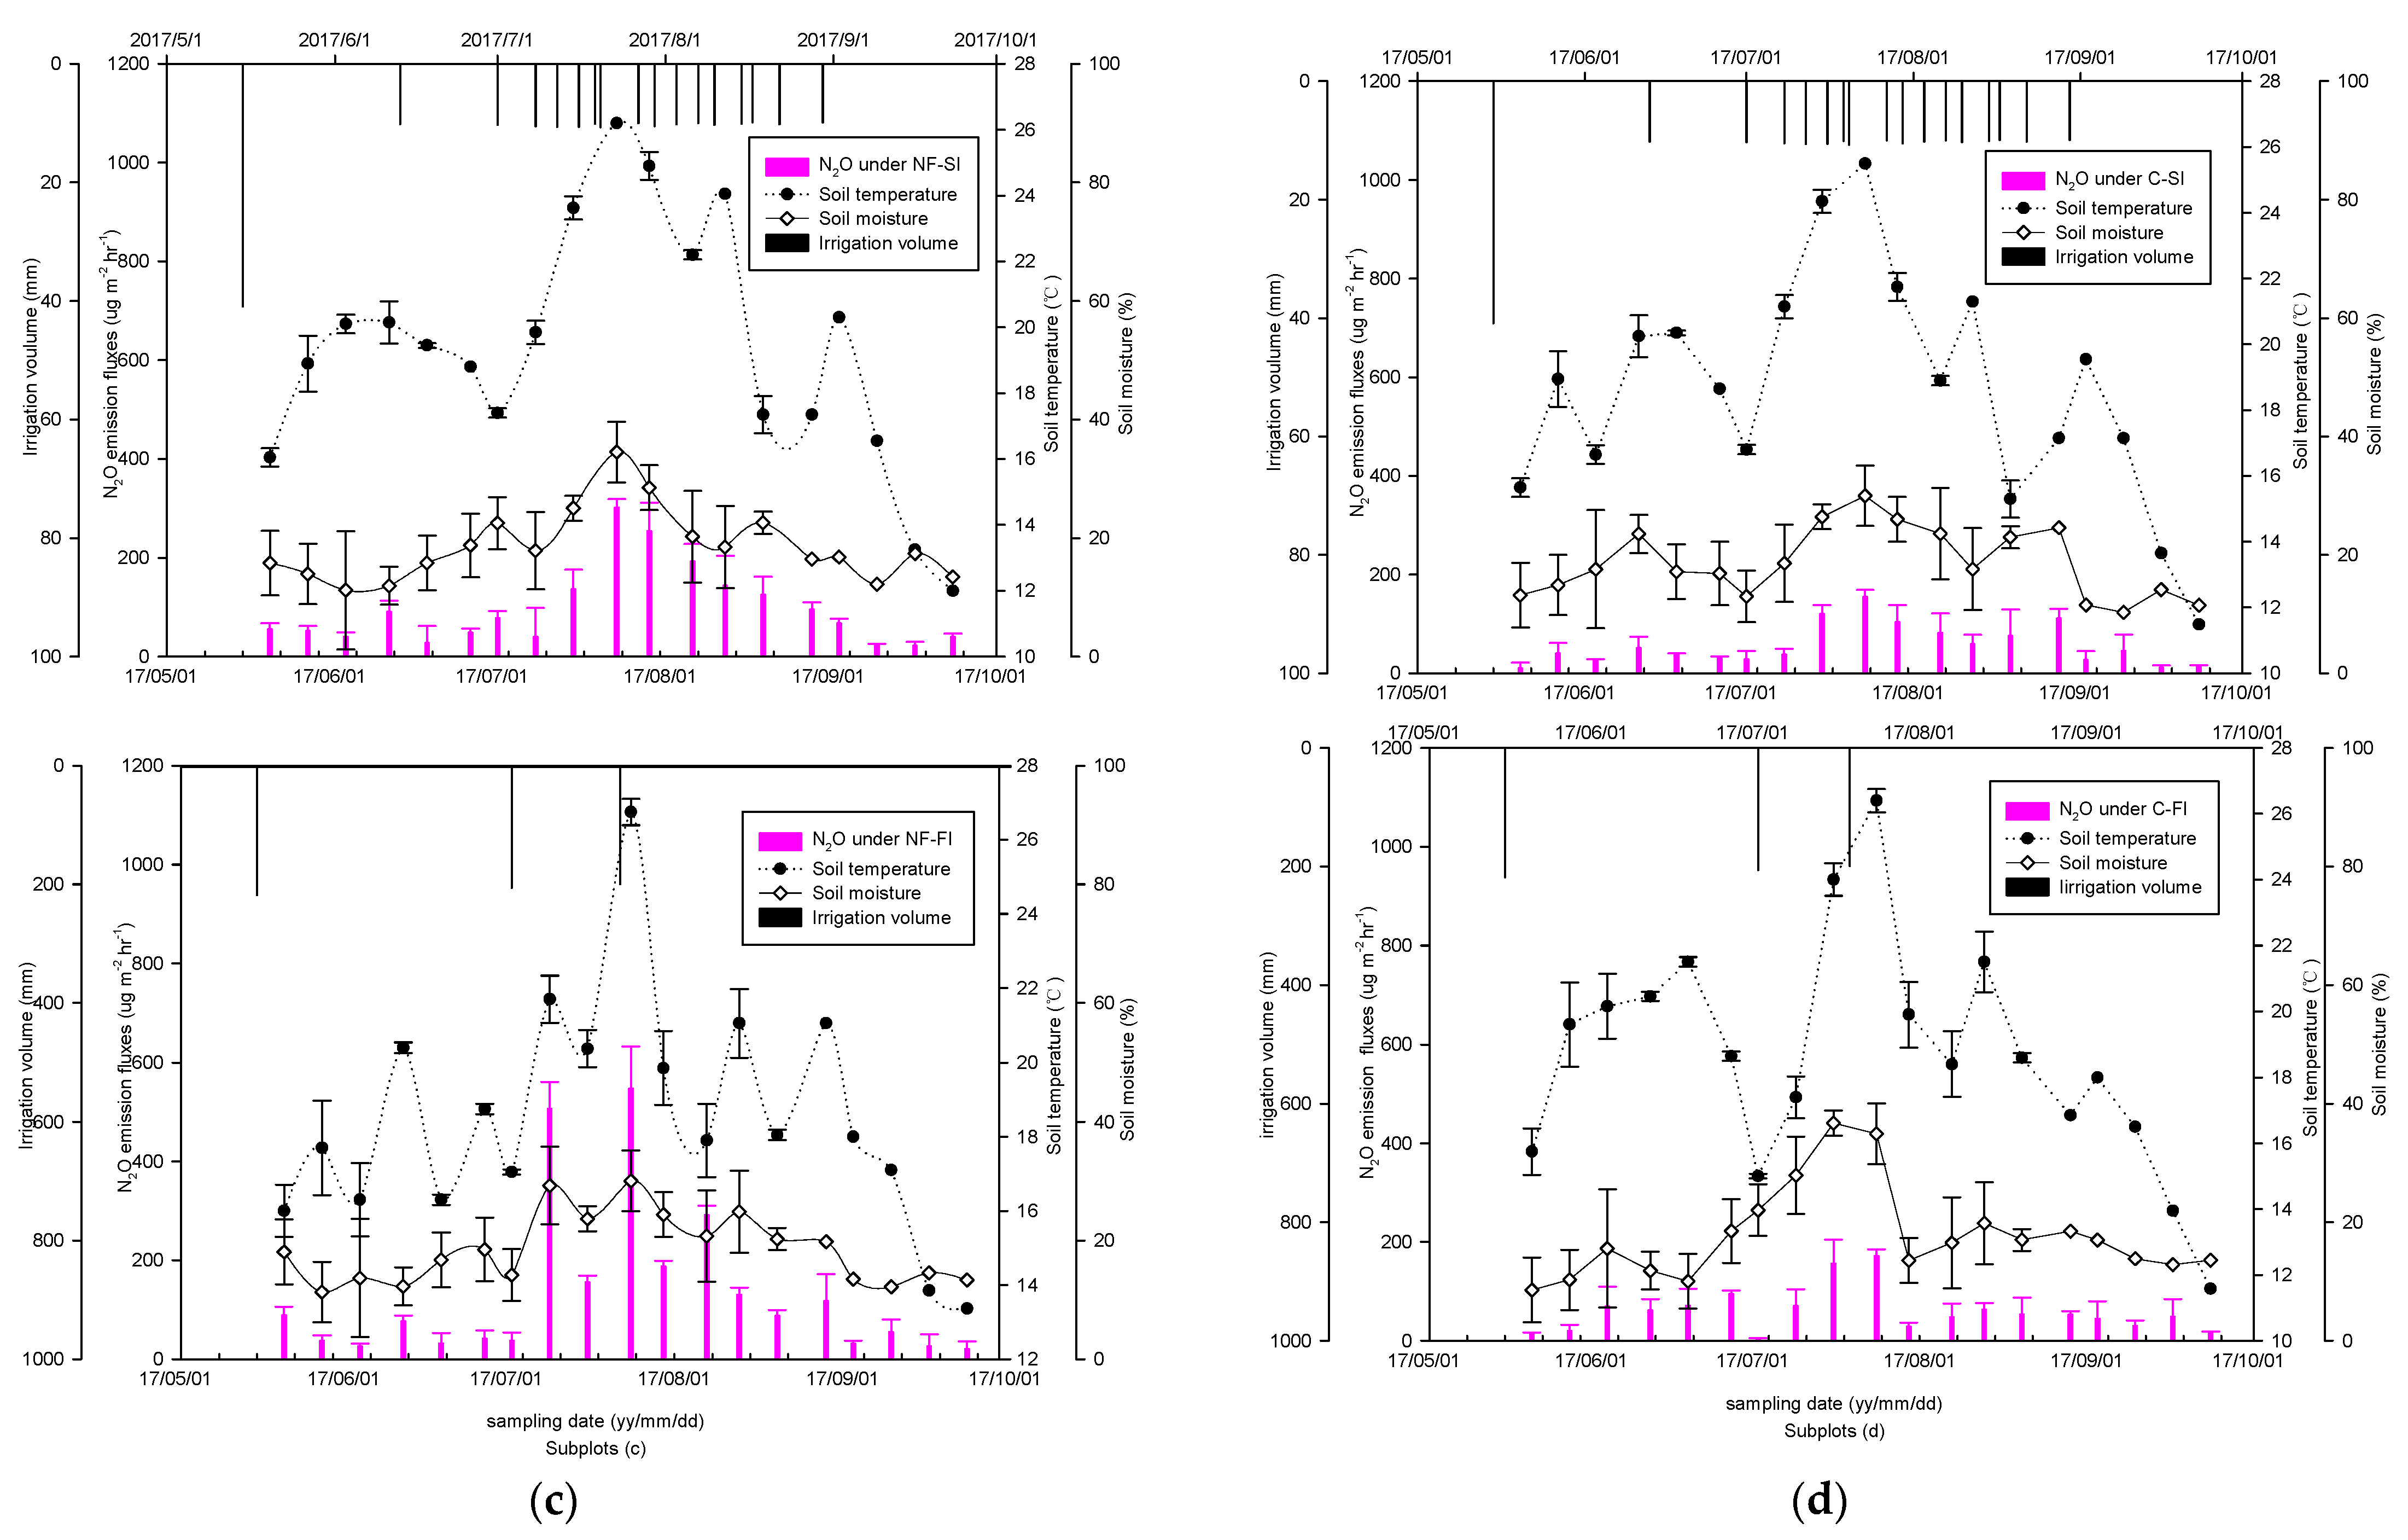
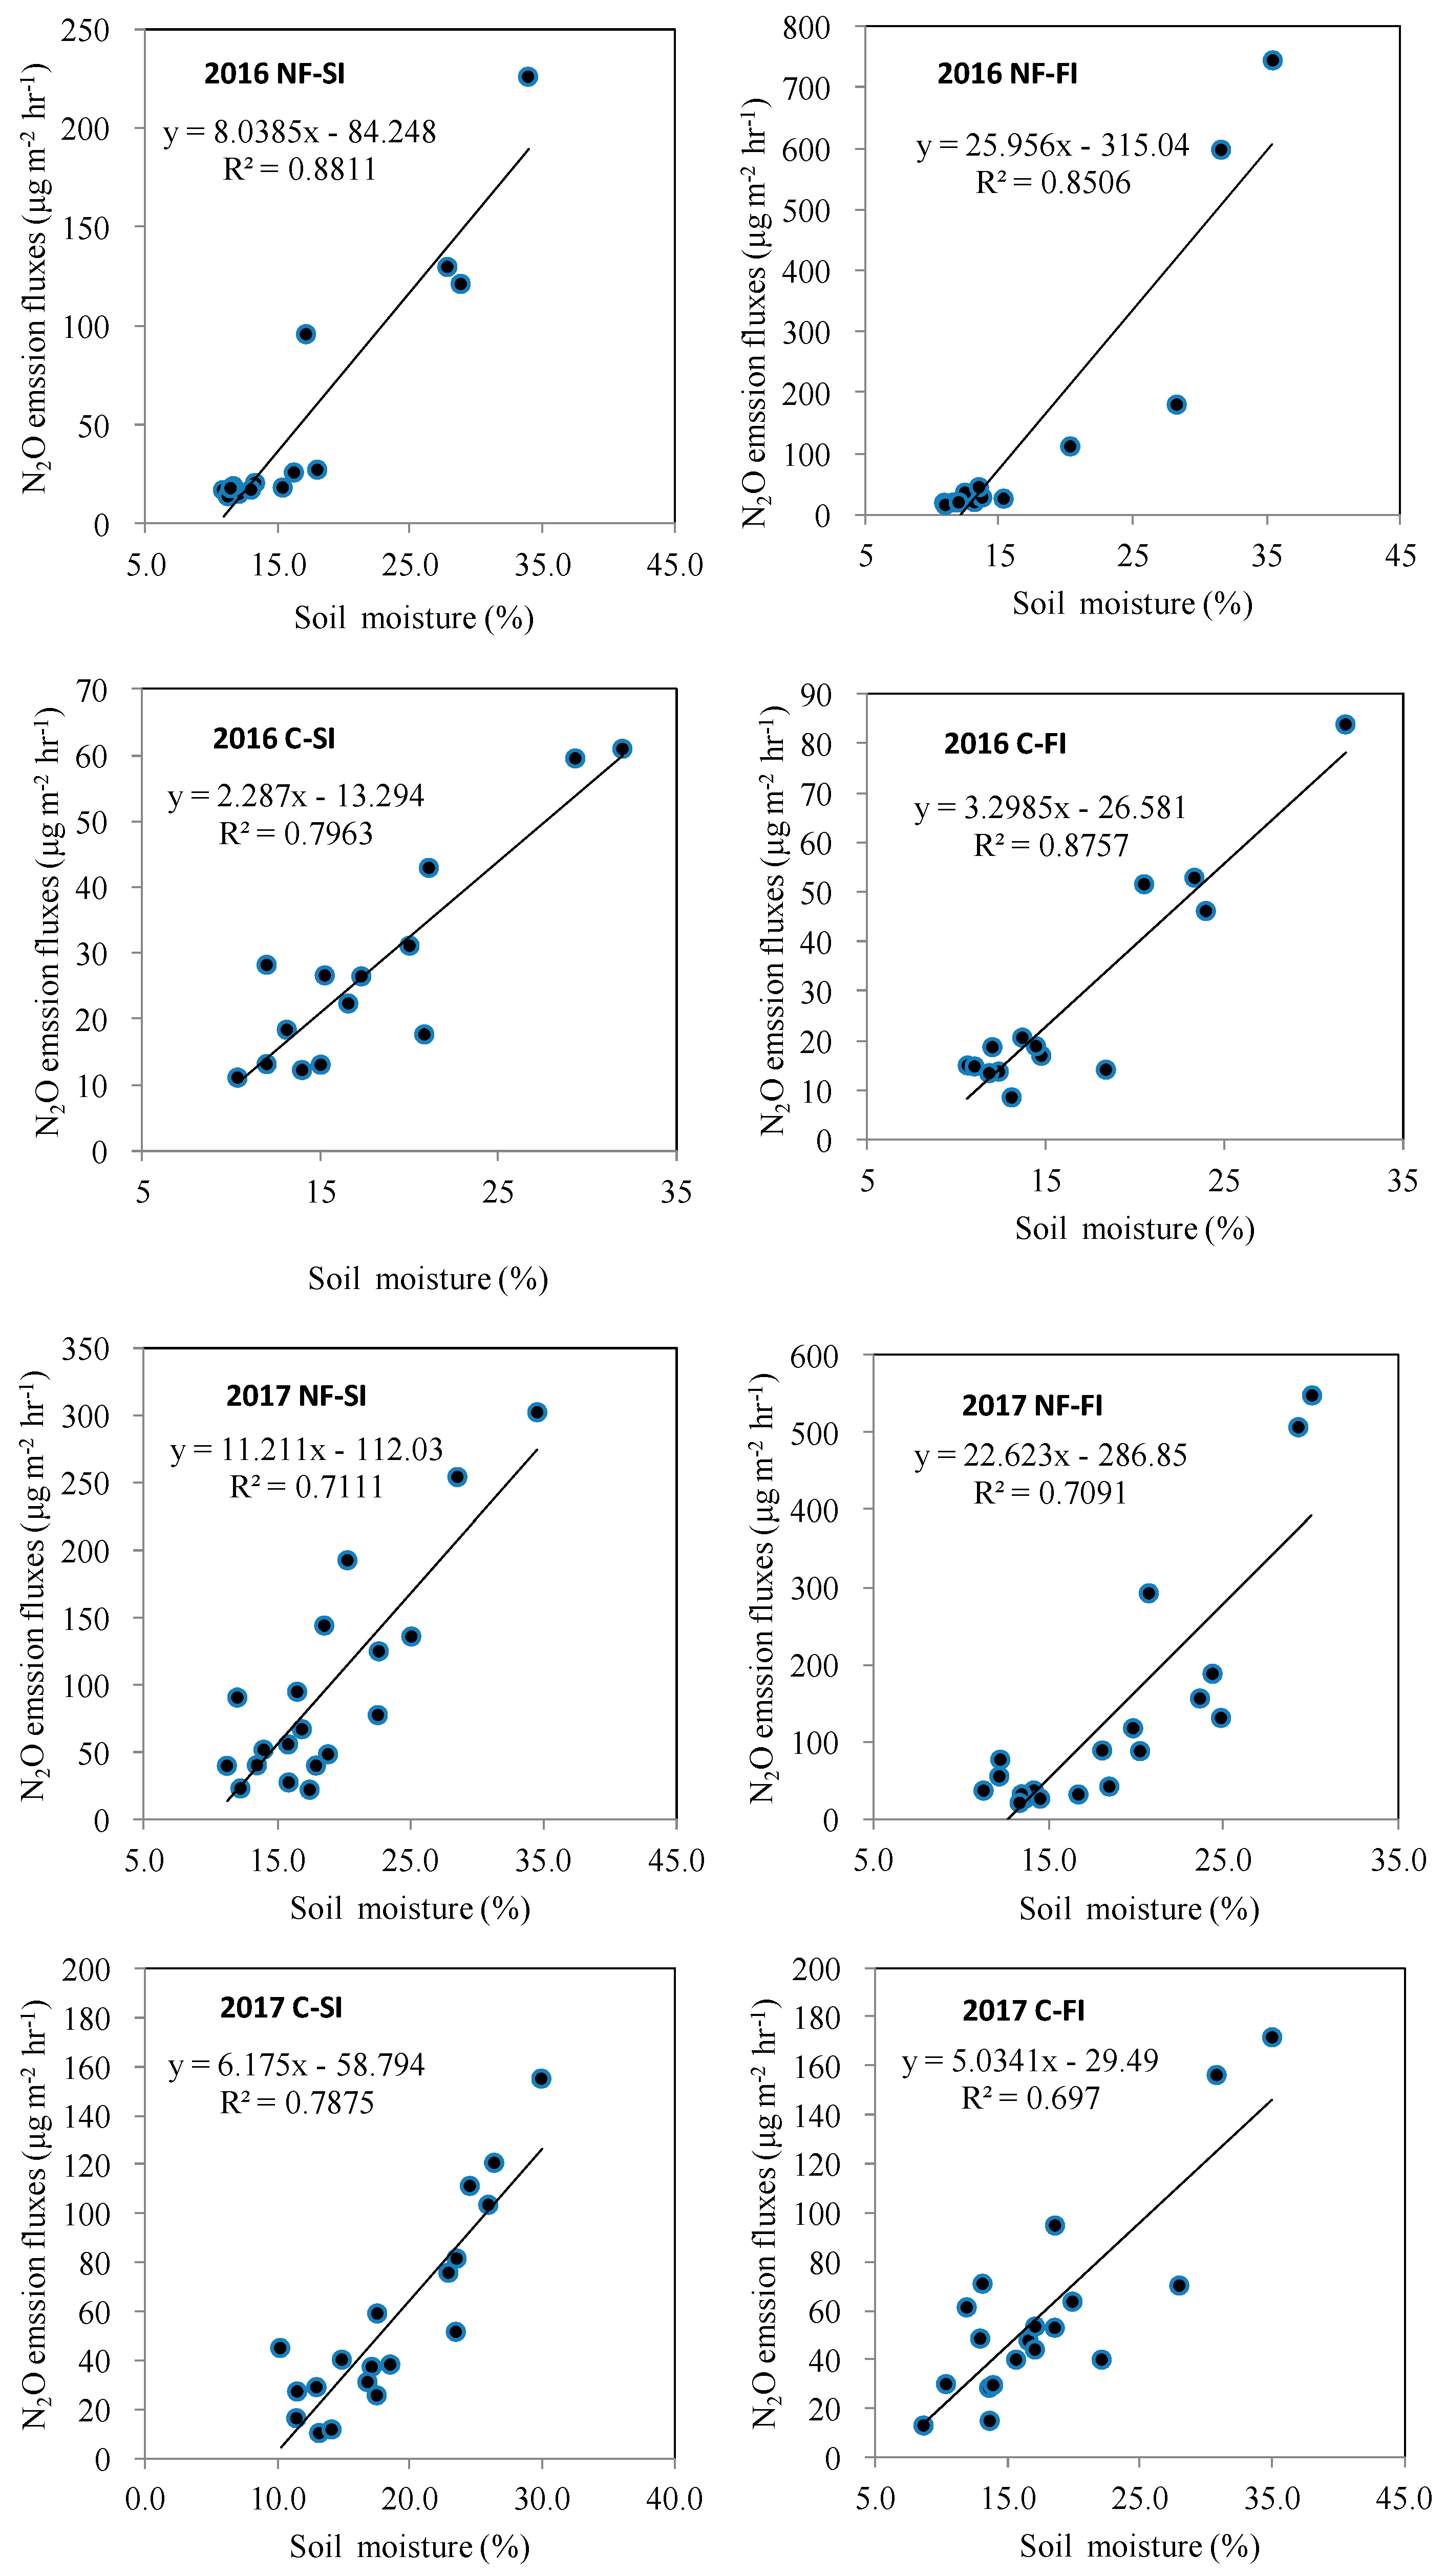
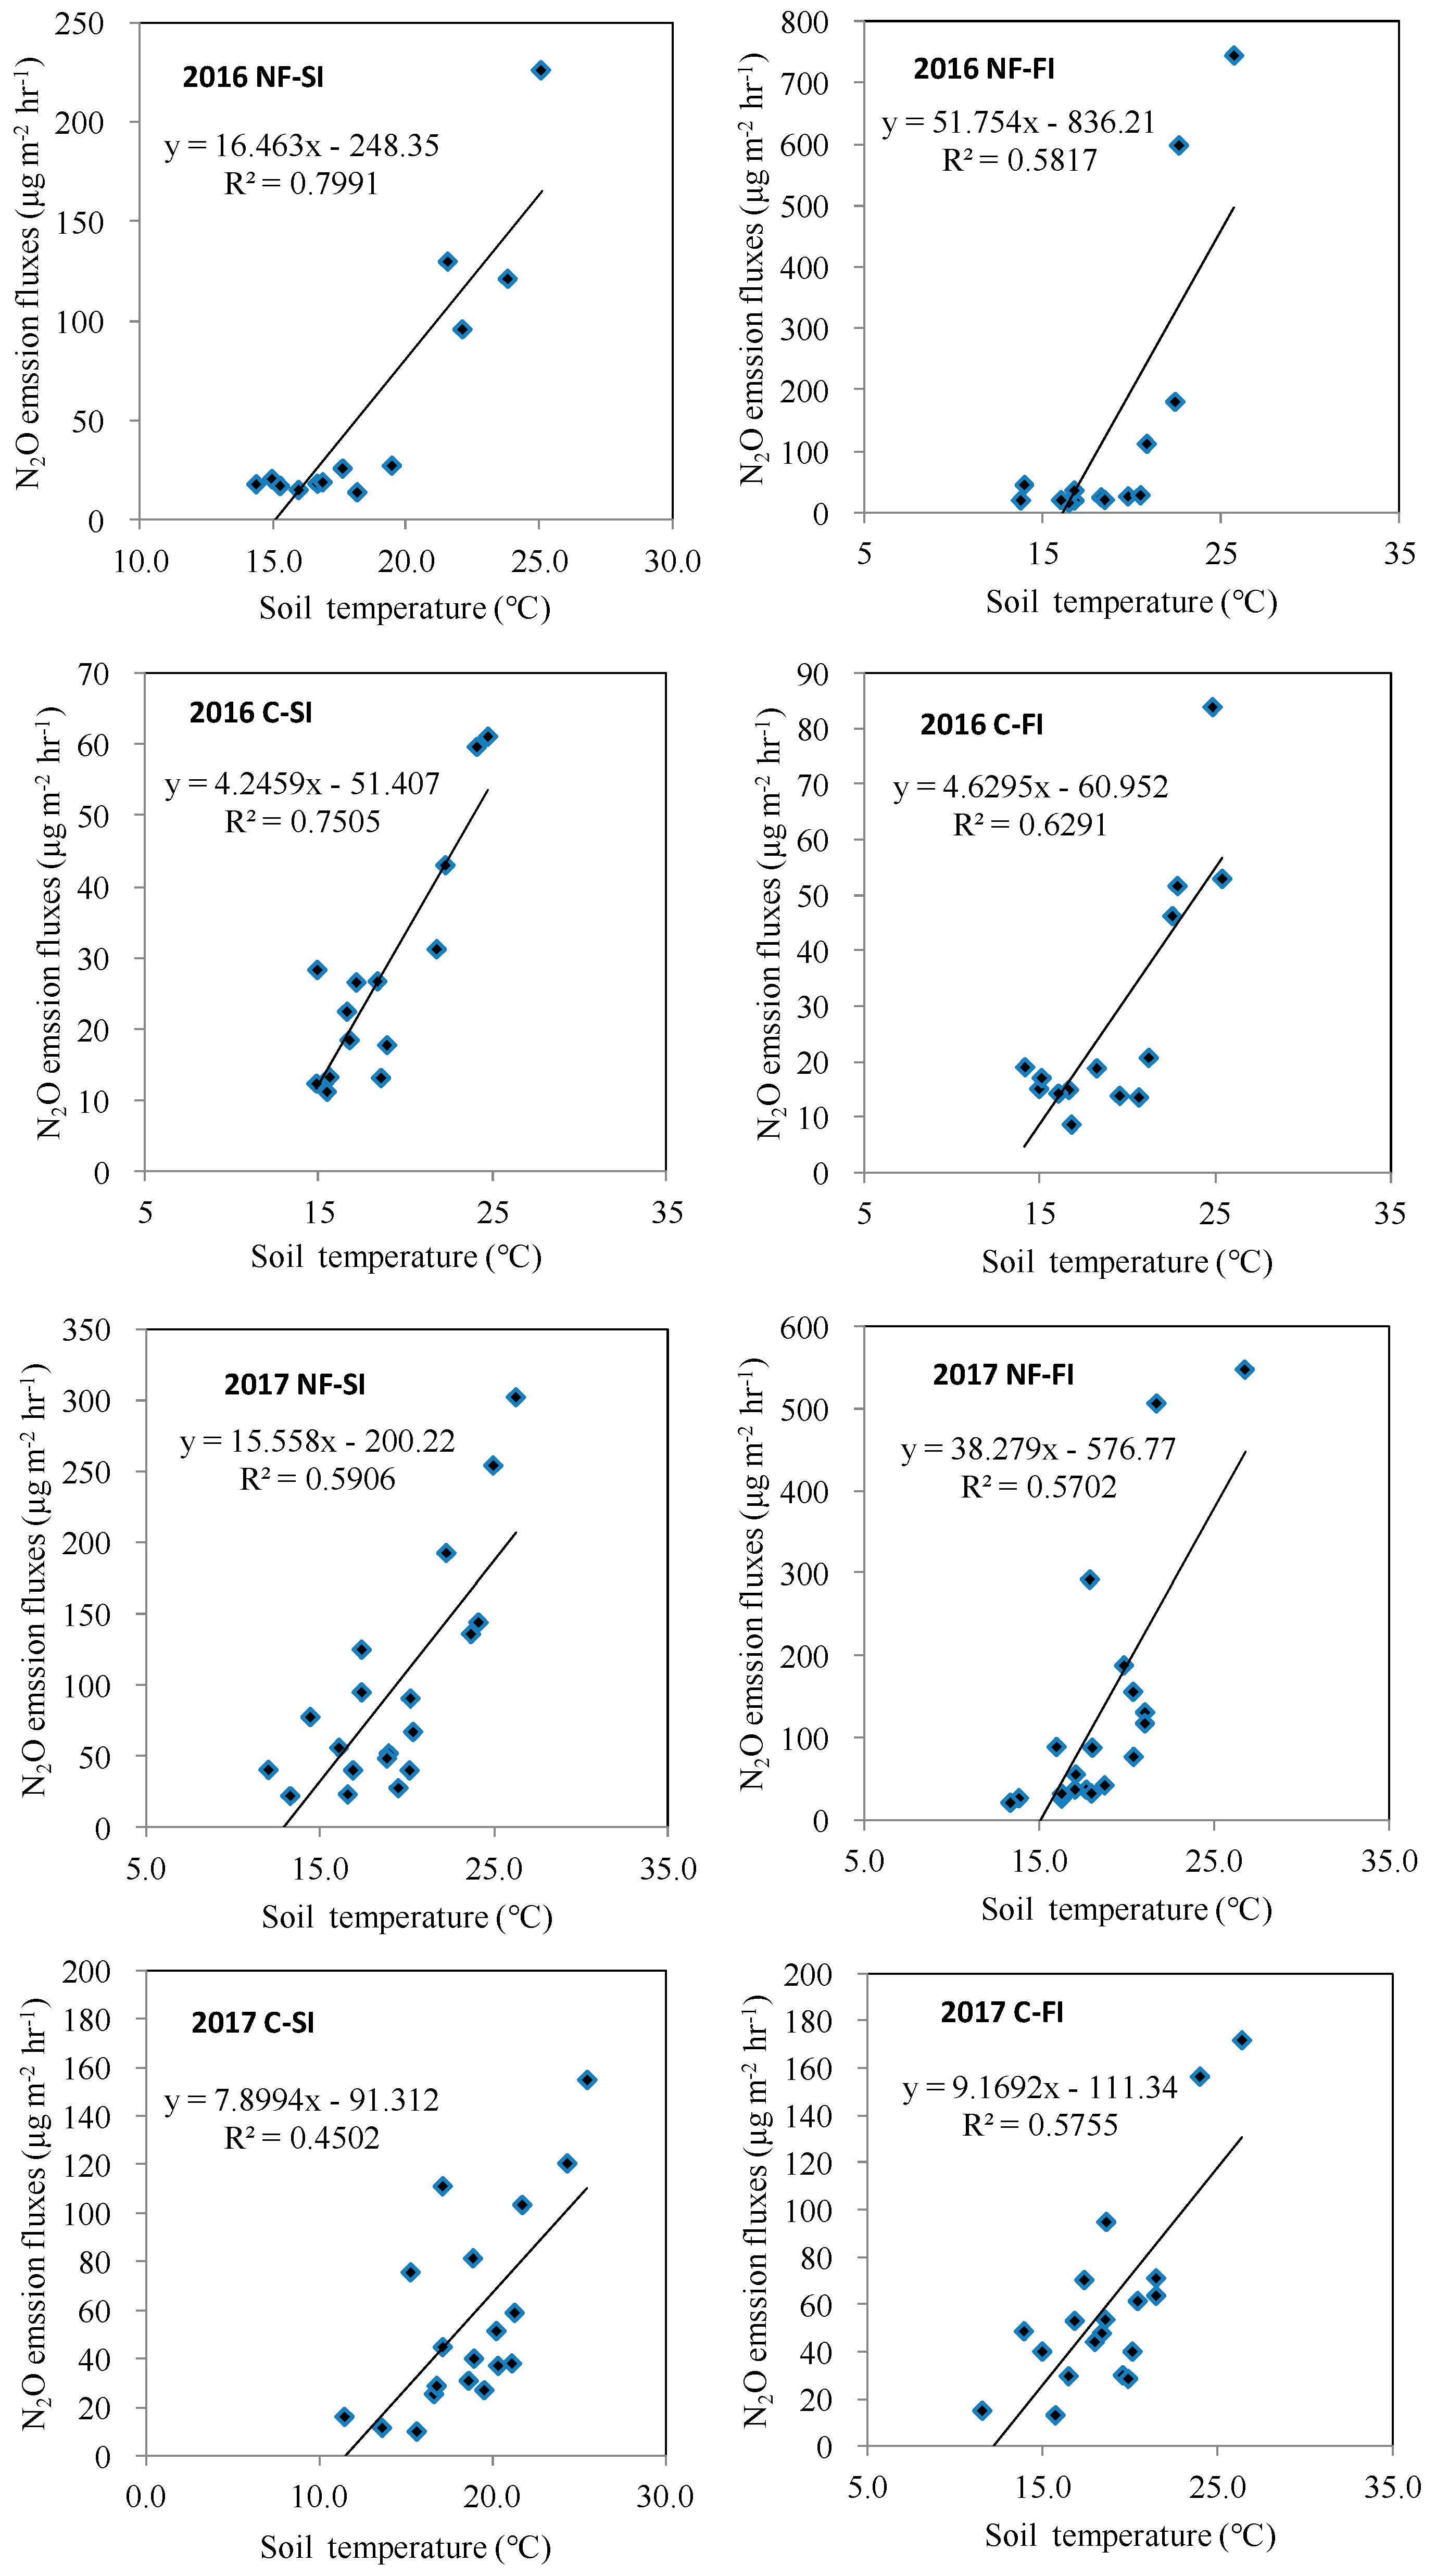
3.2. Relationship between Variations in N2O Emission Fluxes and Moisture or Temperature in Sprinkler-Irrigated and Flood-Irrigated Soils

The potato field under the four treatments from SI systems and FI systems exhibited a similar trend in N2O emission fluxes. A significant N2O emission peak was detected in July and August throughout the testing stage in both 2016 and 2017 (Figure 2). Both the chemical fertilizer applied and the irrigation methods used affected the N2O emission fluxes (Figure 2). Soil treated with SI and nitrogen fertilizer (NF-SI) exhibited the highest N2O emission fluxes in July 2017, which was 613.5 µg m−2 h−1. In the soil treated with FI and nitrogen fertilizer (NF-FI), the highest N2O emission fluxes, 1047.9 µg m−2 h−1, was also produced in July 2017. For the fertilization treatment and control under the FI system, the observed soil N2O fluxes were higher than those for soil subjected to SI in both crop growing seasons. The N2O emission fluxes of the fertilized soil were higher than those of the control soil for each irrigation system during the experimental period (Figure 2).
The trends of soil moisture and temperature were generally consistent with those of N2O emission fluxes from soils subjected to the two irrigation systems. In July and August of 2016 and 2017, the soil moisture and temperature and the N2O emission fluxes of the soils subjected to the two irrigation systems were higher than in May–June and in September of 2016 and 2017 (Figure 2). In 2016, during the irrigation period (from May to September), mean soil moisture remained at 45.9% and 44.5% in the FI fertilization (NF) and FI control (Control), respectively, and at 39.7% and 34.3% under the SI fertilization (NF) and SI control (Control), respectively. In 2017, the mean soil moisture remained at 26.1% and 26.6% under the NF-FI and C-FI systems, and at 24.6% and 23.3% under the NF-SI and C-SI systems (Figure 2). Mean soil moisture was generally higher in the NF-F and C-F soils than that in the NF-SI and C-SI soils. There was no significant difference between the two irrigation systems on the average daily soil temperature in the 0–30 cm soil layer in May to September of 2016 and 2017 (p > 0.05). There was no significant difference in soil temperature and moisture content between fertilized and unfertilized soil for each irrigation system (p > 0.05).

3.3. Soil Physicochemical Analysis for both Sprinkler and Flood Irrigation Systems

Values for the soil NO3-N and NH4+-N concentrations in the upper 10 cm layer for the same fertilizer treatment (NF) generally remained lower for the sprinkler-irrigated soil than the flood-irrigated soil. The soil bulk density under SI (1.17 g cm−3) was lower than that under FI (1.29 g cm−3) in both 2016 and 2017 (Table 3). Additionally, SI increased soil porosity and improved soil permeability when compared with FI (Table 3). The use of the NF treatment also had a significant impact on the results achieved. The concentrations of NH4+-N and NO3-N were significantly (p < 0.05) greater in the fertilization treatment than in the control for SI and FI, respectively.

3.4. Cumulative N2O Emissions, Emission Factor, and Emission Intensities under Both Irrigation Systems

A significant difference in the cumulative N2O emissions of soils using the two irrigation systems was measured during the potato growing season in 2016 (F = 13.84, p < 0.001) and 2017 (F = 6.49, p < 0.001). The soils under the C-SI (F = 47.0, p < 0.001), NF-SI (F = 7.8, p < 0.01), C-FI (F = 57.5, p < 0.001), and NF-FI (F = 3.0, p < 0.05) conditions showed significant differences in inter-annual cumulative N2O emissions. The cumulative N2O emissions were significantly higher for the NF-FI and C-FI conditions than for the NF-SI and C-SI conditions over the annual potato growing season. For each irrigation system, the cumulative N2O emissions of the fertilized soil were higher than those of the control soils. In 2016 and 2017, the cumulative N2O emissions were, respectively, 373.03 and 425.12 mg m−2 for the NF-FI soils and 150.40 and 252.01 mg m−2 for the NF-SI soil. The cumulative N2O emissions of NF-SI soil were 59.65% and 40.72% lower than those of NF-FI soil in 2016 and 2017, respectively. In 2016 and 2017, the cumulative N2O emissions of C-SI soil were, respectively, 74.5 and 180.8 mg m−2, which were 2.12% (2016) and 2.10% (2017) lower than the cumulative N2O emissions of C-FI soil in May–September during the annual potato field testing stage (Table 4). The cumulative N2O emissions varied significantly between irrigation systems throughout the potato experimental period. SI significantly reduced N2O emissions compared to FI.
The N2O emission factor (EF) denotes the percentage of applied fertilizer nitrogen lost in the form of N2O gas. The EF of nitrogen fertilizer has been widely used to estimate regional and global N2O emission inventories from farmland. In the present study, the EFs of soil subjected to FI and SI were, respectively, 0.76% and 0.20% in 2016 and 0.62% and 0.19% in 2017 (Table 4), i.e., the EF of soil subjected to SI was an average of 71.01% lower than that of soil subjected to FI. Thus, compared with FI, SI can significantly reduce EF. There was no significant difference in the inter-annual EF for FI or SI.
Emission intensity (EI) represents the annual N2O-N emission per ton of harvested product. Significant effects of treatments and reductions in emissions using SI compared to FI can be judged based on the EI reduction associated with the treatments. The sprinkler treatment increases potato yield to a greater degree than it reduces N2O emissions. The amount of harvested potato product was significantly higher for NF-SI in both years, which yielded 39.92 and 39.59 t ha−1 of harvested product in 2016 and 2017, respectively, compared to NF-F, which yielded 31.55 and 29.84 t ha−1 of harvested product in 2016 and 2017, respectively. The EIs of the NF-SI soil were 0.37 and 0.64 kg N t−1 year−1 in 2016 and 2017, respectively, which were 68.64% (2016) and 48.39% (2017) lower than those of the NF-F soil over the annual potato growing season (Table 4). Thus, SI can reduce the EI of N2O from farmland soil.
For each of the four treatments, means within a column followed by a different letter are significantly different at p < 0.05. The same letters within same column denote no significant difference among treatments (p < 0.05).

4. Discussion

4.1. Seasonal Variation of N2O Emissions for the Two Irrigation Systems

In July and August in 2016 and 2017, during the season of vigorous potato growth, the biggest N2O emission pulses were generated and there were higher N2O emission rates for both the SI and FI soil treatments. The seasonal dynamics of N2O emission fluxes were consistent with the changes in soil moisture and temperature, which were greater in July–August than in May–June and September–October (Figure 2) in both 2016 and 2017. Similar to our observations, a previous study found that the highest N2O emissions occurred during the beginning of the rainy season in California’s Central Valley for tomato cropping systems in soils from other arid and semi-arid regions [31]. The production and consumption of N2O from soils are affected by the processes of nitrification and denitrification, in which microorganisms participate. In turn, these processes are all related to soil temperature and moisture [32]. Soil moisture controls biotic and abiotic processes, and performs critical regulation functions in soil microbial activities. For instance, irrigation methods quantitatively influence N mineralization, nitrification, and denitrification [19]. Soil temperature and moisture, which are climatic and soil abiotic factors, can affect dynamic changes of N2O, with visible seasonal characteristics, in particular, in water transport.
A positive correlation between N2O fluxes, soil moisture, and soil temperature was obtained under the two irrigation systems (p < 0.001) (Figure 3 and Figure 4). Kang and Eltahir (2018) used the Massachusetts Institute of Technology (MIT) Regional Climate Model (MRCM) to perform simulations for the historical period 1975–2005, as well as for the future climate (2070–2100), assuming two scenarios of GHG emissions with FI, which cools surface temperature and moistens the surface air but boosts integrated measures of temperature and humidity and, hence, enhances the intensity of heatwaves [33]. Sprinkler irrigation is widely used in China to reduce these emissions. In a study of an oat field irrigated with solid-set SI in the coastal plains of southern Georgia, USA, Sharpe and Harper (1997) found that increased N2O emission fluxes were associated with increased soil water content due to irrigation [34]. In our study, the soil moisture and temperature were found to be lower for SI than for FI in 2016 and 2017. These results are consistent with those of Liu and Kang (2006). Additionally, the air temperature, air temperature gradient from 1 m to 2 m above the ground surface, and vapor pressure deficit (VPD) were significantly lower (p < 0.05) in the sprinkler-irrigated field than in the flood-irrigated field [35].

4.2. N2O Emission Fluxes in Fertilized and Control Soils with Sprinkler Irrigation and Flood Irrigation

The mean N2O emission fluxes for 2016 and 2017 for soil under fertilizer treatment were 152.02 μg m−2 h−1 for soil under FI and 36.53 μg m−2 h−1 for soil under SI. The change of irrigation style affects N2O emissions from farmland soil. The peak N2O emission under the NF treatment was four times higher under FI than that under SI. Compared with traditional FI, SI significantly reduced N2O emission from the potato field (Figure 2).
Different infiltration and redistribution patterns of irrigation water result in different distribution patterns of soil water in time and different horizontal and vertical water infiltration depth, which have an important impact on the production and emission of N2O and its spatial and temporal distribution. In this study, tension-meters controlled the SI. The irrigation was triggered when SMP at a depth of 0.2 m directly under the sprinklers reached −24.5 kPa, and the irrigation was stopped when the amount of water applied in each irrigation event was about 10 mm. The topsoil in sprinkler-irrigated fields was looser than that in flood-irrigated fields [36]. The NO3-N and NH4+-N that is not leached is concentrated in the potato root zone under SI. The uptake of NO3-N and NH4+-N under SI is beneficial to the potato due to the low amount of water. The results of our study are consistent with those of Wang et al. (2012) [37]. The essential differences between the soil concentrations of NO3-N and NH4+-N are due to the irrigation strategy. Sprinkler irrigation is one of the water-saving irrigation methods that is widely adopted in agricultural production. The environmental conditions of soils in SI are similar to those in DI [38] and favor nitrification, which contribute to lower emissions of N oxides [19]. The process of soil nitrogen conversion is different from that of N2O emission between SI and FI. Under DI, since the water supply is low, the process of soil N2O production from denitrification will be limited, and N2O emission will be reduced [20,31]. In this study, the irrigation strategy had an important impact on the pattern of N2O emissions. Sprinkler irrigation reduces the concentrations of NO3-N and NH4+-N, inhibits denitrification, and reduces N2O emissions.
In this study, the amount of water applied in FI was greater than the saturated hydraulic conductivity of the soil, with furrows remaining flooded for several hours. In FI, the high rate of water application led to the quick dissolution of the fertilizers and produced large amounts of NH4+-N in the surface layer of the soil profile. The NH4+-N from the NF in the wetting soil was rapidly nitrified, which increased the concentration of NO3-N. The rapid dissolution of a large amount of fertilizer would partly explain the significantly larger (p < 0.05) NO3-N and NH4+-N concentrations that were found in flood-irrigated soil compared to sprinkler-irrigated soil (Table 3). The amount and frequency of water application in the FI strategy led to the high soil moisture level in the plots, which, in turn, led to widespread anaerobic soil conditions. High soil moisture levels not only stimulate soil microbial activity, but also reduce the flow of oxygen into the soil, which leads to nitrification in more oxic conditions and denitrification in more anoxic conditions [19]. High concentrations of NO3-N and NH4+-N trigger higher N2O emissions during nitrification and denitrification. The use of FI has been shown to lead to higher N2O emissions than DI [19]. In our study, high NO3-N and NH4+-N contents in flood-irrigated soil resulted in high N2O emissions. Soil in flood-irrigated potato fields emits more N2O than that in sprinkler-irrigated potato fields.
In this study, soil N2O emissions were commonly higher under fertilization treatment than under the control for both SI and FI throughout the testing stage (Figure 2). In irrigated agriculture, both the availability of water and N fertilizer have essential effects on N2O emissions. In a previous study, higher concentrations of NH4+ and NO3 were detected in NF-treated soils compared with unfertilized soil [39]. Moreover, in another study, the effect of NH4+ and NO3 ions from nitrification and denitrification processes caused higher N2O emissions in soils treated with chemical fertilizer compared with unfertilized soils in DI and FI systems [19].

4.3. Potential of Mitigating N2O Emissions using the Two Irrigation Systems

In our study, the average cumulative N2O emissions were around 201.21 mg N2O-N m−2 under SI. A previous study found that the cumulative N2O emissions under the application of N, P, and K compound fertilizer and urea were lower than those reported for applications of swine effluent with 470.00 mg N2O-N m−2 to sprinkler-irrigated soil, and were equivalent to about 13% of the total applied N [34]. Another study found that, in a sprinkler-irrigated corn (Zea mays L.) field in Northeastern Spain, the cumulative growing-season N2O emissions ranged from 184.9 to 204.1 mg m−2 with the application of 300 kg N ha−1 of swine effluent [40]. The results of this study were similar to our observations.
Kuang et al. compared the effects of the application of conventional urea and animal manure on N2O emissions from flood-irrigated or drip-irrigated cotton grown in sandy soil in an arid region of Northwestern China. Their results showed that the application of manure increased the cumulative N2O emission (ƩN2O), the applied available N-scaled emission factor, and the yield-scaled emission intensity by 30–188% compared with the application of urea under both FI and DI methods [41]. In our study, the mean N2O emission factors from nitrogenous fertilizer for two growth periods (one in 2016 and one in 2017) in the potato field were found to be 0.20% and 0.69% under SI and FI, respectively. The emission factors ranged from 0.15% to 1.1% of added N fertilizer emitted as N2O-N with overhead SI, which is consistent with the results of other studies [42]. Studies such as Xu et al. (2016) have shown that, in arid areas, the N2O emission factor of nitrogen fertilizer is 0.50% to 0.82% during the growth period of summer maize and 0.61~1.13% in a vegetable field [43]. The N2O EF of the potato field under FI determined in our study is within the EF range determined by Xu et al. (2016) for an upland field. The N2O EF of the potato field under SI determined in our study is significantly lower than that determined by Xu et al. (2016) for the soils of the upland field, and is 61% lower than the lowest N2O EF (0.61%) for the vegetable field soil and 81% lower than the highest N2O EF (1.13%). The N2O EFs determined in our study were similar to those determined by Cayuela et al. (2017) for drip-irrigated soil. Drip irrigation systems have shown an N2O EF of only 0.18%, which shows the potential of irrigation technologies to mitigate N2O emissions in the Mediterranean region [44]. Sprinkler irrigation significantly reduces N2O emissions. The EI under the application of N, P, and K compound fertilizer and urea for SI determined in our study (0.51 kg t−1) is lower than that determined under urea application for DI by Guardia et al. (2017) (1.0 kg t−1) [18]. In the present study, SI increased potato yield to a greater degree than it reduced N2O emissions. Sprinkler irrigation reduced the cumulative N2O emissions and increased the N2O emission intensity of the potato crops. These results show that the more water-efficient irrigation method of SI provides benefits.
The choice of the irrigation system is regarded as a critical way of saving water and maintaining optimal crop yields in arid and semi-arid regions. This study has demonstrated the potential of SI as a tool for mitigating N2O emissions. Although our results indicate that the N2O emission pattern of SI contributed to lower emissions of N2O, many studies are needed to assess the effect of some parameters related to this technique. These parameters include soil characteristics, especially the hydraulic conductivity, which affects water distribution. Moreover, since SI is frequently combined with the application of chemical fertilizer, further work is needed to assess the influence of the frequency, rate, and type of N fertilizer application on N2O emissions under SI.

5. Conclusions

This study demonstrated that the choice of irrigation strategy had a significant effect on N2O emissions. Sprinkler irrigation saves water and also helps reduce the production of N2O. Therefore, it can be regarded as an effective method for mitigating N2O emissions from the soils of agro-ecosystems in arid and semi-arid areas. Nevertheless, more field studies are needed to assess the influence of new irrigation technologies on N2O emissions, and the comprehensive influence of using both water and N in agriculture.

Author Contributions

Project administration, Y.K. and Y.J. Writing—original draft preparation, W.Y. Formal analysis, P.G., H.W., and L.L. Data curation, W.Y.

Funding

The National Natural Science Foundation of China under grant number 41565009, the National Key Research and Development Program of China under grant number 2016YFC0400105, and the Inner Mongolia Youth Innovative Talent Training Program of the Prairie Excellence Project 2016 funded this research.

Acknowledgments

The authors are grateful to the Inner Mongolia Potato Engineering and Technology Research Center for authorizing the use of the scientific research field. We acknowledge Qinghua Sun for his efforts in installing the multiple sets of irrigation equipment and for his technical assistance, and we acknowledge Shuqi Wan and Xiaobin Li for their constructive comments and suggestions.

Conflicts of Interest

The authors declare no conflict of interest.

References

  1. Schilt, A.; Brook, E.J.; Bauska, T.K.; Baggenstos, D.; Fischer, H.; Joos, F.; Petrenko, V.V.; Schaefer, H.; Schmitt, J.; Severinghaus, J.P.; et al. Isotopic constraints on marine and terrestrial N2O emissions during the last deglaciation. Nature 2014, 516, 234–237. [Google Scholar] [CrossRef] [PubMed]
  2. IPCC. Contribution of Working Group I to the Fifth Assessment Report of the Intergovernmental Panel on Climate Change. In Climate Change 2013: The Physical Science Basis; Stocker, T.F., Qin, D., Plattner, G.K., Tignor, M., Allen, S.K., Boschung, J., Nauels, A., Xia, Y., Bex, V., Midgley, P.M., Eds.; Cambridge University Press: Cambridge, UK; New York, NY, USA, 2013. [Google Scholar]
  3. Robertson, G.P.; Paul, E.A.; Harwood, R.R. Greenhouse gases in intensive agriculture: Contributions of individual gases to the radiative forcing of the atmosphere. Science 2000, 289, 1922–1925. [Google Scholar] [CrossRef]
  4. Xie, B.; Gu, J.; Yu, J.; Han, G.; Zheng, X.; Xu, Y.; Lin, H. Effects of N fertilizer application on soil N2O emissions and CH4 uptake: A two-year study in an apple orchard in Eastern China. Atmosphere 2017, 8, 181. [Google Scholar] [CrossRef]
  5. Liu, H.J.; Kang, Y.H.; Yao, S.M.; Sun, Z.Q.; Liu, S.P.; Wang, Q.G. Field evaluation on water productivity of winter wheat under sprinkler or surface irrigation in the North China Plain. Irrig. Drain. 2013, 62, 37–49. [Google Scholar] [CrossRef]
  6. Naghedifar, S.M.; Ziaei, A.N.; Ansari, H. Simulation of irrigation return flow from a Triticale farm under sprinkler and furrow irrigation systems using experimental data: A case study in arid region. Agric. Water Manag. 2018, 210, 185–197. [Google Scholar] [CrossRef]
  7. Sanz-Cobena, A.; Lassaletta, L.; Aguilera, E.; del Prado, A.; Garnier, J.; Billen, G.; Iglesias, A.; Sánchez, B.; Guardia, G.; Abalos, D.; et al. Strategies for greenhouse gas emissions mitigation in Mediterranean agriculture: A review. Agric. Ecosyst. Environ. 2017, 238, 5–24. [Google Scholar] [CrossRef]
  8. Qi, L.; Niu, H.D.; Zhou, P.; Jia, R.J.; Gao, M. Effects of Biochar on the net greenhouse gas emissions under continuous flooding and water-saving irrigation conditions in paddy soils. Sustainability 2018, 10, 1403. [Google Scholar] [CrossRef]
  9. Ezequiel, S.; Antonio, P.D.C.; Tarlei, A.B.; José, A.F.; Richard, K.; Bruno, M. Test methods for characterising the water distribution from irrigation sprinklers: Design, evaluation and uncertainty analysis of an automated system. Biosyst. Eng. 2018, 169, 42–56. [Google Scholar]
  10. Lorenzo, D.M.; Martina, M.; Alex, C.B.; Tiago, A.K.; Cleber, M.A. Classification of rice grains of lowland cultivars grown under flood irrigation and sprinkler irrigation. Eng. Agric. 2018, 38, 599–605. [Google Scholar]
  11. José, C.; Eva, T.M.; Francisco, M. Sprinkler Irrigation Frequency Affects Maize Yield Depending on Irrigation Time. Agron. J. 2018, 110, 1862–1873. [Google Scholar]
  12. Zapata, N.; Robles, O.; Playán, E.; Paniagua, P.; Romano, C.; Salvadorb, R.; Montoya, F. Low-pressure sprinkler irrigation in maize: Differences in water distribution above and below the crop canopy. Agric. Water Manag. 2018, 203, 353–365. [Google Scholar] [CrossRef]
  13. Laura, S.M.; Augusto, A.; Alejandro, B.; Lourdes, G.T.; Antonio, V. Influence of drip and furrow irrigation systems on nitrogen oxide emissions from a horticultural crop. Soil Biol. Biochem. 2008, 40, 1698–1706. [Google Scholar]
  14. Li, J.; Zhang, J.; Ren, L. Water and nitrogen distribution as affected by fertigation of ammonium nitrate from a point source. Irrig. Sci. 2003, 22, 19–30. [Google Scholar]
  15. Vázquez, N.; Pardo, A.; Suso, M.L.; Quemada, M. A methodology for measuring drainage and nitrate leaching in unevenly irrigated vegetable crops. Plant Soil 2005, 269, 297–308. [Google Scholar] [CrossRef]
  16. Davidson, E.A. Fluxes of nitrous oxide and nitric oxide from terrestrial ecosystems. In Microbial Production and Consumption of Greenhouse Gases: Methane, Nitrous Oxides and Halomethanes; Rogers, J.E., Whitman, W.B., Eds.; American Society for Microbiology: Washington, DC, USA, 1991; pp. 219–235. [Google Scholar]
  17. Granli, T.; Bockman, O.C. Nitrogen oxide from agriculture. Norw. J. Agric. Sci. 1994, 12, 7–127. [Google Scholar]
  18. Guardia, G.; Cangani, M.T.; Andreu, G.; Sanz-Cobena, A.; García-Marco, S.; Álvarez, J.M.; Recio-Huetos, J.; Vallejo, A. Effect of inhibitors and fertigation strategies on GHG emissions, NO fluxes and yield in irrigated maize. Field Crop. Res. 2017, 204, 135–145. [Google Scholar] [CrossRef]
  19. Sánchez-Martín, L.; Vallejo, A.; Dick, J.; Skiba, U.M. The influence of soluble carbon and fertilizer nitrogen on nitric oxide and nitrous oxide emissions from two contrasting agricultural soils. Soil Biol. Biochem. 2008, 40, 142–151. [Google Scholar] [CrossRef]
  20. Sánchez-Martin, L.; Meijide, A.; Garcia-Torres, L.; Vallejo, A. Combination of drip irrigation and organic fertilizer for mitigating emissions of nitrogen oxides in semi-arid climate. Agric. Ecosyst. Environ. 2010, 137, 99–107. [Google Scholar] [CrossRef]
  21. Guardia, G.; Tellez-Rio, A.; García-Marco, S.; Martin-Lammerding, D.; Tenorio, J.L.; Ibáñez, M.Á.; Vallejo, A. Effect of tillage and crop (cereal versus legume) on greenhouse gas emissions and Global Warming Potential in a non-irrigated Mediterranean field. Agric. Ecosyst. Environ. 2016, 221, 187–197. [Google Scholar] [CrossRef]
  22. Fentabil, M.M.; Nichol, C.F.; Neilsen, G.H.; Hannam, K.D.; Neilsen, D.; Forge, T.A.; Jones, M.D. Effect of micro-irrigation type, N-source and mulching on nitrous oxide emissions in a semi-arid climate: An assessment across two years in a Merlot grape vineyard. Agric. Water Manag. 2016, 171, 49–62. [Google Scholar] [CrossRef]
  23. David, C.; Lemke, R.; Helgason, W.; Farrell, R.E. Current inventory approach overestimates the effect of irrigated crop management on soil-derived greenhouse gas emissions in the semi-arid Canadian Prairies. Agric. Water Manag. 2018, 208, 19–32. [Google Scholar] [CrossRef]
  24. Diego, A.; Alberto, S.C.; Gemma, A.; Antonio, V. Rainfall amount and distribution regulate DMPP effects on nitrous oxide emissions under semi-arid Mediterranean conditions. Agric. Ecosyst. Environ. 2017, 238, 36–45. [Google Scholar]
  25. Soil Survey Staff. Keys to Soil Taxonomy, 6th ed.; USDA: Washington, DC, USA, 1992.
  26. Yang, W.Z.; Yang, M.D.; Wen, H.Y.; Jiao, Y. Global Warming Potential of CH4 uptake and N2O emissions in saline–alkaline soils. Atmos. Environ. 2018, 191, 172–180. [Google Scholar] [CrossRef]
  27. Jiao, Y.; Hou, J.H.; Zhao, J.H.; Yang, W.Z. Cropland age from grassland conversion to cropland affects nitrous oxide emission. Acta Agric. Scand. 2015, 65, 566–574. [Google Scholar] [CrossRef]
  28. Aulakh, M.S.; Khera, T.S.; Doran, J.W. Yields and Nitrogen Dynamics in a Rice–Wheat System Using Green Manure and Inorganic Fertilizer. Soil Sci. Soc. Am. J. 2000, 64, 1867–1876. [Google Scholar] [CrossRef]
  29. Lim, S.S.; Choi, W.J. Changes in microbial biomass, CH4 and CO2 emissions, and soil carbon content by fly ash co-applied with organic inputs with contrasting substrate quality under changing water regimes. Soil Biol. Biochem. 2014, 68, 494–502. [Google Scholar] [CrossRef]
  30. Adviento-Borbe, M.A.A.; Linquist, B. Assessing fertilizer N placement on CH4 and N2O emissions in irrigated rice systems. Geoderma 2016, 266, 40–45. [Google Scholar] [CrossRef]
  31. Kallenbach, C.M.; Rolston, D.E.; Horwath, W.R. Cover cropping affects soil N2O and CO2 emissions differently depending on type of irrigation. Agric. Ecosyst. Environ. 2010, 137, 251–260. [Google Scholar] [CrossRef]
  32. Firestone, M.K.; Davidson, E.A. Microbial basin of NO and N2O production and consumption in soil. In Exchange of Trace Gases Between Terrestrial Ecosystem and the Atmosphere; Andreae, M.O., Schimel, D.S., Eds.; Wiley: London, UK, 1989; pp. 7–21. [Google Scholar]
  33. Kang, S.C.; Eltahir, E.A.B. North China Plain threatened by deadly heatwaves due to climate change and irrigation. Nat. Commun. 2018, 9, 2894. [Google Scholar] [CrossRef]
  34. Sharpe, R.R.; Harper, L.A. Ammonia and nitrous oxide emissions from sprinkler irrigation applications of swine effluent. J. Environ. Qual. 1997, 26, 1703–1706. [Google Scholar] [CrossRef]
  35. Liu, H.J.; Kang, Y.H. Effect of sprinkler irrigation on microclimate in the winter wheat field in the North China Plain. Agric. Water Manag. 2006, 84, 3–19. [Google Scholar] [CrossRef]
  36. Sun, Z.Q.; Kang, Y.H.; Jiang, S.F. Effects of water application intensity, drop size and water application amount on the characteristics of topsoil pores under sprinkler irrigation. Agric. Water Manag. 2008, 95, 869–876. [Google Scholar] [CrossRef]
  37. Wang, X.J.; Wei, C.Z.; Zhang, J.; Dong, P.; Wang, J.; Zhu, Q.C.; Wang, J.X. Effects of irrigation mode and N application rate on cotton field fertilizer N use efficiency and N losses. Chin. J. Appl. Ecol. 2012, 23, 2751–2758. [Google Scholar]
  38. Lv, G.H.; Kang, Y.H.; Li, L.; Wan, S.Q. Effect of irrigation methods on root development and profile soil water uptake in winter wheat. Irrig. Sci. 2010, 28, 387–398. [Google Scholar] [CrossRef]
  39. Vallejo, A.; García-Torres, L.; Diez, J.A.; Arce, A.; López-Fernández, S. Comparison of N losses (NO3, N2O, NO) from surface applied, injected or amended (DCD) pig slurry of an irrigated soil in a Mediterranean climate. Plant Soil 2005. 272, 313–325.
  40. Álvaro-Fuentes, J.; Arrúe, J.L.; Cantero-Martínez, C.; Isla, R.; Plaza-Bonilla, D.; Quílez, D. Fertilization scenarios in Sprinkler-Irrigated corn under Mediterranean Conditions: Effects on Greenhouse Gas Emissions. Soil Sci. Soc. Am. J. 2016, 80, 662–671. [Google Scholar] [CrossRef]
  41. Kuang, W.N.; Gao, X.P.; Gui, D.W.; Tenuta, M.; Flaten, D.N.; Yin, M.Y.; Zeng, F.J. Effects of fertilizer and irrigation management on nitrous oxide emission from cotton fields in an extremely arid region of northwestern China. Field Crop. Res. 2018, 229, 17–26. [Google Scholar] [CrossRef]
  42. Bronson, K.F.; Hunsaker, D.J.; Williams, C.F.; Thorp, K.R.; Rockholt, S.M.; Del Grosso, S.J.; Venterea, R.T.; Barnes, E.M. Nitrogen management affects nitrous oxide emissions under varying cotton irrigation systems in the desert southwest, USA. J. Environ. Qual. 2018, 47, 70–78. [Google Scholar] [CrossRef]
  43. Xu, Y.X.; Guo, L.P.; Xie, L.Y.; Yun, A.P.; Li, Y.C.; Zhang, X.; Zhao, X.; Diao, T.T. Characteristics of background emissions and emission factors of N2O from major upland fields in China. Sci. Agric. Sin. 2016, 49, 1729–1743. [Google Scholar]
  44. Cayuela, M.L.; Aguilera, E.; Sanz-Cobena, A.; Adams, D.C.; Abalos, D.; Barton, L.; Ryals, R.; Silver, W.L.; Alfaro, M.A.; Pappa, V.A.; et al. Direct nitrous oxide emissions in Mediterranean climate cropping systems: Emission factors based on a metaanalysis of available measurement data. Agric. Ecosyst. Environ. 2017, 238, 25–35. [Google Scholar] [CrossRef]
Figure 1. Temperature and precipitation measured at the potato experimental farm in 2016 and 2017. The rainfall values are the sum of daily rainfall. Air temperature is a daily average throughout the crop growing season.
Atmosphere 10 00242 g001
Figure 2. Relationship between the variation in N2O emission fluxes and the soil moisture or soil temperature in subplots (a), (b): Control (C) and nitrogen fertilizer (NF) under flood irrigation (FI) and sprinkler irrigation (SI) in 2016. (c), (d): Control and NF from FI and SI in 2017. Vertical bars indicate the mean and standard error. The y-axes in graphs (ad) are on different scales.
Atmosphere 10 00242 g002aAtmosphere 10 00242 g002b
Figure 3. Correlation analysis between soil moisture and N2O emission flux under NF-SI, NF-FI, C-SI, and C-FI conditions in 2016 and 2017.
Atmosphere 10 00242 g003
Figure 4. Correlation analysis between soil temperature and N2O emission fluxes under NF-SI, NF-FI, C-SI, and C-FI conditions in 2016 and 2017.
Atmosphere 10 00242 g004
Table 1. Selected soil properties and the particle size distribution of the soil in the experimental field.
Soil TextureSoil Depth (cm)Clay (%)Silt (%)Sand (%)CaCO3 (g kg−1)
sandy clay loam0-3032% ± 0.3 120 ± 0.248 ± 0.48.54 ± 1.5
1 Means ± standard errors (n = 3).
Table 2. Physicochemical properties of the soil before the experiment for treatments from two irrigation systems.
Treatments 1pHBulk Density (g cm−3)Porosity (%)Organic Carbon (g kg−1)NH4+-N (mg kg−1)NO3-N (mg kg−1)
NF-SI 8.31 ± 0.021.24 ± 0.0749.86 ± 2.403.43 ± 0.364.40 ± 1.1725.68 ± 4.25
C-SI8.29 ± 0.051.24 ± 0.0349.31 ± 0.323.82 ± 0.414.56 ± 1.0925.89 ± 1.53
NF-FI8.31 ± 0.031.27 ± 0.0249.17 ± 0.833.41 ± 0.384.62 ± 1.1725.73 ± 7.76
C-FI8.32 ± 0.021.26 ± 0.0150.06 ± 0.783.38 ± 0.294.73 ± 1.6724.95 ± 1.58
1 NF-SI and NF-FI refer to the treatment of sprinkler irrigation and flood irrigation, respectively, with nitrogen fertilizer. C-SI and C-FI refer to the treatment of a control without any fertilizer with sprinkler irrigation and flood irrigation, respectively. No significant difference (p < 0.05) was found among treatments for any of the variables shown.
Table 3. Basic physical and chemical properties of soil under the two irrigation systems and for different fertilization treatments in 2016 and 2017.
YearTreatmentsBulk Density (g cm−3)Porosity (%)NH4+-N Content (mg kg−1)NO3-N Content (mg kg−1)
2016NF-FI
NF-SI
C-FI
C-SI
1.34 ± 0.07 (a)
1.21 ± 0.03 (b)
1.35 ± 0.05 (a)
1.19 ± 0.01 (b)
48.13 ± 1.40 (a)
49.86 ± 0.53 (b)
49.23 ± 0.62 (c)
52.58 ± 0.75 (d)
7.09 ± 1.10 (a)
6.46 ± 1.00 (b)
6.64 ± 1.22 (c)
6.08 ± 1.43 (d)
34.28 ± 1.25 (a)
22.98 ± 1.60 (b)
21.76 ± 1.21 (c)
16.64 ± 1.36 (e)
2017NF-FI
NF-SI
C-FI
C-SI
1.29 ± 0.02 (c)
1.17 ± 0.02 (b)
1.29 ± 0.01 (c)
1.21 ± 0.01 (b)
50.42 ± 2.30 (e)
55.15 ± 1.80 (f)
50.09 ± 1.20 (c)
53.17 ± 0.38 (d)
6.95 ± 1.35 (e)
6.25 ± 1.06 (f)
6.76 ± 1.40 (b)
6.21 ± 1.20 (d)
73.66 ± 2.21 (f)
37.76 ± 1.13 (g)
34.41 ± 2.05 (h)
30.47 ± 1.97 (i)
Note: NH4+-N and NO3N are seasonal means. Bulk density and porosity are the values at the end of the growing season. For each treatment factor, means within a column followed by a different letter are significantly different at p < 0.05.
Table 4. Harvested product of potato, cumulative soil N2O emissions, soil N2O emission factor (EF), and soil N2O emission intensity (EI) in 2016 and 2017.
YearTreatmentsAmount of Harvested Product (t ha−1)Cumulative N2O Emissions (mg m−2)EF 1 (%)EI 2 (kg N t−1 Year−1)
2016NF-FI
NF-SI
C-FI
C-SI
31.55 ± 4.81 (a)
39.92 ± 0.56 (b)
22.78 ± 1.62 (c)
26.11 ± 3.50 (c)
373.03 ± 17.82 (a)
150.40 ± 20.01 (b)
76.12 ± 17.82 (c)
74.51 ± 11.31 (c)
0.76 (a)
0.20 (b)
1.18 ± 0.70 (a)
0.37 ± 0.09 (b)
0.33 ± 0.12 (b)
0.29 ± 0.09 (b)
2017NF-FI
NF-SI
C-FI
C-SI
29.84 ± 2.28 (a)
39.59 ± 0.86 (b)
22.43 ± 2.37 (c)
25.39 ± 2.95 (c)
425.12 ± 31 (d)
252.01 ± 40 (e)
180.84 ± 35 (f)
177.05 ± 33 (f)
0.62 (a)
0.19 (b)
1.24 ± 0.65 (a)
0.64 ± 0.18 (d)
0.81 ± 0.20 (e)
0.70 ± 0.19 (d)
1 Emission factor of N2O. 2 Annual N2O-N emission per ton of harvested product.

