Article

The Intraseasonal and Interannual Variability of Arctic Temperature and Specific Humidity Inversions

1
SOA Key Laboratory for Polar Science, Polar Research Institute of China, Shanghai 200136, China
2
Guangdong Province Key Laboratory for Climate Change and Natural Disaster Studies, School of Atmospheric Sciences, Sun Yat-sen University, Zhuhai 519082, China
3
Southern Marine Science and Engineering Guangdong Laboratory, Zhuhai 519082, China
4
National Marine Environmental Forecasting Center, Beijing 100081, China
5
Department of Atmospheric Sciences, University of Arizona, Tucson, AZ 85721, USA
6
National Center for Atmospheric Research, Boulder, CO 80305, USA
*
Author to whom correspondence should be addressed.
Atmosphere 2019, 10(4), 214; https://doi.org/10.3390/atmos10040214
Submission received: 1 April 2019 / Revised: 12 April 2019 / Accepted: 19 April 2019 / Published: 22 April 2019

Abstract

:
Temperature and humidity inversions are common in the Arctic’s lower troposphere, and are a crucial component of the Arctic’s climate system. In this study, we quantify the intraseasonal oscillation of Arctic temperature and specific humidity inversions and investigate its interannual variability using data from the Surface Heat Balance of the Arctic (SHEBA) experiment from October 1997 to September 1998 and the European Centre for Medium-Range Forecasts (ECMWF) Reanalysis (ERA)-interim for the 1979–2017 period. In January 1998, there were two noticeable elevated inversions and one surface inversion. The transitions between elevated and surface-based inversions were associated with the intraseasonal variability of the temperature and humidity differences between 850 and 950 hPa. The self-organizing map (SOM) technique is utilized to obtain the main modes of surface and elevated temperature and humidity inversions on intraseasonal time scales. Low (high) pressure and more (less) cloud cover are related to elevated (surface) temperature and humidity inversions. The frequency of strong (weak) elevated inversions over the eastern hemisphere has decreased (increased) in the past three decades. The wintertime Arctic Oscillation (AO) and Arctic Dipole (AD) during their positive phases have a significant effect on the occurrence of surface and elevated inversions for two Nodes only.

1. Introduction

Temperature inversions in the lower troposphere occur frequently in the Arctic, especially in winter [1]. The recent increasing trends in lower tropospheric temperature can influence features of the Arctic inversions [2], which in turn modulate the surface energy balance and the amplified Arctic response to increased greenhouse gas concentrations [3,4]. The strength of the Arctic inversions also influences ozone and other pollutants’ concentrations [5,6,7] in the Arctic troposphere. In addition, there is a strong interaction between Arctic clouds and the vertical temperature structure in the troposphere [8,9,10,11]. Thus, temperature inversions play a key role in the Arctic climate system.
There are two types of Arctic temperature inversions: surface-based and elevated inversions [12]. The former is usually related to negative surface net radiation; the latter results either from buoyant overturning related to cloud formation and cloud-top radiative cooling or from warm air advection [10,13]. Surface-based inversions occur during clear-sky anticyclonic circulations, whereas elevated inversions occur during cloudy cyclonic conditions [12]. Each type has seasonally dependent variations in frequency and inversion-base height, thickness, and strength [14].
Long-term sounding data in Alaska for the 1957–2008 period revealed interannual and multi-decadal variability of temperature inversions [15]. Observations from the Surface Heat Balance of the Arctic (SHEBA) field experiment (Uttal et al. [16]) provided a detailed description of the Arctic inversions [1]. Using the European Centre for Medium-Range Forecasts (ECMWF) 40-year reanalysis (ERA-40), Wetzel and Brümmer [17] investigated the spatial distribution of Arctic inversion features, such as the frequency of occurrence, height, depth, and strength, on various timescales ranging from the annual cycle to long-term trends. Some satellite data have also been utilized to examine the frequency and strength of temperature inversions in the Arctic [18,19,20,21,22].
Specific humidity inversions have also been observed over the Arctic Ocean [9,23,24] and on the archipelago of Svalbard [25,26]. Devasthale et al. [27] documented a clear-sky climatology of Arctic humidity inversions based on Atmospheric Infrared Sounder (AIRS) profiles. Based on data from the Integrated Global Radiosonde Archive (IGRA) from 36 Arctic stations, Nygård et al. [28] investigated the climatology and characteristics of Arctic humidity inversions. To circumvent the problem of sparse stations, Brunke et al. [29] examined the climatology of Arctic humidity inversions using a variety of reanalysis datasets.
While previous studies concentrated on the frequency of occurrence, height, thickness, and strength of the Arctic temperature and humidity inversions and their interannual variability and trends, very few studies focused on the intraseasonal variability of Arctic temperature and humidity inversions and their relation to the large-scale circulation indices. Here, we examine Arctic inversions of temperature and specific humidity on the intraseasonal time scale using SHEBA data from October 1997 to September 1998 and further explore the reason for the intraseasonal oscillation of the inversions on interannual time scales using the ERA-Interim reanalysis.

2. Data and Methods

2.1. SHEBA Data

The observed vertical profiles of atmospheric variables are derived from the SHEBA experiment, which was a year-long field experiment deployed on a drifting sea-ice station in the Chukchi and Beaufort Seas from 2 October 1997 to 12 October 1998 [16]. Figure 1 shows the track of the SHEBA ice station. Profiles of temperature, pressure, relative humidity, and wind were measured with Vaisala RS80-15GH radiosondes. In this study, twice daily soundings at 0000 and 1200 Universal Time Coordinated (UTC) were interpolated into 50-m bins to obtain the temperature and specific humidity profiles. The Vaisala RS80-A and RS80-H radiosondes show a dry bias of 2–10% in relative humidity under cold and dry conditions, while the bias increases for temperatures below −40 °C [30]. In our study, air temperature is mostly above −40 °C, so that errors of more than 10% were avoided. Some features of the atmospheric sounding measurements can be found at https://www.eol.ucar.edu/projects/sheba/ [31]. No corrections have been applied to the temperature and specific humidity profiles.

2.2. ERA-Interim Reanalysis Dataset

To explain the formation and variability of temperature and specific humidity inversions, we utilized large-scale circulation data derived from the ERA-Interim from December 1979 to February 2017 [32]. ERA-Interim corrects an erroneous Arctic warming trend found in ERA-40 [33], which is related to the discontinuity in 1997 as a response to the processing of satellite radiances [34]. ERA-Interim outperforms the other reanalyses in air temperature and humidity of the lower troposphere over the Arctic, though it shows a warming bias of 2 K and a moist bias of 0.3–0.5 g kg−1 [35].

2.3. Methods

Self-organizing map (SOM) [36] is a neural-network-based analysis method that can reduce multi-dimensional data into a two-dimensional array using unsupervised learning. The vector for each node of the array represents a spatial pattern of the input data. Thus, the SOM array shows the continuously spatially varying patterns of the input data. The SOM method has three advantages. First, it does not assume a priori a distribution of the input data [37]. Second, by adding a topological map, SOM can effectively provide the continuum of patterns for the input data relative to cluster analysis. Third, unlike the Empirical Orthogonal Function (EOF) approach, SOM does not require the orthogonality of two nodes, thus producing more objectively the spatial patterns of the input data. SOM analysis has been used in extracting a continuum of atmospheric circulation patterns [37,38,39,40,41]. To determine the size of the SOM array, we calculated the spatial correlation between the strength of the inversion at each time and its corresponding SOM pattern. The spatial correlation does not change much, varying from 0.32 for 3 × 3 grids to 0.35 for 4 × 4 grids and 0.37 for 5 × 5 grids. Thus, we chose the 4 × 4 grids as the size of the SOM array. To compare and confirm the results of the SOM analysis, we also performed an EOF analysis for the same variable.
The Arctic Oscillation (AO) index [42] is derived from the Climate Prediction Center (CPC). The Arctic Dipole (AD) index is obtained from the EOF analysis of wintertime sea-level pressure (SLP) north of 70° N [43]. The time series of the second EOF mode corresponds to the AD index.

3. Results

3.1. Profiles of Temperature and Specific Humidity

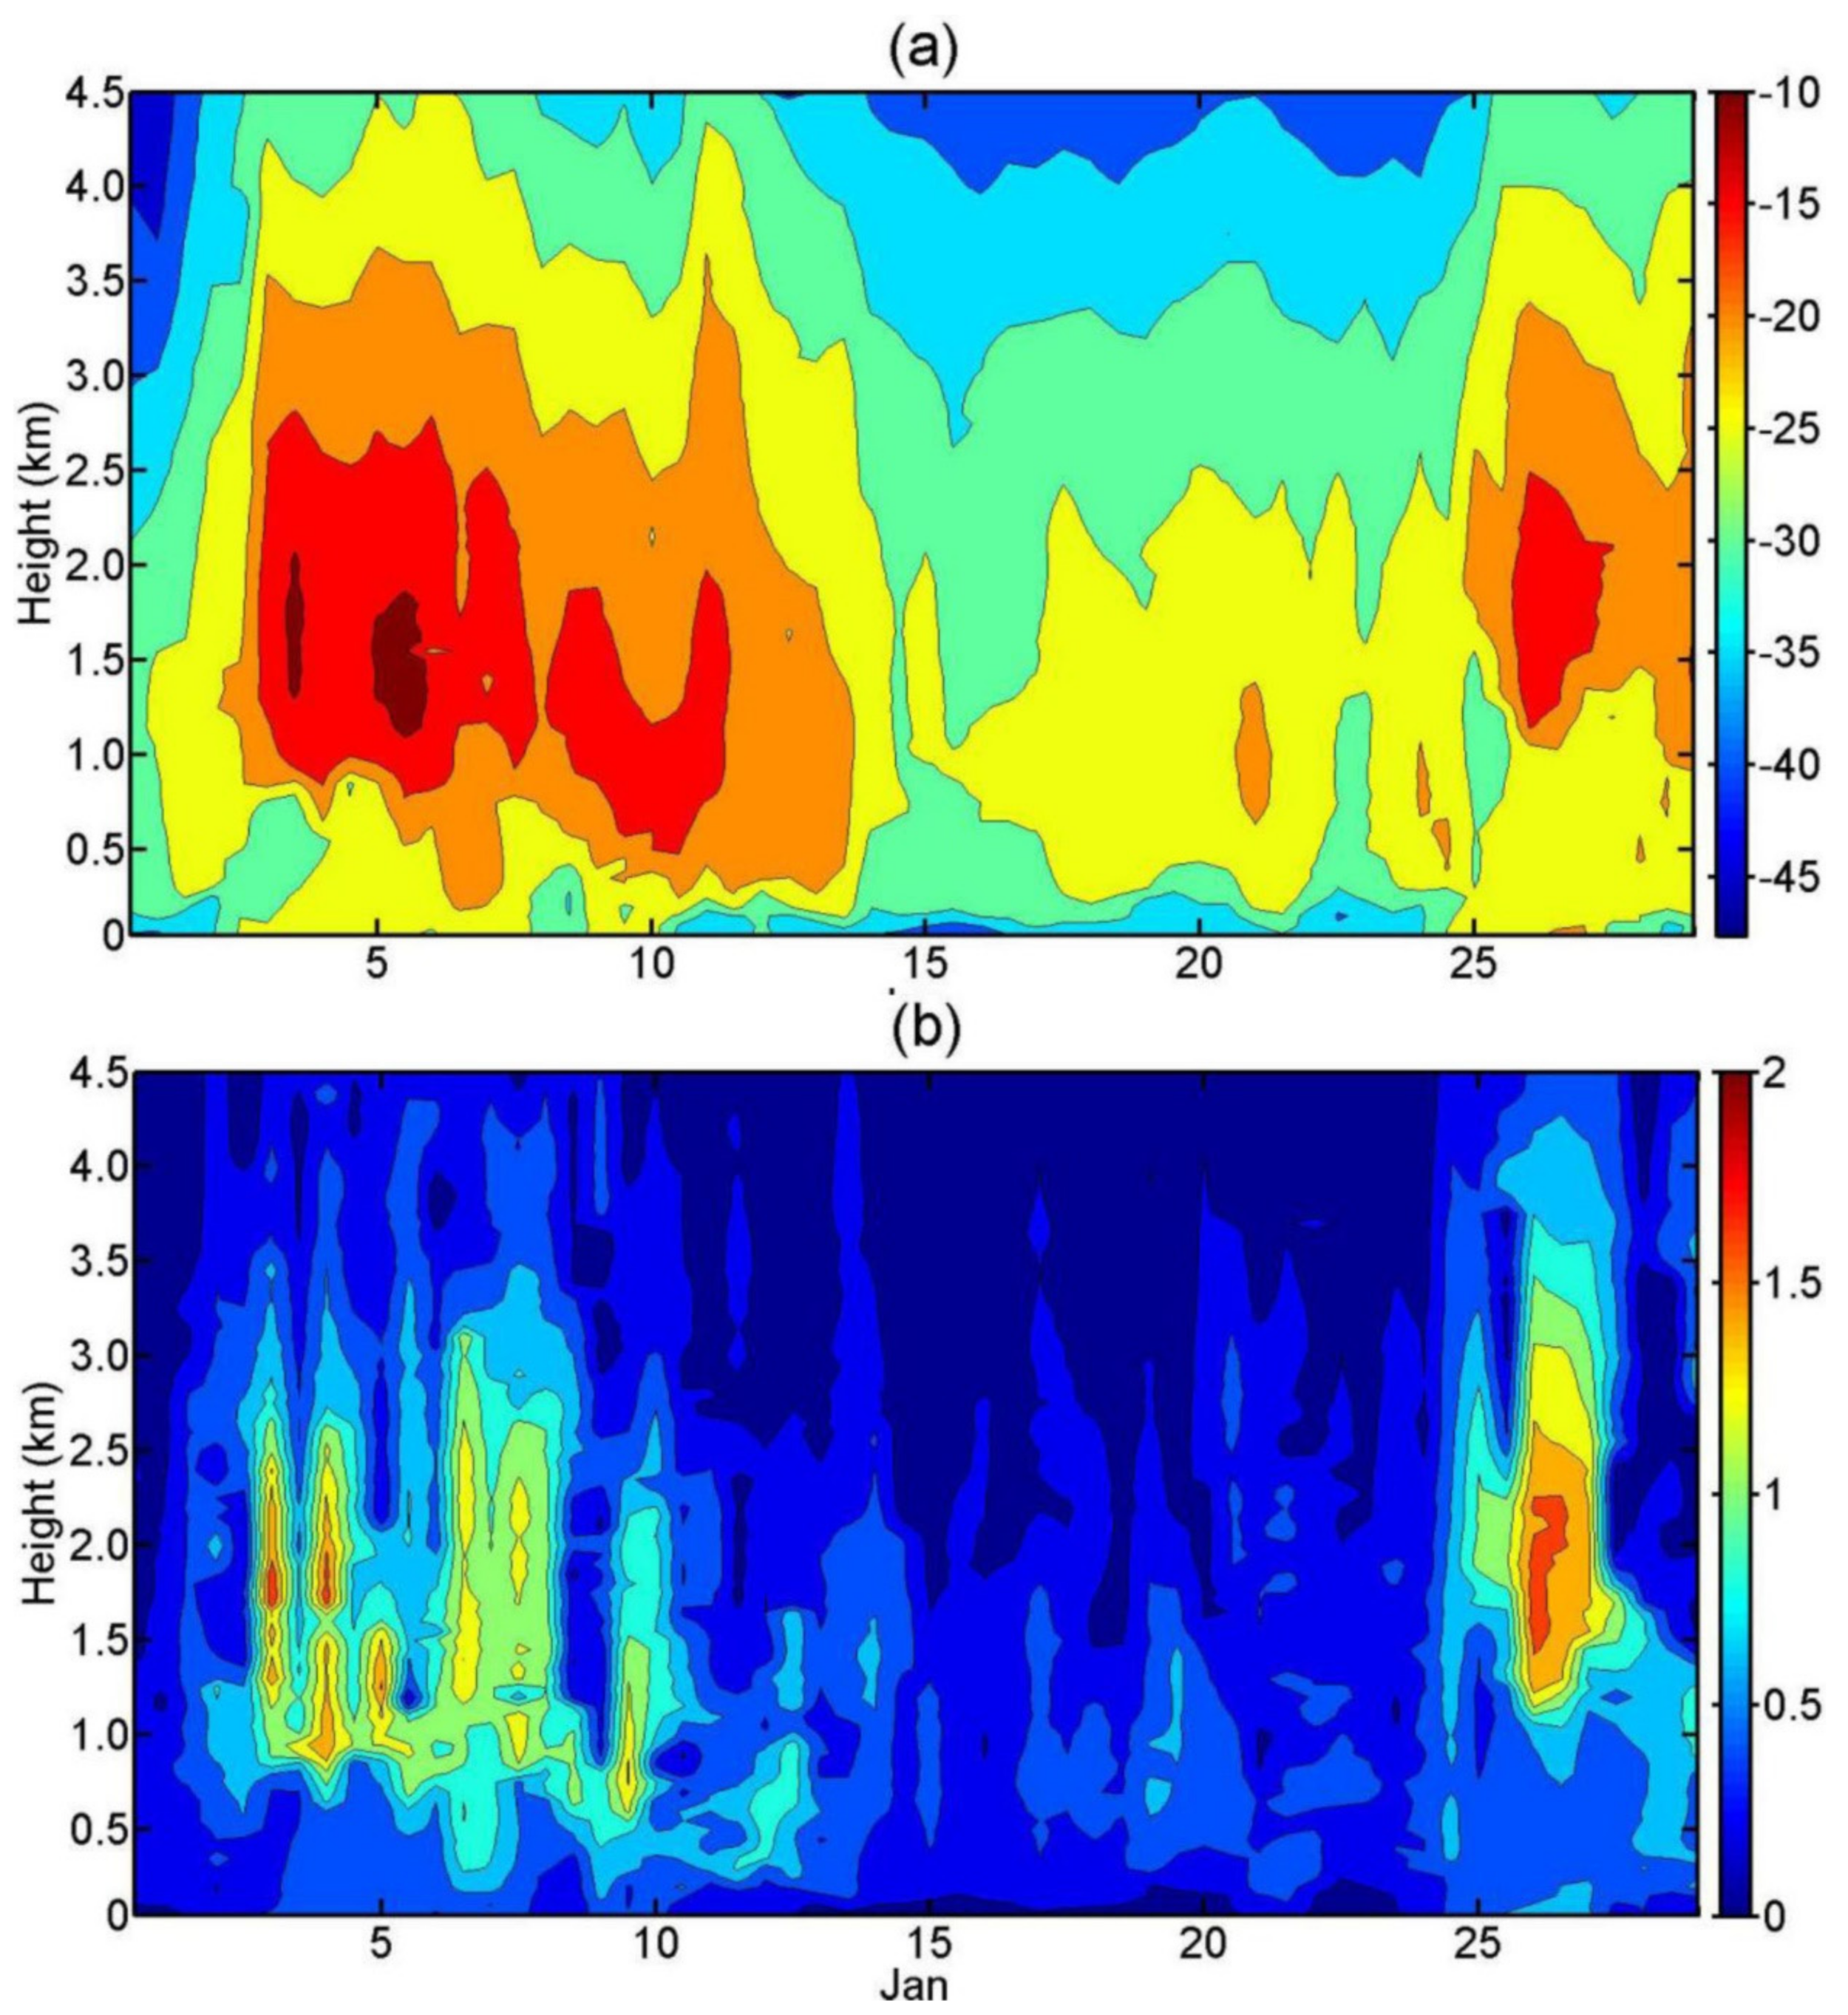
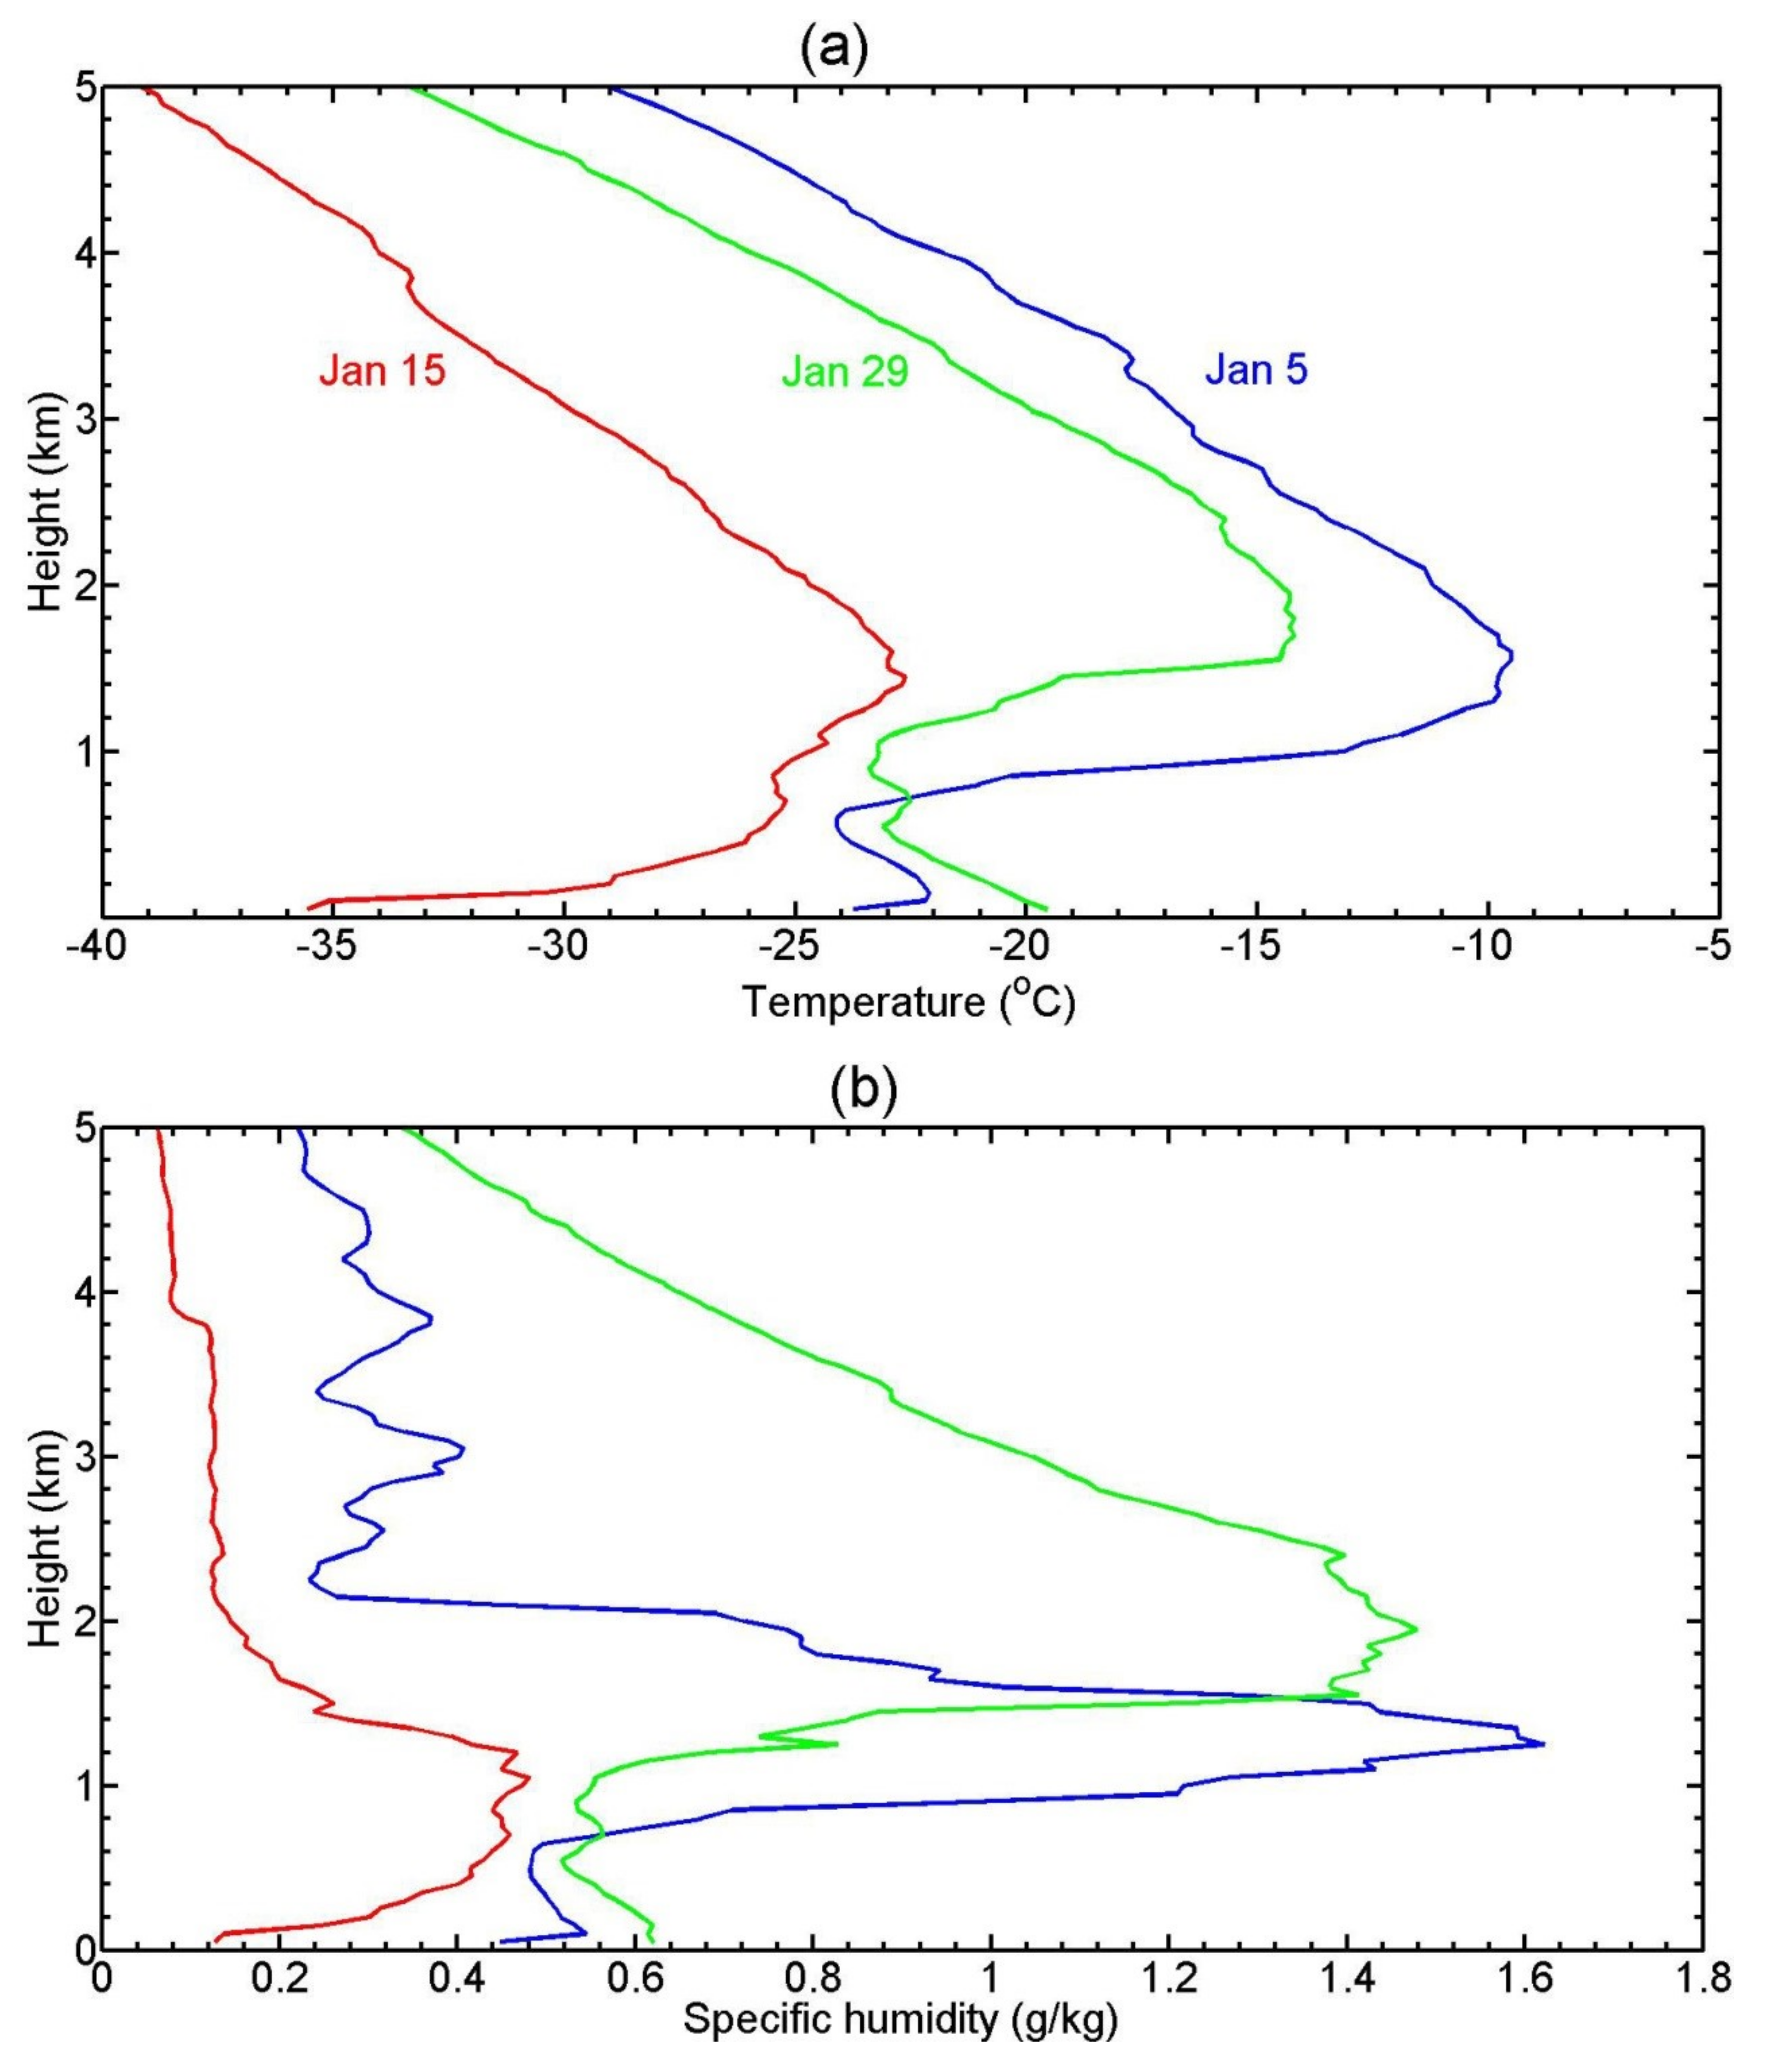
Figure 2 shows the profiles of the temperature and specific humidity in January 1998. There were two main warm periods (Figure 2 and Figure 3). On 5 January, there was a maximum value of −8.7 °C at 1370 m and a maximum specific humidity of 1.8 g kg−1 at 1700 m. A surface-based temperature and specific humidity inversion occurred below 150 m. From 150 m to 600 m, temperature and specific humidity decreased with height. From 600 m to 1600 m, a temperature elevated inversion of 14.6 °C occurred. Meanwhile, a specific humidity inversion of 1.1 g kg−1 occurred from 600 m to 1350 m. On January 29, the warm period had a maximum temperature of −11.5 °C at 1600 m and a maximum specific humidity of 1.7g kg−1 at 1650 m. Elevated inversions of both variables reoccurred, but their base heights of 900 m were higher than during the first warm period.
There was an obvious cool and dry period between these two periods, especially at the surface (Figure 2 and Figure 3). At the surface, the minimum air temperature and specific humidity were −37.5 °C and 0.09 g kg−1, respectively, on 15 January. A remarkable surface-based inversion existed below 1450 m whose strength is 8.9 °C for temperature and 0.3 g kg−1 for specific humidity. Radiative cooling appeared to be responsible for this inversion. Above the inversions, temperature and specific humidity decreased steadily with height.
The transition between the two kinds of inversions in January 1998 corresponds to an intraseasonal variability of temperature and specific humidity. We make a wavelet analysis of temperature and specific humidity at different levels during the 1997/1998 winter (not shown). There is a noticeable period of 20–30 days. The intraseasonal variability of air temperature and specific humidity with a period of more than 20 days was also noted before [13]. This indicates that the intraseasonal variability of atmospheric circulation modulates the transition of different inversions.

3.2. Mechanisms

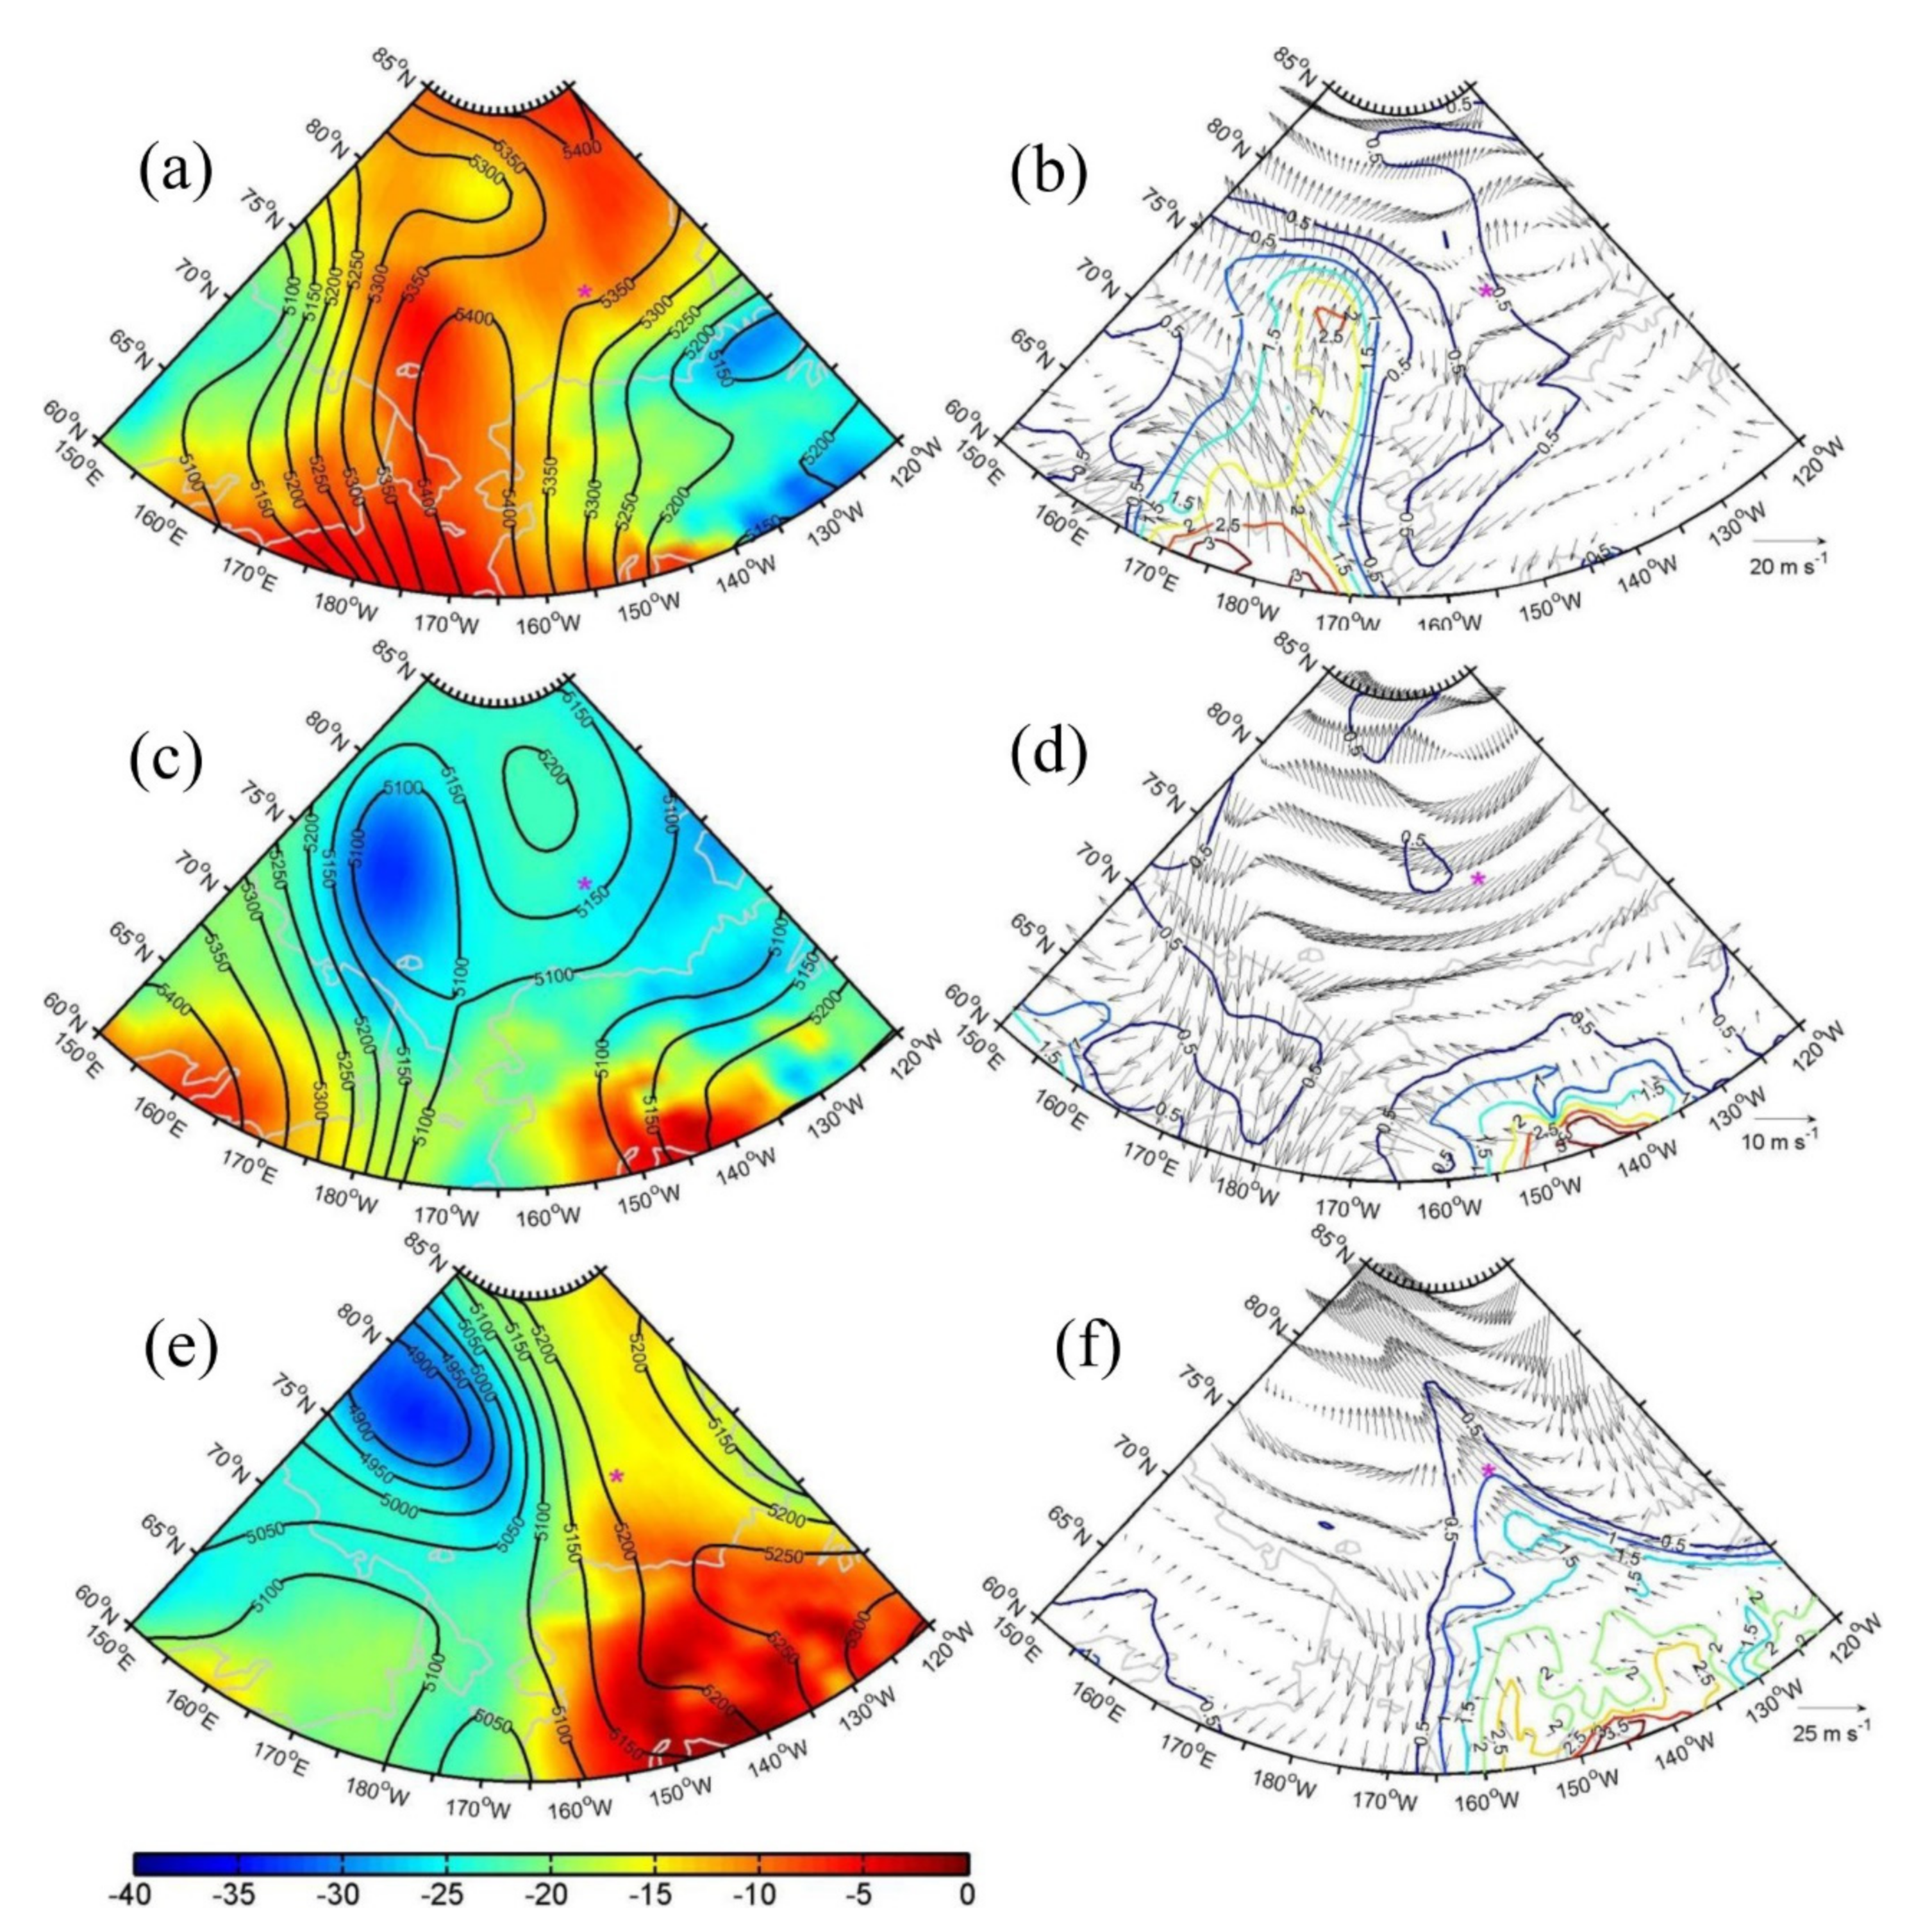
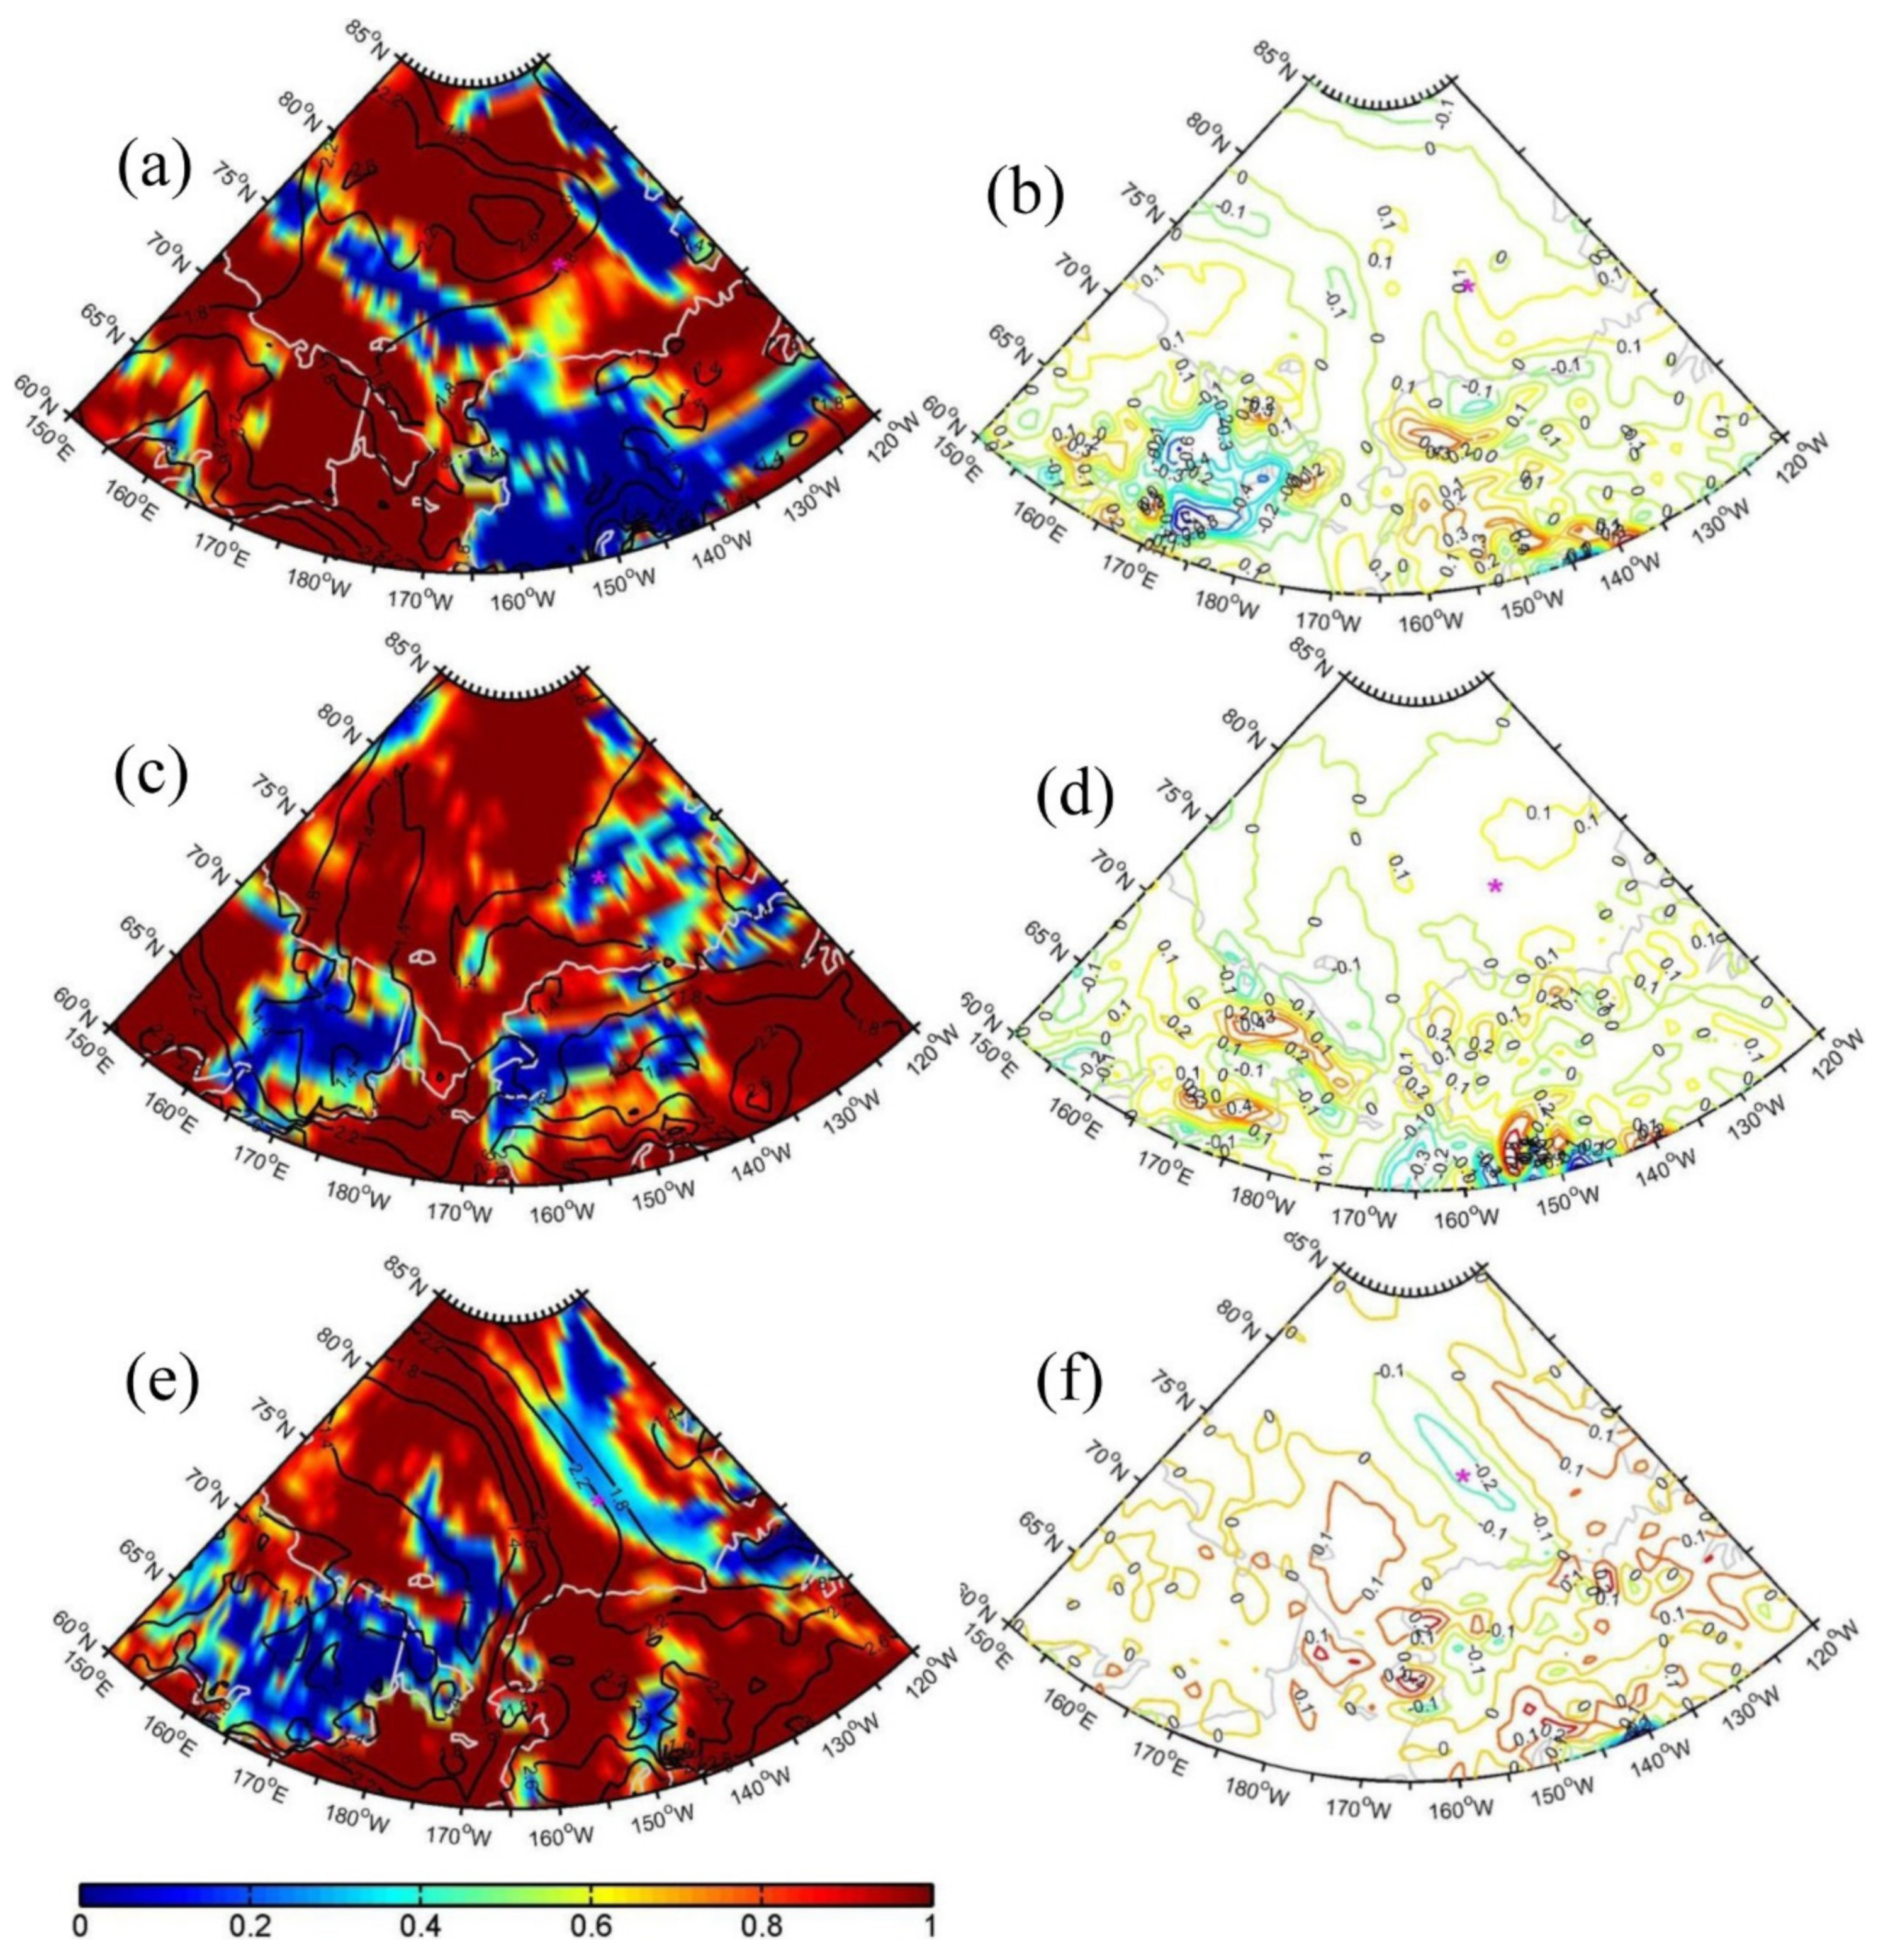
To explore the underlying mechanism responsible for these inversions, we show plots of various atmospheric variables on 5, 15, and 29 January 1998 (Figure 4 and Figure 5). On 5 January 1998, the SHEBA site (Figure 4a) was under the influence of a high-pressure ridge. Southerly winds transported warm and moist air to the site (Figure 4b), which increased the 850-hPa temperature and moisture (Figure 4a,b), thus leading to the formation of elevated inversions at the site. The heat and water vapor fluxes showed a spatial pattern similar to that of the 850-hPa wind field (not shown). The larger downward surface infrared radiation as a result of increasing moisture not only increased the surface air temperature, but also diminished the strength of the surface-based inversion (Figure 5a). On 29 January 1998, the larger warm air advection caused by stronger southerly winds (Figure 4f) induced by the strong zonal gradient of geopotential height (Figure 4e) resulted in similar temperature and specific humidity inversions. The stronger warm air advection increased the moisture and decreased the temperature on 29 January 1998 compared to those on 5 January 1998 (Figure 4e,f). On 5 January 1998, the downward motion at 850 hPa (Figure 5b) at the SHEBA site produced warming at this level, whereas on 29 January 1998 the 850-hPa upward motion (Figure 5f) reduces the temperature increase caused by the warm air advection. On 29 January 1998, the stronger downward surface longwave radiation also raises the surface air temperature and suppresses the occurrence of surface-based inversions (Figure 5e).
On 15 January 1998, the 500-hPa geopotential height field was characterized by a meridional dipole with a positive center at 80° N, 170° W and a negative center at 60° N, 170 °W, which generated northerly winds over the SHEBA site (Figure 4c,d). The cold and dry air from higher latitudes decreased the temperature and specific humidity, and thus the possibility of elevated inversions (Figure 4c,d). Small downward surface longwave radiation favored the occurrence of surface-based inversions (Figure 5c). The weak downward motion produced minimal warming at 850 hPa (Figure 5d).
Figure 5a,c,e shows the total cloud cover on 5, 15, and 29 January 1998. During January 1998, the total cloud cover above the observation site was approximately equal to 1.0, which was favorable for the occurrence of downward longwave radiation at the surface [10,13]. The total cloud cover was primarily contributed by a low cloud cover (not shown). On 29 January 1998, the total cloud cover (0.37) was larger than that on 15 January 1998 (0.2), suggesting larger downward longwave radiation on 29 January 1998.

3.3. The Spatio-Temporal Variability

The aforementioned inversion events occurred in January 1998. It is essential to extend the analysis of wintertime inversions to the whole Arctic Ocean over a longer period. During northern high-latitude winters, the profile of low-troposphere temperature and specific humidity usually alternates between the two kinds of inversions [13], which can be seen in Figure 2. For elevated inversions, the (positive) temperature and humidity differences between 850 hPa and 950 hPa are large; for surface inversions, the values are relatively small (Figure 2 and Figure 3). Thus, the anomalies of these temperature and humidity differences are positive and negative for elevated and surface inversions, respectively.
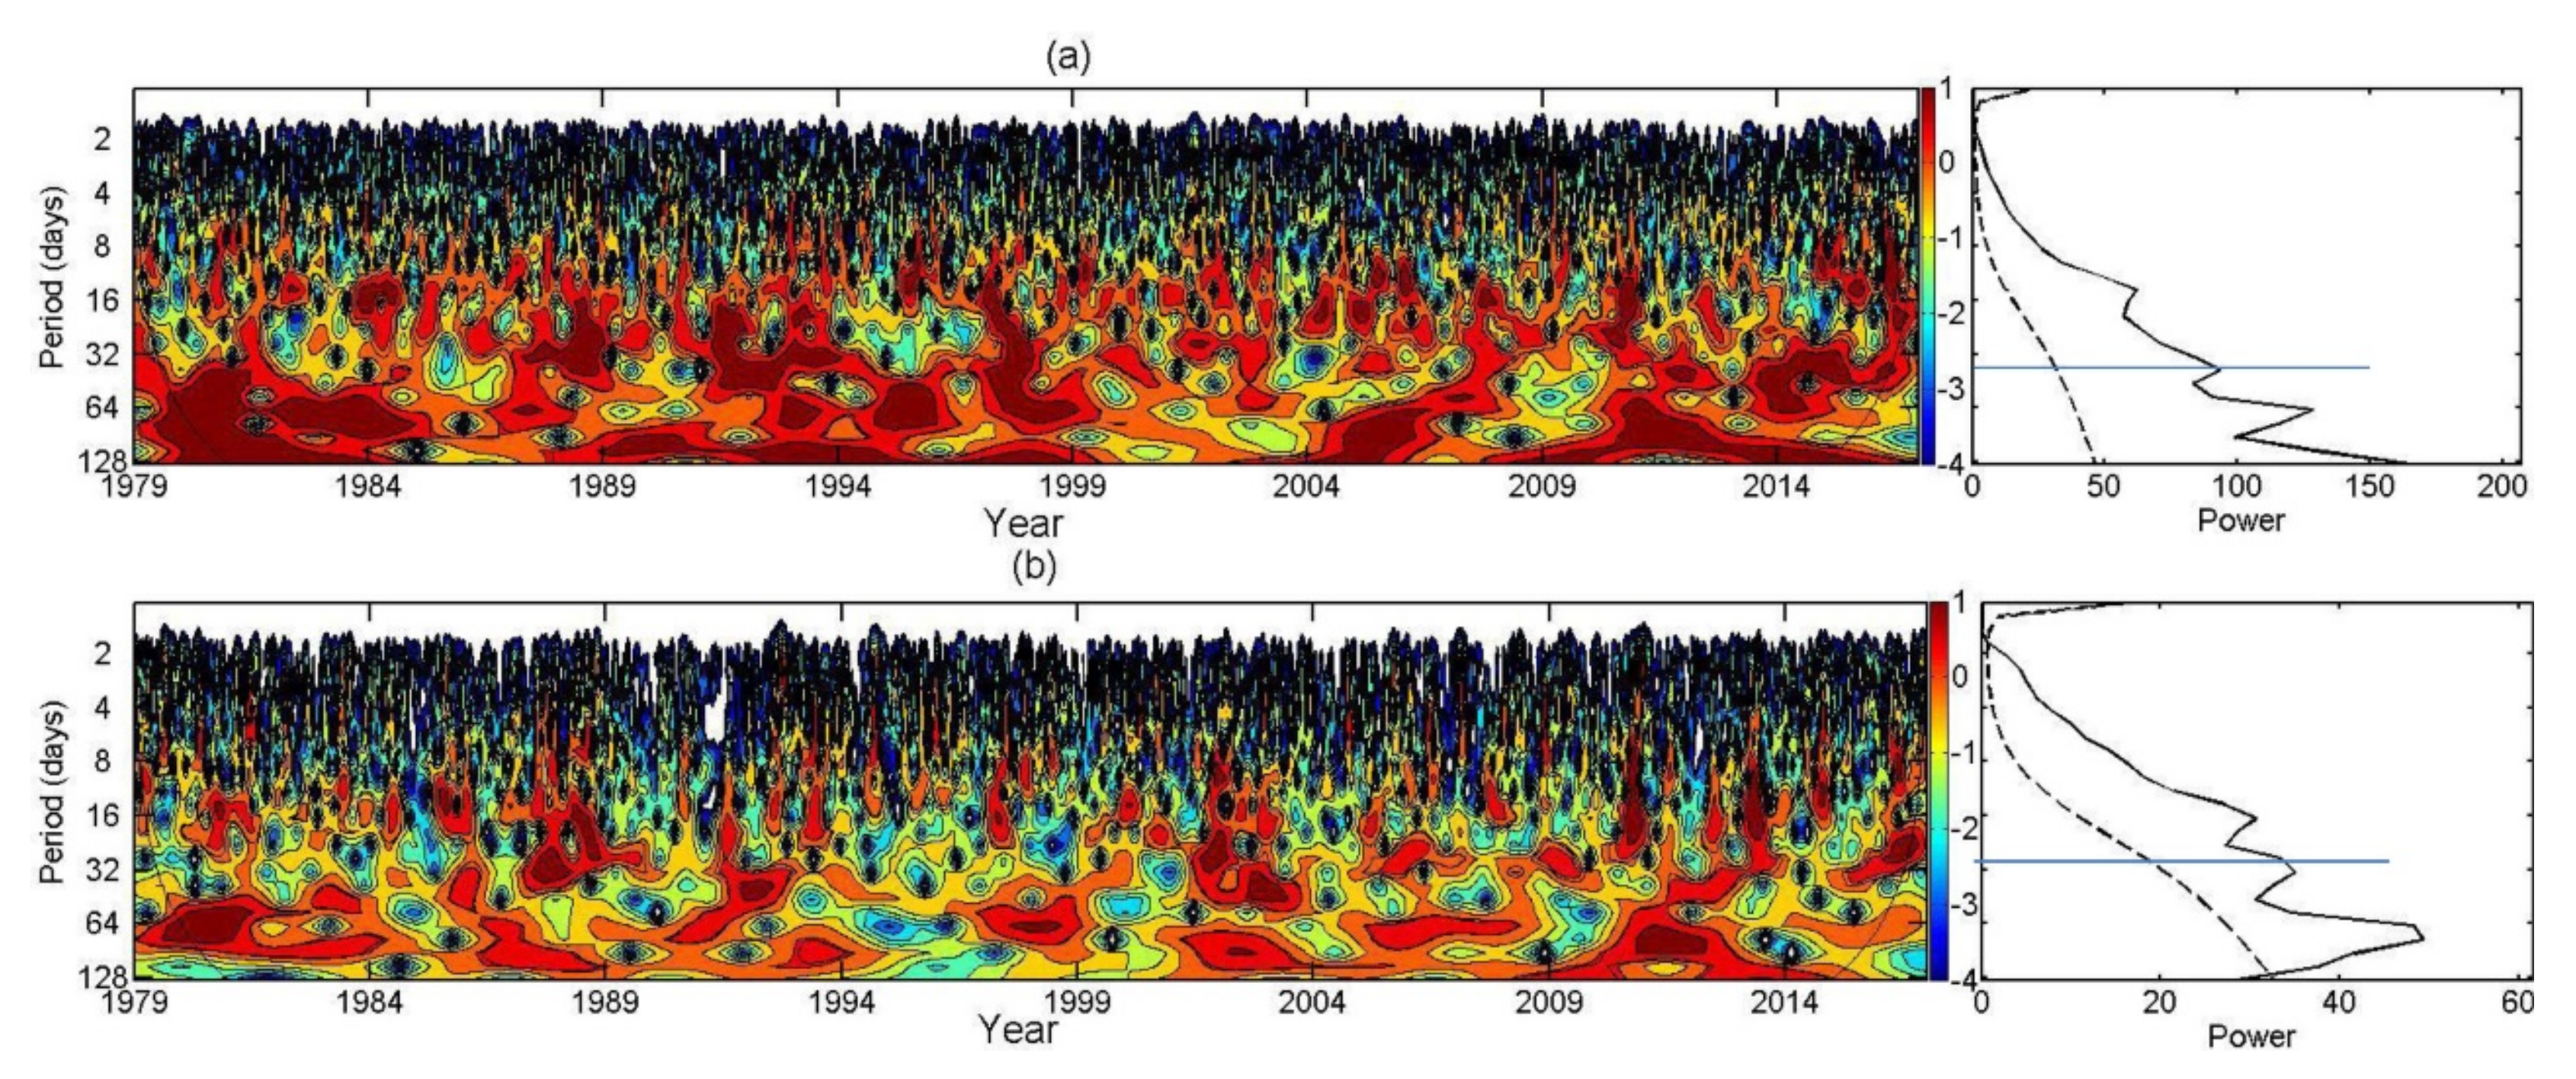
The Wavelet analysis was utilized to investigate the period of the variability of temperature and humidity differences between 850 hPa and 950 hPa at the location (75° N, 155° W) on the SHEBA camp during January 1998. Periods of 40 and 27–33 days are significant for temperature and specific humidity difference, respectively (Figure 6) with a confidence level above 95%. It confirms the intraseasonal variability related to the alternation of two kinds of inversions.
To further examine the spatio-temporal variability of the intraseasonal variability, we applied a 10–60-day band-pass filter to the temperature differences at two levels to retain only the intraseasonal variability [44]. For each grid point, we subtracted the 38-year average from the 10–60-day filtered temperature differences at each time to obtain its anomaly. A normalized temperature difference was obtained by dividing the anomalous filtered temperature inversion by its standard deviation at each grid point. The same process was applied to the specific humidity differences. Considering the co-variation of two inversions, we carried out a SOM analysis of the normalized temperature and specific humidity differences to obtain the main modes of the differences on the intraseasonal timescale.
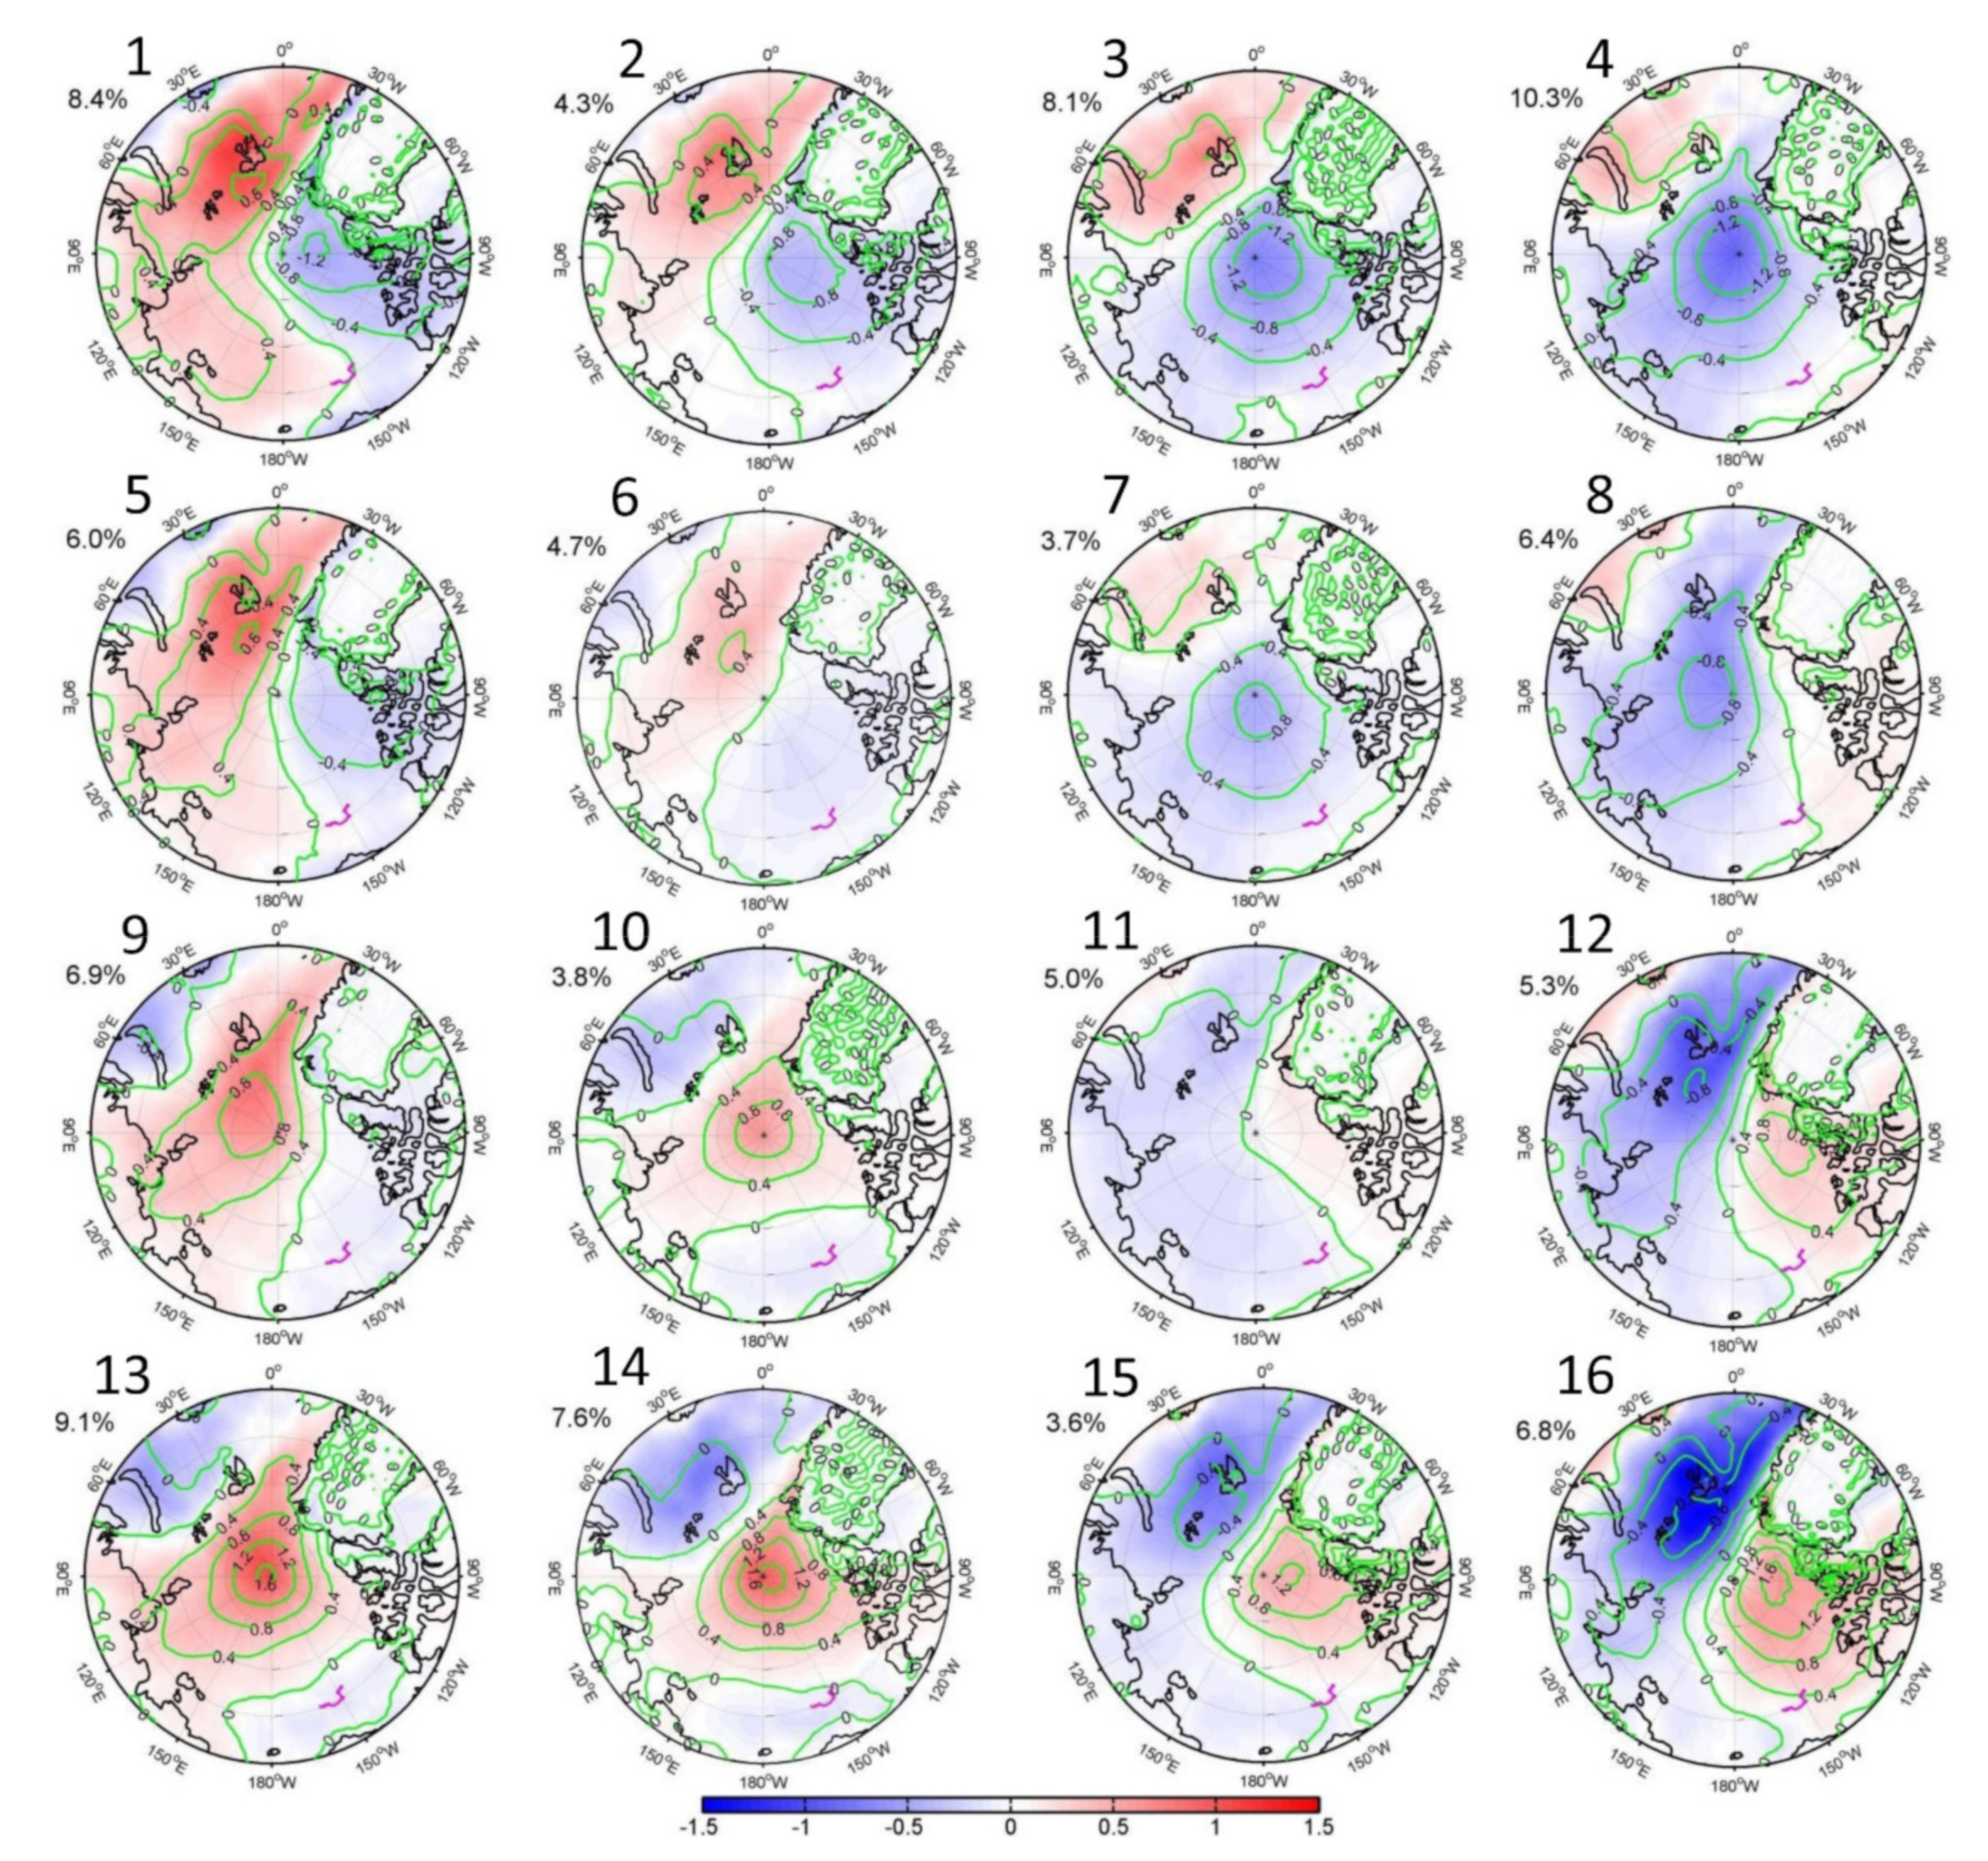
SOM patterns of temperature and humidity differences are shown in Figure 7. Node 4, which shows an anomalously negative temperature difference over most of the study region, has the highest frequency of occurrence of 10.3%, with the smallest value over the central Arctic Ocean (Figure 7). As a mirror of Node 4, Node 13 has the second highest frequency of occurrences (9.1%). Nodes 10 and 7 are in the transition state between Nodes 4 and 13. Nodes 1 and 16 have a nearly opposite spatial pattern. For Node 1, positive (negative) temperature difference anomalies occur mainly over the western (eastern) hemisphere of the Arctic Ocean. Nodes 6 and 11 vary between Nodes 1 and 16. Nodes 5, 8, 9, and 12 are in the transition state from a dipole structure to a monopole structure of temperature difference. The spatial patterns of the specific humidity difference are similar to those of the temperature differences, as the correlation coefficients of their spatial patterns are greater than 0.8.
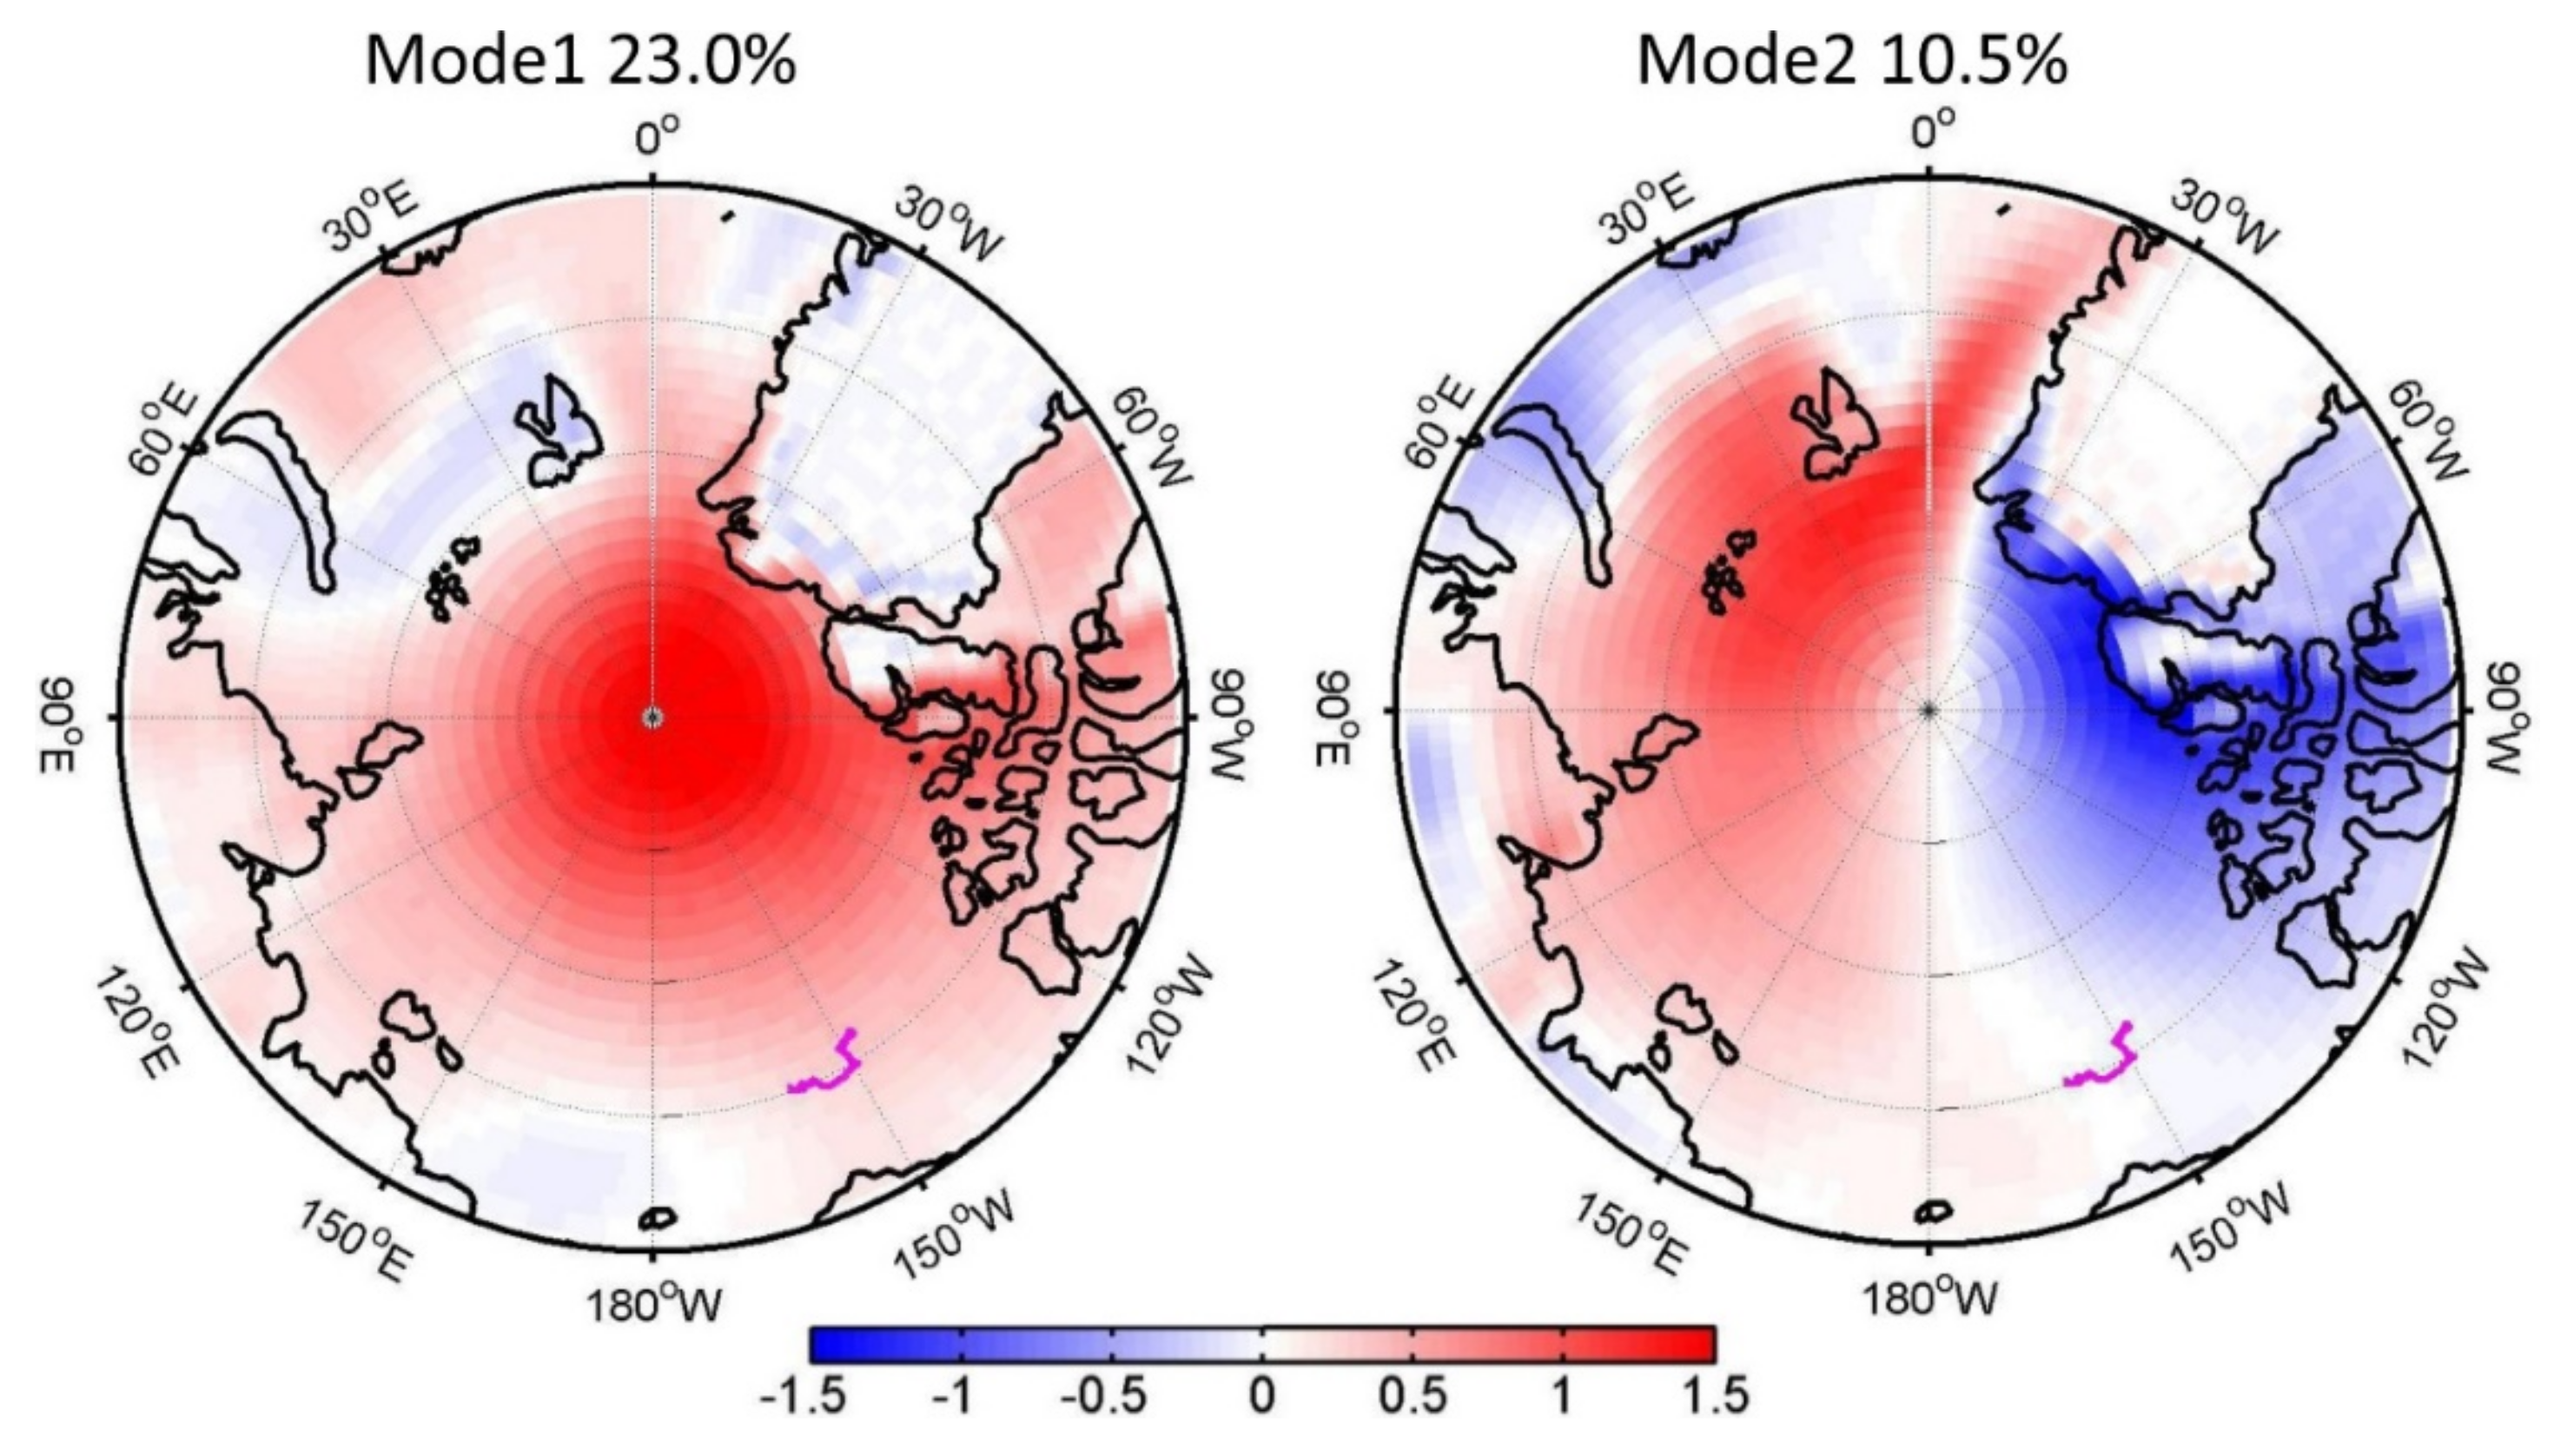
To better understand the SOM results, we have also done an EOF analysis of 10–60-day filtered temperature differences. The spatial pattern of the first EOF mode (Figure 8) is somewhat similar to those of SOM Nodes 9, 13, and 14 in Figure 7. The variance explained by the first EOF mode (23.0%) is approximately equal to the sum of the occurrence frequency of the three SOM nodes (23.6%). Similarly, the spatial pattern of the second EOF mode (Figure 8) is similar to those of SOM Nodes 1 and 5. The variance explained by the second EOF mode (10.5%) is smaller than the sum of the occurrence frequency of the two SOM nodes (14.4%). While the results from the EOF and SOM analyses are similar, the SOM analysis shows more details and transitional states.
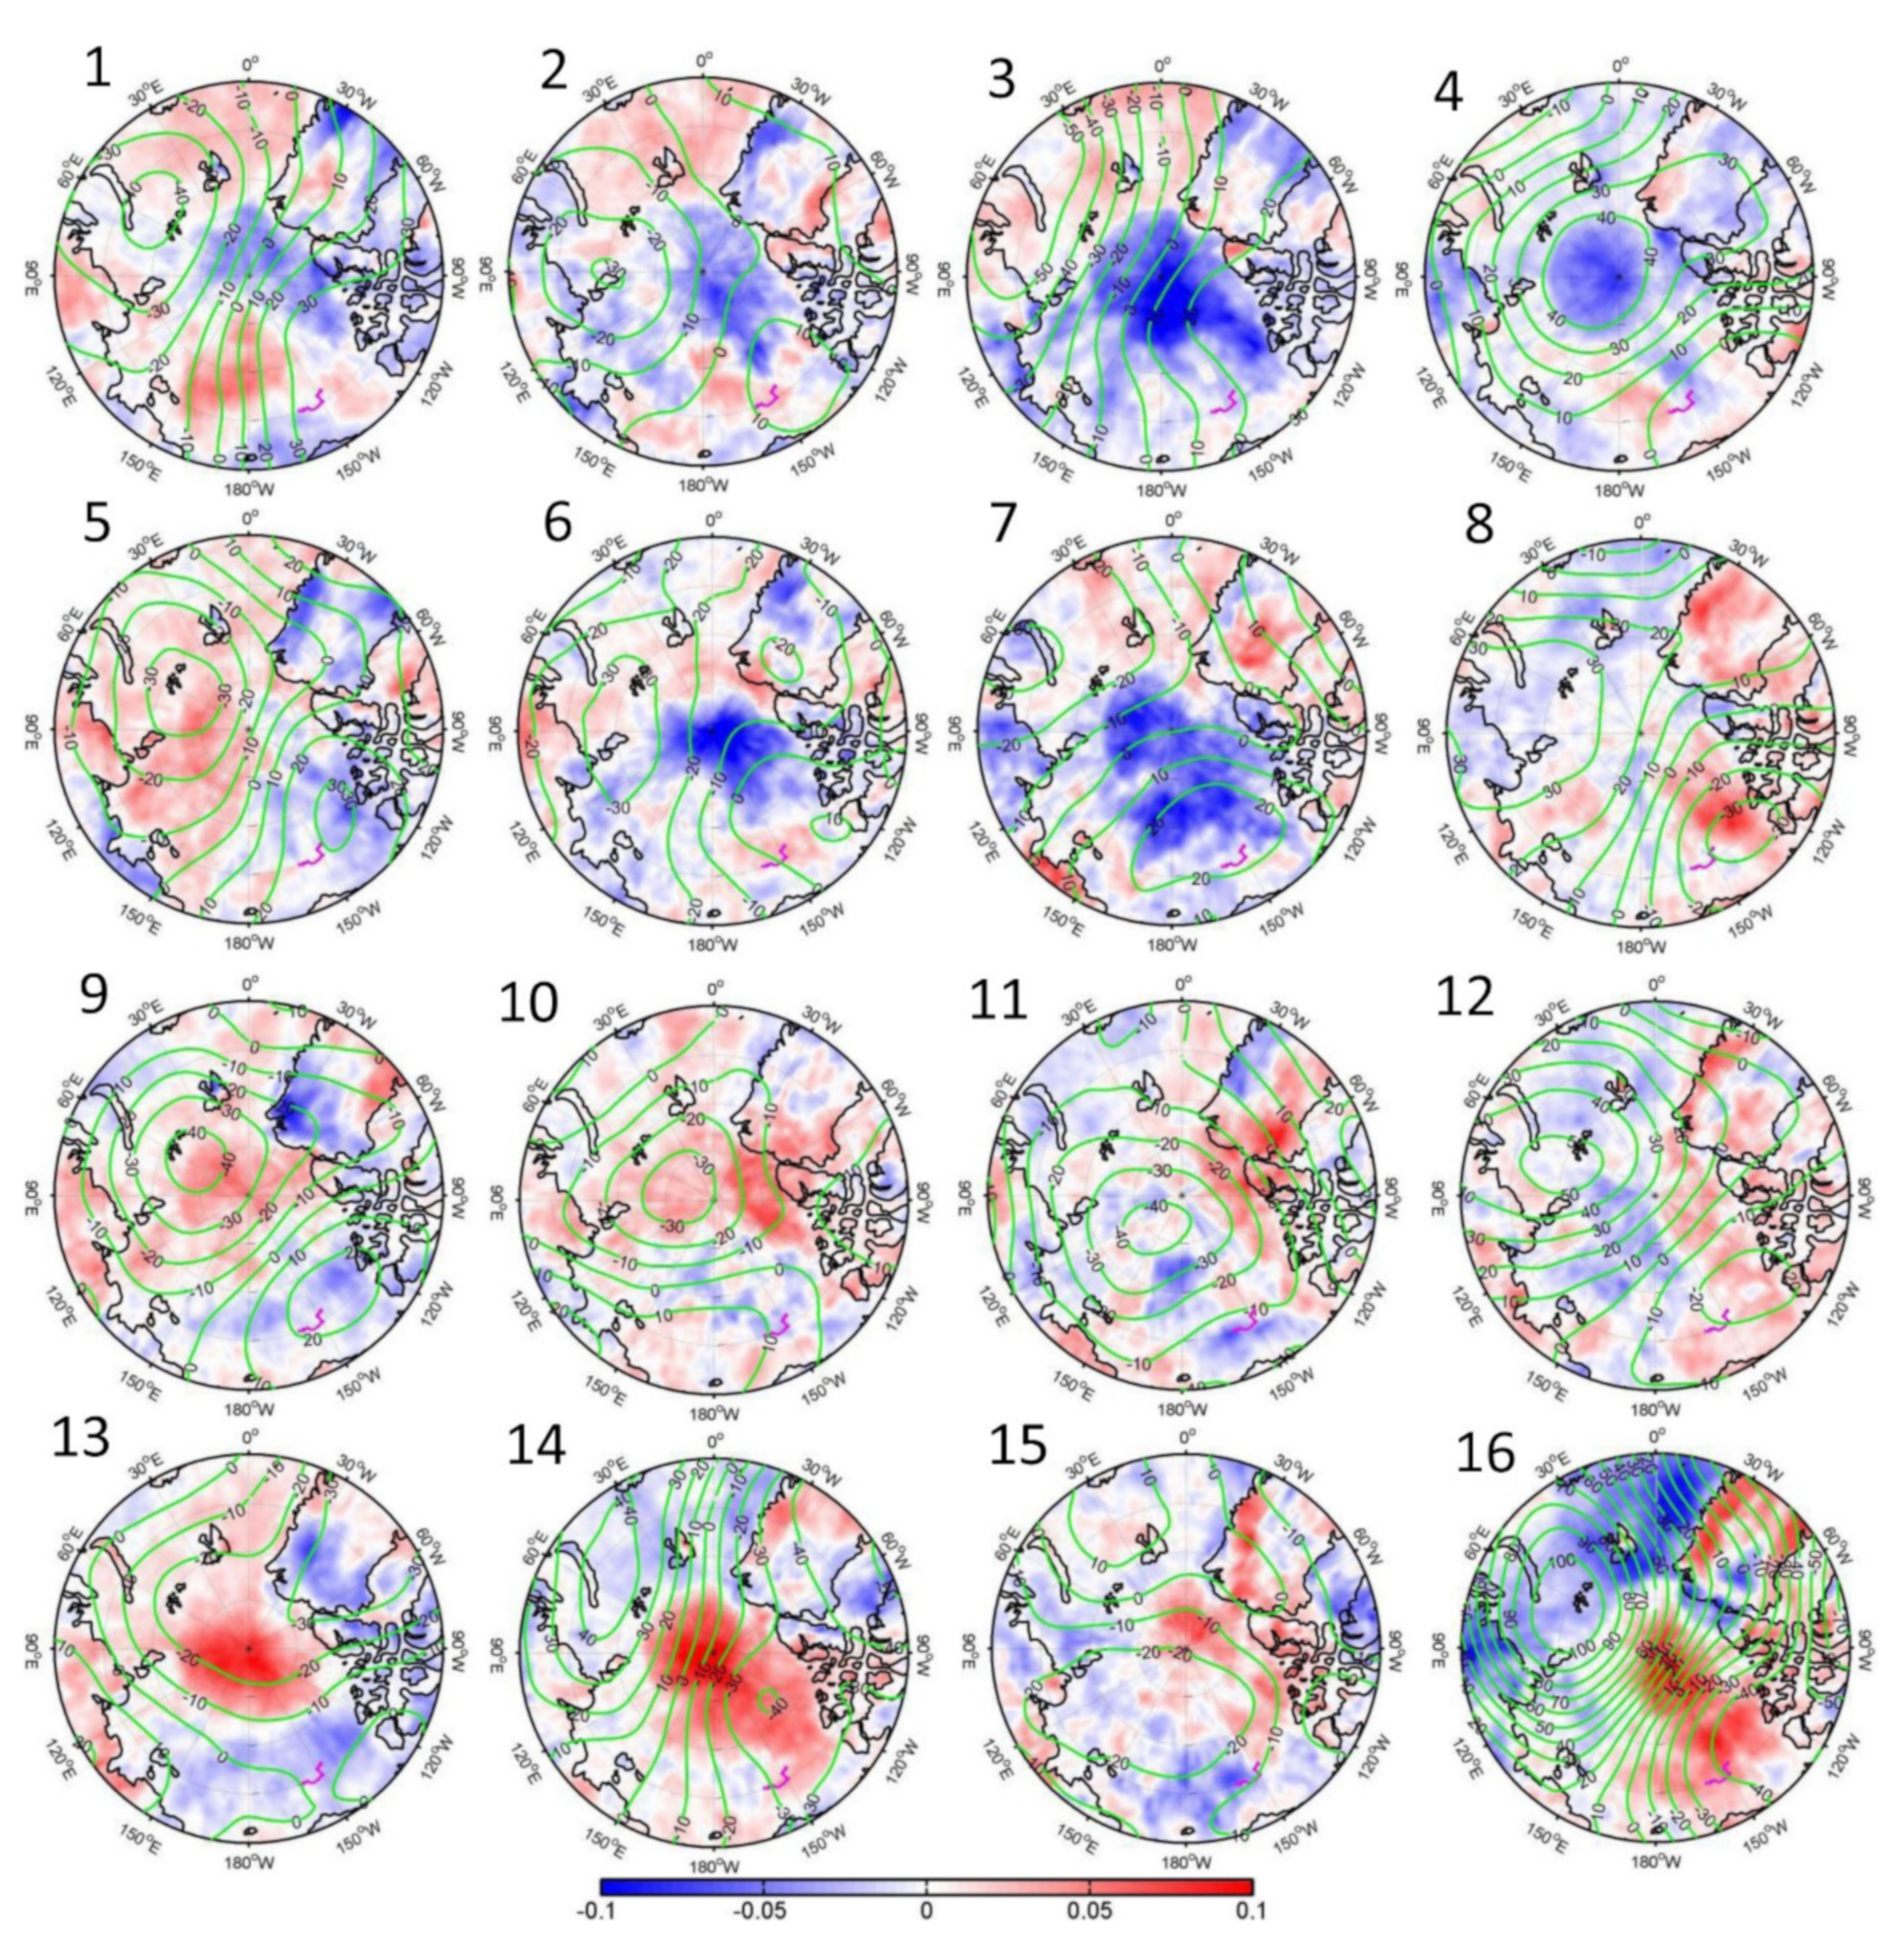
As mentioned earlier, positive and negative values in the spatial patterns in Figure 7 correspond to elevated and surface inversions, respectively. The positive elevated temperature gradients correspond to negative 500-hPa geopotential heights (Figure 9) and vice versa for most of the nodes. Their spatial correlation coefficients vary from −0.20 for Node 7 to −0.80 for Node 10 with a confidence level above 95%. This is consistent with the finding of Stramler et al. [13] that elevated temperature and humidity inversions are related to the low-pressure phase of a baroclinic wave.
Node 11 has a spatial correlation coefficient of 0.12; its atmospheric circulation shows a zonally symmetrical structure, indicating a positive phase of AO, which is not favorable for the formation of elevated inversions [42]. For the other Nodes, the meridional circulation related to synoptic systems determines the transport of heat and water vapor, which affects the formation of elevated inversions. The spatial correlations between specific humidity inversions and 500-hPa height show similar results.
We also calculated the spatial correlation between anomalous temperature inversions and total cloud cover for each Node (Figure 9). The correlation coefficients are positive, ranging from 0.11 for Node 6 to 0.89 for Node 3, indicating more (less) temperature inversions during a more (less) cloudy state, which is consistent with the finding of Stramler et al. [13].
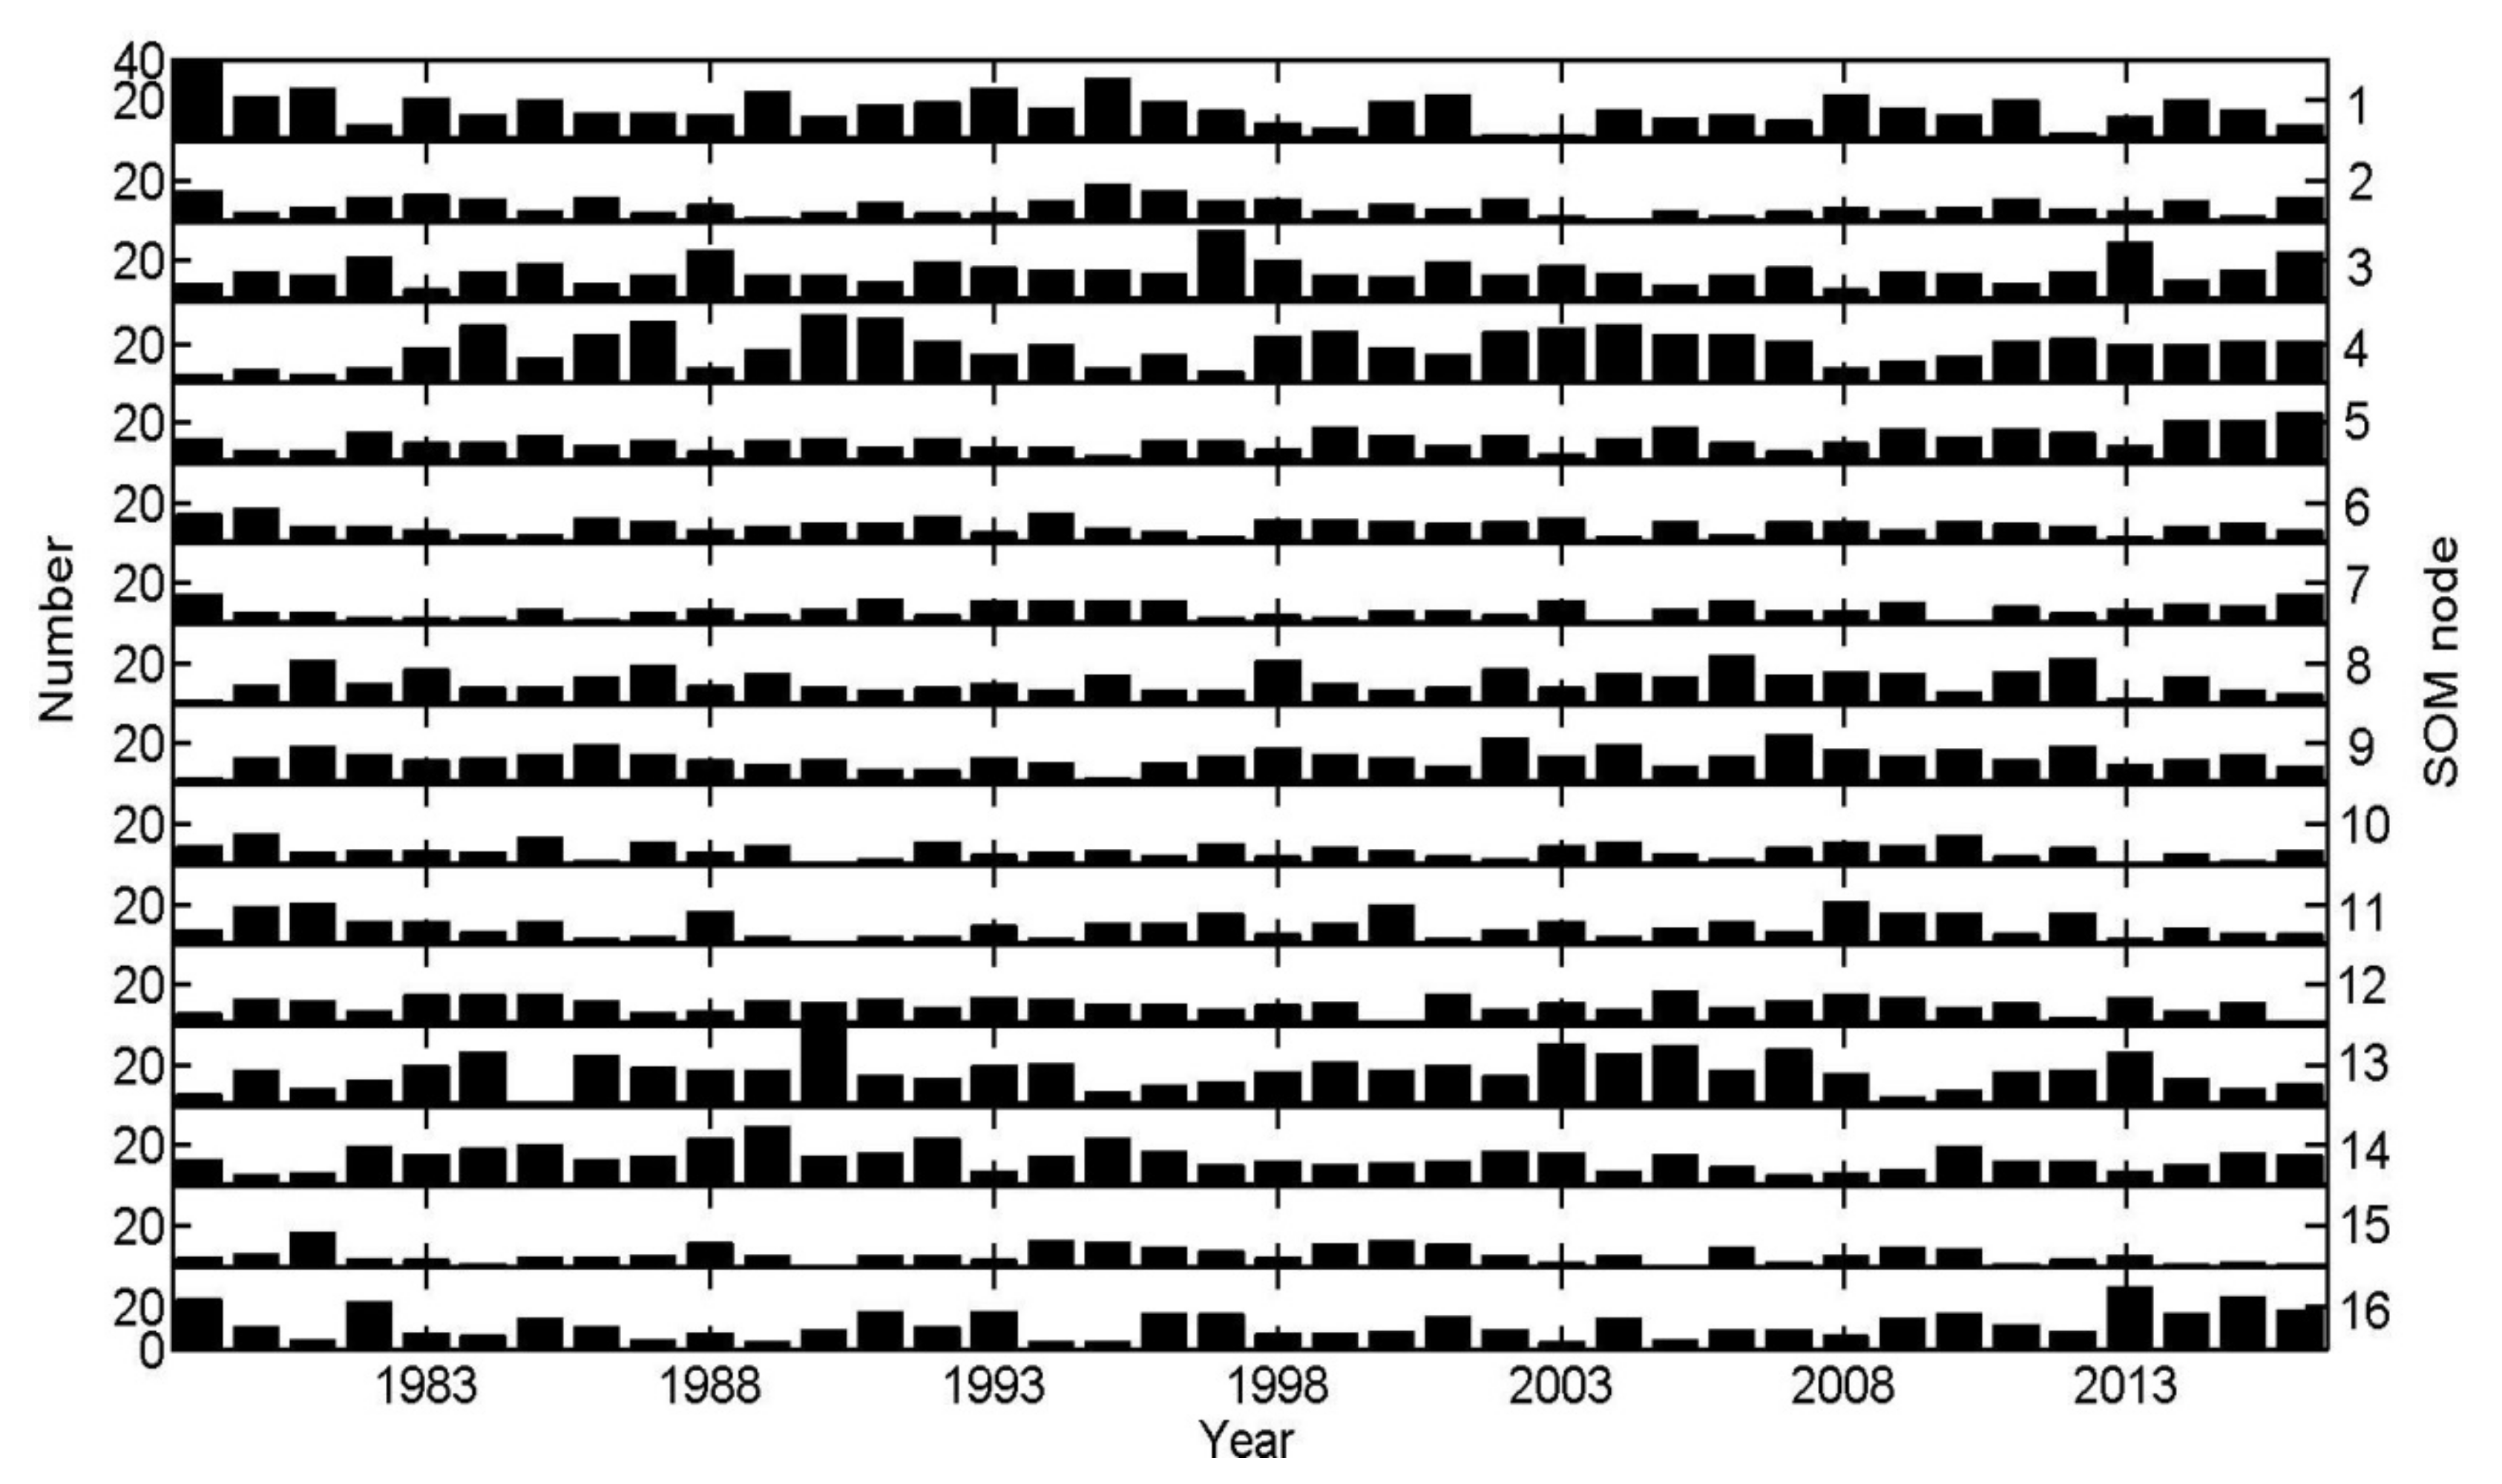
The occurrence number of each Node varies differently with time (Figure 10). Only the occurrence number of Nodes 1 and 5 shows a statistically significant trend of −0.28 year−1 and 0.21 year−1, respectively. Considering the spatial pattern of Nodes 1 and 5, the number of strong (weak) elevated inversions over the eastern hemisphere decreased (increased) in the past three decades. The number of strong and weak surface inversions shows a similar change. Here, strong and weak inversions indicate different magnitudes of spatial patterns of Nodes 1 and 5.
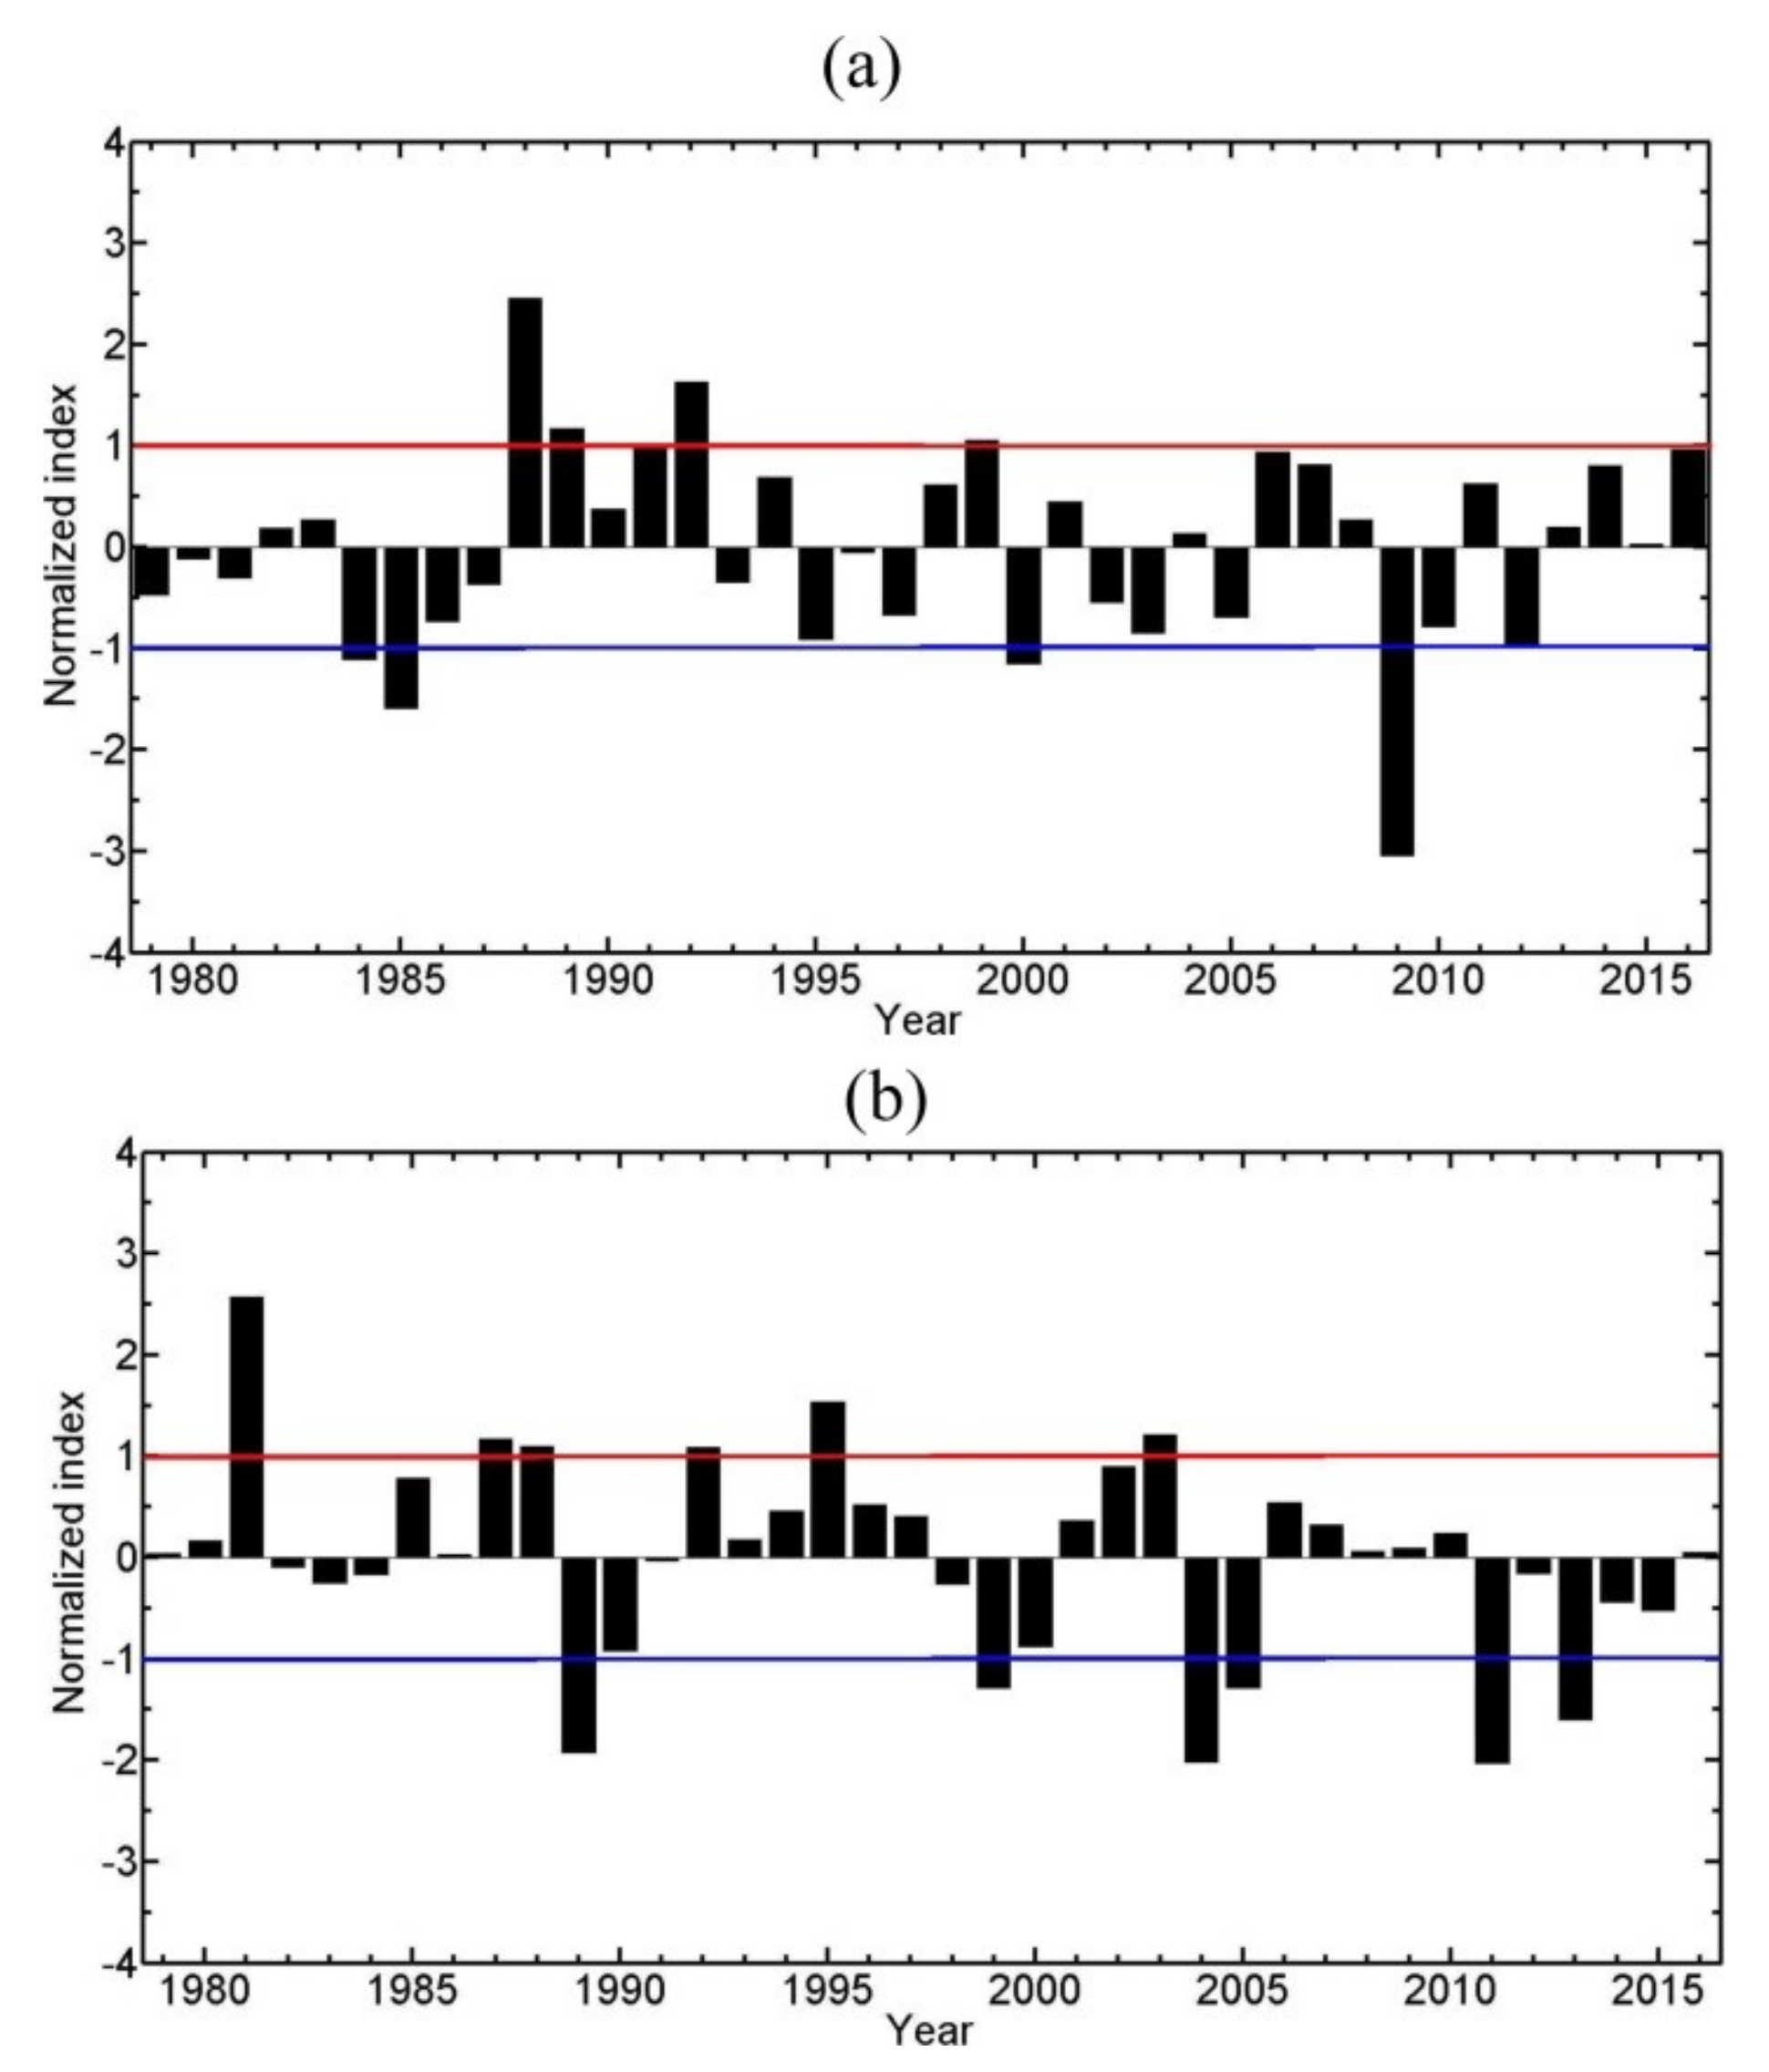
The AO and AD are the first two climate modes north of 70° N and have a significant impact on the Arctic’s atmospheric circulation and surface climate [43]. Their positive, negative, and neutral phases are defined for the index values >1, <−1, and between −1 and 1 (Figure 11). However, the frequency of SOM node occurrences in Figure 9 is found to differ little for different AO and AD phases, except for the following two situations. During the positive AO winters, the frequency of occurrence for Node 14 is 11.2%, which is significantly higher than the climatological 7.6%. The positive AD index is related to a frequency occurrence of 3.4% for Node 16, which is half of the climatological 6.8%. Further analysis indicates that the positive AO phase produces an increased (decreased) frequency of elevated temperature and humidity inversions over the central Arctic Ocean (the rest of the Arctic Ocean). In contrast, the positive AD index results in a decreased frequency of surface (elevated) inversions over the eastern (western) hemisphere of the study region.

4. Discussion and Conclusions

The vertical profiles of temperature and specific humidity from the SHEBA experiment and ERA-interim reanalysis data in January 1998 revealed the intraseasonal variability of temperature and specific humidity inversions. In addition, the SOM technique was utilized to investigate the spatial patterns of the intraseasonal oscillation over the whole Arctic Ocean and their interannual variability and trend.
In January 1998, the 850-hPa temperature and specific humidity over the Arctic Ocean exhibited an intraseasonal oscillation with a period of 20–30 days, which is closely related to transitions between elevated and surface-based inversions. During warm periods, there was an elevated inversion with a base height of 600 m; during cold periods, a surface-based inversion occurred. The elevated inversion was associated with warm air advection and relatively large downward surface longwave radiation, whereas cold air advection and relatively small downward surface longwave radiation accompanied the surface-based inversion.
SOM analysis of the ERA-Interim reanalysis data for 38 winters was utilized to examine the spatial pattern of surface and elevated inversions on intraseasonal time scales. For most Nodes, anomalous low (high) pressure was associated with elevated (surface) inversions anomalies, and vice versa. The cloud cover was positively (negatively) correlated to the occurrence of elevated (surface) inversions. The frequency of strong (weak) positive elevated inversions over the eastern hemisphere decreased (increased) in the past three decades. The AO and AD indices have significant impacts on the frequency of inversion occurrences only during their positive phases for two Nodes.
Although previous studies have also discussed the mechanisms for the formation of elevated and surface-based inversions for temperature and specific humidity [12,23], as far as we know, our study represents the first to investigate them on the intraseasonal time scales over the Arctic north of 70° N for the 1979–2017 period. Bourne et al. [15] noted the significant impact of the Pacific Decadal Oscillation (PDO) and the Northern Atlantic Oscillation (NAO) on surface-based temperature inversions in Alaska. However, a significant impact from PDO and NAO indices on elevated inversions over the Arctic Ocean is not seen in our study.
Our research focuses only on boreal winters. The spatio-temporal pattern of elevated temperature and humidity inversions on intraseasonal time scales remains to be examined for other seasons. The SHEBA data are limited to the Arctic Pacific sector; more observational data from other sectors of the Arctic Ocean are needed.

Author Contributions

Conceptualization, L.Y.; Methodology, Q.Y., M.Z., and X.Z.; Formal analysis, L.Y.; Writing—original draft preparation, L.Y. and Q.Y.; Writing—review and editing, X.Z., D.H.L., X.W., and B.H.

Funding

This study was supported by the National Key Research and Development Program of China (No. 2017YFE0111700), the Opening Fund of Key Laboratory of Land Surface Process and Climate Change in Cold and Arid Regions, CAS (No. LPCC2018001, LPCC2018005), and the Opening fund of State Key Laboratory of Cryospheric Science (No. SKLCS-OP-2019-09). The National Center for Atmospheric Research is sponsored by the U.S. National Science Foundation.

Conflicts of Interest

The authors declare no conflict of interest.

References

  1. Tjernström, M.; Graverson, R.G. The vertical structure of the lower Arctic troposphere analyzed from observations and the ERA-40 reanalysis. Q. J. R. Meteorol. Soc. 2009, 135, 431–443. [Google Scholar] [CrossRef]
  2. Serreze, M.; Barrett, A.P.; Stroeve, J.C.; Kindig, D.N.; Holland, M.M. The emergence of suface-based Arctic amplification. Cryosphere 2009, 3, 11–19. [Google Scholar] [CrossRef]
  3. Bintanja, R.; Graversen, R.G.; Hazeleger, W. Arctic winter warming amplified by the thermal inversion and consequent low infrared cooling to space. Nat. Geosci. 2011, 4, 758–761. [Google Scholar] [CrossRef]
  4. Serreze, M.; Barry, R.G. Cambridge Atmopsheric and Space Science Series; The Arctic Climate System; Cambridge University Press: Cambridge, UK, 2014; p. 442. [Google Scholar]
  5. Barrie, L.A.; Bottenheim, J.W.; Schnell, R.C.; Crutzen, R.C.; Rasmussen, R.A. Ozone destruction and photochemical reactions at polar sunrise in the lower Arctic atmosphere. Nature 1988, 334, 1875–1883. [Google Scholar] [CrossRef]
  6. Oltmans, S.J.; Schnell, R.C.; Sheridan, P.J.; Peterson, R.E.; Li, S.M.; Winchester, J.W.; Tans, P.P.; Sturges, W.T.; Kahl, J.D.; Barrie, L.A. Seasonal surface ozone and filterable bromine relationship in the high Arctic. Atmos. Environ. 1989, 23, 2431–2441. [Google Scholar] [CrossRef]
  7. Bridgman, H.A.; Schnell, R.C.; Kahl, J.D.; Herbert, G.A.; Joranger, E. A major haze event near Point Barrow, Alaska: analysis of probable source regions and transport pathways. Atmos. Environ. 1989, 23, 2537–2549. [Google Scholar] [CrossRef]
  8. Schweiger, A.J.; Lindsay, R.W.; Varvus, S.; Francis, J.A. Relationships between Arctic sea ice and clouds during autumn. J. Climate 2008, 21, 4799–4810. [Google Scholar] [CrossRef]
  9. Sedlar, J.; Tjernström, M. Stratiform cloud-inversion characterization during the Arctic melt season. Boundary Layer Meteorol. 2009, 132, 455–474. [Google Scholar] [CrossRef]
  10. Morrison, H.; de Boer, G.; Feingold, G.; Harrington, J.; Shupe, M.D.; Sulia, K. Resilience of persistent Arctic mixed-phase clouds. Nat. Geosci. 2012, 5, 11–17. [Google Scholar] [CrossRef]
  11. Qiu, S.; Dong, X.; Xi, B.; Li, J.-L.F. Characterizing Arctic mixed-phase cloud structure and its relationship with humidity and temperature inversion using NSA observations. J. Geophys. Res. Atmos. 2015, 120, 7737–7746. [Google Scholar] [CrossRef]
  12. Przybylak, R. The Climate of the Arctic; Springer International Publishing: Cham, Switzerland, 2016; p. 287. [Google Scholar]
  13. Stramler, K.; Genio, A.D.D.; Rossow, W.B. Synoptically driven Arctic winter states. J. Climate 2011, 24, 1747–1762. [Google Scholar] [CrossRef]
  14. Zaitseva, N.A.; Skony, S.M.; Kahl, J.D. Temperature inversions over the western Arctic from radiosonde data. Russ. Meteorol. Hydrol. 1996, 6, 6–17. [Google Scholar]
  15. Bourne, S.M.; Bhatt, U.S.; Zhang, J.; Thoman, R. Surface based temperature inversions in Alaska from a climate perspective. Atmos. Res. 2010, 95, 353–366. [Google Scholar] [CrossRef]
  16. Uttal, T.; Curry, J.A.; Mcphee, M.G.; Perovich, D.K.; Moritz, R.E.; Maslanik, J.A.; Guest, P.S.; Stern, H.L.; Moore, J.A.; Turenne, R.; et al. Surface heat budget of the Arctic Ocean. Bull. Am. Meteorol. Soc. 2002, 83, 255–275. [Google Scholar] [CrossRef]
  17. Wetzel, C.; Brümmer, B. An Arctic inversion climatology based on the European Centre Reanalysis ERA-40. Meteorologische Zeitschrift 2011, 20, 589–600. [Google Scholar] [CrossRef]
  18. Liu, Y.; Key, J.R. Detection and analysis of clear sky, low-level atmospheric temperature inversions with MODIS. J. Atmos. Ocean Technol. 2003, 20, 1727–1737. [Google Scholar] [CrossRef]
  19. Liu, Y.; Key, J.R.; Schweiger, A.; Francis, J. Characteristics of satellite-derived clear-sky atmospheric temperature inversion strength in the Arctic, 1980–96. J. Climate 2006, 19, 4902–4913. [Google Scholar] [CrossRef]
  20. Devasthale, A.; Willén, U.; Karlsson, K.-G.; Jones, C.G. Quantifying the clear-sky temperature inversion frequency and strength over the Arctic Ocean during summer and winter seasons from AIRS profiles. Atmos. Chem. Phys. 2010, 10, 2835–2858. [Google Scholar] [CrossRef]
  21. Pavelsky, T.M.; Boé, J.; Hall, A.; Fetzer, E.J. Atmospheric inversion strength over polar oceans in winter regulated by sea ice. Clim. Dyn. 2011, 36, 945–955. [Google Scholar] [CrossRef]
  22. Change, L.; Song, S.; Feng, G.; Zhang, Y.; Gao, G. Assessment of the uncertainties in Arctic low-level temperature inversion characteristics in Radio Occultation observations. IEEE Trans. Geosci. Remote Sens. 2017, 55. [Google Scholar] [CrossRef]
  23. Solomon, A.; Shupe, M.D.; Person, P.O.G.; Morrison, H. Moisture and dynamical interactions maintaining decoupled Arctic mixed-phase stratocumulus in the presence of a humidity inversion. Atmos. Chem. Phys. 2011, 11, 10127–10148. [Google Scholar] [CrossRef] [Green Version]
  24. Tjernström, M.; Birch, C.E.; Brooks, I.M.; Shupe, M.D.; Persson, P.O.G.; Sedlar, J.; Mauritsen, T.; Leck, C.; Paatero, J.; Szczodrak, M.; et al. Meteorological conditions in the central Arctic summer during the Arctic summer cloud ocean study (ASCOS). Atmos. Chem. Phys. 2012, 12, 6863–6889. [Google Scholar] [CrossRef]
  25. Treffeisen, R.; Krejci, R.; Ström, J.; Engvall, A.C.; Herber, A.; Thomason, L. Humidity observations in the Arctic troposphere over Ny-Ålesund, Svalbard based on 15 years of radiosonde data. Atmos. Chem. Phys. 2007, 7, 2721–2732. [Google Scholar] [CrossRef] [Green Version]
  26. Vihma, T.; Kilpeläinen, T.; Manninen, M.; Sjöblom, A.; Jakobson, E.; Palo, T.; Jaagus, J.; Maturilli, M. Characteristics of temperature and humidity inversions and low-level jets over Svalbard fjords in spring. Adv. Meteorol. 2011, 486807. [Google Scholar] [CrossRef]
  27. Devasthale, A.; Sedlar, J.; Tjernström, M. Characteristics of water-vapour inversions observed over the Arctic by Atmospheric Infrared Sounder (AIRS) and radiosondes. Atmos. Chem. Phys. 2011, 11, 9813–9823. [Google Scholar] [CrossRef] [Green Version]
  28. Nygård, T.; Valkonen, T.; Vihma, T. Characteristics of Arctic low-tropospheric humidity inversions based on radiao soundings. Atmos. Chem. Phys. 2013, 14, 1959–1971. [Google Scholar] [CrossRef]
  29. Brunke, M.A.; Stegall, S.T.; Zeng, X. A climatology of tropospheric humidity inversions in five reanalyses. Atmos. Res. 2015, 153, 165–187. [Google Scholar] [CrossRef] [Green Version]
  30. Vömel, H.; Selkirk, H.; Miloshevich, L.; Valverde-Canossa, J.; Valdés, J.; Kyrö, E.; Kivi, R.; Stolz, W.; Peng, G.; Diaz, J.A. Radiation dry bias of the Vaisala RS92 humidity sensor. J. Atmos. Oceanic Technol. 2007, 24, 953–963. [Google Scholar] [CrossRef]
  31. The Surface Heat Balance of the Arctic (SHEBA). Available online: https://www.eol.ucar.edu/projects/sheba/ (accessed on 1 April 2019).
  32. Dee, D.P.; Uppala, S.M.; Simmons, A.J.; Berrisford, P.; Poli, P.; Kobayashi, S.; Andrae, U.; Balmaseda, M.A.; Balsamo, G.; Bauer, P.; et al. The ERA-Interim reanalysis: configuration and performance of the data assimilation system. Q. J. R. Meteorol. Soc. 2011, 137, 553–597. [Google Scholar] [CrossRef] [Green Version]
  33. Uppala, S.; Kallberg, P.; Simmons, A.J.; Andrae, U.; Bechtold, V.D.C.; Fiorino, M.; Gibson, J.K.; Haseler, J.; Hernandez, A.; Kelly, G.A.; et al. The ERA-40 reanalysis. Q. J. R. Meteorol. Soc. 2005, 131, 2961–3012. [Google Scholar] [CrossRef]
  34. Screen, J.S.; Simmonds, I. Erroneous Arctic temperature trends in the ERA-40 reanalysis: A closer look. J. Climate 2011, 24, 2620–2627. [Google Scholar] [CrossRef]
  35. Jakobson, E.; Vihma, T.; Palo, T.; Jakobson, L.; Keernik, H.; Jaagus, J. Validation of atmospheric reanalyses over the central Arctic Ocean. Geophys. Res. Lett. 2012, 39. [Google Scholar] [CrossRef] [Green Version]
  36. Kohonen, T. Self-Organizing Maps; Springer: New York, NY, USA, 2001; p. 501. [Google Scholar]
  37. Hewitson, B.C.; Crane, R.G. Self-organizing maps: Applications to synoptic climatology. Climate Res. 2002, 22, 13–26. [Google Scholar] [CrossRef]
  38. Johnson, N.C.; Feldstein, S.B.; Tremblay, B. The continuum of Northern Hemisphere teleconnection patterns and a description of the NAO shift with the use of self-organizing maps. J. Climate 2008, 21, 6354–6371. [Google Scholar] [CrossRef]
  39. Johnson, N.C.; Feldstein, S.B. The continuum of North Pacific sea level pressure patterns: Intraseaosnal, interannual, and interdecadal variability. J. Climate 2010, 23, 851–867. [Google Scholar] [CrossRef]
  40. Lee, S.; Feldstein, S.B. Detecting ozone-and greenhouse gas-driven wind trends with observational data. Science 2013, 339, 563–567. [Google Scholar] [CrossRef] [PubMed]
  41. Horton, D.E.; Johnson, N.C.; Singh, D.; Swain, D.L.; Rajaratnam, B.; Diffenbaugh, N.S. Contribution of changes in atmospheric circulation patterns to extreme temperature trends. Nature 2015, 522, 465–471. [Google Scholar] [CrossRef] [PubMed]
  42. Thompson, D.; Wallace, J. The Arctic Oscillation signature in the wintertime geopotential height and temperature fields. Geophys. Res. Lett. 1998, 25, 1297–1300. [Google Scholar] [CrossRef]
  43. Wu, B.; Wang, J.; Walsh, J.E. Dipole Anomaly in the Winter Arctic Atmosphere and Its Association with Sea Ice Motion. J. Climate 2006, 19, 210–225. [Google Scholar] [CrossRef]
  44. Yoo, C.; Feldstein, S.; Lee, S. The prominence of a tropical convective signal in the wintertime Arctic temperature. Atmos. Sci. Let. 2013, 15, 7–12. [Google Scholar] [CrossRef] [Green Version]
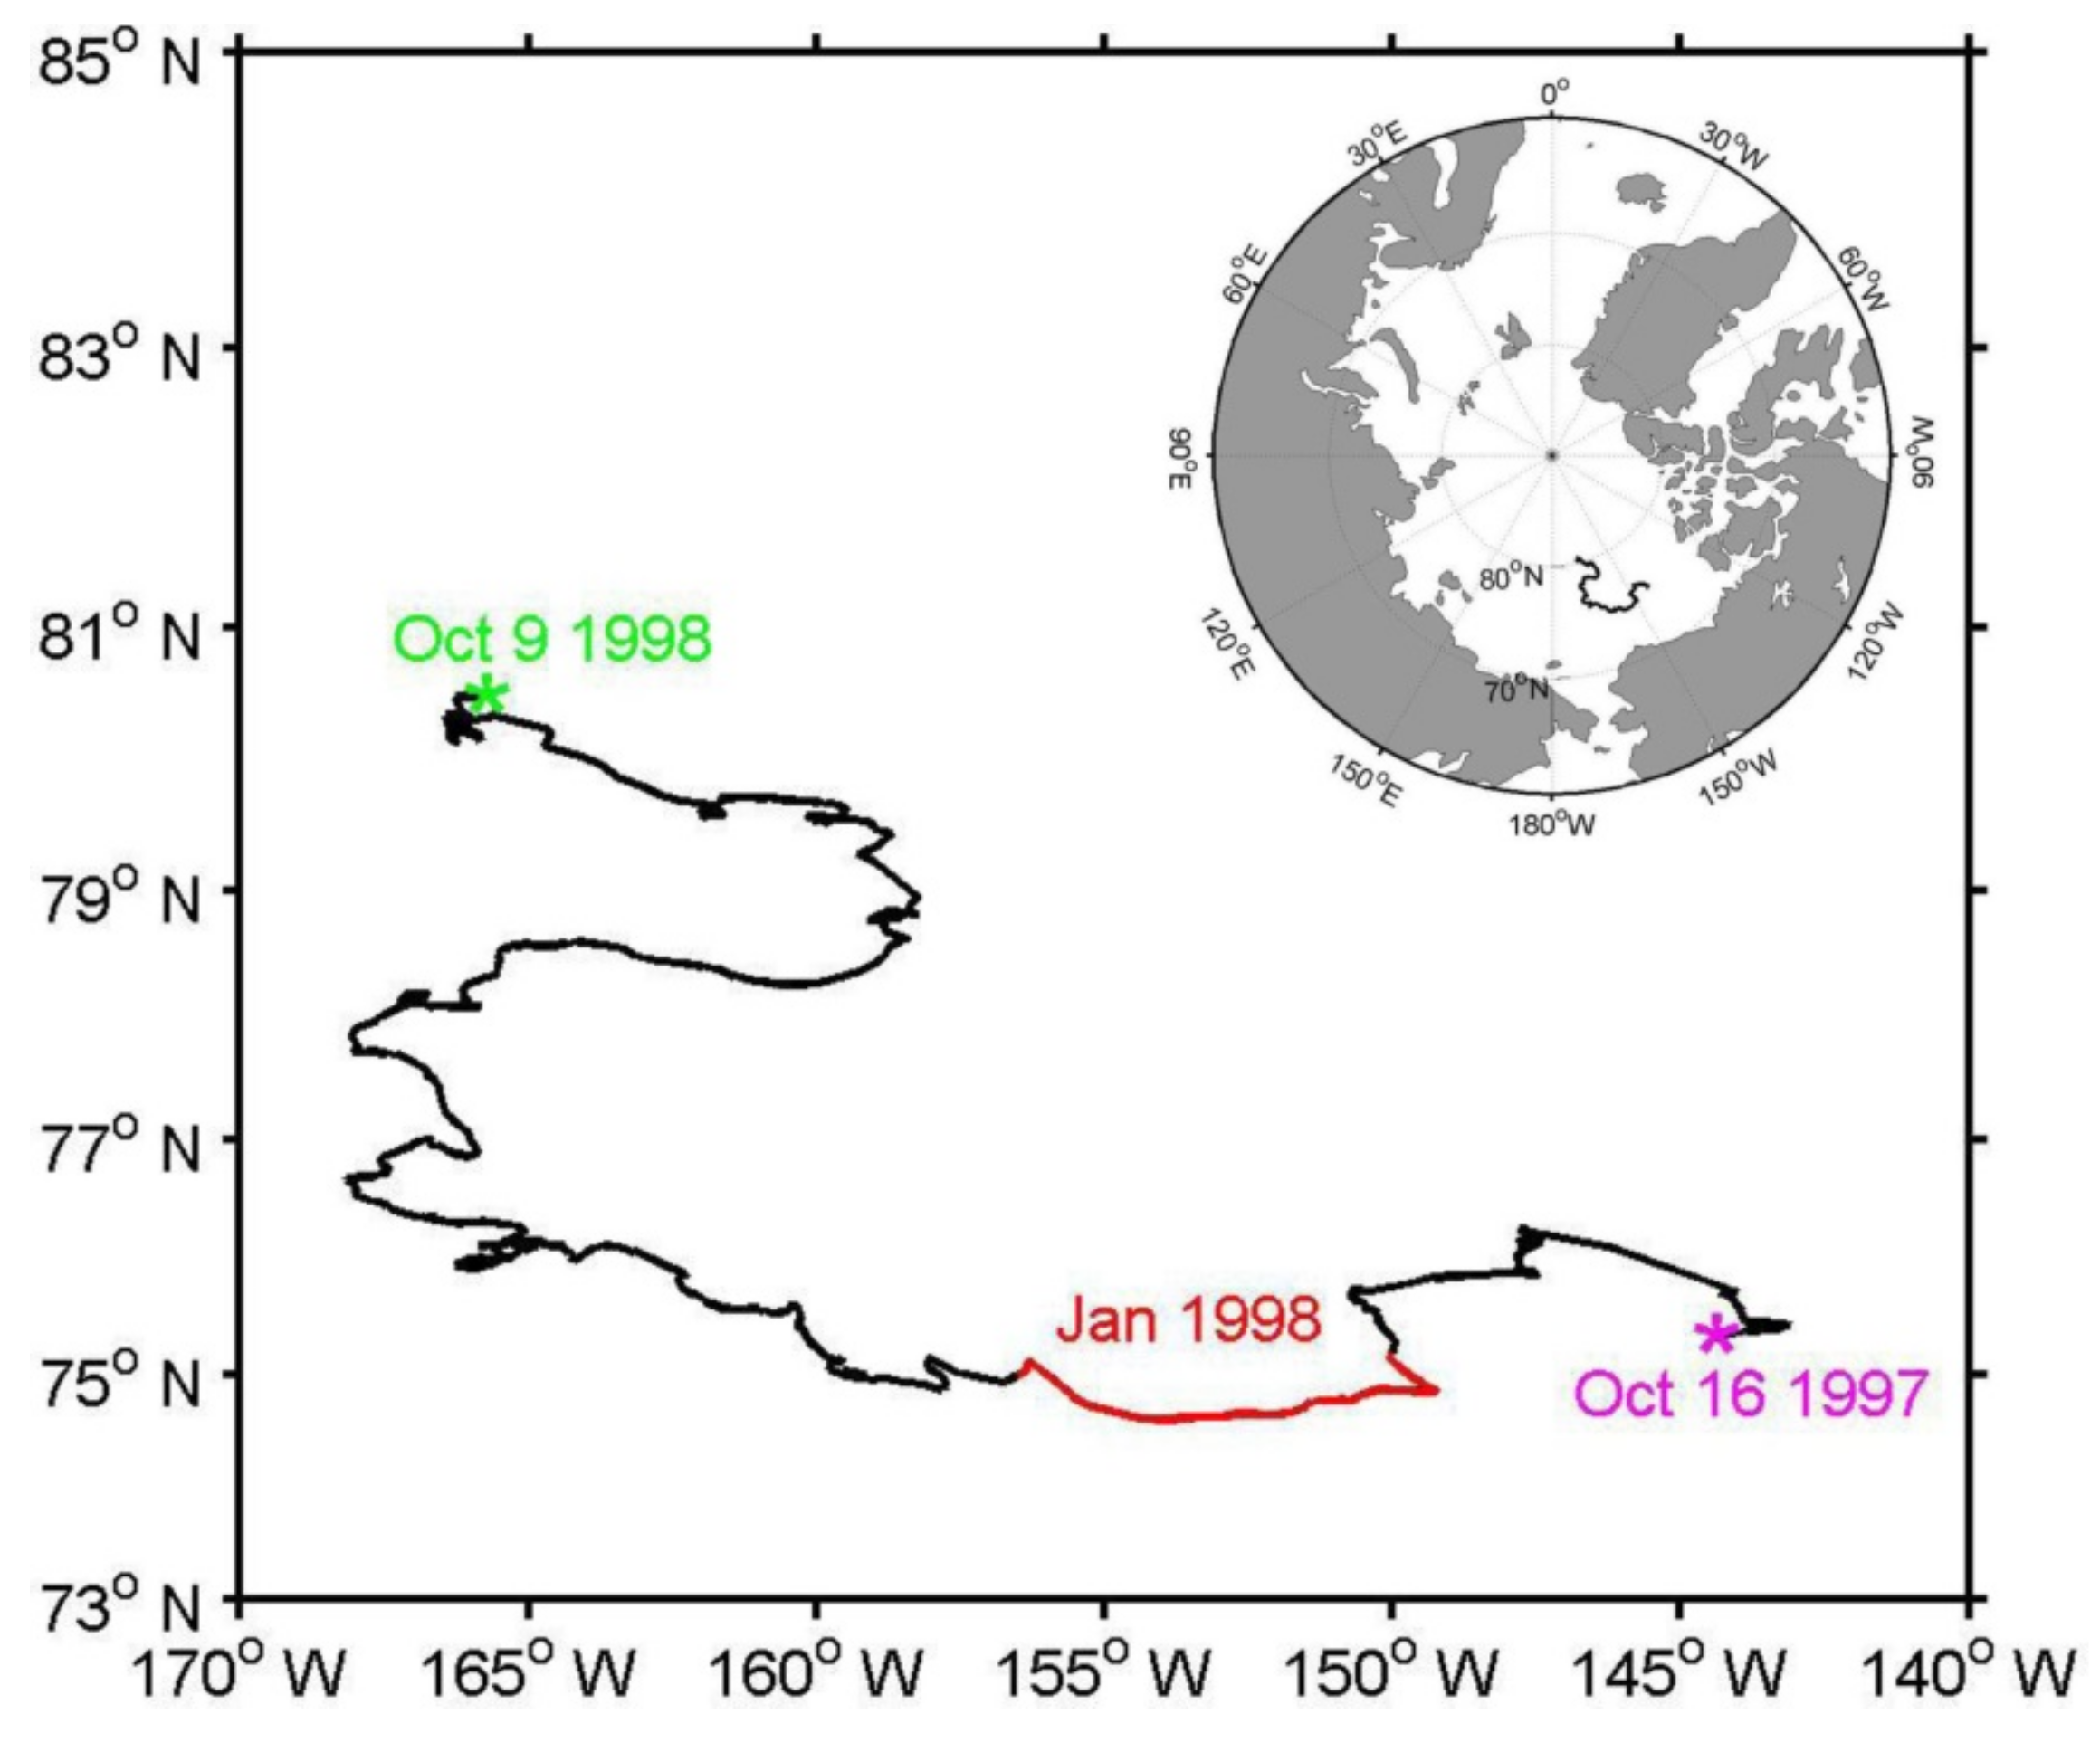
Figure 1. The track of the Surface Heat Balance of the Arctic (SHEBA) camp. The pink (green) asterisk denotes the starting (end) location. The red line indicates the track during January 1998.
Atmosphere 10 00214 g001
Figure 2. Cross-sections of temperature (°C) (a) and specific humidity (g/kg) (b) obtained from SHEBA radiosonde profiles during January 1998. The track during this period is shown in Figure 1 (red line).
Atmosphere 10 00214 g002
Figure 3. The SHEBA radiosonde profiles of temperature (°C) (a) and specific humidity (g/kg) (b) for three days in January 1998.
Atmosphere 10 00214 g003
Figure 4. Spatial patterns of 500-hPa geopotential height (gpm) (contour) and 850-hPa temperature (°C) (shading) (a,c,e) and 850-hPa wind field (m s-1) (vector) and specific humidity (g/kg) (contour) (b,d,f) on 5 January 1998 (a,b); 15 January 1998 (c,d); 29 January 1998 (e,f) from the European Centre for Medium-Range Forecasts (ECMWF) Reanalysis (ERA)-Interim reanalysis. The pink asterisk denotes the SHEBA camp site.
Atmosphere 10 00214 g004
Figure 5. The same as in Figure 4 except for downward surface longwave radiation (106 W m−2) (contour) and total cloud cover (shading) (a,c,e) and vertical velocity (Pa s−1; downward velocity is positive) at 850 hPa (b,d,f).
Atmosphere 10 00214 g005
Figure 6. The wavelet power spectrum (left) and the global wavelet spectrum (right) for wintertime temperature (a) and specific humidity (b) differences between 850 and 950 hPa at the location (75° N, 155° W) for the 1979–2016 period.
Atmosphere 10 00214 g006
Figure 7. Temperature (units: °C) (contour) and specific humidity inversion (units: 0.1 g kg−1) inversion pattern from the self-organizing map (SOM) analysis of the wintertime 10–60-day filtered temperature and specific humidity difference between 850 and 950 hPa at a 4 × 4 grid for the 1979–2017 period. The percentage at the top left of each panel indicates the frequency of occurrences of the pattern. The pink lines denote the track of the SHEBA campaign during January 1998.
Atmosphere 10 00214 g007
Figure 8. Spatial patterns of the first two modes of the Empirical Orthogonal Function (EOF) analysis of the wintertime 10–60-day filtered temperature differences between 850 and 950 hPa (units: °C) for the 1979–2017 period. The pink lines denote the track of the SHEBA campaign during January 1998.
Atmosphere 10 00214 g008
Figure 9. The 500-hPa potential height (gpm) (contour) and total cloud cover (shading) composite for each SOM pattern. The pink lines denote the track of the SHEBA campaign during January 1998.
Atmosphere 10 00214 g009
Figure 10. Time series of occurrence numbers in each season for each SOM pattern in Figure 9. The 1979 winter season includes December 1979, January 1980, and February 1980.
Atmosphere 10 00214 g010
Figure 11. Time series of the normalized wintertime Arctic Oscillation (AO) in (a) and Artic Dipole (AD) indices in (b). Red and blue lines denote the limits of 1 and −1, respectively.
Atmosphere 10 00214 g011