Article

Surface Energy Partitioning and Evaporative Fraction in a Water-Saving Irrigated Rice Field

1
College of Agricultural Engineering, Hohai University, Nanjing 210098, China
2
State Key Laboratory of Hydrology-Water Resources and Hydraulic Engineering, Hohai University, Nanjing 210098, China
3
Key Laboratory of Efficient Irrigation-Drainage and Agricultural Soil-Water Environment in Southern China (Hohai University), Ministry of Education, Nanjing 210098, China
*
Authors to whom correspondence should be addressed.
Atmosphere 2019, 10(2), 51; https://doi.org/10.3390/atmos10020051
Submission received: 24 October 2018 / Revised: 3 January 2019 / Accepted: 17 January 2019 / Published: 28 January 2019
(This article belongs to the Section Biosphere/Hydrosphere/Land–Atmosphere Interactions)

Abstract

:
Surface energy distribution in paddy fields and the ratio of latent heat flux (LE) to available energy, termed as the evaporative fraction (EF), are essential for an understanding of water and energy processes. They are expected to vary in different ways in response to changes in the soil moisture condition under water-saving irrigation practice. In this study, the diurnal and seasonal variations in energy distribution were examined based on the data measured by the eddy covariance system and corrected with enforcing energy balance closure by the EF method in water-saving irrigated rice paddies in 2015 and 2016. Soil heat flux (G) values were similar in magnitude to sensible heat flux (Hs) values, with both accounting for approximately 5% of the energy input. Both magnitudes of G and Hs were significantly lower than that of LE. Generally, EF in water-saving irrigated rice paddies was larger than that of other ecosystems, and varied within a narrow range from 0.7 to 1.0. Diurnally, EF decreased till noon and then increased slowly in the afternoon till sunset. It was found be less varied between 10:00 and 14:00. Seasonally, the alternative drying-wetting soil water conditions in water-saving irrigated rice paddies resulted in a change in the variation of the EF. The LE flux is the largest component of available energy, with EF being mostly higher than 0.9. EF, increasing consistently till the tillering stage, remaining high from the late tillering to milk stage, and then following a declining trend. The maximum EF (approaching 1.0) was found in the milk stage. The results of EF in water-saving irrigated rice paddies will be helpful for estimating daily or long temporal scale evapotranspiration (ET) by the EF method based on satellite-derived ET.

1. Introduction

Surface energy budgets and partitioning in different terrestrial ecosystems are essential prerequisites for understanding the regional hydro-thermal cycle and climate change. The energy partition has been shown to be affected by various environmental factors and biological characteristics of underlying vegetation [1,2,3], whereas surface energy partitioning affects the microclimate conditions (such as temperature, humidity) within the plant canopy and eventually, plant growth [4,5].
The surface energy budget has been measured in many different terrestrial ecosystems using the eddy covariance (EC) technique. However, the energy fluxes measured by the EC system are not completely closed due to the systematic and random errors, as indicated in the literature [6,7,8,9,10,11]. For flux data collected following the procedure of quality control, gap filling, and soil heat storage correction, the underestimation of turbulent fluxes was found to be a major contributor to the energy closure problem [12,13,14,15,16,17,18]. Thus, practice for enforcing energy balance closure should be studied and implemented before the energy budget is evaluated.
Evaporative fraction (EF), which is defined as the ratio of latent heat flux to the available energy, plays an important role in interpreting the components of surface available energy, and improving the accuracy of field evapotranspiration (ET) estimation based on an energy balance algorithm [19,20,21,22]. It has been shown to vary in different behaviors and characteristics in response to the vegetation coverage [23], rainfall events [24], successions of wet and dry periods [25], vapor pressure deficit, and vegetation photosynthesis activity [26]. EF has been examined over several different vegetation land surfaces, such as grassland [27], rangeland [21], Vineyard [28], banana crop [29], and wheat and corn land [30]. Energy partitioning has been measured in flooding paddy fields since the 1950s [5,31,32,33,34]. For rainfed rice fields in eastern India, EF was found to be 79–82% in different cultivars and seasons, with a gentle broad peak from the maximum tillering stage to the heading stage [35]. Higuchi et al. [26] found that the value of EF in flooded rice fields was always close to one, due to the fact that soil is flooding in rice fields or the soil moisture is almost saturated. The variations of surface energy balance components and EF in the rice ecosystem are different from those in upland crops due to the flooding or saturated soil moisture conditions [34,36,37]. Moreover, EF, as a water availability factor, can significantly increase the convenience and accuracy in estimating the daily ET at the regional or global scale by the remote sensing method [38,39,40], but whether the method performs well or not in rice areas is still unknown.
Rice is the main staple food in South and East Asia, especially in the middle and lower reaches of the Yangtze River in China [41]. Meanwhile, China is one of 13 countries with severe water shortages. In 2016, China’s total agricultural water consumption accounted for 62.4% of the total water use in the country [42], and about two thirds of the total water used in agriculture is for rice production. Improving the irrigation water use efficiency for rice is vitally important for China, to cope with water scarcity. In addition, the implementation of water-saving irrigation (WSI) in paddy rice led to alternative drying-wetting conditions and change in phenological characteristics, which is quite different from upland (either irrigated or non-irrigated) crop ecosystems or flooding rice paddies. This results in changes in energy partitioning, soil moisture content, crop growth, and heat and vapor flux transfer between rice paddies and atmosphere [43,44,45].
However, knowledge on the energy balance and partition is rare for WSI rice paddies. The fraction of LE/Rn in WSI paddy fields is considered larger than that in dry crops, but it is not clear whether this fraction is smaller than that of flooded rice fields. The variation of LE and Hs is considered different from that under any other soil moisture condition. The main objectives of this study included: documenting energy balance partitioning and EF variation at hourly, daily, and seasonal scales along rice growth under the WSI condition in east China; and discussing the effect of soil moisture on EF, which is of great theoretical and practical significance in simulating the hydrothermal conversion further and estimating the daily or long temporal scale ET by the remote sensing method.

2. Materials and Methods

2.1. Site Description and Field Management

Field measurements were conducted during the rice seasons of 2015 and 2016 at the Kunshan Irrigation and Drainage Experiment Station of Jiangsu Province (N 31°15′15″, E 120°57′43″). This area has a subtropical monsoon climate, with an annual precipitation of 1,097.1 mm and an annual evaporation (measured by E601 evaporation pan) of 1365.9 mm. The average daily temperature (Ta) and relative humidity (RH) were 24.6 °C and 81.5% during the rice season, respectively. The prevailing wind was south-east trade. The site was flat in terrain, and extended approximately 200 m in all directions. The paddy soil was hydragric anthrosol. In the top 0–20 cm soil, the bulk density was 1.3 g cm−3. The volumetric saturated soil moisture (θs), field capacity (θf), and wilting point (θw) were 0.502, 0.392, and 0.179 m3, respectively. Rice seedlings, at a row spacing of 0.23 m and plant spacing of 0.16 m, were transplanted on 27 June 2015 and 1 July 2016. The rice fields in all directions were irrigated according to local water-saving irrigation (WSI) practice. Thus, it is expected that the source range of measurement chosen in the current research will be sufficiently representative. Therefore, the paddy soil was non-flooded during most of the rice season. The paddy soil was irrigated when the soil moisture approached low thresholds, which are different in various growth stages, as reported by Xu et al. [46]. The detailed records of irrigation events are listed in Table 1. Fertilizers and pesticides were applied to the WSI rice field according to the local farmer’s practice.

2.2. Flux Data Measurement and Data Processing

An open-path EC system was installed at the site to measure the water and heat fluxes over the rice fields, with a fetch of approximately 200 m in all directions. The EC system, which aligned perpendicularly to the prevailing wind direction (southeast direction), was composed of a CSAT3A sonic anemometer (Campbell Scientific Inc., Logan, Utah, USA) and an EC150 open-path infrared gas analyzer (Campbell Scientific Inc., Logan, Utah, USA), operating at a frequency of 10 Hz at 2.5 m above the soil surface. The net radiation (Rn) was measured at 1.5 m above the soil surface with a CNR4 radiometer (Kipp & Zonen, Delft, Holland). The soil heat flux (Gs) was measured at 0.08 m beneath the soil surface using HFP01SC heat flux plates (Campbell Scientific Inc., Logan, Utah, USA). The volumetric soil moisture content (θ) and the soil temperature (Ts) were measured at 0.10, 0.20, and 0.30 m depths by CS616 soil moisture sensors (Campbell Scientific Inc. Logan, Utah, USA.) and 109 TCAV soil thermocouple probes (Campbell Scientific Inc. Logan, Utah, USA). Rn, Gs, θ, and Ts were recorded automatically at 30-min intervals. Simultaneously, Rn, Gs, θ, relative humidity (RH), wind speed (U), precipitation (Pr), Ta, and Ts were also recorded every 30 min by an automatic meteorological station (WS-STD1, DELTA-T, London, UK), to ensure the quality and integrity of data and ensure that the data gaps were filled for EC measurement.
For the data quality control of the EC measurement, raw data were processed by EdiRe, and necessary corrections (e.g., coordinate rotation via 2D rotation, sonic virtual temperature conversion for sensible heat flux, density fluctuation correction for latent heat flux, spectral loss correction, and spike detection) were applied following the procedure outlined in the literature [47,48,49,50]. Then, the flux data were averaged every 30 min block [51]. The source area was estimated through the same approach as taken by Kljun et al. [52] and Aubinet et al. [53], and the fluxes were discarded when the calculated footprint was beyond the edge of the region, which originated within a distance of 100–120 m upwind of the EC stations [54]. The flux data were filtered when the friction velocity (u*) was lower than the threshold of 0.1 m s−1 [47]. Finally, the data gaps, accounting for approximately 22% of the entire rice season from 2015 to 2016, were determined by linear interpolation (for gap within 3 h) or by a mean diurnal average method within a 10-day window for long data gaps [55].

2.3. Energy Balance Equation and Heat Storage Calculation

If the energy converted into chemical energy by green plants and the horizontal flow of energy caused by the advection between the soil surface and the level of the eddy covariance instrument are negligible, the surface energy balance Equation in the rice field is simplified as:
LE + Hs = Rn G S
where LE, Hs, Rn, G, and S represent the latent heat flux, sensible heat flux, net radiation, surface soil heat flux, and canopy heat storage in the biomass, respectively (units: W m−2).
Surface soil heat flux (G) is an important component of the surface energy balance closure [2,7,14]. Several methods, including the calorimetric method and those based on analytical solutions of the heat diffusion Equation, were developed and compared by Russell et al. [56] and Gao et al. [17] to estimate the surface soil heat flux. The calorimetric method, the most common approach which combines the soil heat flux plate approach and calorimetry, was followed in the current research. Thus, surface soil heat flux was calculated as G = Gs + Q, with Gs being the soil heat flux measured at 8 cm beneath the soil surface and Q being the change in soil heat storage in 0–8 cm surface soil [57,58].
According to our results, the canopy heat storage S, calculated by the concentration profile method, was low and mostly fell in the range of −10 to 10 W m−2; this range accounted for less than 2% of the available energy during the rice season [7], and it was thus neglected [59].

2.4. Evaluation of Energy Balance Closure

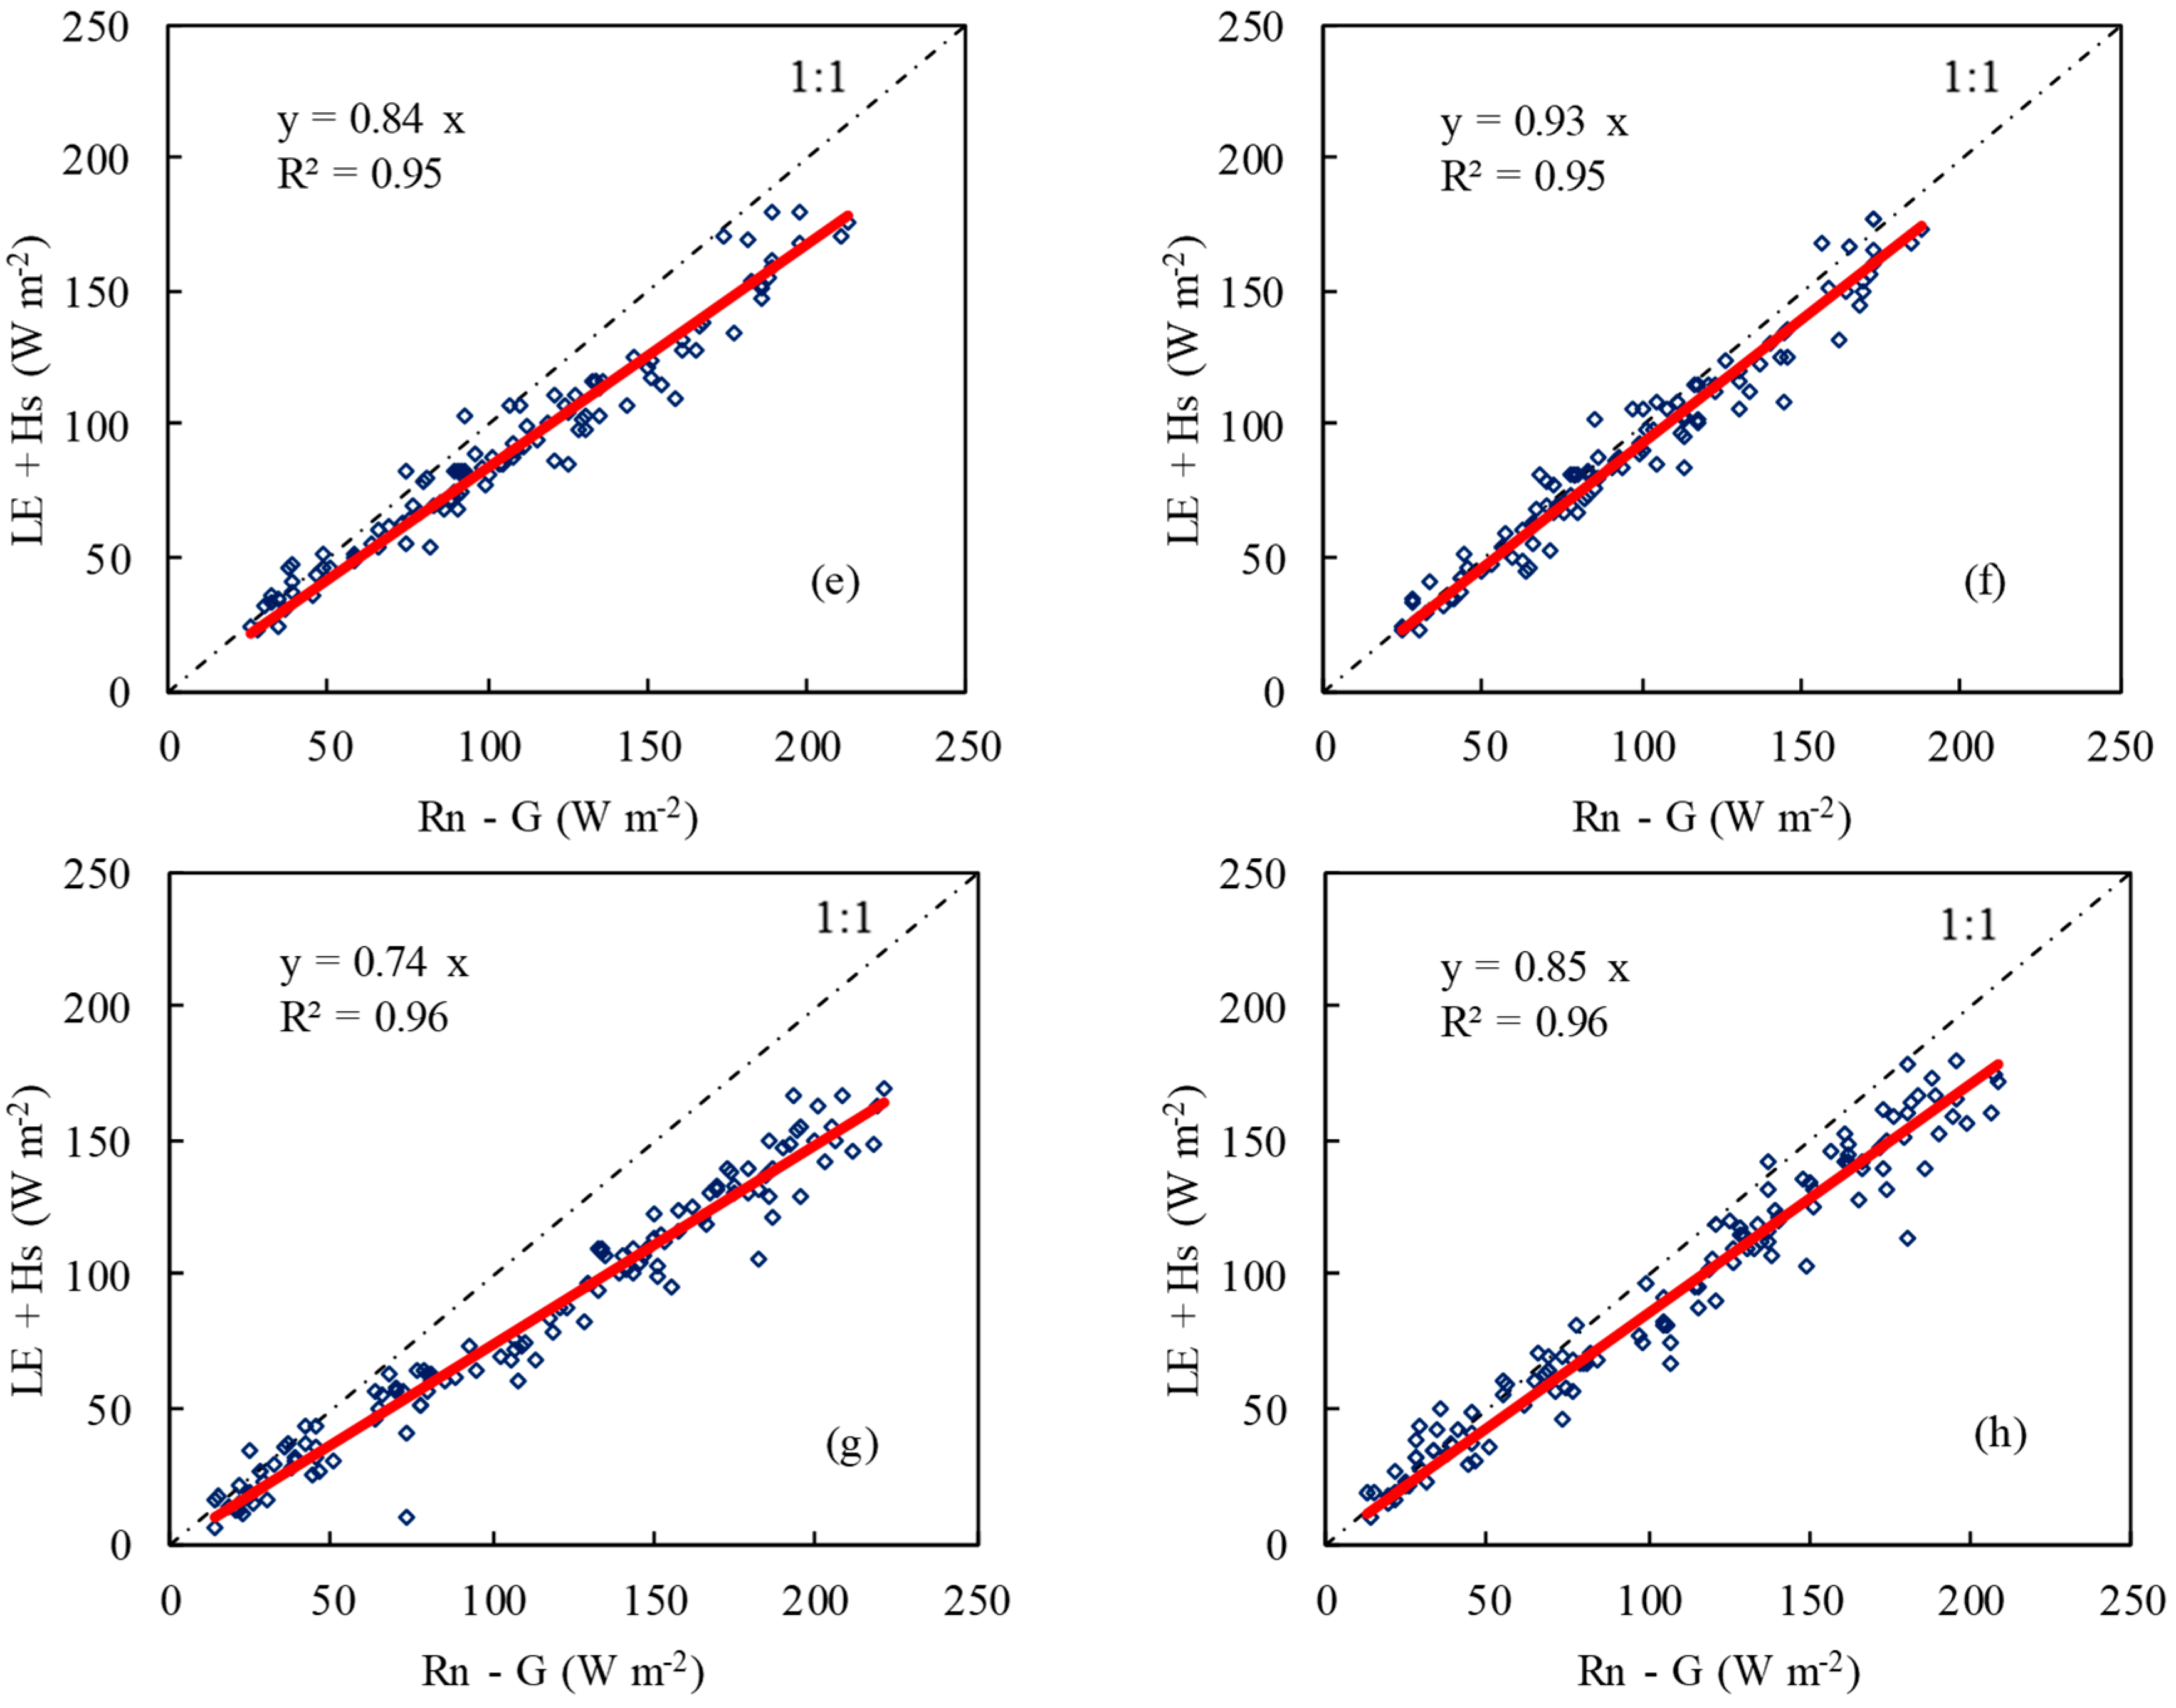
Energy balance closure was evaluated via the energy balance ratio (EBR) method, which was calculated based on the cumulative available energy (Rn – G) and turbulent energy fluxes (LE + Hs) over specific time periods. Both hourly and daily EBR were improved by including the fluxes correction [11] compared with the results for original measurements (Figure 1), with an average increase of 14.5% and 12.8% for the hourly and daily scale, respectively. Yet, the energy fluxes measured by the EC system are not completely closed after the correction due to the energy balance deficit problem, although the mean daily EBR (0.93 and 0.85 in 2015 and 2016 rice seasons, respectively) of the EC measurement in the WSI rice fields was acceptable.
Numerous studies assumed that the underestimation of turbulent fluxes appears to be a major contributor to the closure problem, especially the large eddies [7,18,60,61], for the data which was corrected by considering the energy storage items in the soil and canopy [12,14,62,63].

2.5. Evaporation Fraction and Enforcing Energy Balance Closure

An ideal energy balance closure can only be achieved when the available energy is equal to the turbulent fluxes, and then, EF can be expressed as [64]:
EF = LE LE + Hs = LE Rn G
By using Equation (2), EF can be calculated at either an hourly scale based on the average hourly LE and Rn − G, or at a daily scale based on the average daily LE and Rn − G.
The energy balance can be closed by distributing the energy balance deficit to the sensible and latent heat fluxes according to the EF closure method [8,9], which consists of three steps:
(1) The energy balance deficit (EBD) is determined using a 3-h moving window around the measurements, and the moving window of 3-h is a compromise according to Kessomkiat et al. [8]:
EBD 3 h = Rn 3 h ( G 3 h + LE 3 h + Hs 3 h )
All terms in Equation (3) are the same as those in Equation (2), and the superscript of 3h indicates that it was averaged over a 3-h moving window.
(2) It is assumed that the underestimation of the energy balance closure is entirely related to the underestimation of sensible and latent heat fluxes. The energy balance is closed by redistributing the energy balance deficit (EBD) according to the EF averaged over a certain period (Equation (4)). To reduce the uncertainty in daily EF, it was averaged over a window of seven-days centered around the observation before it was used for energy balance closure. When EF is outside the range 0 < EF < 1, it is adjusted to a minimum of 0 or a maximum of 1, respectively.
EF 7 d = LE 7 d LE 7 d + Hs 7 d
(3) The LE and Hs fluxes after the energy balance closing are given by:
LE = LE + EBD 3 h ( EF 7 d )
Hs = Hs + EBD 3 h ( 1 EF 7 d )
where LE* and Hs* are the latent and sensible heat fluxes after the energy balance closing, respectively.
A potential problem for the nighttime data is that ET is frequently near zero, and the use of an EF does not make sense. Meanwhile, the energy balance at night is greatly affected by the loss of flat flow and the friction wind speed, and the relative random error of the turbulent fluxes is amplified infinitely due to the small absolute value of fluxes [53,65]. Therefore, the night turbulent data are determined by the filter interpolation method [66], which removes the nighttime flux data according to the selected friction wind speed threshold (u*). In this study, u* = 0.3 m s−1 was chosen as the threshold [60], and the nighttime evapotranspiration for u* < 0.3 m s−1 was excluded. Then, a function between evapotranspiration and saturated water vapor pressure deficit (VPD) was established in the different growth stages of rice, which were used to fill the data gaps during the night time. The flux data analyzed below (LE, Hs and G) are all corrected values.

3. Results and Discussion

3.1. Diurnal Variation of Energy Budget Components and Evaporative Fraction

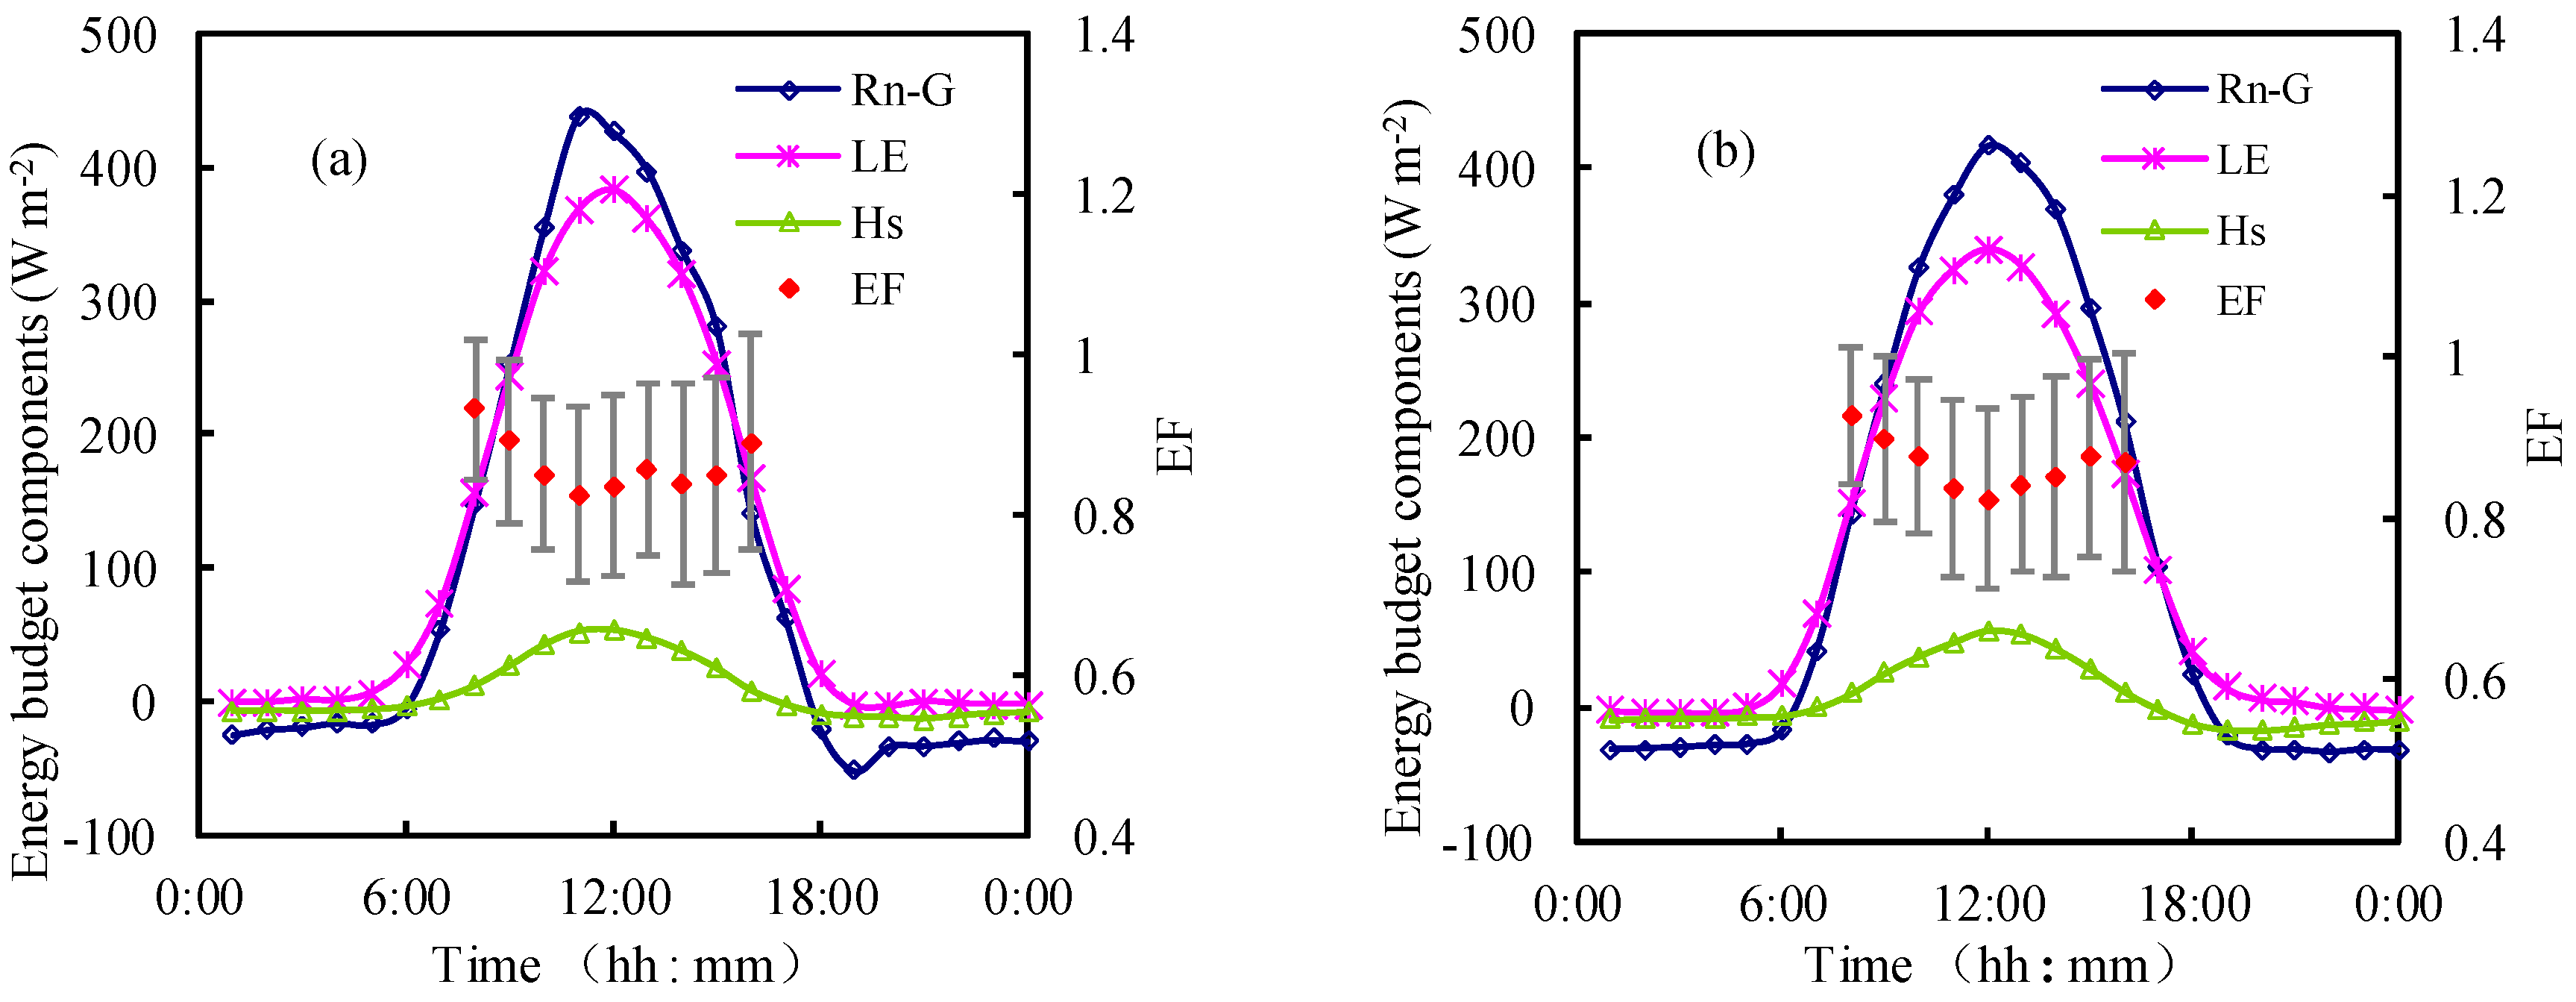
Throughout the rice seasons of 2015 and 2016, the diurnal courses of seasonal average hourly Rn − G, LE, and Hs and the EF follow a unimodal shape (Figure 2). Rn − G varied from –50 W m–2 to 0 W m–2 and varied slightly most of the night. During the daytime, Rn − G varied from 0 W m–2 to 438 W m–2, increasing with the increase of the solar radiation. In the WSI rice field, the mean Rn − G values reached the maximum of 438.3 W m–2 and 417.0 W m–2 at midday in the 2015 and 2016 rice seasons, respectively.
The average peak values of hourly LE and Hs were 383.1 W m–2 and 53.6 W m–2 in 2015, and were 339.8 W m–2 and 56.9 W m–2 in 2016, respectively. The value and diurnal variation amplitude of LE were much greater than those of Hs, due to the humid ambient air and soil conditions in the rice field. Hence, LE flux was the main component of net radiation, and the estimation of LE is the most important process in determining the energy and mass exchanges in a paddy field. Furthermore, LE was positive throughout the day, no matter whether the Rn − G was negative or positive, yet Hs was sometimes negative when the Rn − G was negative. This indicated that Hs was more sensitive to available energy than LE during the diurnal variation.
Given that Rn − G is near zero during the nighttime, the estimated EF fluctuated greatly and has no practical significance. Thus, only the estimated EF during the daytime from 7:00 to 16:00 was included in the following analysis. EF generally decreased till noon and then increased slowly in the afternoon till sunset, within a narrow range from 0.7 to 1.0. Furthermore, EF was found to be less varied during the time from 10:00 to 14:00. Compared with other ecosystems, the EF value in the current study was larger than the result by Li et al. [28], who reported that EF fluctuated slightly around the mean value of 0.34 in a vineyard in an arid area. It was also larger than the results for wheat (0.45–0.8), corn (0.35–0.55), and bare soil (0.2–0.35) in arid and semi-arid regions [67]. The higher EF in the WSI rice field might be ascribed to the high soil moisture and high VPD, which resulted in high ET. Figure 2 also indicates that the EF at noon is smaller than that at other times because the solar radiation is large at noon during the day, and the VPD is relatively low with high temperature. The value of EF fluctuates greatly before sunset among observation days, as seen from the error bar in Figure 2. This was ascribed to the large temperature variation, unstable atmospheric turbulence, and advection exchange at sunset, and the inaccurate instantaneous fluxes measurement by the EC system [11]. In addition, the EF was occasionally greater than 1 during the transition periods in the morning or evening (at 7:00–8:00 and 15:00–16:00). This indicates that Hs is negative and the atmosphere releases heat during that time, similar to the oasis effect in the irrigated cotton field [18,61].

3.2. Characteristics of Energy Budget Distribution during Each Growth Period

The energy partitioning in different rice growth stages under the water-saving irrigation practice is similar in 2015 and 2016 (Table 1). The LE flux is the largest component of available energy, accounting for 88.2% and 89.8% of the net radiation in the 2015 and 2016 rice seasons, respectively. The ratio of LE/Rn was greater than that for cotton (approximately 0.7) in arid regions [68,69], and for paddy rice (0.67) in the Sanjiang plain of China [70]. Seasonally, LE/Rn increased consistently till the tillering stage, remained high from the late tillering to milk stage, and then followed a declining trend. In 2015, the maximum LE/Rn was 0.965, which occurred in the jointing stage as a result of high crop transpiration and soil evaporation. In 2016, the maximum ratio was 0.966, which occurred in the milk maturity stage, later than that in 2015. The difference suggests that the proportion of net radiation converted to latent heat was affected by the crop growth and meteorological conditions, and varied among different years.
Table 1 also shows that the ratios of Hs/Rn and G/Rn were both less than 0.1, except in the regreening period, and exhibited no obvious trend in each growth period. The average values of Hs/Rn and G/Rn in the 2015 rice season were 0.059 and 0.058, respectively, and were 0.058 and 0.044 in 2016, respectively.

3.3. Seasonal Variation of Daily EF

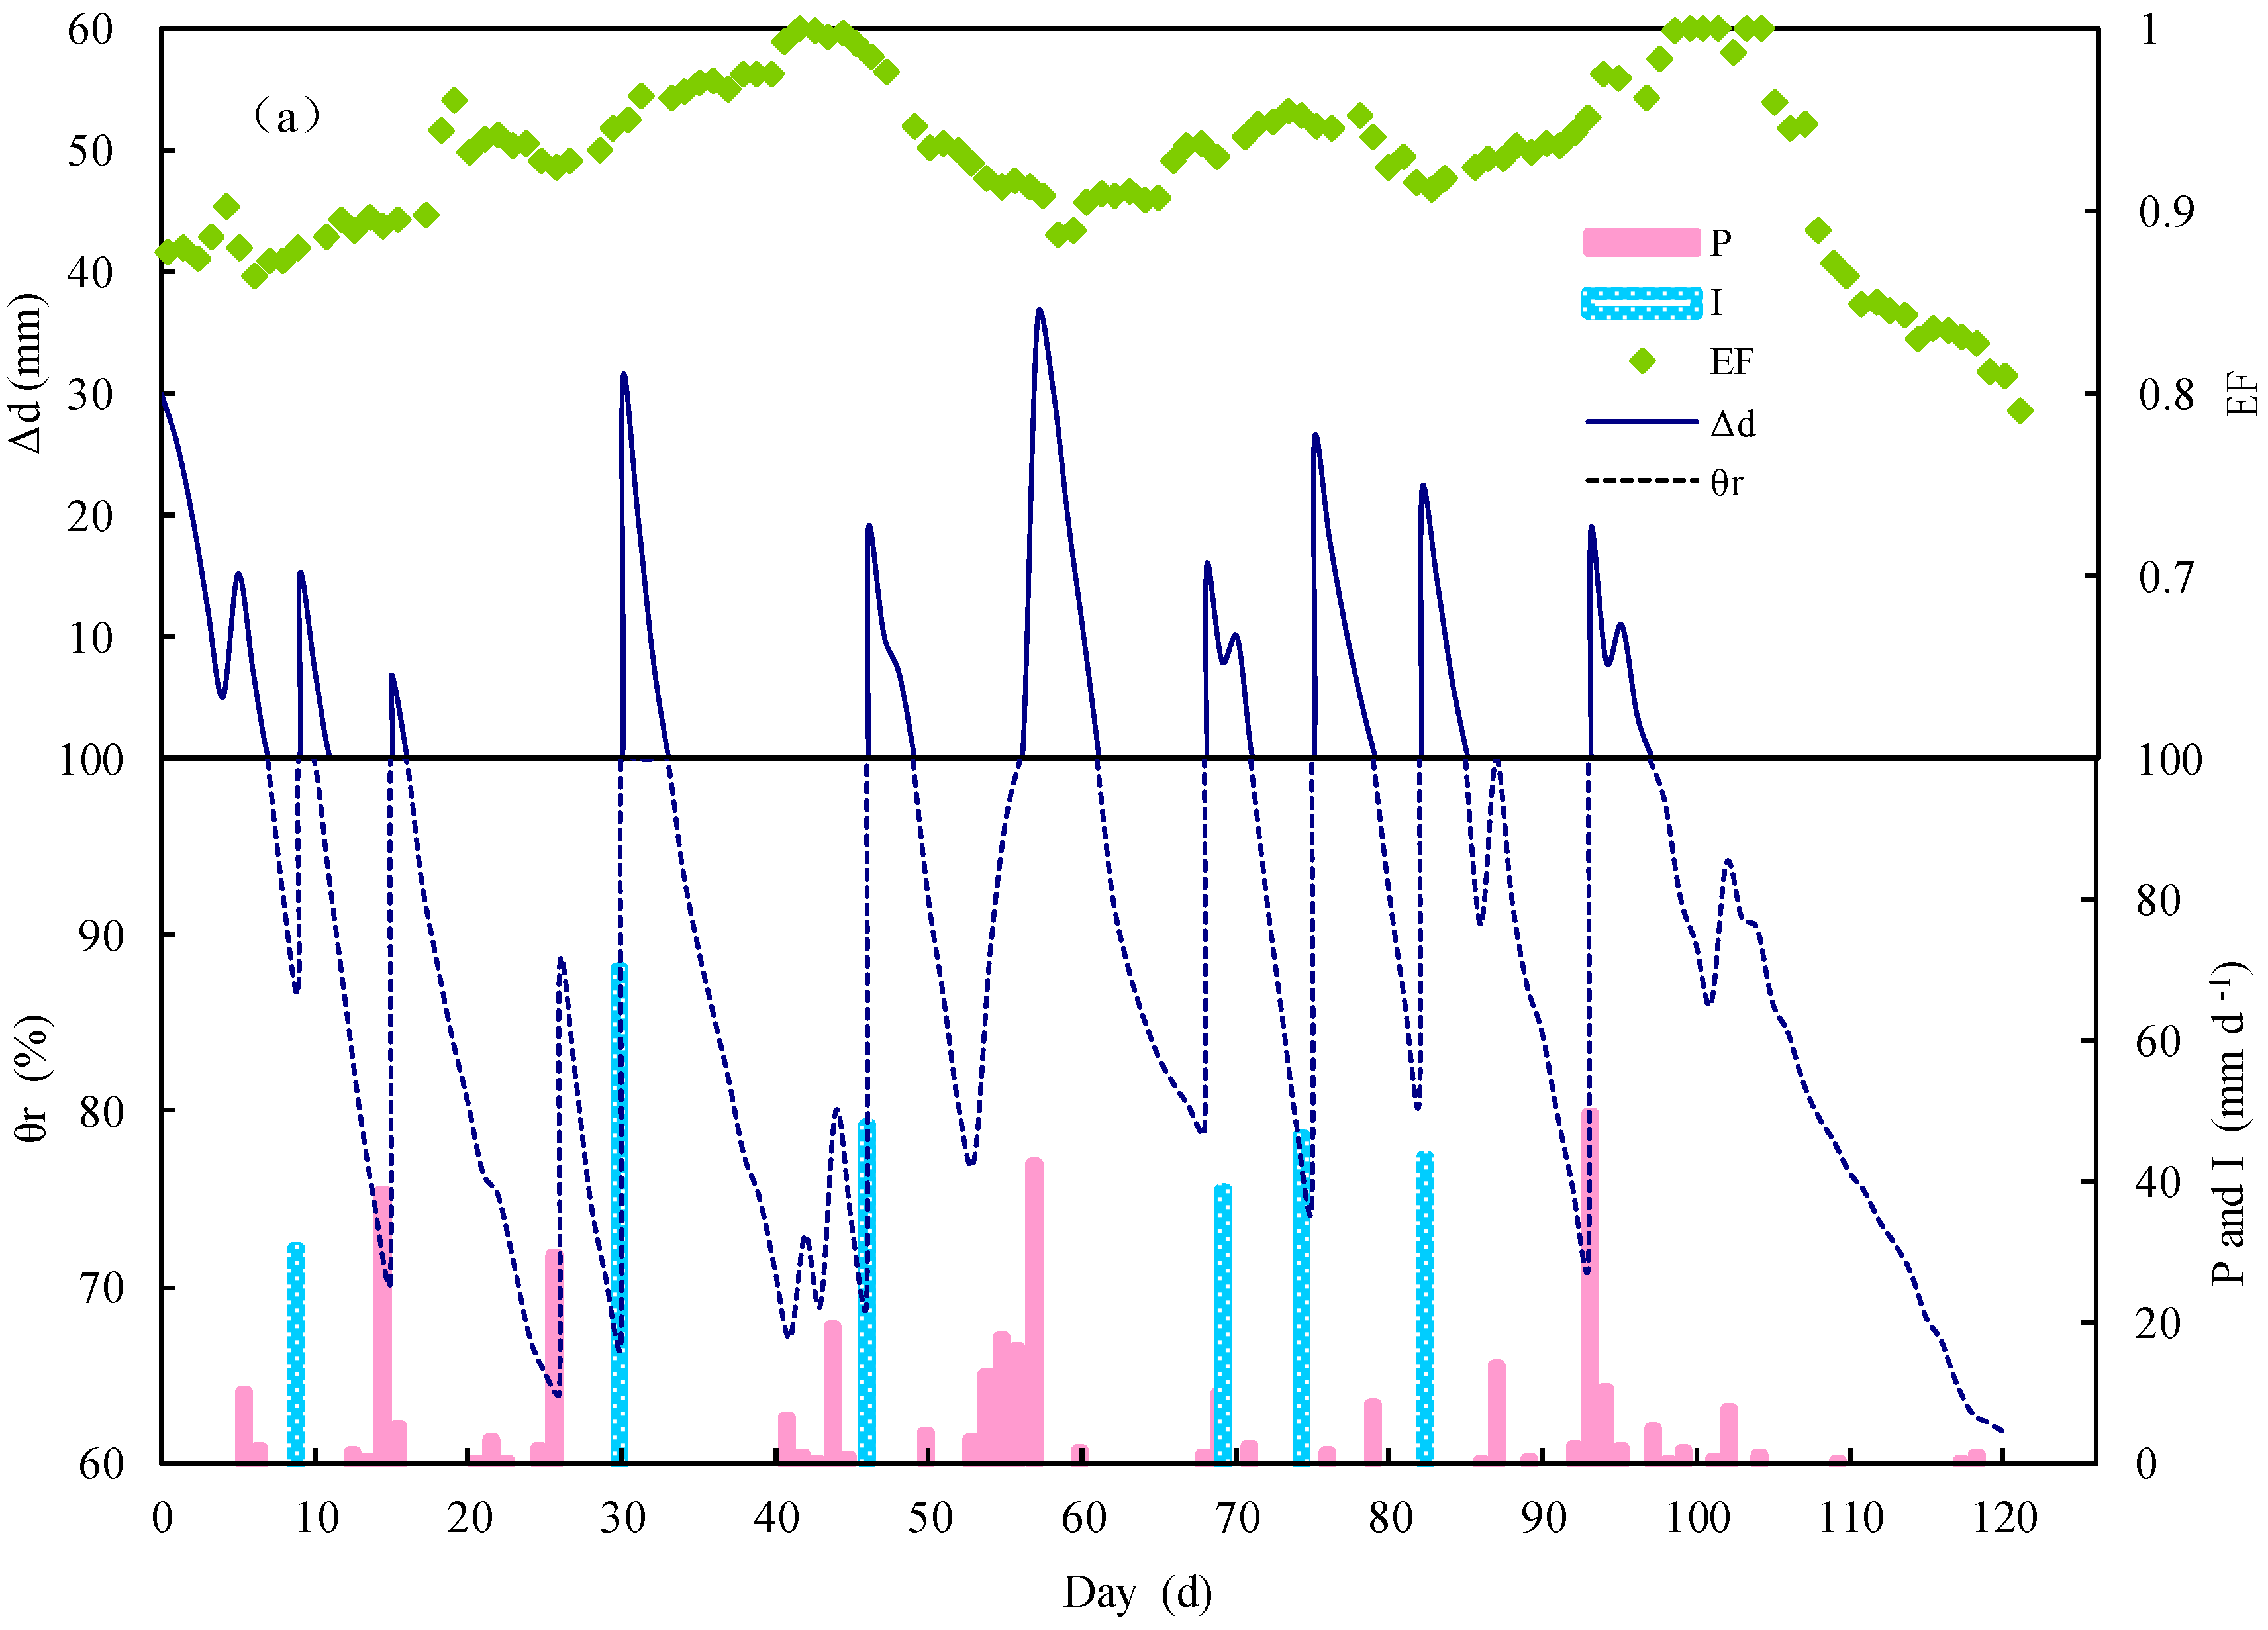
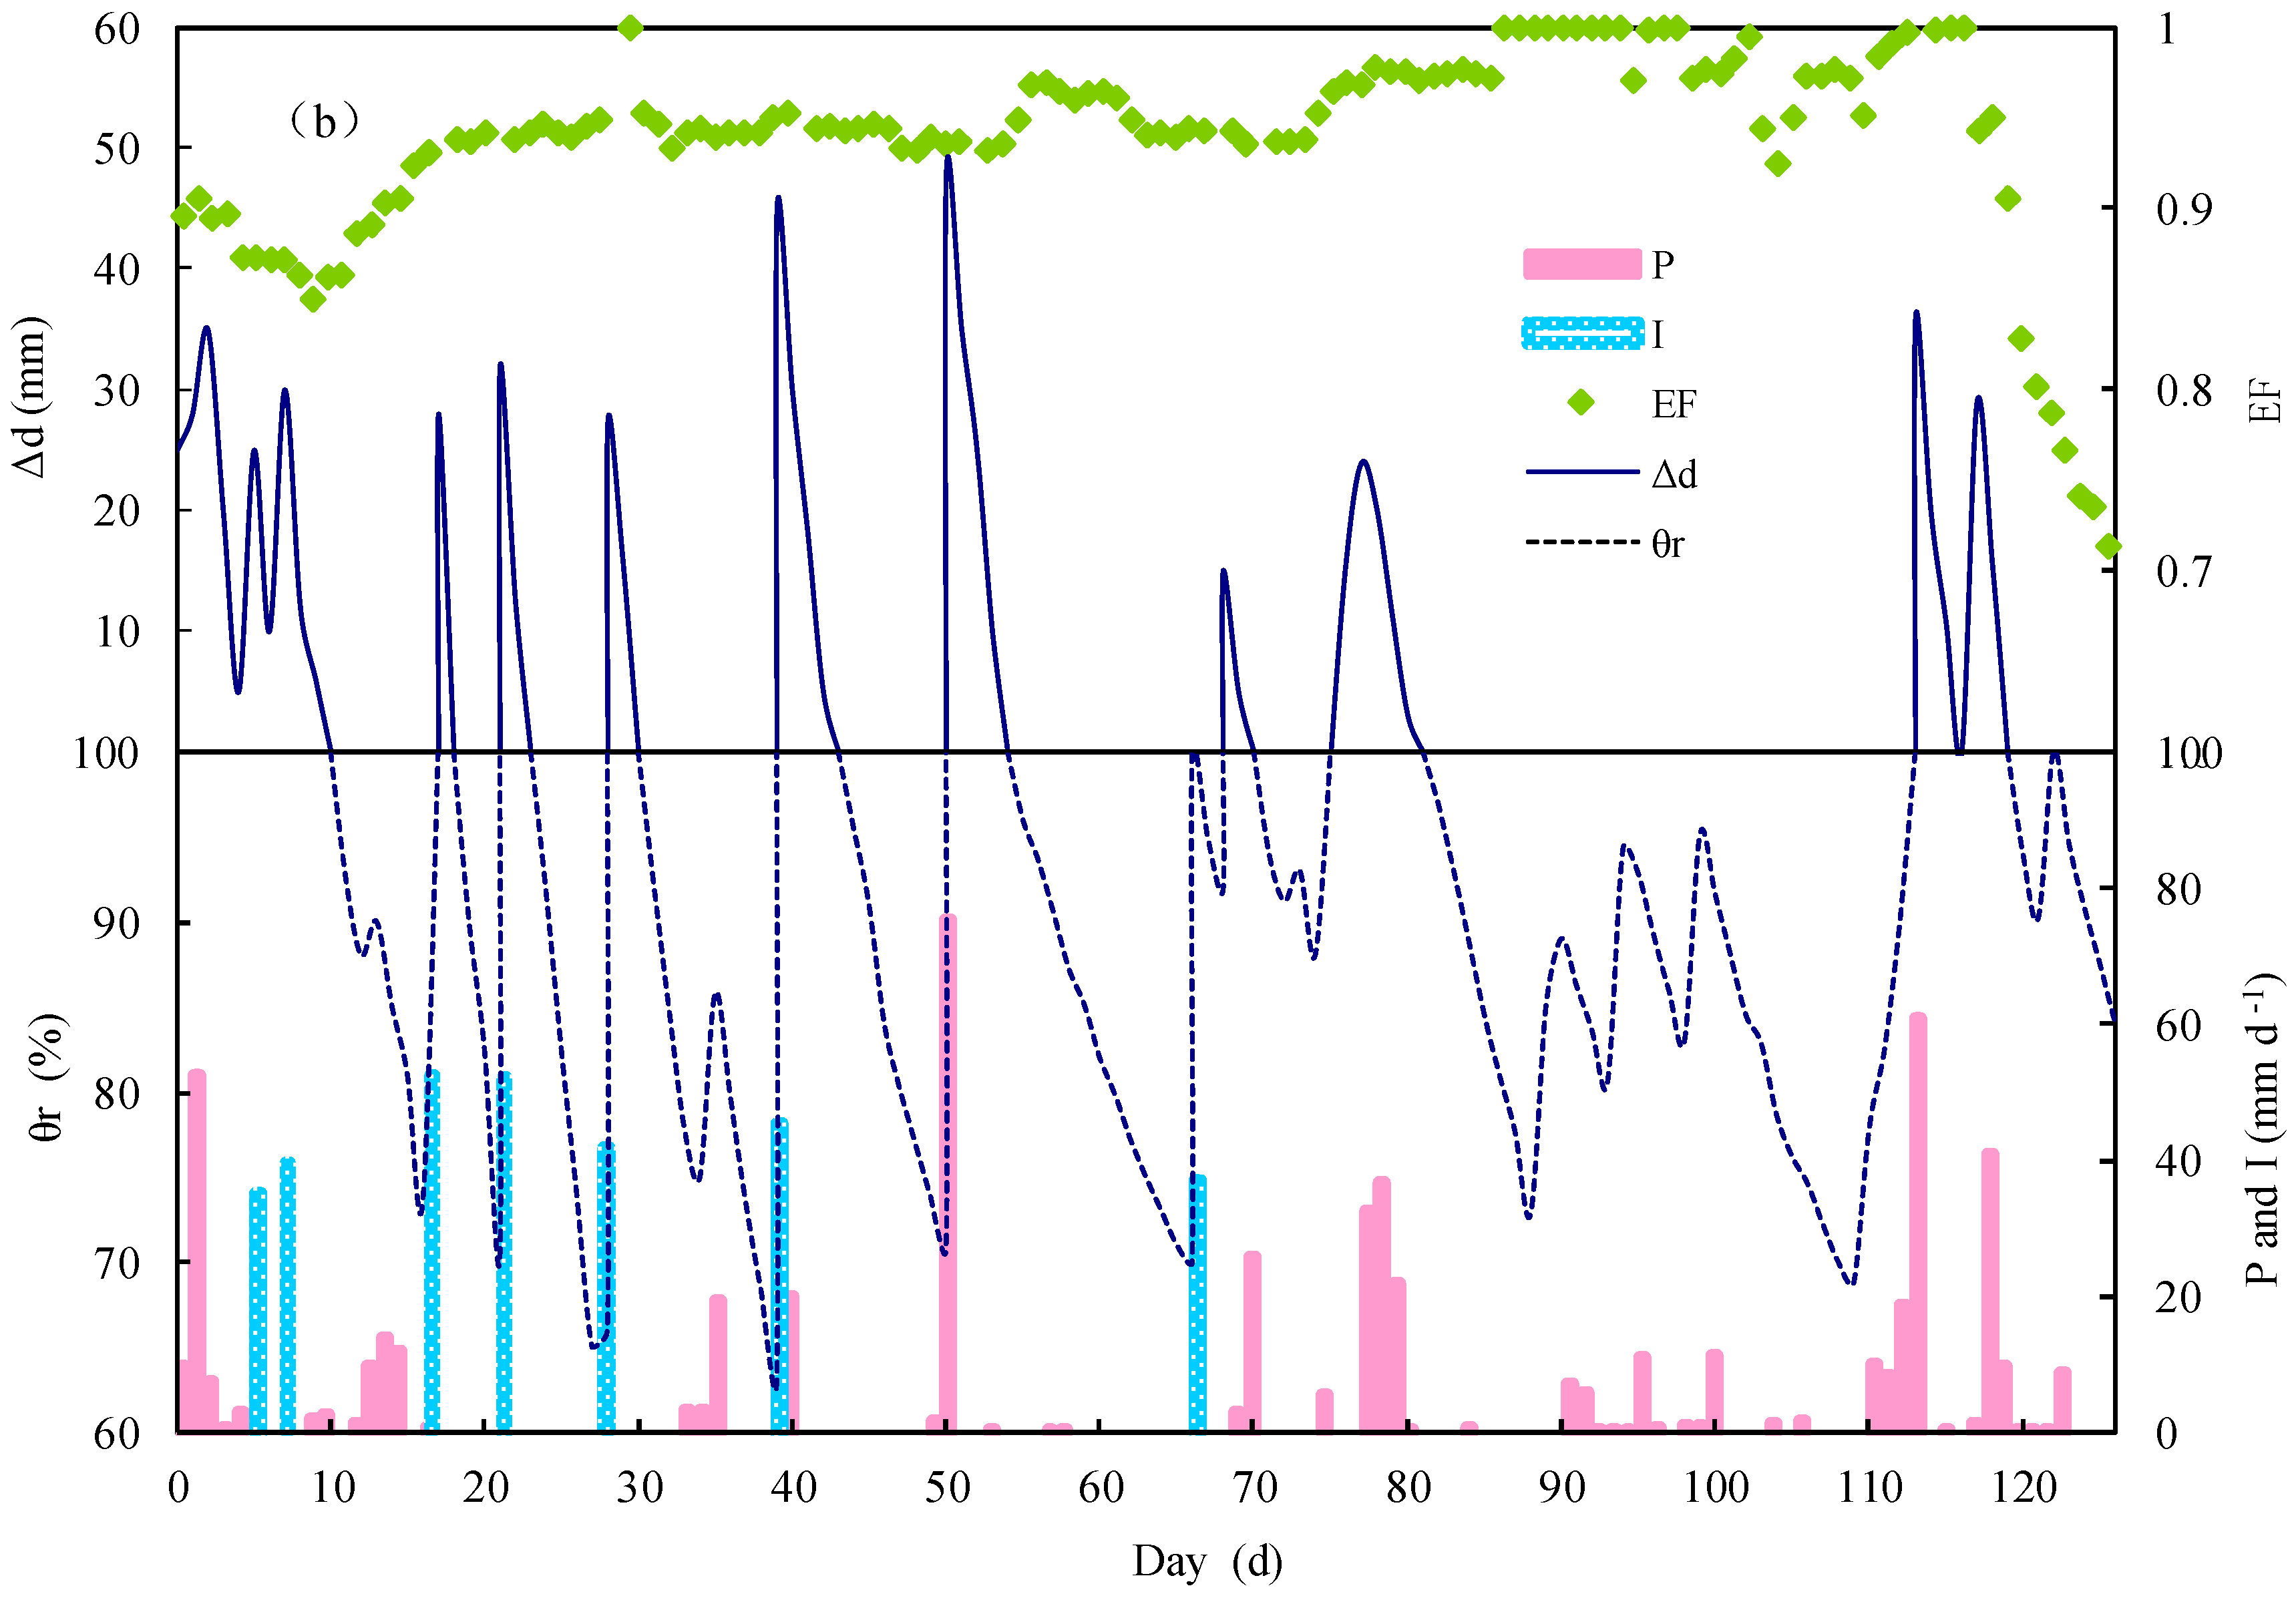
The seasonal variation of EF and the precipitation, irrigation, and soil water condition in 2015 and 2016 are shown in Figure 3. The figure shows that the daily EF varied between 0.7 and 1.0 in the water-saving irrigated rice field, indicating that LE accounts for a large proportion of the turbulent flux.
Seasonally, EF varied in a similar way to that of LE/Rn, with the average value of 0.926 and 0.939 during the 2015 and 2016 rice season, respectively. In the re-greening and early tillering stage, EF was relatively low, varying between 0.8 and 0.9, and then EF increased and was mostly higher than 0.9. The maximum EF at the beginning of jointing in 2015 was approaching 1.0. During the jointing and booting stage, the EF was mostly higher than 0.9, and reached another peak in the milk stage. At the end of the rice season, EF decreased rapidly due to decreases in soil water content and rice transpiration, and finally fell below 0.8, with minimum values of 0.790 and 0.713 in 2015 and 2016, respectively.
Notably, irrigation and precipitation affect EF significantly (as shown in Figure 3), which is consistent with the results from the vineyard in an arid region [28] and from the meadow in a semi-arid area [23]. In current research, the soil moisture is unsaturated in WSI rice fields, and the energy partition thus tends to increase the LE after the increase of soil water content or flooding following irrigation or precipitation. The effect of soil moisture on EF was more obvious in the late growth stage in the WSI rice field. Specifically, EF decreased sharply during the milk and yellow ripening stages in 2015, when the rice paddies were free from irrigation and precipitation. After heavy rain in the milk and yellow ripening stages in 2016, the EF value increased up to 1, and then dropped sharply along with the decrease of soil moisture. Therefore, the soil moisture condition has an obvious effect on EF in the WSI rice field.

4. Conclusions

Energy balance components were examined based on the data collected by the eddy covariance system in WSI rice paddies in 2015 and 2016.The underestimation of LE and Hs can be corrected using the EF closure method. The energy partitioning and EF variation after enforcing energy balance closure was analyzed in this study. The estimation of LE is the most important process in determining the energy and mass exchanges in a paddy field, accounting for 88.2% and 89.8% of the net radiation in the 2015 and 2016 rice seasons, respectively. The G and Hs were similar in magnitude, with both accounting for approximately 5% of Rn. Hs was more sensitive to available energy than LE. Hourly EF varied in a narrow range from 0.7 to 1.0, it was less varied from 10:00 to 14:00, and it was occasionally greater than 1 during the transition periods in the morning or evening. Seasonally, the EF was mostly higher than 0.9 during the jointing and booting stage, with the second peak (approaching 1.0) occuring in the milk stage. The effect of the soil moisture condition on EF was found to be obvious in the WSI rice field, especially in the late growth stage.
The current results indicate that the proportions of net radiation converted to other energy components were affected by the alternative drying-wetting soil water conditions and phenological characteristics. The knowledge of EF will be helpful for estimating daily or long temporal scale ET by the EF method based on satellite-derived ET.

Author Contributions

X.L., S.Y., and Y.L. conducted the experiments and collected the data; X.L. and J.X. analyzed the data; X.L. wrote the paper and J.X. edited and examined the paper.

Funding

This work was supported by the National Natural Science Foundation of China (No. 51809075), the Fundamental Research Funds for the Central Universities (No. 2018B00414), the Natural Science Foundation of Jiangsu Province (No. BK20180506), and the National Natural Science Foundation of China (No. 51579070,51879075).

Acknowledgments

We thank the anonymous reviewers and the Editor for their suggestions, which substantially improved the manuscript.

Conflicts of Interest

The authors declare no conflict of interest.

References

  1. Wever, L.A.; Flanagan, L.B.; Carlson, P.J. Seasonal and interannual variation in evapotranspiration, energy balance and surface conductance in a northern temperate grassland. Agric. For. Meteorol. 2002, 112, 31–49. [Google Scholar] [CrossRef]
  2. Wilson, K.; Goldstein, A.; Falge, E.; Aubinet, M.; Baldocchi, D.; Berbigier, P.; Bernhofer, C.; Ceulemans, R.; Dolman, H.; Field, C. Energy balance closure at FLUXNET sites. Agric. For. Meteorol. 2002, 113, 223–243. [Google Scholar] [CrossRef] [Green Version]
  3. Bormann, H. Sensitivity analysis of 18 different potential evapotranspiration models to observed climatic change at German climate stations. Clim. Chang. 2011, 104, 729–753. [Google Scholar] [CrossRef]
  4. Castellvi, F.; Snyder, R.L.; Baldocchi, D.D. Surface energy-balance closure over rangeland grass using the eddy covariance method and surface renewal analysis. Agric. For. Meteorol. 2008, 148, 1147–1160. [Google Scholar] [CrossRef]
  5. Hossen, M.S.; Mano, M.; Miyata, A.; Baten, M.A.; Hiyama, T. Surface energy partitioning and evapotranspiration over a double-cropping paddy field in bangladesh. Hydrol. Process. 2012, 26, 1311–1320. [Google Scholar] [CrossRef]
  6. Mauder, M.; Oncley, S.; Vogt, P.R.; Weidinger, T.; Ribeiro, L.; Bernhofer, C.; Foken, T.; Kohsiek, W.; de Bruin, H.A.R.; Liu, H. The energy balance experiment EBEX-2000. Part II: Intercomparison of eddy-covariance sensors and post-field data processing methods. Bound.-Layer Meteorol. 2007, 123, 29–54. [Google Scholar] [CrossRef]
  7. Leuning, R.; van Gorsel, E.; Massman, W.J.; Isaac, P.R. Reflections on the surface energy imbalance problem. Agric. For. Meteorol. 2012, 156, 65–74. [Google Scholar] [CrossRef]
  8. Kessomkiat, W.; Hendricks Franssen, H.J.; Graf, A.; Vereecken, H. Estimating random errors of eddy covariance data: An extended two-tower approach. Agric. For. Meteorol. 2013, 171–172, 203–219. [Google Scholar] [CrossRef]
  9. Gebler, S.; Hendricks Franssen, H.J.; Pütz, T.; Post, H.; Schmidt, M.; Vereecken, H. Actual evapotranspiration and precipitation measured by lysimeters: A comparison with eddy covariance and tipping bucket. Hydrol. Earth Syst. Sci. 2014, 19, 2145–2161. [Google Scholar] [CrossRef]
  10. Gao, Z.; Liu, H.; Katul, G.G.; Foken, T. Non-closure of the surface energy balance explained by phase difference between vertical velocity and scalars of large atmospheric eddies. Environ. Res. Lett. 2017, 12, 1–9. [Google Scholar] [CrossRef]
  11. Liu, X.; Yang, S.; Xu, J.; Zhang, J.; Liu, J. Effects of soil heat storage and phase shift correction on energy balance closure of paddy fields. Atmósfera 2017, 30, 39–52. [Google Scholar] [CrossRef] [Green Version]
  12. Brotzge, J.A.; Crawford, K.C. Estimation of the surface energy budget: A comparison of eddy correlation and Bowen ratio measurement systems. J. Hydrometeorol. 2003, 4, 160–177. [Google Scholar] [CrossRef]
  13. Foken, T.; Wimmer, F.; Mauder, M.; Thomas, C.; Liebethal, C. Some aspects of the energy balance closure problem. Atmos. Chem. Phys. 2006, 6, 4395–4402. [Google Scholar] [CrossRef] [Green Version]
  14. Foken, T. The energy balance closure problem: An overview. Ecol. Appl. 2008, 18, 1351–1367. [Google Scholar] [CrossRef] [PubMed]
  15. Billesbach, D.P. Estimating uncertainties in individual eddy covariance flux measurements: A comparison of methods and a proposed new method. Agric. For. Meteorol. 2011, 151, 394–405. [Google Scholar] [CrossRef]
  16. Foken, T.; Aubinet, M.; Finnigan, J.J.; Leclerc, M.Y.; Mauder, M.; Tha, P.U.K. Results of a panel discussion about the energy balance closure correction for trace gases. Bull. Am. Meteorol. Soc. 2011, 92, 13–18. [Google Scholar] [CrossRef]
  17. Gao, Z.; Russell, E.S.; Missik, J.E.C.; Huang, M.; Chen, X.; Strickland, C.E.; Clayton, R.; Arntzen, E.; Ma, Y.; Liu, H. A novel approach to evaluate soil heat flux calculation: An analytical review of nine methods. J. Geophys. Res.-Atmos. 2017, 122, 6934–6949. [Google Scholar] [CrossRef]
  18. Gao, Z.; Liu, H.; Russell, E.S.; Huang, J.; Foken, T.; Oncley, S.P. Large eddies modulating flux convergence and divergence in a disturbed unstable atmospheric surface layer. J. Geophys. Res.-Atmos. 2016, 121, 1475–1492. [Google Scholar] [CrossRef]
  19. Farah, H.O.; Bastiaanssen, W.G.M.; Feddes, R.A. Evaluation of the temporal variability of the evaporative fraction in a tropical watershed. Int. J. Appl. Earth Obs. 2004, 5, 129–140. [Google Scholar] [CrossRef]
  20. Suleiman, A.; Crago, R. Hourly and Daytime Evapotranspiration from Grassland Using Radiometric Surface Temperatures. Agron. J. 2004, 96, 384–390. [Google Scholar] [CrossRef]
  21. Nutini, F.; Boschetti, M.; Candiani, G.; Bocchi, S.; Brivio, P.A. Evaporative fraction as an indicator of moisture condition and water stress status in semi-arid rangeland ecosystems. Remote Sens. 2014, 6, 6300–6323. [Google Scholar] [CrossRef]
  22. Lu, J.; Tang, R.; Shao, K.; Li, Z.L.; Zhou, G. Assessment of two temporal-information-based methods for estimating evaporative fraction over the southern great plains. Int. J. Remote Sens. 2015, 36, 4936–4952. [Google Scholar] [CrossRef]
  23. Kustas, W.; Schmugge, T.; Humes, K.; Jackson, T.; Parry, R.; Weltz, M.; Moran, M. Relationships between evaporative fraction and remotely sensed vegetation index and microwave brightness temperature for semiarid rangelands. J. Appl. Metereol. 1993, 32, 1781–1790. [Google Scholar] [CrossRef]
  24. Kurc, S.A.; Small, E.E. Dynamics of evapotranspiration in semiarid grassland and shrubland ecosystems during the summer monsoon season, central New Mexico. Water Resour. Res. 2004, 40, W09305. [Google Scholar] [CrossRef]
  25. Guyot, A.; Cohard, J.M.; Anquetin, S.; Galle, S. Long-term observations of turbulent fluxes over heterogeneous vegetation using scintillometry and additional observations: A contribution to AMMA under Sudano-Sahelian climate. Agric. For. Meteorol. 2012, 154–155, 84–98. [Google Scholar] [CrossRef]
  26. Higuchi, A.; Kondoh, A.; Kishi, S. Relationship among the surface albedo, spectral reflectance of canopy, and evaporative fraction at grassland and paddy field. Adv. Space Res. 2000, 26, 1043–1046. [Google Scholar] [CrossRef]
  27. Shuttleworth, W.J.; Gurney, R.J.; Hsu, A.Y.; Ormsby, J.P. FIFE: The variation in energy partition at surface flux sites. IAHS Publ. 1989, 186, 67–74. [Google Scholar]
  28. Li, S.E.; Kang, S.Z.; Li, F.S.; Zhang, L.; Zhang, B.Z. Vineyard evaporative fraction based on eddy covariance in an arid desert region of Northwest China. Agric. Water Manag. 2008, 95, 937–948. [Google Scholar] [CrossRef]
  29. Santos, C.A.C.D.; Silva, B.B.D.; Rao, T.V.R. Analysis of the evaporative fraction using eddy covariance and remote sensing techniques. Revista Brasileira De Meteorologia 2010, 25, 427–436. [Google Scholar] [CrossRef] [Green Version]
  30. Zhang, Y.Q.; Shen, Y.J.; Liu, C.M.; Yu, Q.; Sun, H.W.; Jia, J.S.; Tan, C.Y.; Kondoh, A. Measurement and analysis of water, heat and CO2 flux from a farmland in the North China Plain. Acta Geographic Sinica 2002, 57, 333–342, (In Chinese, with English Abstract). [Google Scholar]
  31. Uchijima, Z. On characteristics of heat balance of water layer under paddy plant cover. Bull. Natl. Inst. Agric. Sci. 1961, A8, 243–265. [Google Scholar]
  32. Hayashi, K. Efficiencies of solar energy conversion in rice varieties. Jpn. J. Crop Sci. 1966, 35, 205–211. [Google Scholar] [CrossRef]
  33. Harazono, Y.; Kim, J.; Miyata, A.; Choi, J.T.; Yun, I.; Kim, J.W. Measurement of energy budget components during the International Rice Experiment (IREX) in Japan. Hydrol. Process. 1998, 12, 2081–2092. [Google Scholar] [CrossRef]
  34. Tsai, J.L.; Tsuang, B.J.; Lu, P.S.; Yao, M.H.; Shen, Y. Surface energy components and land characteristics of a rice paddy. J. Appl. Meteorol. Clim. 2007, 46, 1879–1900. [Google Scholar] [CrossRef]
  35. Kar, G.; Kumar, A. Radiation utilization efficiency and evaporative fraction of rainfed rice in eastern India. J. Agrometeorol. 2016, 18, 184–189. [Google Scholar]
  36. Timm, A.U.; Roberti, D.R.; Streck, N.A.; Luis, G.G.D.G.; Acevedo, O.C.; Moraes, O.L.L.; Moreira, V.S.; Degrazia, G.A.; Ferlan, M.; Toll, D.L. Energy partitioning and evapotranspiration over a rice paddy in southern brazil. J. Hydrometeorol. 2014, 15, 1975–1988. [Google Scholar] [CrossRef]
  37. Masseroni, D.; Facchi, A.; Romani, M.; Chiaradia, E.A.; Gharsallah, O.; Gandolfi, C. Surface energy flux measurements in a flooded and an aerobic rice field using a single eddy-covariance system. Paddy Water Environ. 2015, 13, 405–424. [Google Scholar] [CrossRef]
  38. Sobrino, J.A.; Gómez, M.; Jiménez-Muñoz, J.C.; Olioso, A. Application of a simple algorithm to estimate daily evapotranspiration from NOAA-VHRR images for the Iberian Peninsula. Remote Sens. Environ. 2007, 110, 139–148. [Google Scholar] [CrossRef]
  39. Hoedjes, J.C.B.; Chehbouni, A.; Jacob, F.; Ezzahar, J.; Boulet, G. Deriving daily evapotranspiration from remotely sensed instantaneous evaporative fraction over olive orchard in semi-arid morocco. J. Hydrol. 2008, 354, 53–64. [Google Scholar] [CrossRef]
  40. Sun, Z.; Gebremichael, M.; Ardö, J.; Nickless, A.; Caquet, B.; Merboldh, L.; Kutschi, W. Estimation of daily evapotranspiration over Africa using MODIS/Terra and SEVIRI/MSG data. Atmos. Res. 2012, 112, 35–44. [Google Scholar] [CrossRef]
  41. Ding, Y.M.; Wang, W.G.; Song, R.M.; Shao, G.X.; Jiao, X.Y.; Xing, W.Q.; Wang, W. Modeling spatial and temporal variability of the impact of climate change on rice irrigation water requirements in the middle and lower reaches of the Yangtze River, China. Agric. Water Manag. 2017, 193, 89–101. [Google Scholar] [CrossRef]
  42. China Water Resources Bulletin 2016. Available online: http://www.mwr.gov.cn/sj/tjgb/szygb/201707/t20170711_955305.html (accessed on 17 September 2018).
  43. Gao, Z.; Bian, L.; Zhou, X. Measurements of turbulent transfer in the near surface layer over a rice paddy in China. J. Geophys. Res. 2003. [Google Scholar] [CrossRef]
  44. Castellvi, F.; Martínez-Cob, A.; Pérez-Coveta, O. Estimating sensible and latent heat fluxes over rice using surface renewal. Agric. For. Meteorol. 2006, 139, 164–169. [Google Scholar] [CrossRef] [Green Version]
  45. Linquist, B.; Snyder, R.; Anderson, F.; Espino, L.; Inglese, G.; Marras, S.; Moratiel, R.; Mutters, R.; Nicolosi, P.; Rejmanek, H.; et al. Water balances and evapotranspiration in water-and dry-seeded rice systems. Irrig. Sci. 2015, 33, 375–385. [Google Scholar] [CrossRef]
  46. Xu, J.; Peng, S.; Yang, S.; Wang, W. Ammonia volatilization losses from a rice paddy with different irrigation and nitrogen managements. Agric. Water Manag. 2012, 104, 184–192. [Google Scholar] [CrossRef]
  47. Anthoni, P.M.; Freibauer, A.; Kolle, O.; Schulz, E.-D. Winter wheat carbon exchange in Thuringia, Germany. Agric. For. Meteorol. 2004, 121, 55–67. [Google Scholar] [CrossRef]
  48. Mauder, M.; Liebethal, C.; Göckede, M.; Leps, J.P.; Beyrich, F.; Foken, T. Processing and quality control of flux data during LITFASS-2003. Bound.-Layer Meteorol. 2006, 121, 67–88. [Google Scholar] [CrossRef]
  49. Ueyama, M.; Hirata, R.; Mano, M.; Hamotani, K.; Harazono, Y.; Hirano, T.; Miyata, A.; Takagi, K.; Takahashi, Y. Influences of various calculation options on heat, water and carbon fluxes determined by open- and closed- path eddy covariance methods. Tellus B 2012, 64, 1–26. [Google Scholar] [CrossRef]
  50. Masseroni, D.; Ercolani, G.; Corbari, C.; Mancini, M. Accuracy of turbulent flux measurements through the use of high frequency data by eddy covariance tower: The case study of Landriano (PV) Italy. Ital. J. Agrometeorol. 2013, 3, 5–12. [Google Scholar]
  51. Mauder, M.; Cuntz, M.; Drue, C.; Graf, A.; Rebmann, C.; Schmid, H.P.; Schmidt, M.; Steinbrecher, R. A strategy for quality and uncertainty assessment of long-term eddy-covariance measurements. Agric. For. Meteorol. 2013, 169, 122–135. [Google Scholar] [CrossRef]
  52. Kljun, N.; Calanca, P.; Rotach, M.P.; Schmid, H.P. A simple parameterisation for flux footprint predictions. Bound.-Layer Meteorol. 2004, 112, 503–523. [Google Scholar] [CrossRef]
  53. Aubinet, M.; Vesala, T.; Papale, D. Eddy Covariance: A Practical Guide to Measurement and Data Analysis; Springer: Berlin/Heidelberg, Germany, 2012; pp. 365–376. [Google Scholar]
  54. Masseroni, D.; Ravazzani, G.; Corbari, C.; Mancini, M. Turbulence integral length and footprint dimension with reference to experimental data measured over maize cultivation in Po Valley, Italy. Atmosfera 2012, 25, 183–198. [Google Scholar]
  55. Falge, E.; Baldocchi, D.; Olson, R.; Anthoni, P.; Aubinet, M.; Bernhofer, C.; Burba, G.; Ceulemans, R.; Clement, R.; Dolman, H. Gap filling strategies for long term energy flux data sets. Agric. For. Meteorol. 2001, 107, 71–77. [Google Scholar] [CrossRef] [Green Version]
  56. Russell, E.S.; Liu, H.; Gao, Z.; Finn, D.; Lamb, B. Impacts of soil heat flux calculation methods on the surface energy balance closure. Agric. For. Meteorol. 2015, 214–215, 189–200. [Google Scholar] [CrossRef]
  57. Meyers, T.; Hollinger, S. An assessment of storage terms in the surface energy balance of maize soybean. Agric. For. Meteorol. 2004, 125, 105–115. [Google Scholar] [CrossRef]
  58. Heitman, J.L.; Horton, R.; Sauer, T.J.; Ren, T.S.; Xiao, X. Latent heat in soil heat flux measurements. Agric. For. Meteorol. 2010, 150, 1147–1153. [Google Scholar] [CrossRef] [Green Version]
  59. Lee, X. On micrometeorological observations of surface-air exchange over tall vegetation. Agric. For. Meteorol. 1998, 91, 39–49. [Google Scholar] [CrossRef]
  60. Zhang, Y.; Liu, H.; Foken, T.; Williams, Q.L.; Liu, S.; Mauder, M.; Liebethal, C. Turbulence spectra and cospectra under the influence of large eddies in the energy balance experiment (EBEX). Bound.-Layer Meteorol. 2010, 136, 235–251. [Google Scholar] [CrossRef]
  61. Zhou, Y.Z.; Li, D.; Liu, H.P.; Li, X. Diurnal variations of the flux imbalance over homogeneous and heterogeneous landscapes. Bound.-Layer Meteorol. 2018, 168, 417–442. [Google Scholar] [CrossRef]
  62. Foken, T.; Goockede, M.; Mauder, M.; Mahrt, L.; Amiro, B.; Munger, W. Post-Field Data Quality Control; Springer: Dordrecht, The Netherlands, 2006; pp. 181–208. [Google Scholar]
  63. Frank, J.M.; Massman, W.J.; Ewers, B.E. Underestimates of sensible heat flux due to vertical velocity measurement errors in non-orthogonal sonic anemometers. Agric. For. Meteorol. 2013, 171, 72–81. [Google Scholar] [CrossRef]
  64. Sugita, M.; Brutsaert, W. Daily evaporation over a region from lower boundary layer profiles measured with radiosondes. Water Resour. Res. 1991, 27, 747–752. [Google Scholar] [CrossRef]
  65. Vickers, D.; Gockede, M.; Law, B.E. Uncertainty estimates for 1-h averaged turbulence fluxes of carbon dioxide, latent heat and sensible heat. Tellus Ser. B Chem. Phys. Meteorol. 2010, 62, 87–99. [Google Scholar] [CrossRef] [Green Version]
  66. Ding, R.S.; Kang, S.Z.; Zhang, Y.Q. Evaluating eddy covariance method in evapotranspiration measurements by large—Scale weight lysimeter. In Proceedings of the 6th Academic Seminar of National Agricultural and Soil Engineering, Kun Ming, China, 6–8 August 2010; pp. 225–233, (In Chinese, with English Abstract). [Google Scholar]
  67. Chen, H.; Yang, D.W.; Lv, H.F. Comparison of temporal extrapolation methods for evapotranspiration over variant underlying croplands. Trans. Chin. Soc. Agric. Eng. 2013, 29, 73–81, (In Chinese, with English Abstract). [Google Scholar]
  68. Ham, J.M.; Heilman, J.L.; Lascano, R.J. Soil and canopy energy balances of a row crop at partial cover. Agron. J. 1991, 83, 744–753. [Google Scholar] [CrossRef]
  69. Suyker, A.E.; Verma, S.B. Interannual water vapor and energy exchange in an irrigated maize-based agroecosystem. Agric. For. Meteorol. 2008, 148, 417–427. [Google Scholar] [CrossRef]
  70. Jia, Z.J.; Zhang, W.; Huang, Y. Analysis of energy flux in rice paddy in the sanjiang plain. Chin. J. Eco-Agric. 2010, 18, 820–826, (In Chinese, with English Abstract). [Google Scholar] [CrossRef]
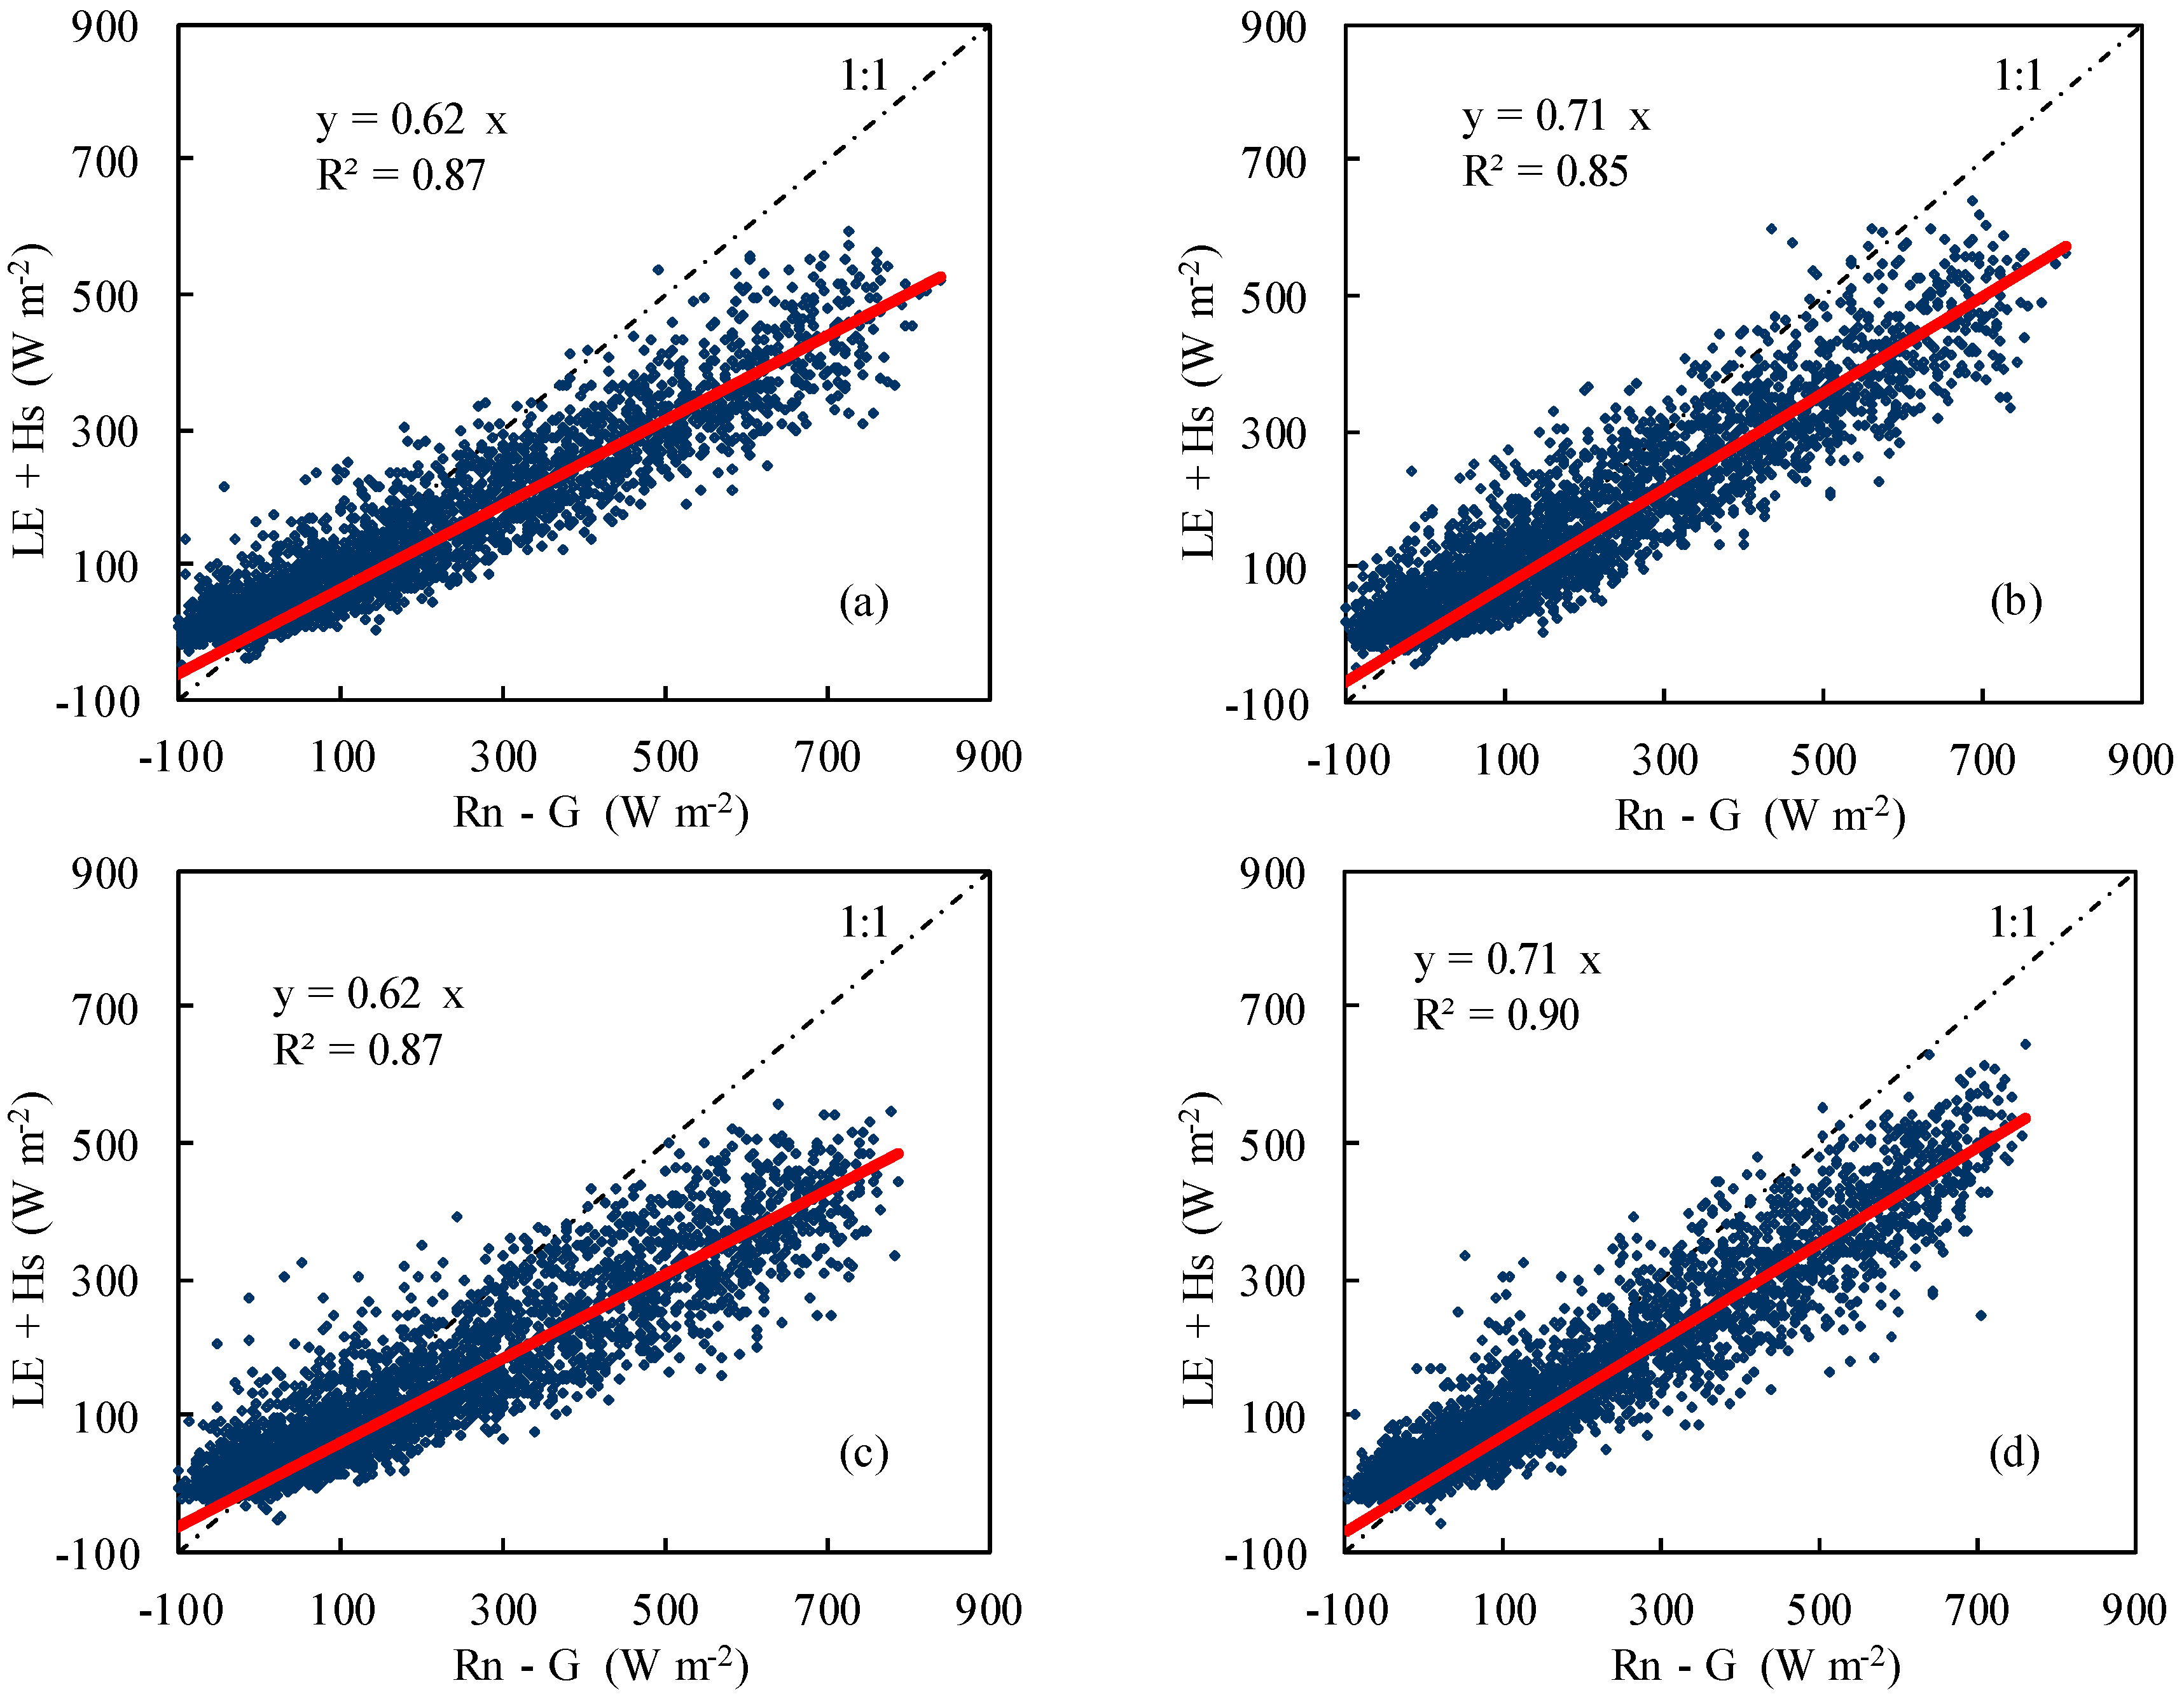
Figure 1. Relationships between available energy (Rn–G) and turbulent energy fluxes (LE+Hs) for original measurements at hourly (a,c) and daily scales (e,g) and for energy imbalance correction at hourly (b,d) and daily scales (f,h) in the 2015 and 2016 rice season, respectively.
Atmosphere 10 00051 g001aAtmosphere 10 00051 g001b
Figure 2. Mean diurnal variation of available energy (Rn − G), latent heat flux (LE), sensible heat flux (Hs), and evaporative fraction (EF) in the rice season of (a) 2015 and (b) 2016.
Atmosphere 10 00051 g002
Figure 3. Behavior of the daily evaporative fraction (EF) during the rice season and the corresponding precipitation (P), irrigation (I), and soil water condition under water-saving irrigation in (a) 2015 and (b) 2016 (θr and Δd represent relative soil moisture content and water depth, respectively).
Atmosphere 10 00051 g003aAtmosphere 10 00051 g003b
Table 1. Partition of energy budget in different growth stages of water-saving irrigated rice fields in 2015 and 2016.
YearGrowth StagesPeriodDaysPartition Ratio
LE/RnHs/RnG/Rn
2015Re-greening6.27–7.480.8100.0770.113
Early tillering7.5–7.1390.8070.0960.097
Middle tillering7.14–7.28150.8700.0550.075
Later tillering7.29–8.7100.9650.0200.015
Jointing and booting8.8–9.4280.8950.0660.039
Heading to flowering9.5–9.1280.9080.0500.042
Milk9.13–10.14320.9170.0540.029
Yellow ripening10.15–10.25110.8230.1660.011
Whole growth stage6.27–10.251210.8820.0590.058
2016Re-greening7.2–7.980.7900.1040.106
Early tillering7.10–7.19100.8180.0960.086
Middle tillering7.20–8.2140.8660.0500.084
Later tillering8.3–8.12100.8710.0520.077
Jointing and booting8.13–9.9280.8810.0500.069
Heading to flowering9.10–9.19100.9160.0320.052
Milk9.20–10.19300.9660.0190.015
Yellow ripening10.20–11.3150.8150.0960.089
Whole growth stage7.1–11.31250.8980.0580.044