Discontinuities in the Ozone Concentration Time Series from MERRA 2 Reanalysis
Abstract
1. Introduction
2. Data and Method
3. Results
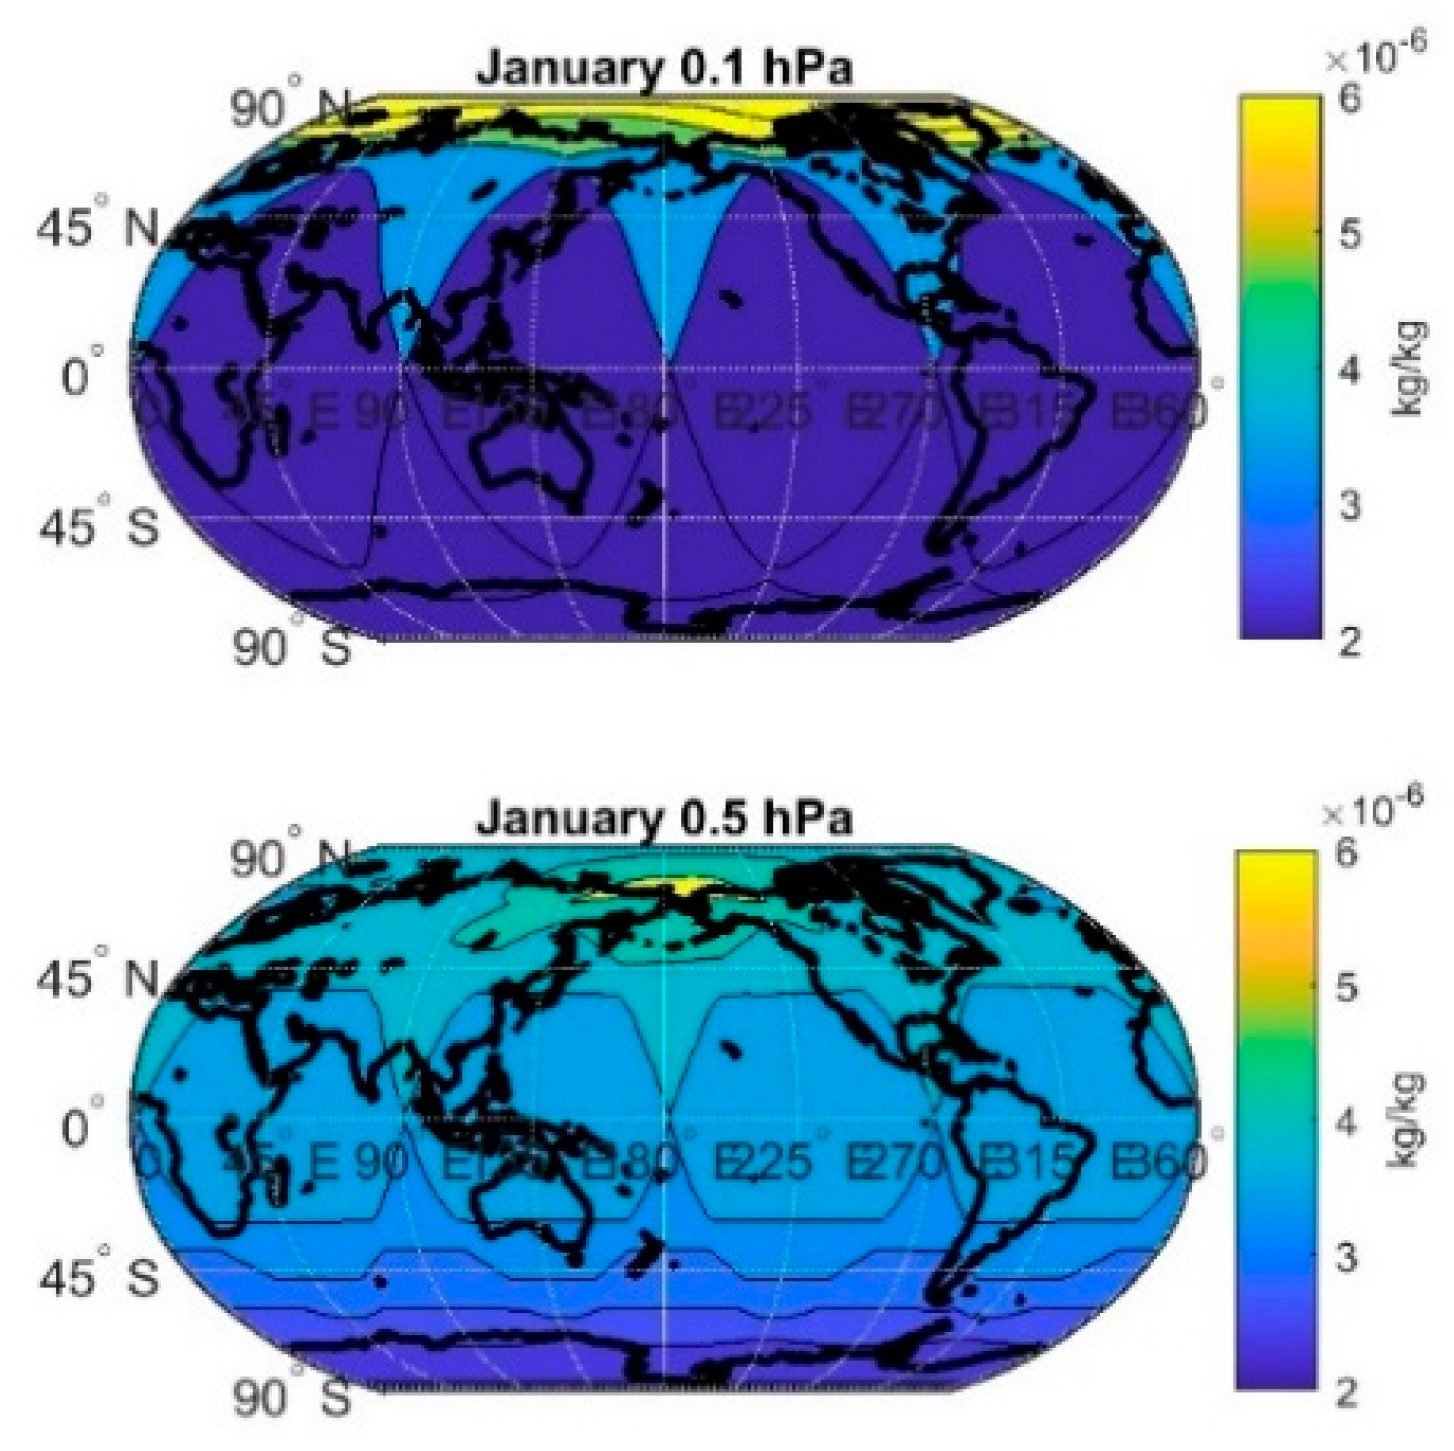
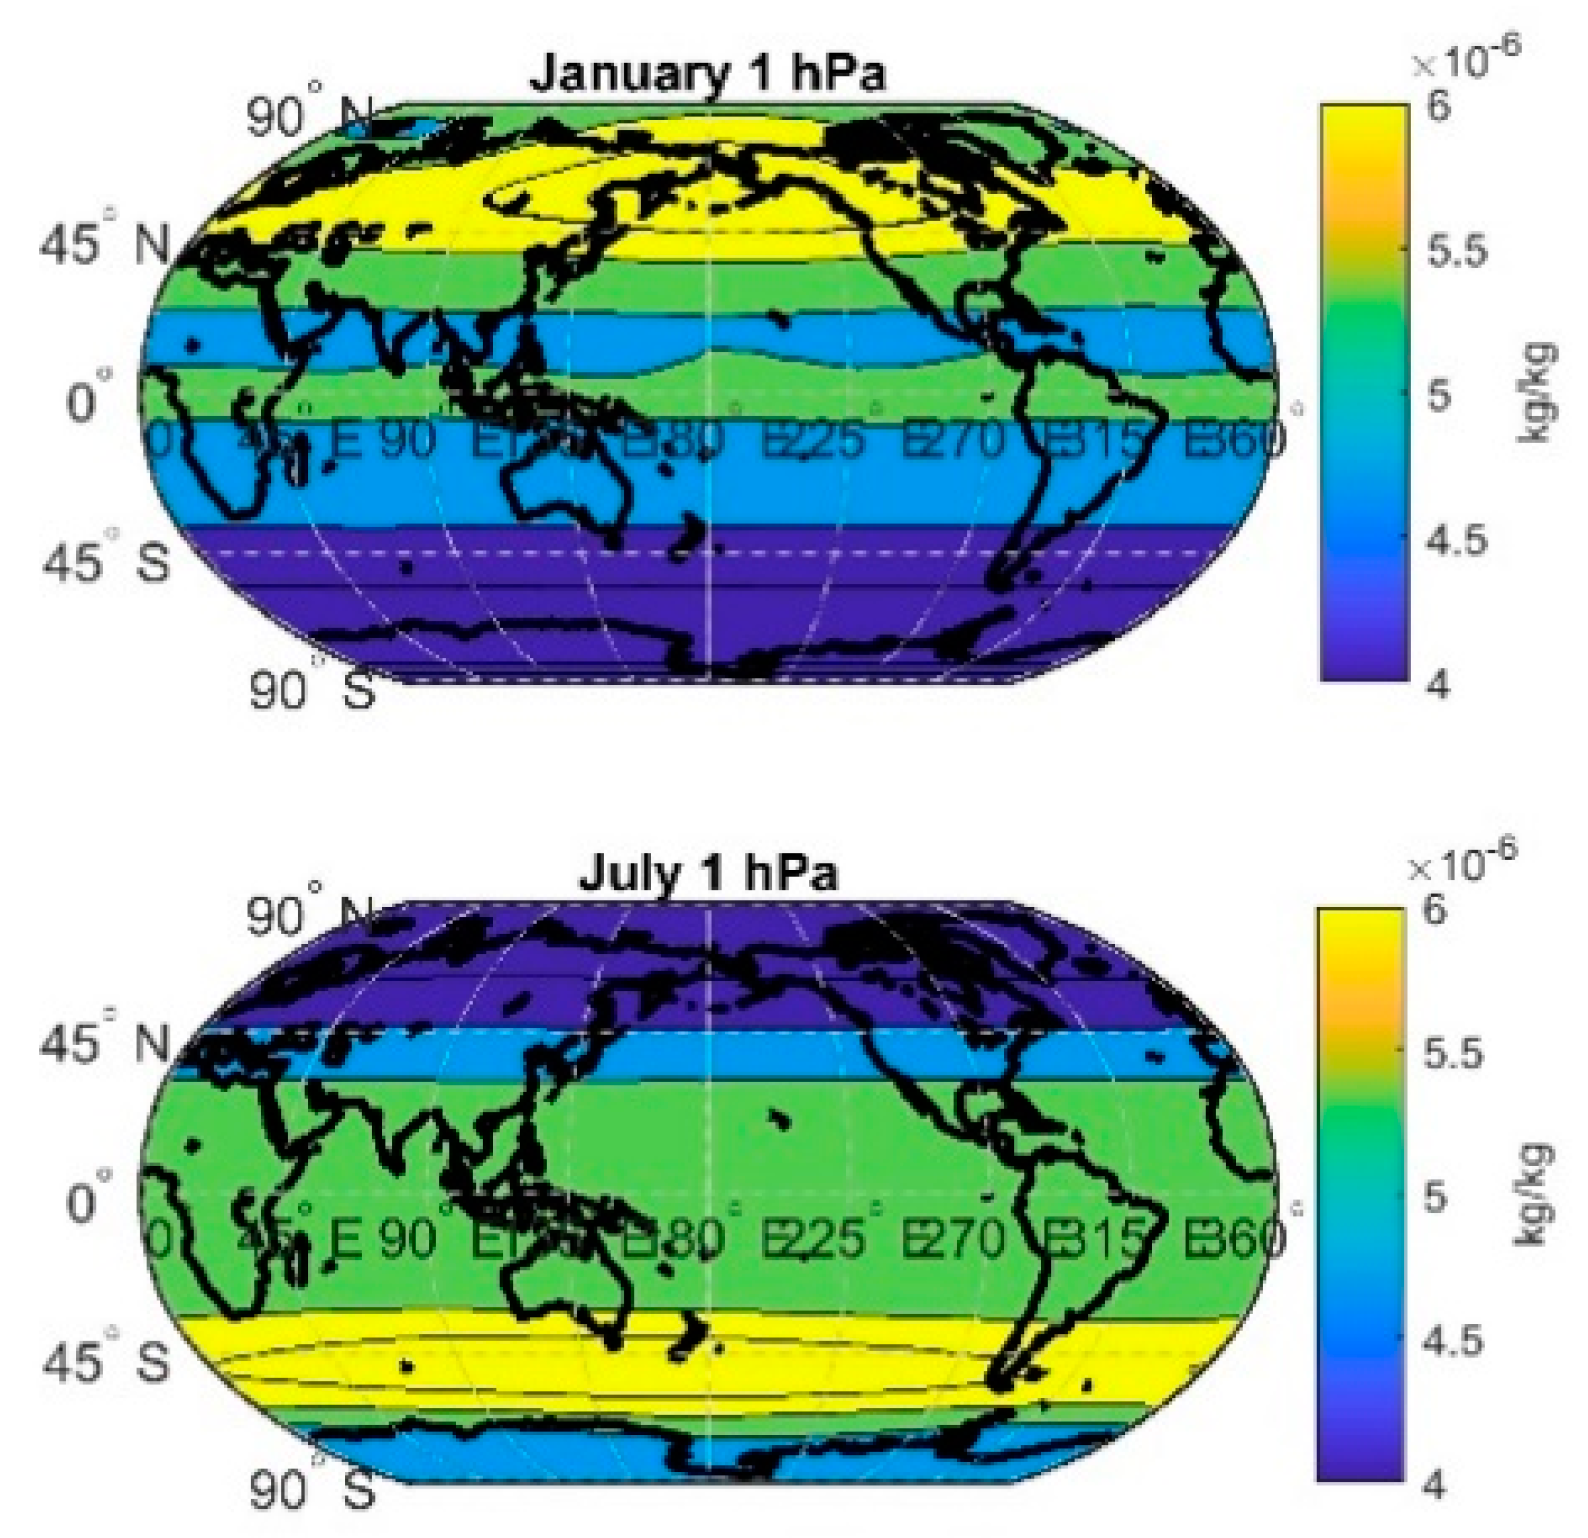
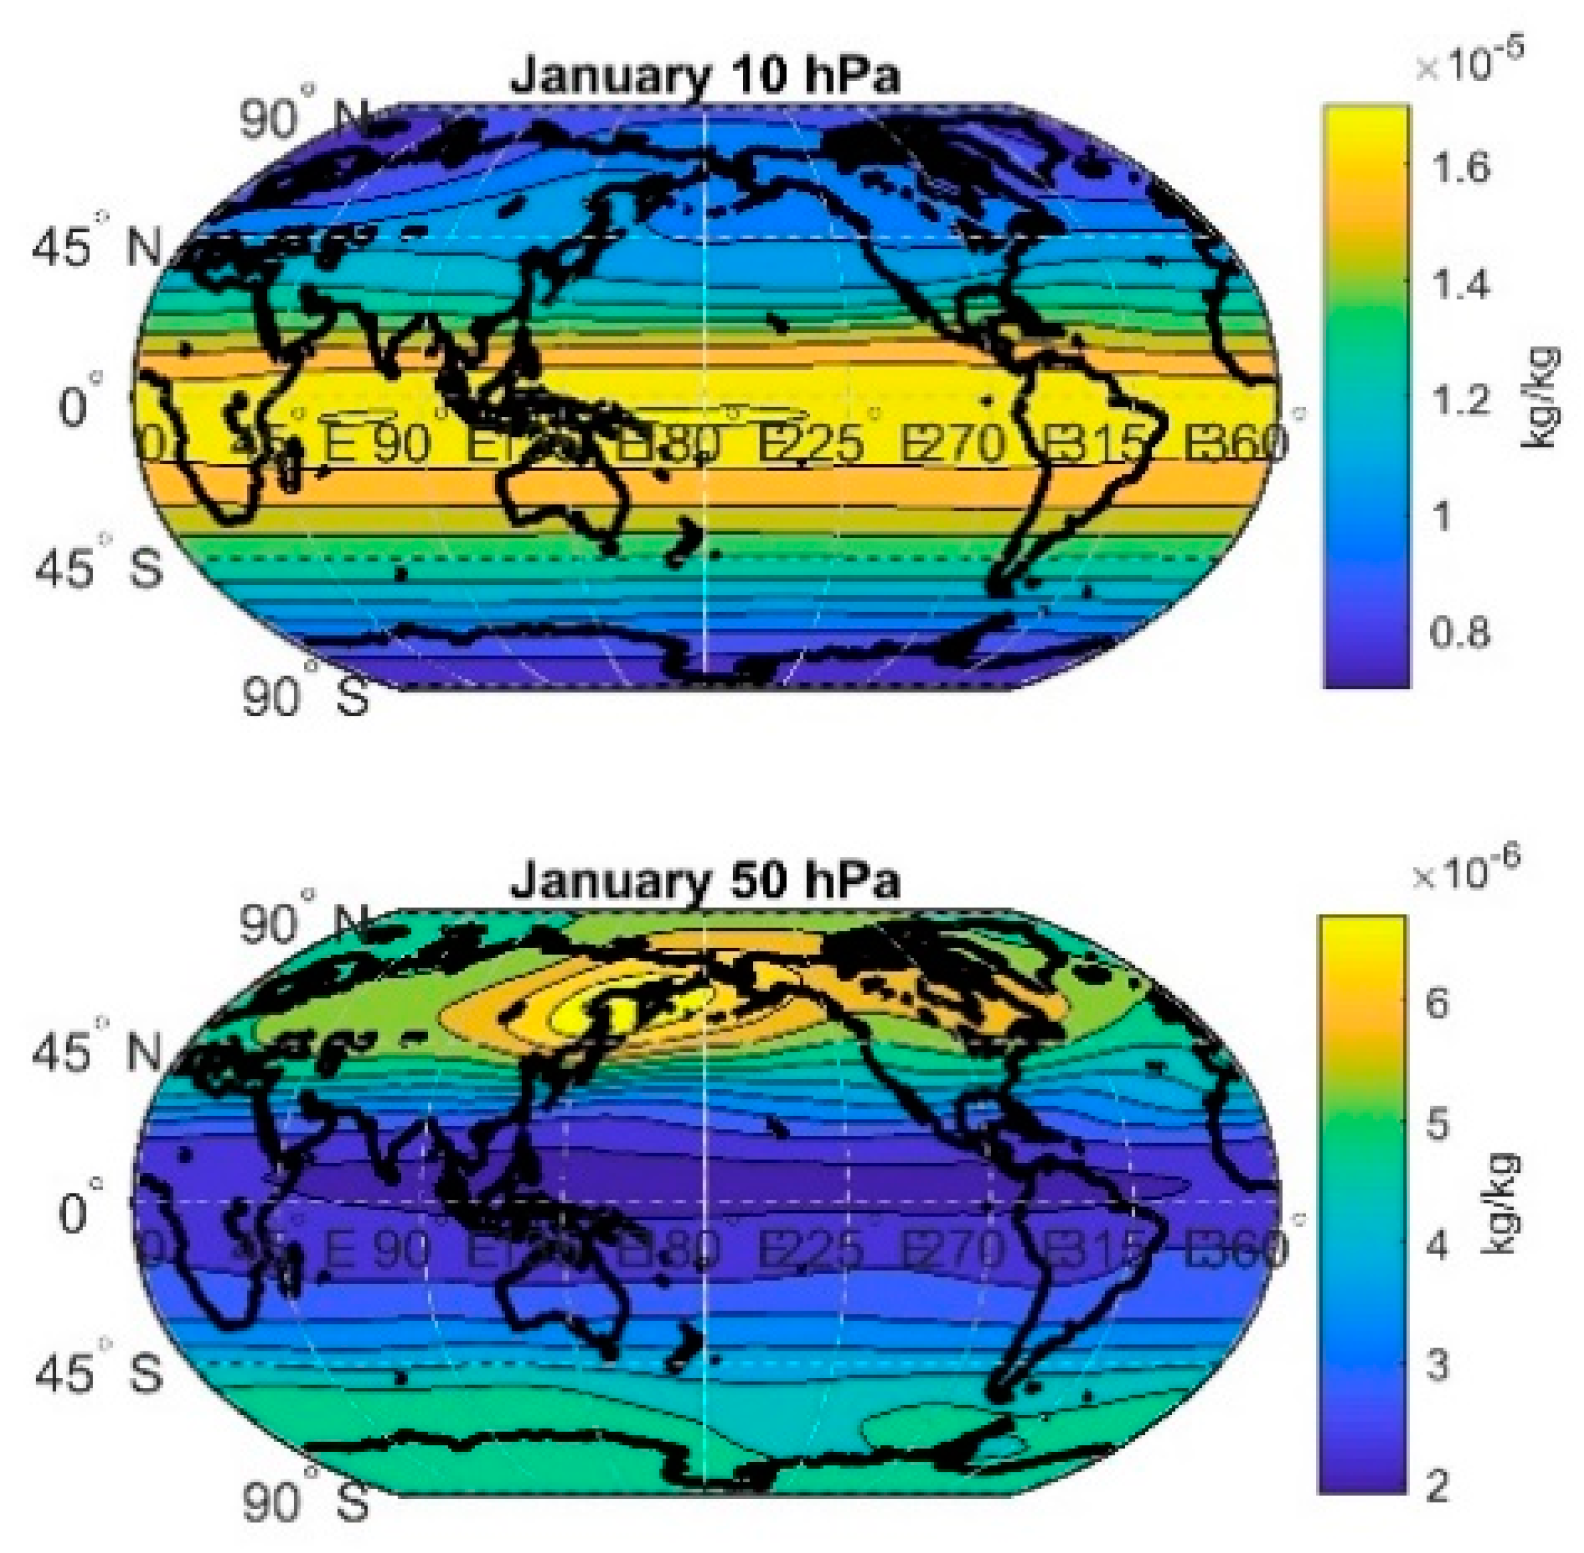
3.1. Patterns of Ozone Concentration
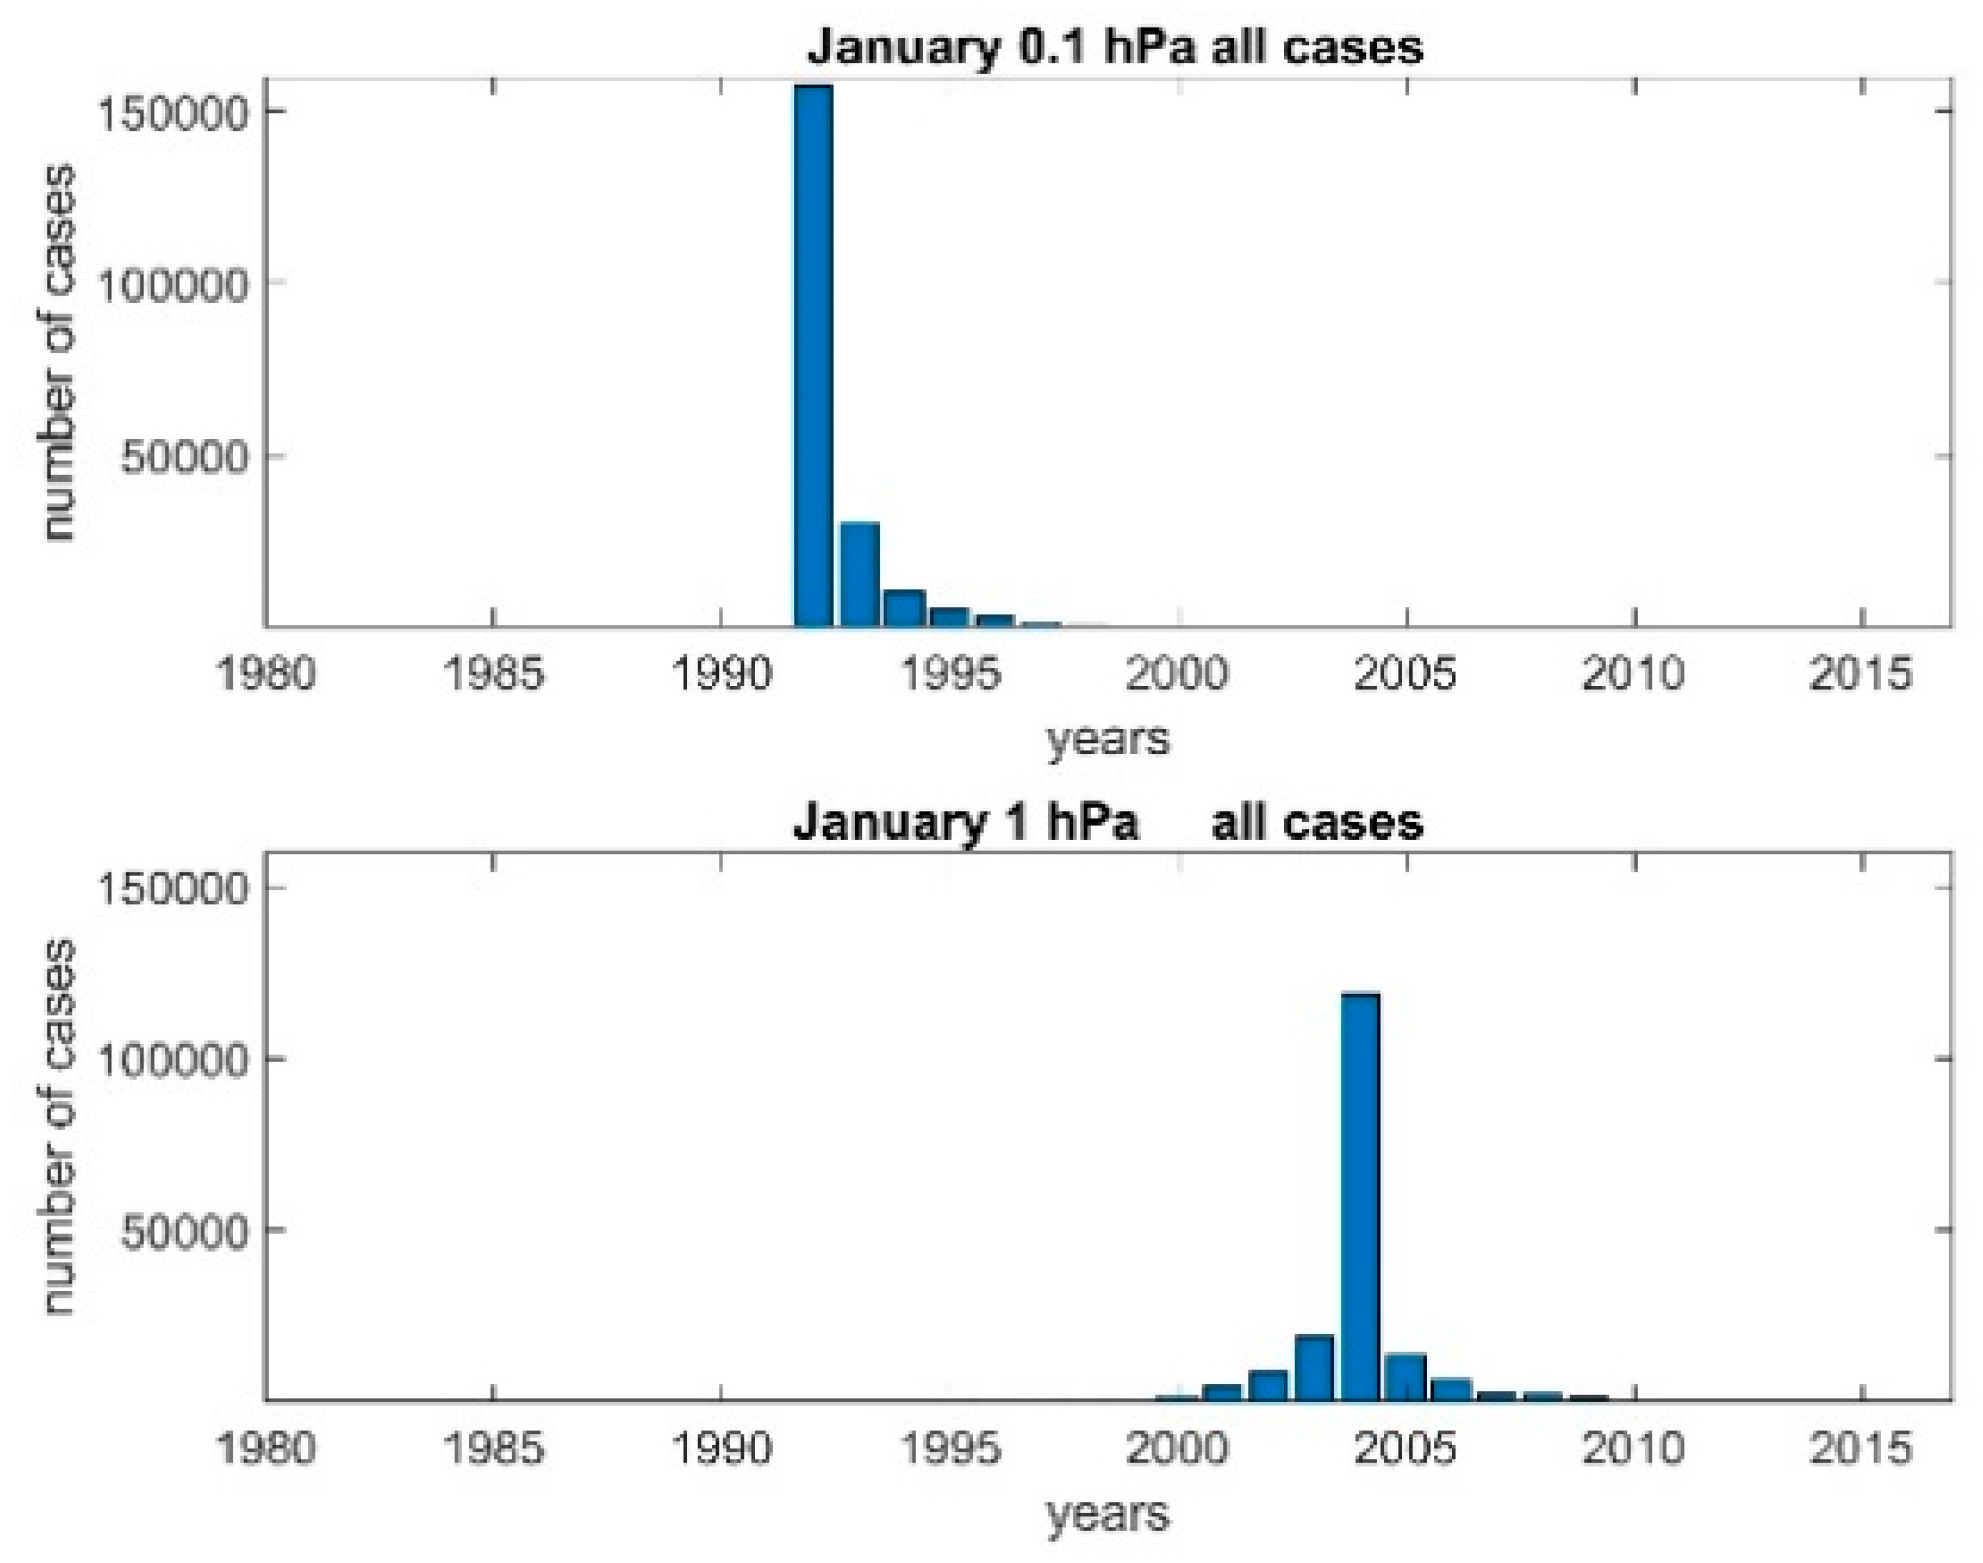
3.2. Temporal Occurrence of Discontinuities
3.3. Vertical Profile of the Discontinuities Occurrence
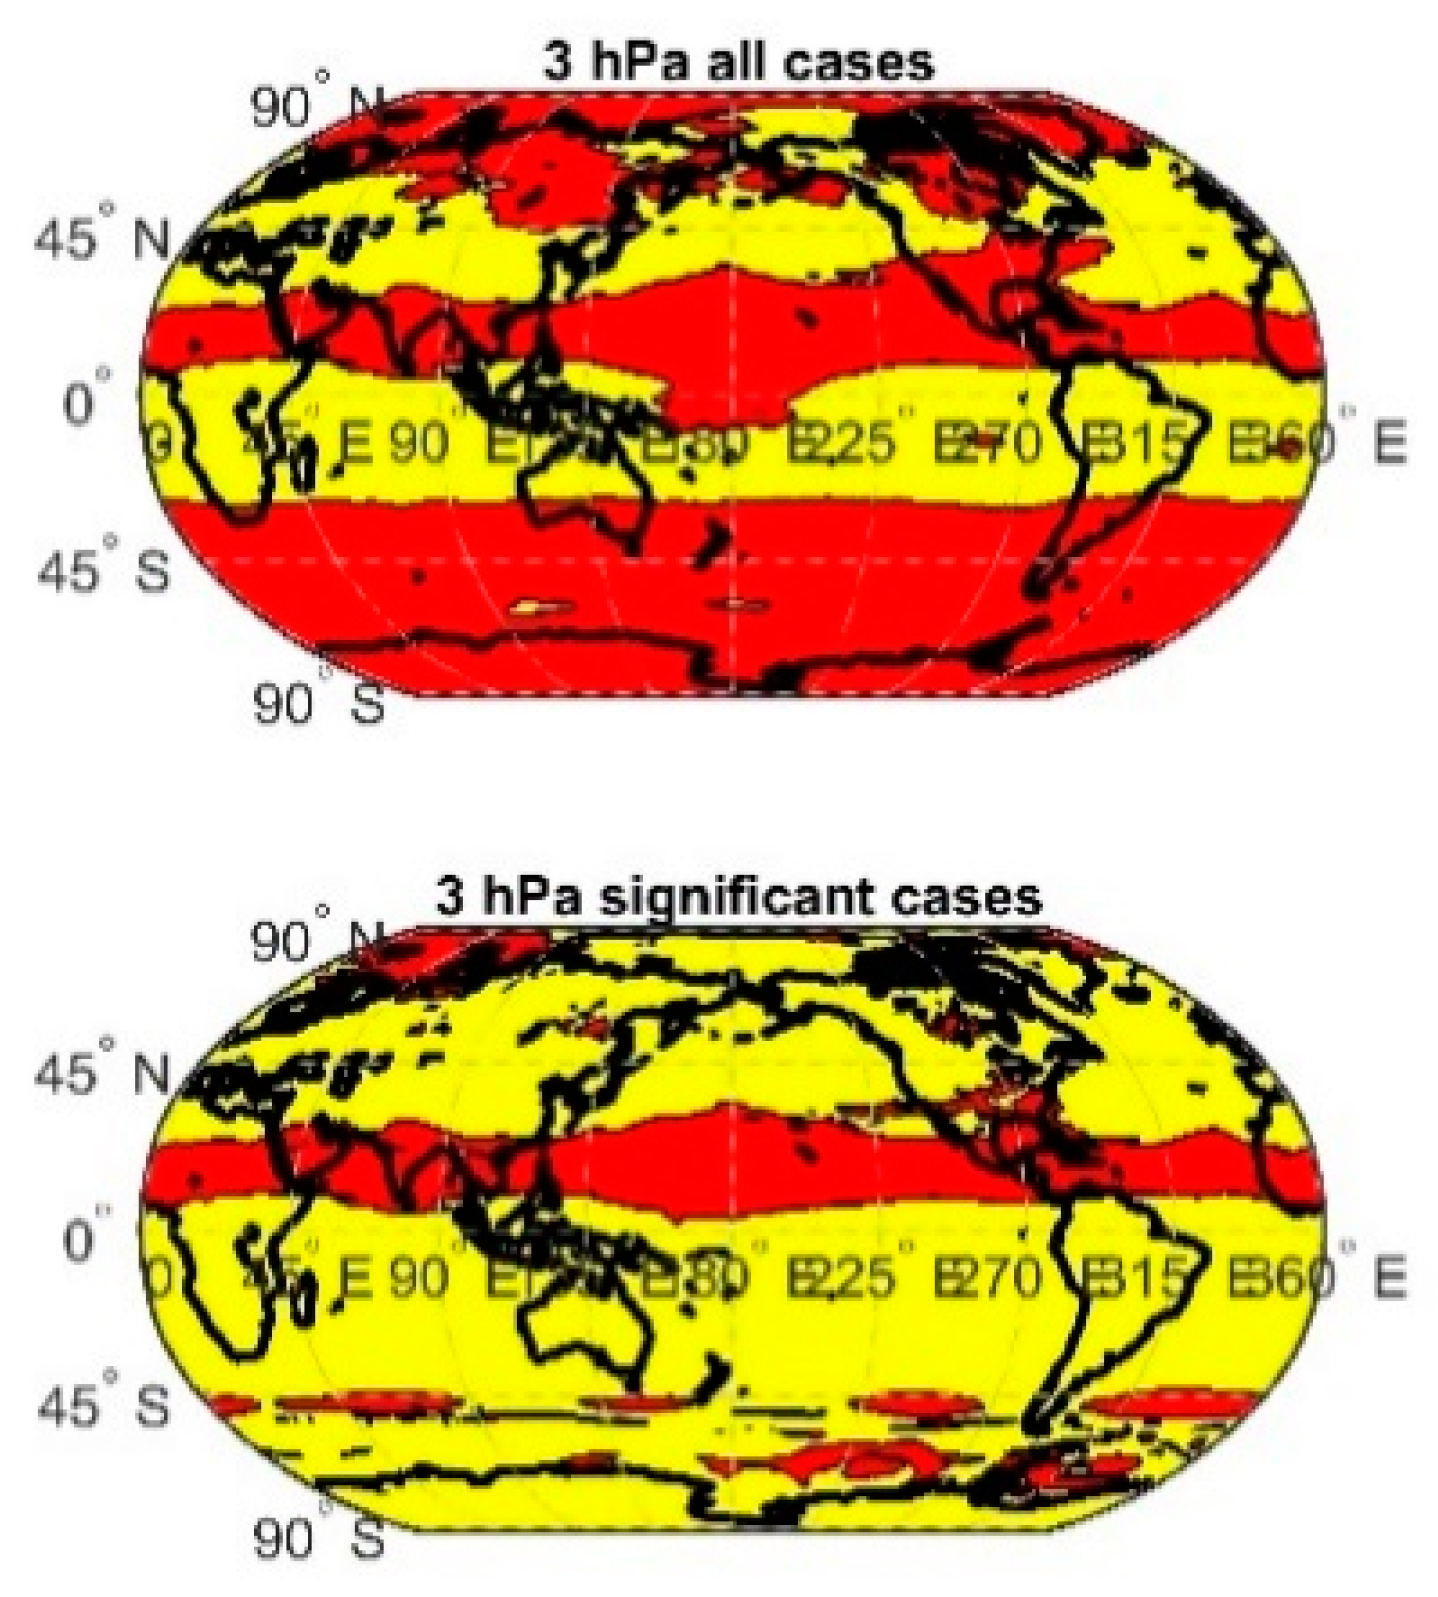
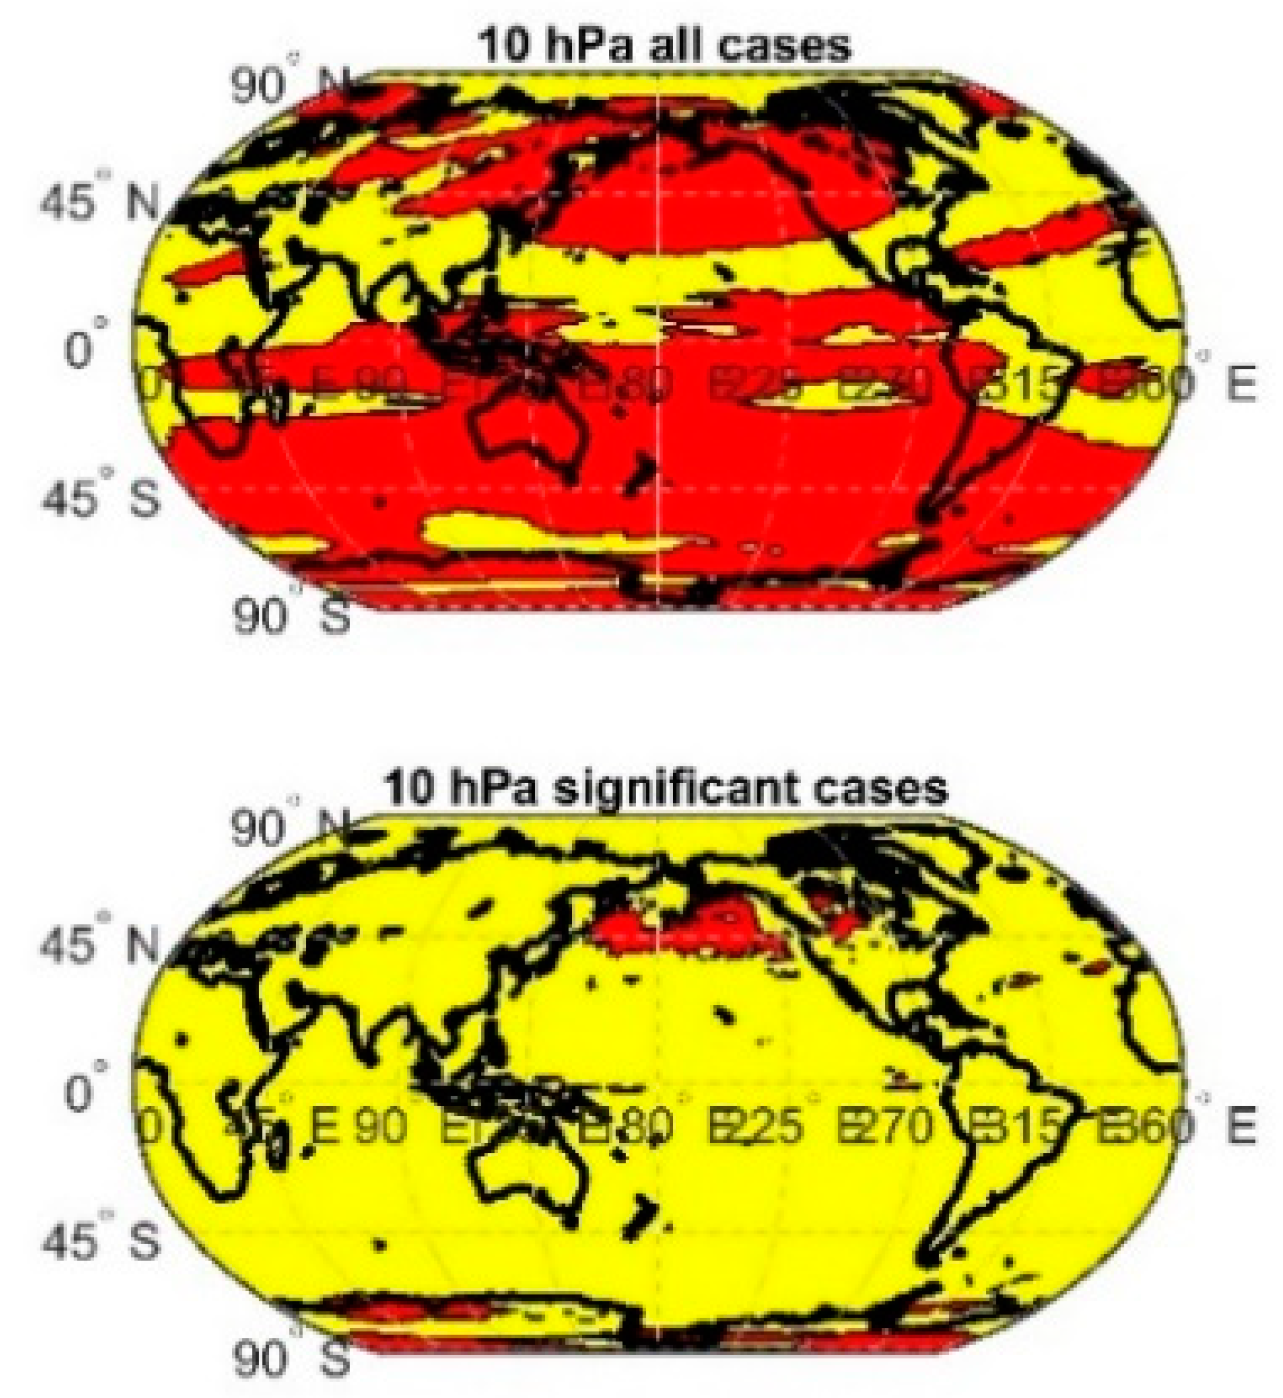
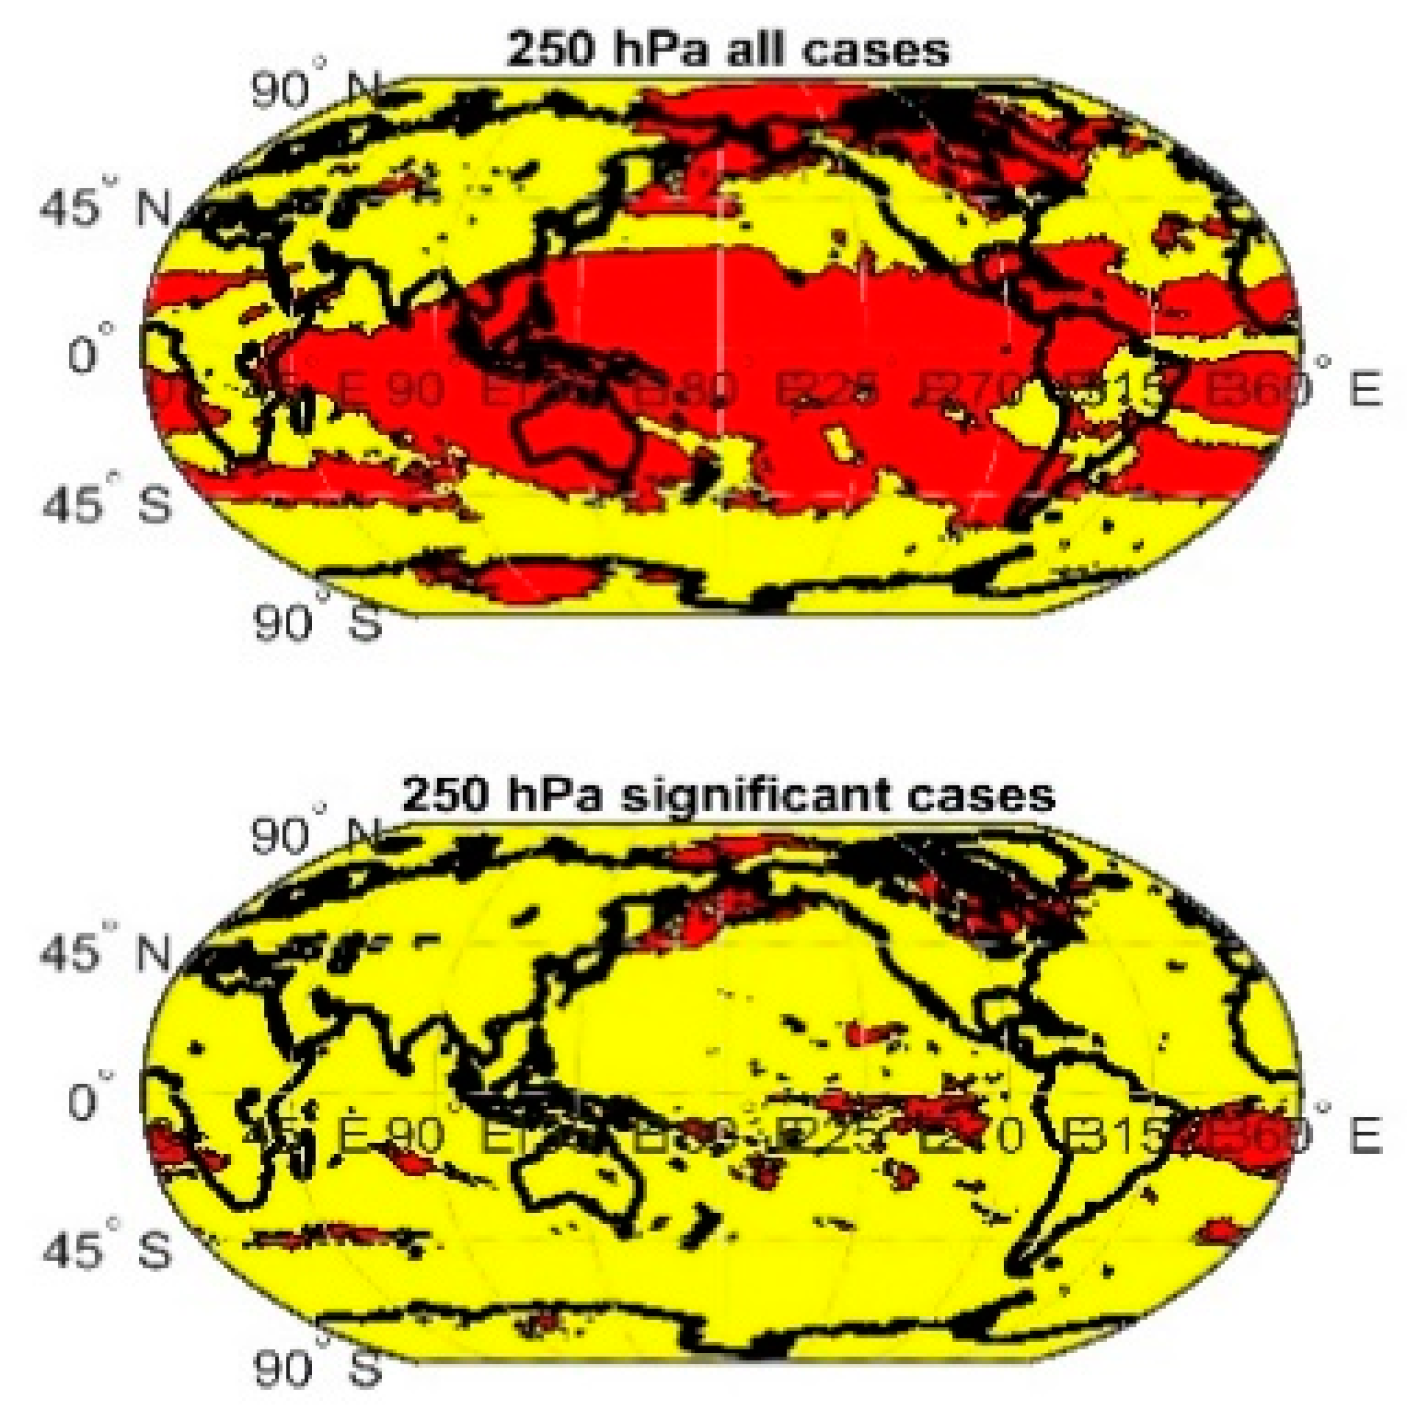
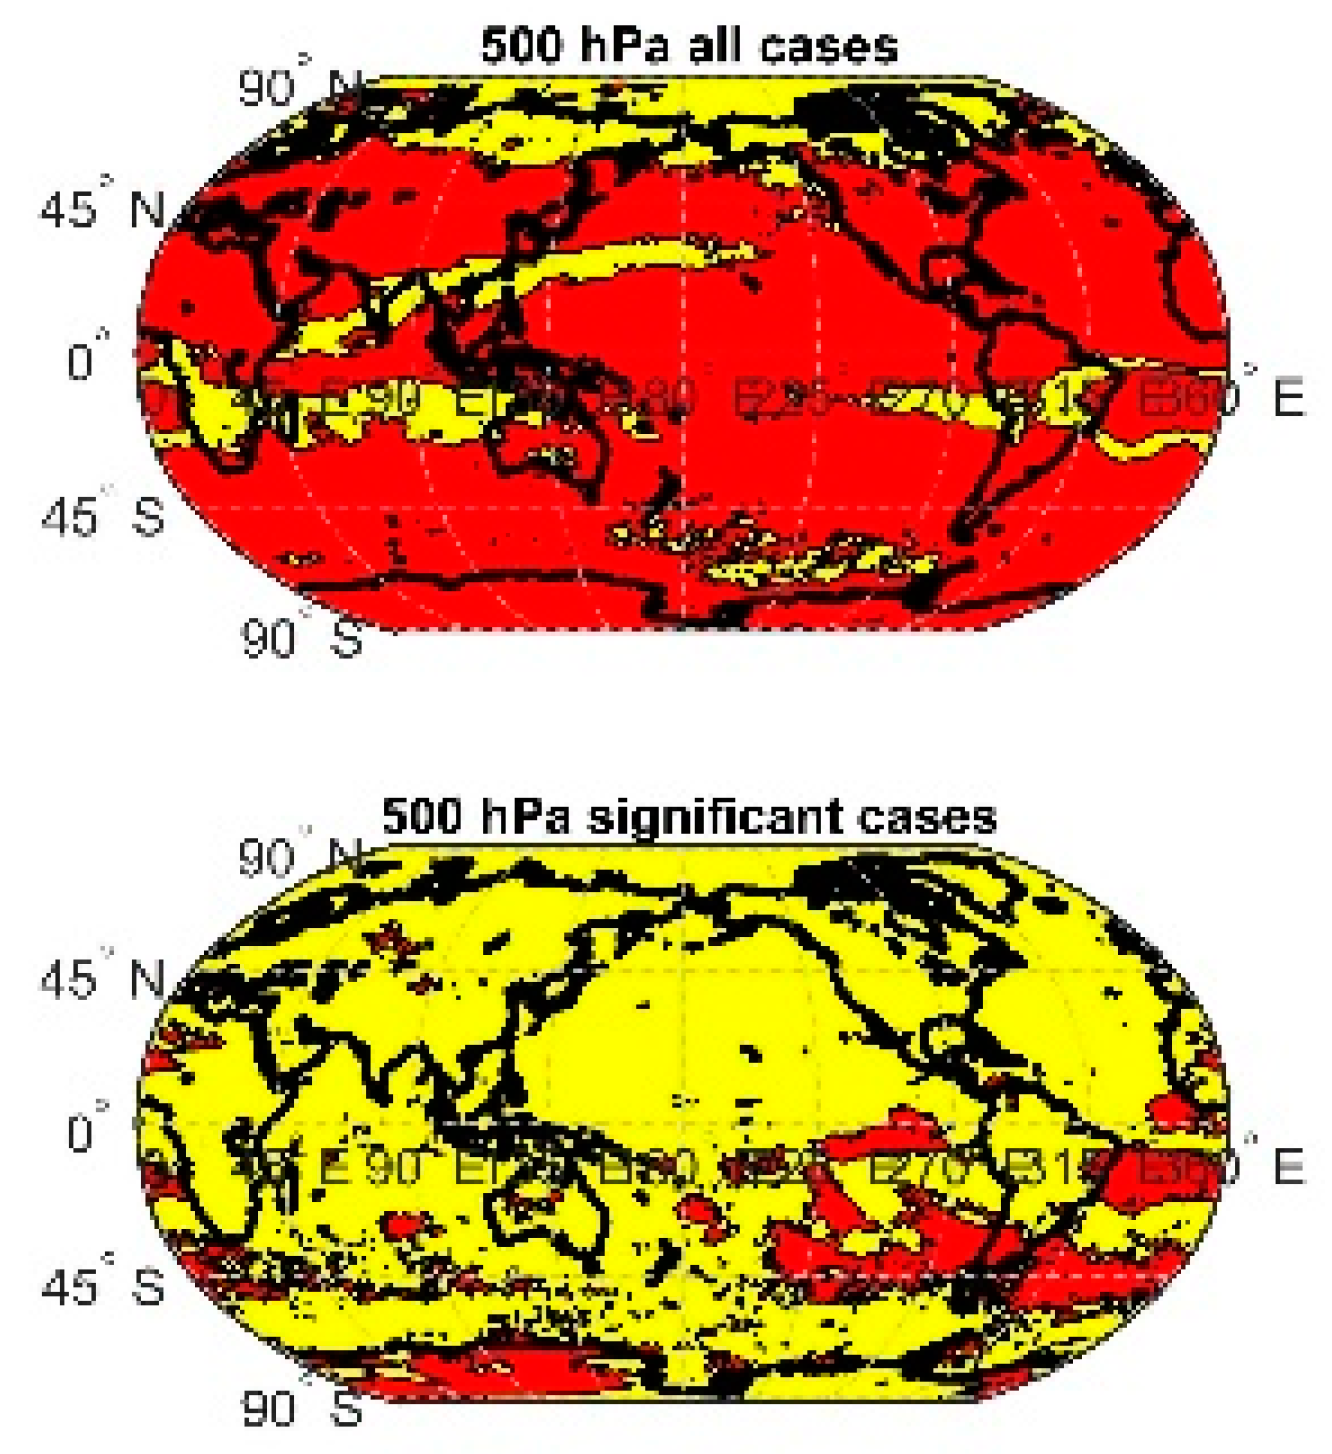
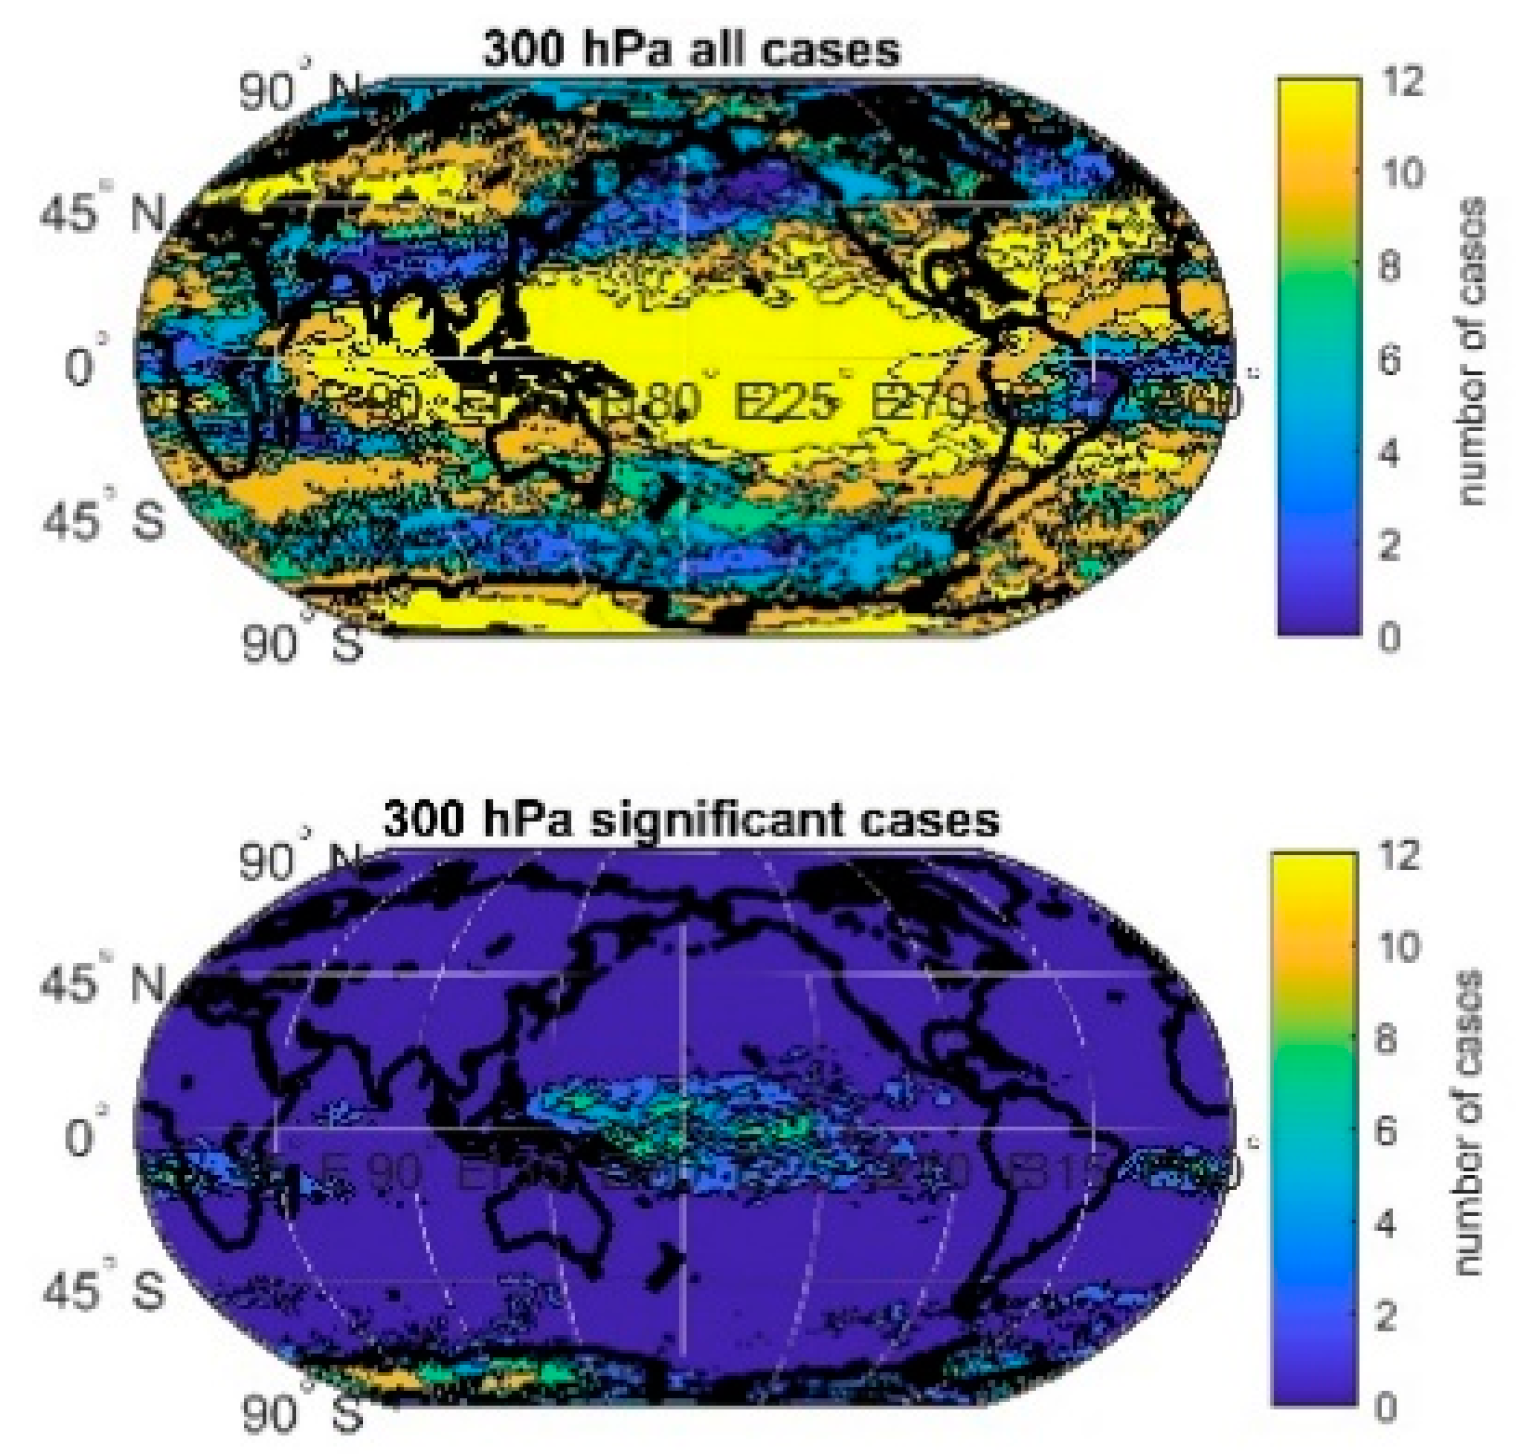
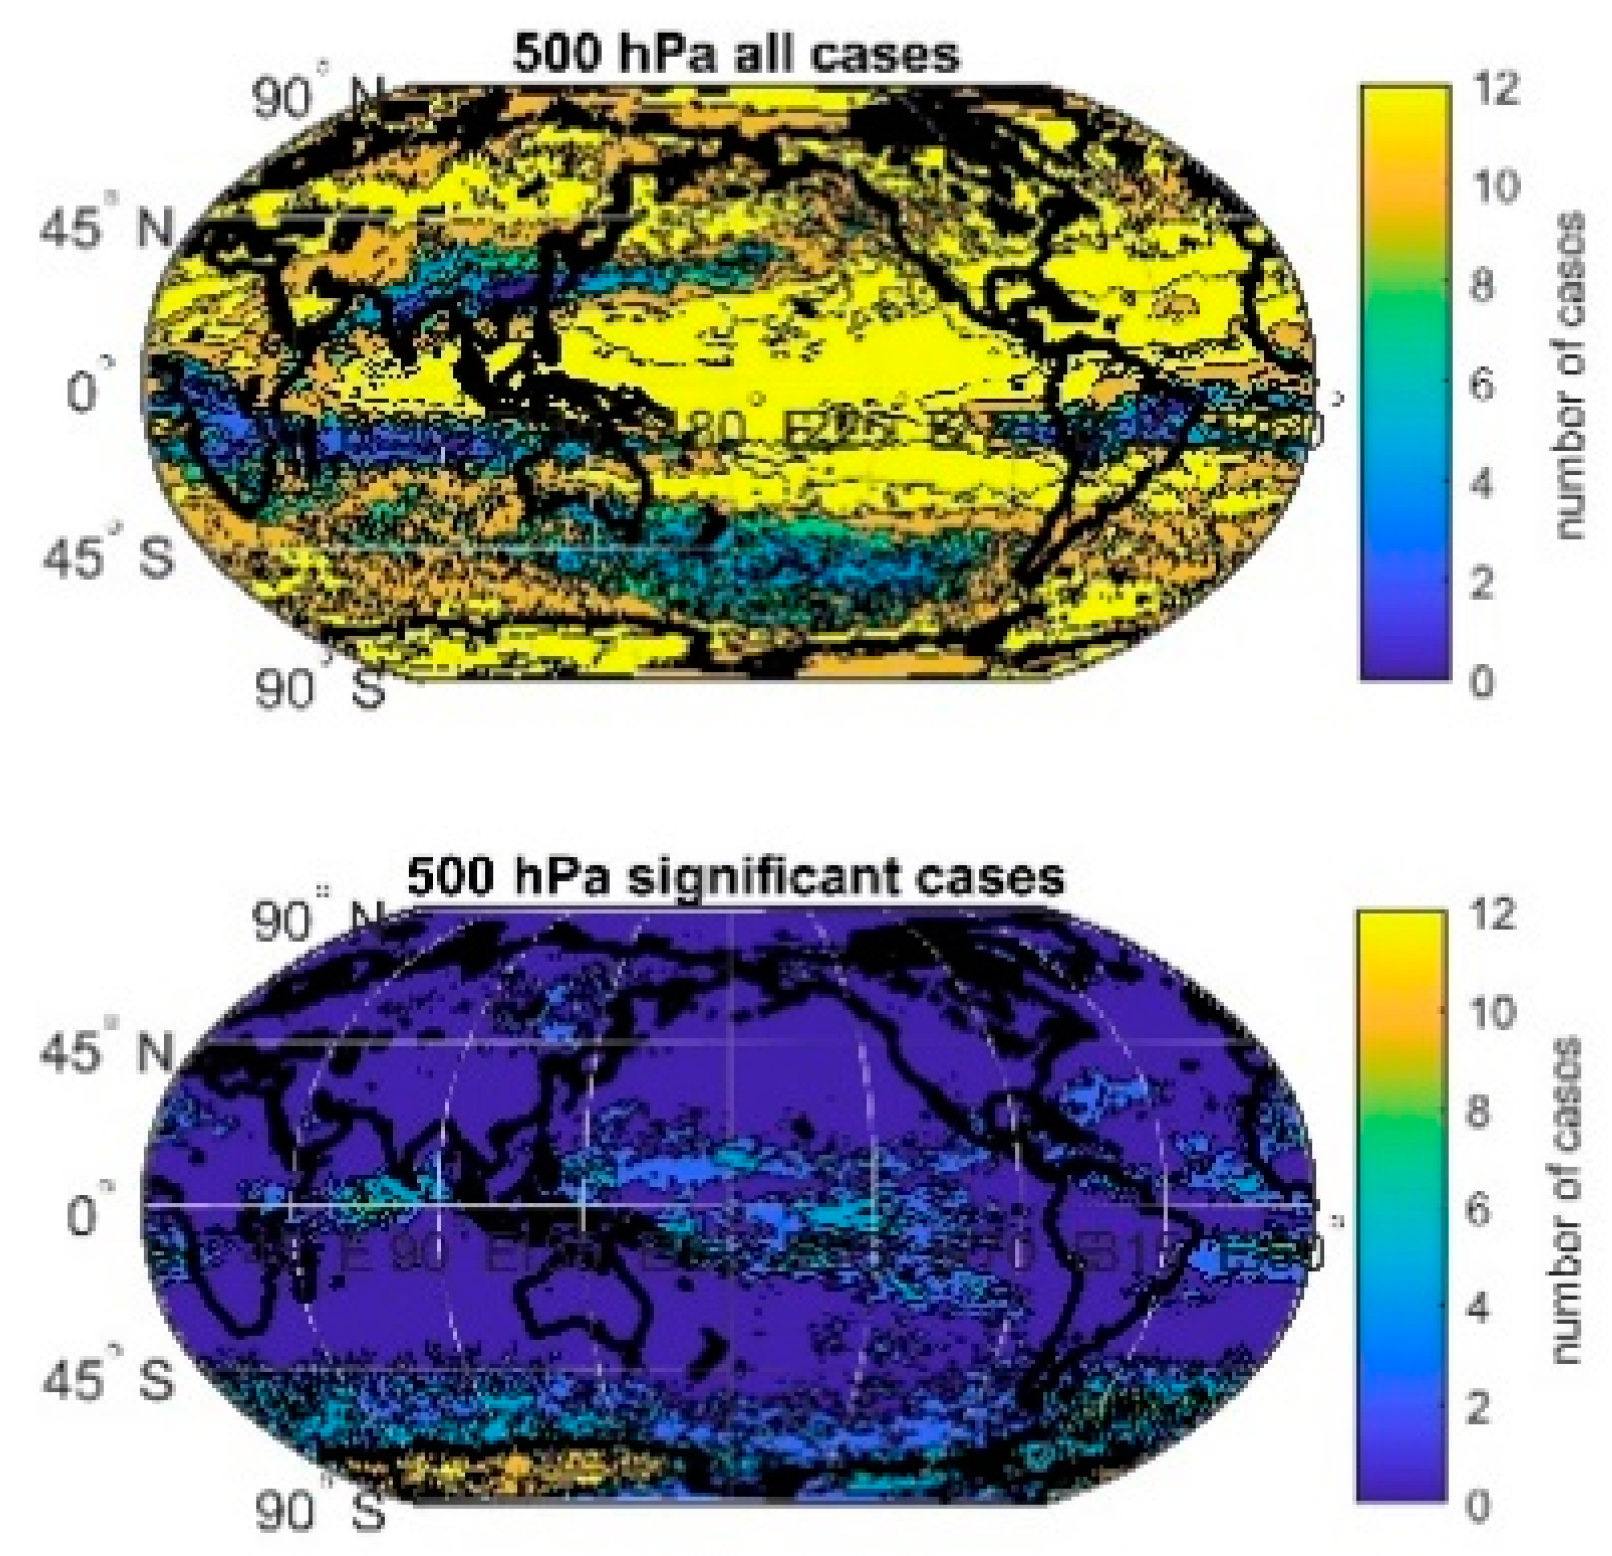
3.4. Spatial Occurrence of Discontinuities
4. Discussion
5. Conclusions
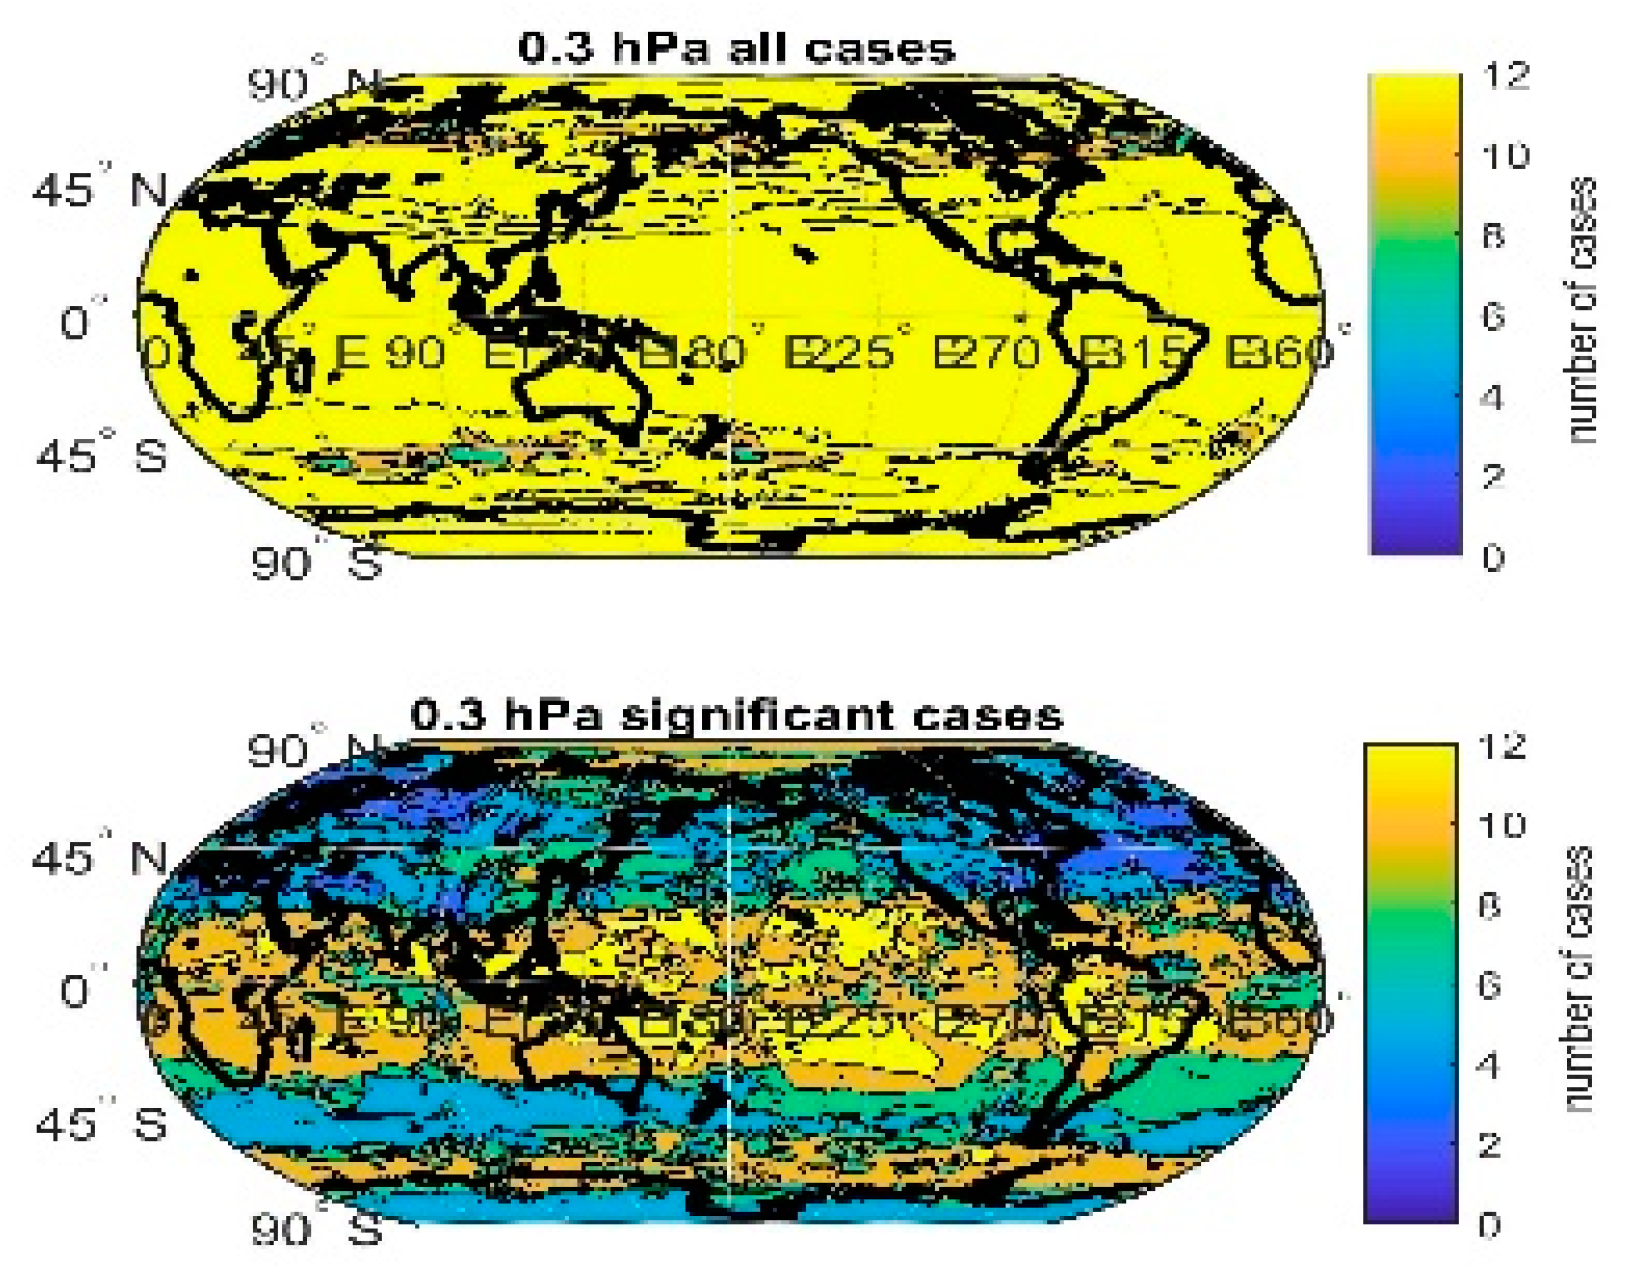
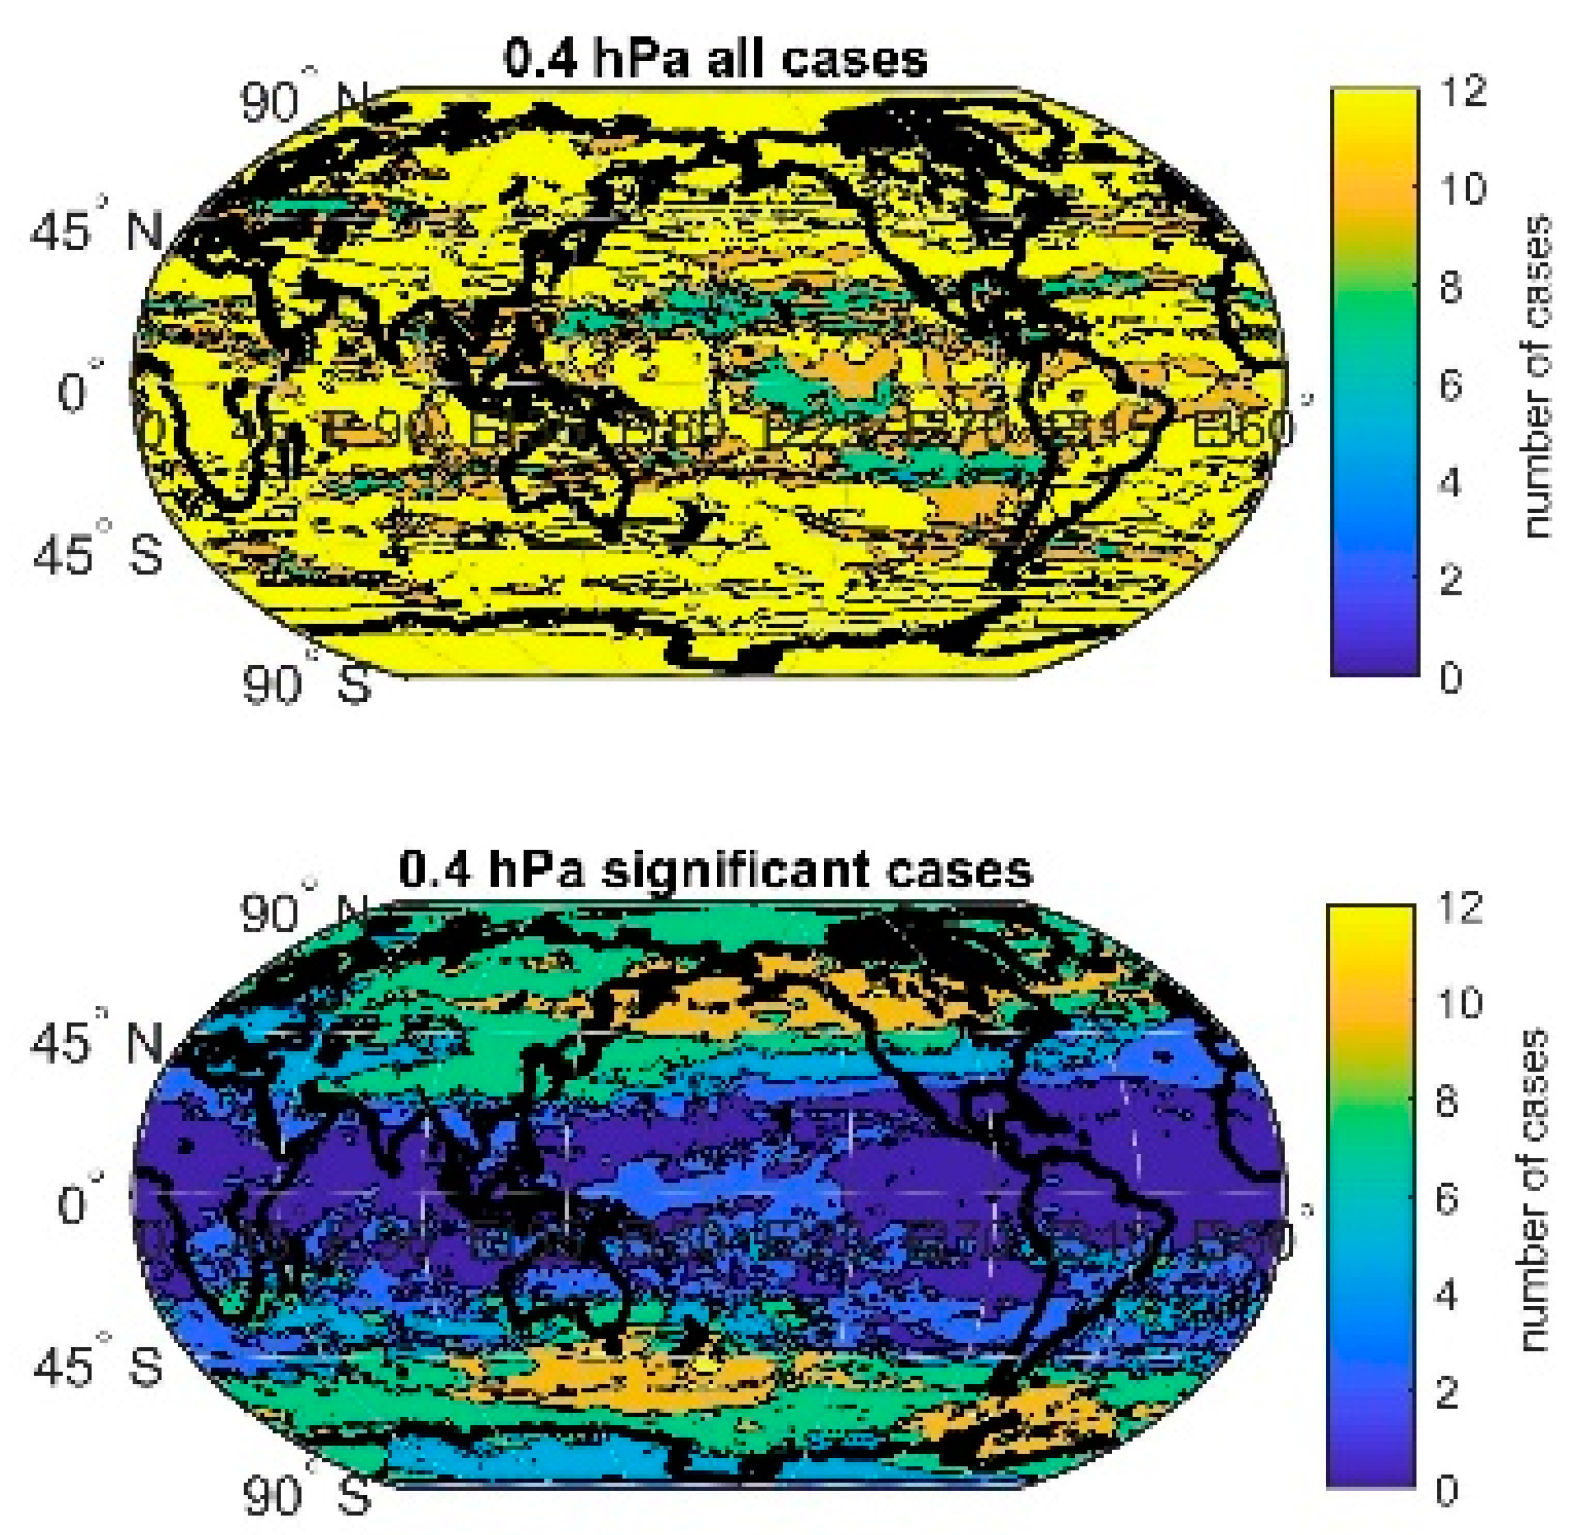
- The data above 4 hPa are not suitable for the trend analyses due to occurrence of patterns of the average ozone concentration which cannot be explained by theory and due to the frequent occurrence of the significant discontinuities
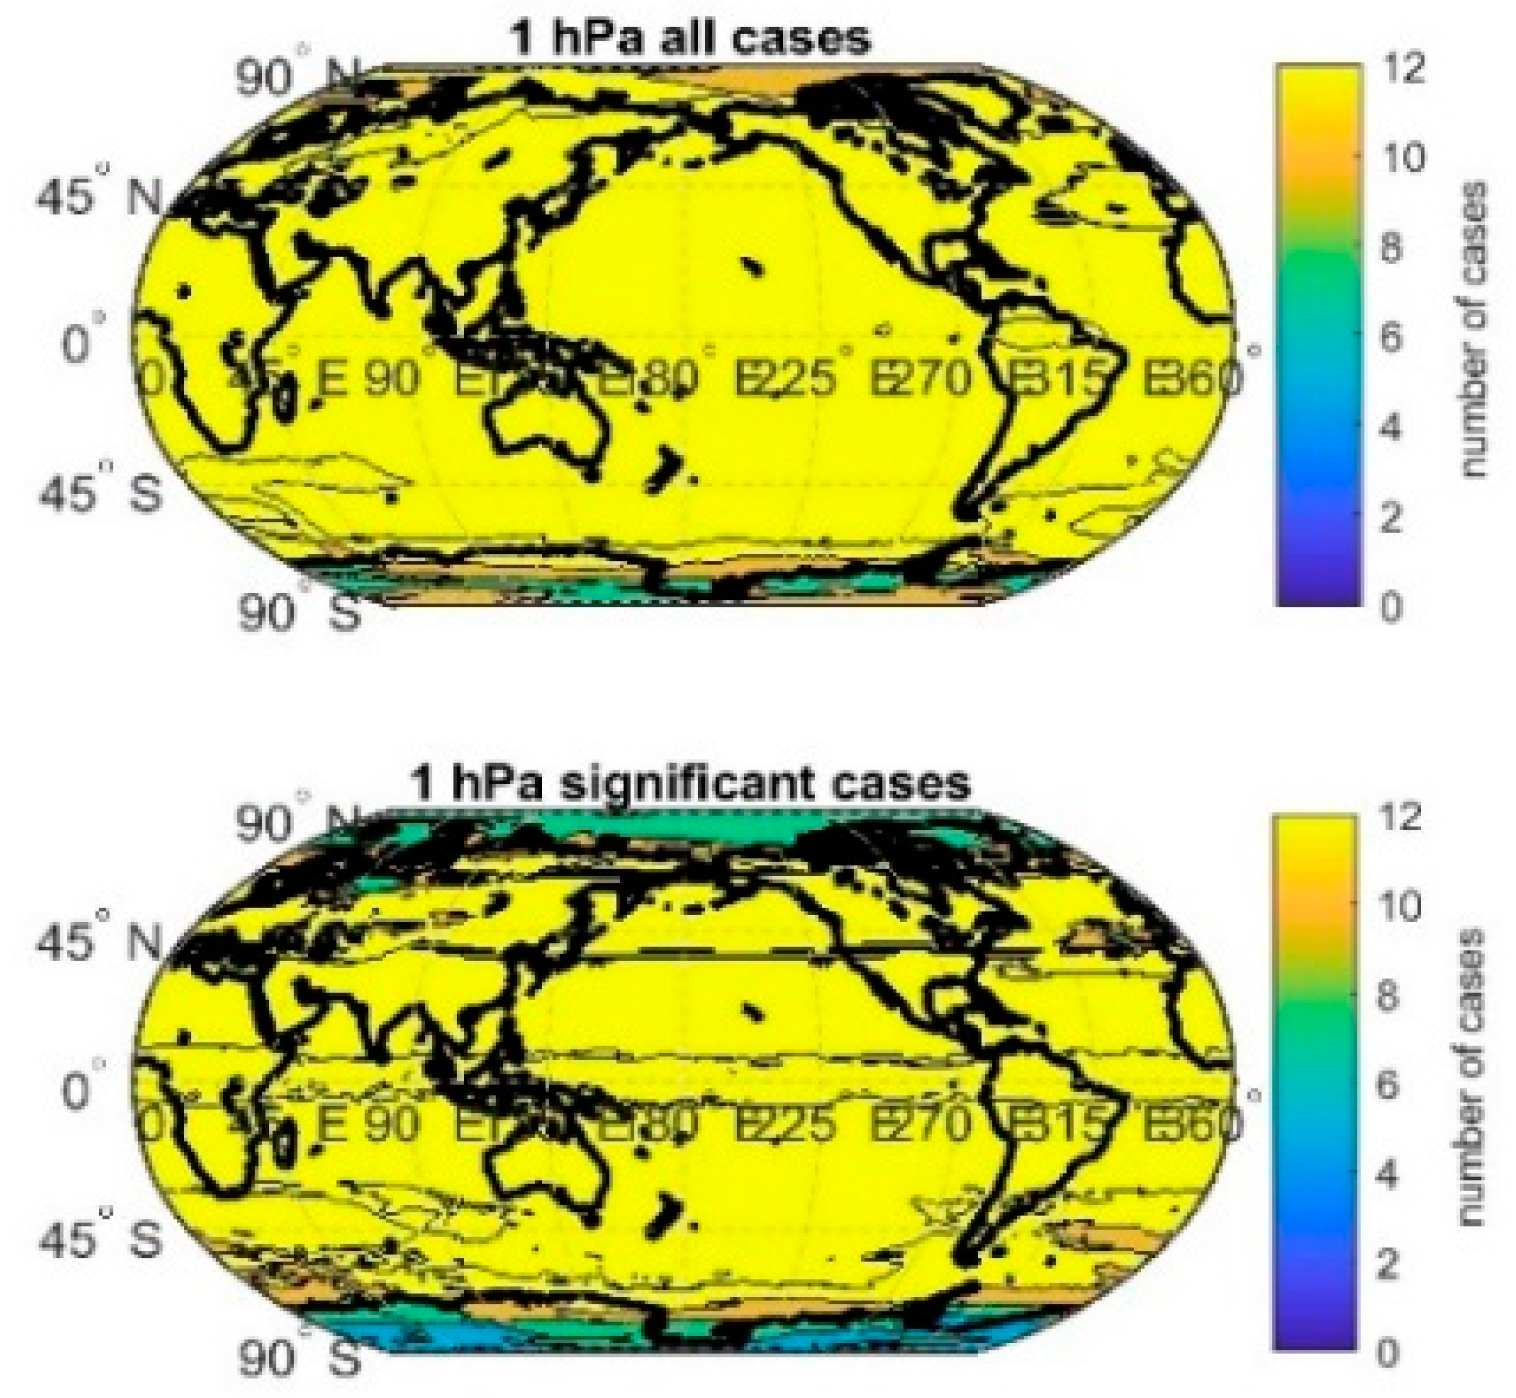
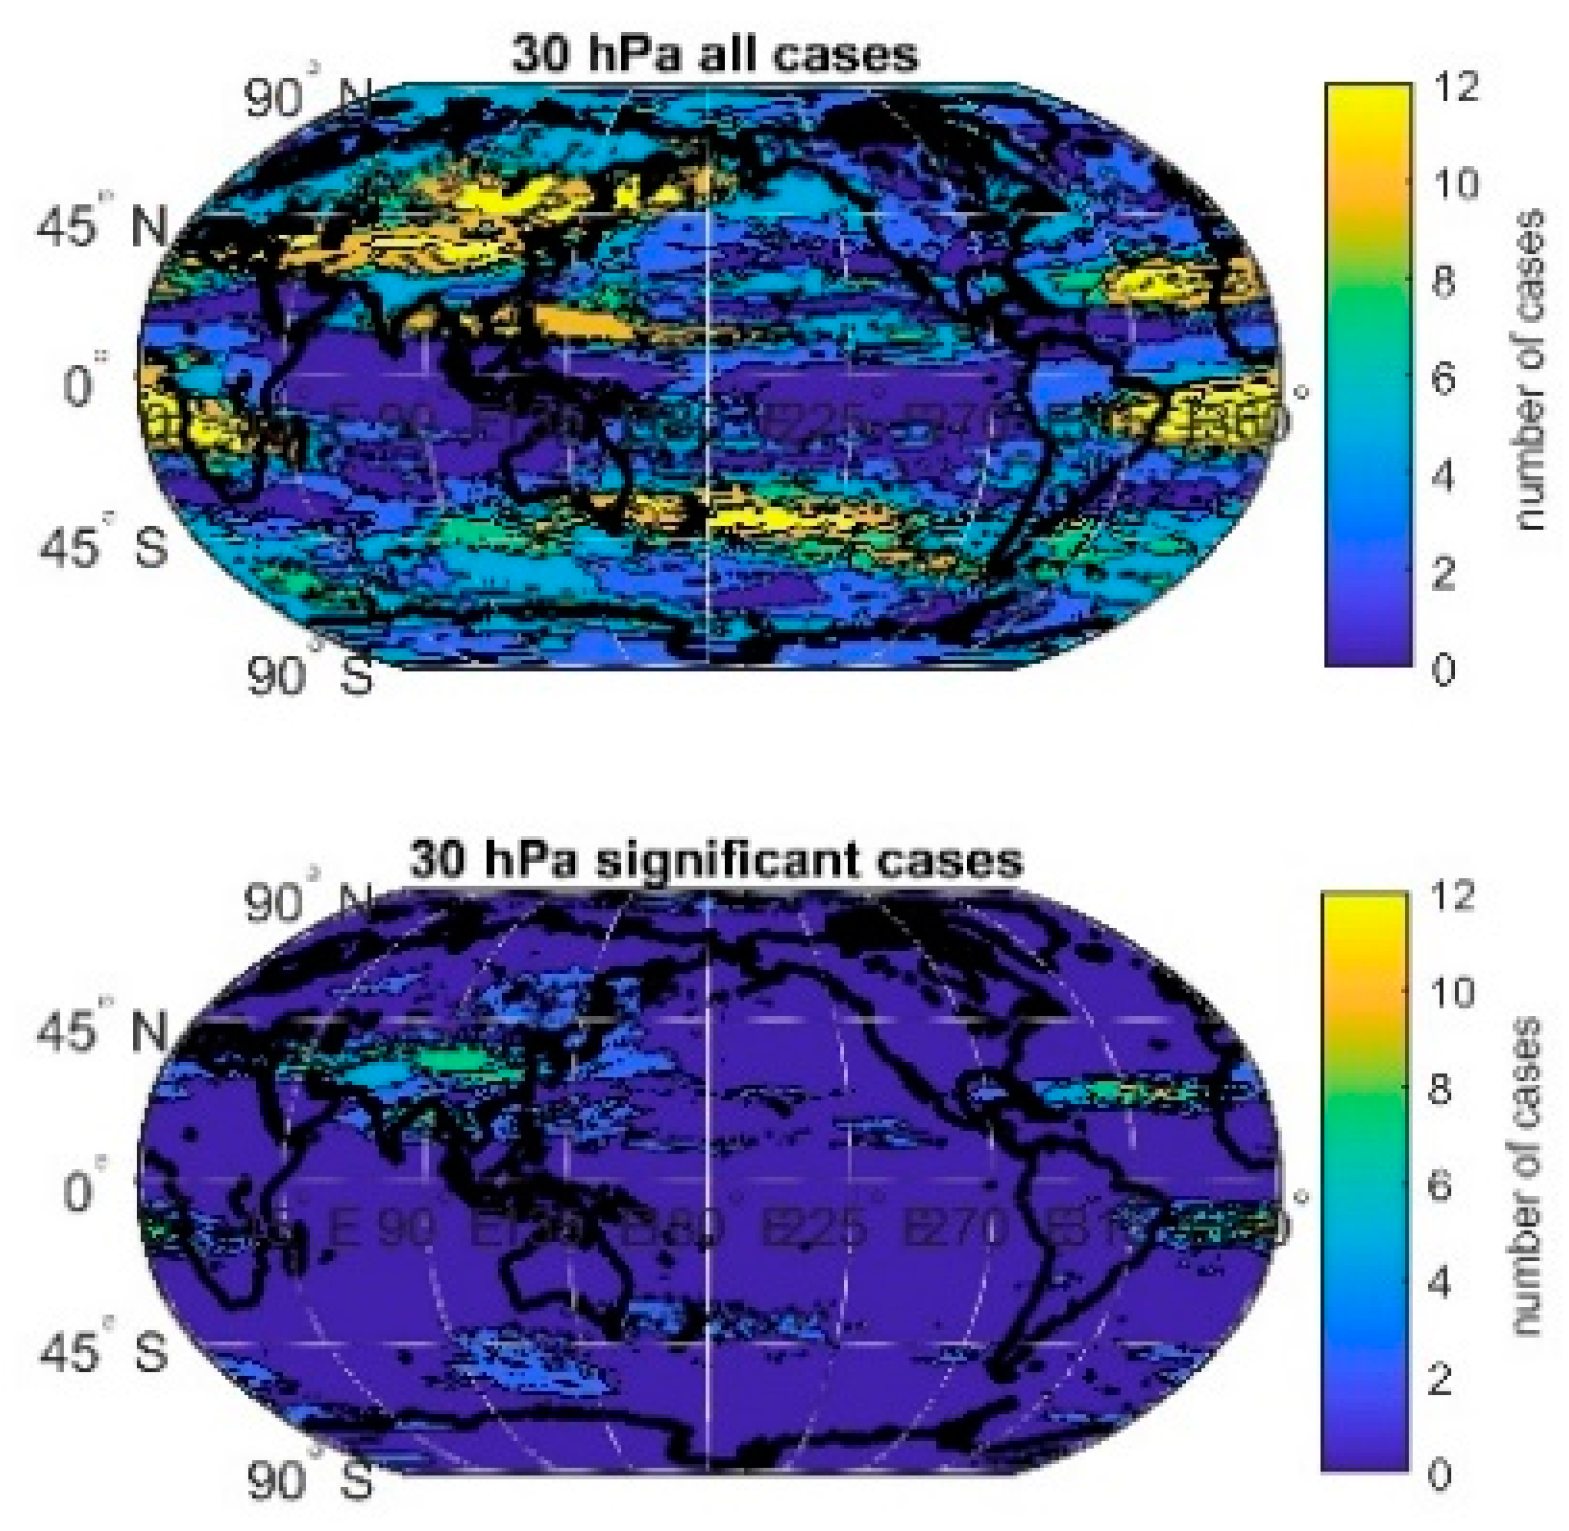
- Below 4 hPa, the number of discontinuities is smaller, and they are mostly insignificant.
- In the troposphere, the number of discontinuities is higher than in the stratosphere, but they are mostly insignificant.
- The transition from SBUV to EOS Aura data in 2004 does not have a strong influence on discontinuities occurrence below 4 hPa.
- According to our results, the MERRA 2 ozone concentration data are suitable for trend analyses below 4 hPa with caution.
Author Contributions
Funding
Conflicts of Interest
References
- Farman, J.; Gardiner, B.; Shanklin, J. Large losses of total ozone in Antarctica reveal seasonal ClOx/NOx interaction. Nature 1985, 315, 207–210. [Google Scholar] [CrossRef]
- Solomon, S. Stratospheric ozone depletion: A review of concepts and history. Rev. Geophys. 1999, 37, 275–316. [Google Scholar] [CrossRef]
- WMO. Scientific Assessment of Ozone Depletion: 2014 Global Ozone Research and Monitoring Project Report; World Meteorological Organization: Geneva, Switzerland, 2014; p. 416. [Google Scholar]
- Harris, N.R.P.; Hassler, B.; Tummon, F.; Bodeker, G.E.; Hubert, D.; Petropavlovskikh, I.; Steinbrecht, W.; Anderson, J.; Bhartia, P.K.; Boone, C.D.; et al. Past changes in the vertical distribution of ozone—Part 3: Analysis and interpretation of trends. Atmos. Chem. Phys. 2015, 15, 9965–9982. [Google Scholar] [CrossRef]
- Eyring, V.; Cionni, I.; Bodeker, G.E.; Charlton-Perez, A.J.; Kinnison, D.E.; Scinocca, J.F.; Waugh, D.W.; Akiyoshi, H.; Bekki, S.; Chipperfield, M.P.; et al. Multi-model assessment of stratospheric ozone return dates and ozone recovery in CCMVal-2 models. Atmos. Chem. Phys. 2010, 10, 9451–9472. [Google Scholar] [CrossRef]
- Waugh, D.W.; Oman, L.; Kawa, S.R.; Stolarski, R.S.; Pawson, S.; Douglass, A.R.; Newman, P.A.; Nielsen, J.E. Impacts of climate change on stratospheric ozone recovery. Geophys. Res. Lett. 2009, 36, L03805. [Google Scholar] [CrossRef]
- McLandress, C.H.; Sheepherd, T.G. Simulated anthropogenic changes in the brewer-dobson circulation, including its extension to high latitudes. J. Clim. 2009, 22, 1516–1540. [Google Scholar] [CrossRef]
- Angell, J.K.; Melissa, F. Ground-based observations of the slowdown in ozone decline and onset of ozone increase. J. Geophys. Res. 2009, 114, D07303. [Google Scholar] [CrossRef]
- Krzyscin, J.W.; Borkowski, J.L. Variabilty of the total ozone trend over Europe for the period 1950–2004 derived from reconstructed data. Atmos. Chem. Phys. 2008, 8, 2847–2857. [Google Scholar] [CrossRef]
- Jones, A.; Urban, J.; Murtagh, D.P.; Eriksson, P.; Brohede, S.; Haley, C.; Degenstein, D.; Bourassa, A.; von Savigny, C.; Sonkaew, T.; et al. Evolution of stratospheric ozone and water vapour time series studied with satellite measurements. Atmos. Chem. Phys. 2009, 9, 6055–6075. [Google Scholar] [CrossRef]
- Bengtsson, L.; Hagemann, S.; Hodges, K.I. Can climate trends be calculated from reanalysis data? J. Geophys. Res. Atmos. 2004, 109, D11111. [Google Scholar] [CrossRef]
- Shangguan, M.; Wang, W.; Jin, S. Variability of temperature and ozone in the upper troposphere and lower stratosphere from multi-satellite observations and reanalysis data. Atmos. Chem. Phys. 2019, 19, 6659–6679. [Google Scholar] [CrossRef]
- Takacs, L.L.; Suárez, M.J.; Todling, R. Maintaining atmospheric mass and water balance in reanalyses. Q. J. Roy. Meteorol. Soc. 2016, 142, 1565–1573. [Google Scholar] [CrossRef] [PubMed]
- Molod, A.; Takacs, L.; Suarez, M.; Bacmeister, J. Development of the GEOS-5 atmospheric general circulation model: Evolution from MERRA to MERRA2. Geosci. Model Dev. 2015, 8, 1339–1356. [Google Scholar] [CrossRef]
- Coy, L.; Wargan, K.; Molod, A.M.; McCarty, W.R.; Pawson, S. Structure and dynamics of the quasi-biennial oscillation in MERRA-2. J. Clim. 2016, 29, 5339–5354. [Google Scholar] [CrossRef] [PubMed]
- Randles, C.A.; da Silva, A.M.; Buchard, V.; Darmenov, A.; Colarco, P.R.; Aquila, V.; Bian, H.; Nowottnick, E.P.; Pan, X.; Smirnov, A.; et al. The MERRA-2 aerosol assimilation, NASA Technical Report Series on Global Modeling and Data Assimilation, Volume 45; NASA/TM-2016-104606; NASA Goddard Space Flight Center: Greenbelt, MD, USA, 2016.
- Fujiwara, M.; Wright, J.S.; Manney, G.L.; Gray, L.J.; Anstey, J.; Birner, T.; Davis, S.; Gerber, E.P.; Harvey, V.L.; Hegglin, M.I.; et al. Introduction to the SPARC Reanalysis Intercomparison Project (S-RIP) and overview of the reanalysis systems. Atmos. Chem. Phys. 2017, 17, 1417–1452. [Google Scholar] [CrossRef]
- Gelaro, R.W.; McCarty, M.J.; Suárez, R.; Todling, A.; Molod, L.; Takacs, C.A.; Randles, A.; Darmenov, M.G.; Bosilovich, R.; Reichle, K.; et al. The modern-era retrospective analysis for research and applications, Version 2 (MERRA-2). J. Clim. 2017, 30, 5419–5454. [Google Scholar] [CrossRef]
- Pettitt, A.N. A non-parametric approach to the change point detection. Appl. Statist. 1979, 28, 126–135. [Google Scholar] [CrossRef]
- Javari, M. Trend and homogeneity analysis of precipitation in Iran. Climate 2016, 4, 44. [Google Scholar] [CrossRef]
- Firat, M.; Dikbas, F.; Cem Koç, A.; Gungor, M. Missing data analysis and homogeneity test for Turkish precipitation series. Sadhana 2010, 35, 707–720. [Google Scholar] [CrossRef]
- Wijngaard, J.B.; Klein Tank, A.M.G.; Knnen, G.P. Homogeneity of 20th century European daily temperature and precipitation series. Int. J. Climatol. 2003, 23, 679–692. [Google Scholar] [CrossRef]
- Kruskal, W.H. Historical notes on the Wilcoxon unpaired two-sample test. J. Am. Stat. Assoc. 1957, 52, 356–360. [Google Scholar] [CrossRef]
- Dütsch, H.U. The ozone distribution in the atmosphere. Can. J. Chem. 1974, 52, 1491–1504. [Google Scholar] [CrossRef]
- Williams, R.S.; Hegglin, M.I.; Kerridge, B.J.; Jöckel, P.; Latter, B.G.; Plummer, D.A. Characterising the seasonal and geographical variability in tropospheric ozone, stratospheric influence and recent changes. Atmos. Chem. Phys. 2019, 19, 3589–3620. [Google Scholar] [CrossRef]
- Rowland, F.S. Stratospheric ozone depletion. Philos. Trans. R. Soc. Lond. B Biol. Sci. 2006, 361, 769–790. [Google Scholar] [CrossRef] [PubMed]
- Lastovicka, J.; Buresova, D.; Boska, J. Does the QBO and the Mt. Pinatubo eruption affect the gravity wave activity in the lower ionosphere? Studia Geophys. Geod. 1998, 42, 170–182. [Google Scholar] [CrossRef]
- Wargan, K.; Labow, G.; Frith, S.; Pawson, S.; Livesey, N.; Partyka, G. Evaluation of the ozone fields in NASA’s MERRA-2 reanalysis. J. Clim. 2017, 30, 2961–2988. [Google Scholar] [CrossRef] [PubMed]
- Bhartia, P.K.; McPeters, R.D.; Flynn, L.E.; Taylor, S.; Kramarova, N.A.; Frith, S.; Fisher, B.; DeLand, M. Solar Backscatter UV (SBUV) total ozone and profile algorithm. Atmos. Meas. Tech. 2013, 6, 2533–2548. [Google Scholar] [CrossRef]
- Brinkop, S.; Dameris, M.; Jöckel, P.; Garny, H.; Lossow, S.; Stiller, G. The millennium water vapour drop in chemistry-climate model simulations. Atmos. Chem. Phys. 2016, 16, 8125–8140. [Google Scholar] [CrossRef]
- Long, C.S.; Fujiwara, M.; Davis, S.; Mitchell, D.M.; Wright, C.J. Climatology and interannual variability of dynamic variables in multiple reanalyses evaluated by the SPARC Reanalysis Intercomparison Project (S-RIP). Atmos. Chem. Phys. 2017, 17, 14593–14629. [Google Scholar] [CrossRef]



| January | February | March | April | May | June | |
| Satellite | 0.1–0.5 | 0.1–0.5 | 0.1–0.5 | 0.1–0.5 | 0.1–0.5 | 0.1–0.5 |
| max | 0.7–2 / Al | 0.7–2 / Al | 2–3 / Al | 0.7–2 / An | 0.7–2 / An | 0.7–3 / An |
| UST | 3–10 | 3–10 | 5–10 | 7–20 | 7–20 | 7–20 |
| LST | >30 | >30 | >30 | >40 | >40 | >40 |
| SH max | No | No | No | No | No | No |
| July | August | September | October | November | December | |
| Satellite | 0.1–0.5 | 0.1–0.5 | 0.1–0.5 | 0.1–0.5 | 0.1–0.5 | 0.1–0.5 |
| max | 0.7–3 / An | 0.7–3 / An | 0.7–3 / An | 0.7–2 / An,Al | 0.7–2 / Al | 0.7–2 /Al |
| UST | 4–20 | 4–20 | 4–20 | 4–20 | 3–20 | 3–20 |
| LST | >40 | >40 | >40 | >40 | >40 | >40 |
| SH max | 30–250 | 30–250 | 30–250 | 30–300 | 30–300 | No |
| [hPa] | January | February | March | April | May | June | |
| 0.1 | U93 | U93 | U93 | U93 | U93 | U93 | |
| 0.3 | B93,04 | B93,04 | B93,04 | B93,04 | U93 | U93 | |
| 0.4 | B93,04 | B93,04 | B93,04 | B93,04 | B93,04 | B93,04 | |
| 0.5 | B93,04 | B93,04 | U04 | U04 | B93,04 | B93,04 | |
| 0.7 | B93,04 | U04 | U04 | U04 | U04 | U04 | |
| 1 | U04 | U04 | U04 | U04 | U04 | U04 | |
| 2 | U04 | U04 | U04 | U04 | F | F | |
| 3 | U04 | F | F | F | F | F | |
| 4 | U04 | F | F | F | F | F | |
| 5 | U04 | F | F | F | F | F | |
| 7–200 | F | F | F | F | F | F | |
| 250–500 | U93T | U93T | U93T | U93T | U93T | U93T | |
| July | August | September | October | November | December | ||
| 0.1 | U93 | U93 | U93 | U93 | U93 | U93 | |
| 0.3 | U93 | U93 | B93,04 | U93 | U93 | U93 | |
| 0.4 | B93,04 | B93,04 | B93,04 | B93,04 | B93,04 | B93,04 | |
| 0.5 | B93,04 | B93,04 | B93,04 | B93,04 | B93,04 | B93,04 | |
| 0.7 | B93,04 | B93,04 | U04 | U04 | U04 | B93,04 | |
| 1 | U04 | U04 | U04 | U04 | U04 | U04 | |
| 2 | U04 | U04 | U04 | U04 | F | F | |
| 3 | F | F | F | F | F | F | |
| 4 | F | F | F | F | F | F | |
| 5 | F | F | F | F | F | F | |
| 7–200 | F | F | F | F | F | F | |
| 250–500 | U93T | U93T | U93T | U93T | U93T | U93T | |
© 2019 by the authors. Licensee MDPI, Basel, Switzerland. This article is an open access article distributed under the terms and conditions of the Creative Commons Attribution (CC BY) license (http://creativecommons.org/licenses/by/4.0/).
Share and Cite
Krizan, P.; Kozubek, M.; Lastovicka, J. Discontinuities in the Ozone Concentration Time Series from MERRA 2 Reanalysis. Atmosphere 2019, 10, 812. https://doi.org/10.3390/atmos10120812
Krizan P, Kozubek M, Lastovicka J. Discontinuities in the Ozone Concentration Time Series from MERRA 2 Reanalysis. Atmosphere. 2019; 10(12):812. https://doi.org/10.3390/atmos10120812
Chicago/Turabian StyleKrizan, Peter, Michal Kozubek, and Jan Lastovicka. 2019. "Discontinuities in the Ozone Concentration Time Series from MERRA 2 Reanalysis" Atmosphere 10, no. 12: 812. https://doi.org/10.3390/atmos10120812
APA StyleKrizan, P., Kozubek, M., & Lastovicka, J. (2019). Discontinuities in the Ozone Concentration Time Series from MERRA 2 Reanalysis. Atmosphere, 10(12), 812. https://doi.org/10.3390/atmos10120812


