Household Dust: Loadings and PM10-Bound Plasticizers and Polycyclic Aromatic Hydrocarbons


 ,
,  ,
,  ,
,  ,
, 
Abstract
1. Introduction
2. Methodologies
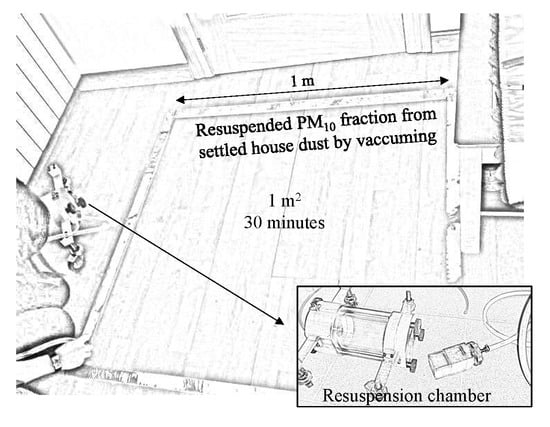
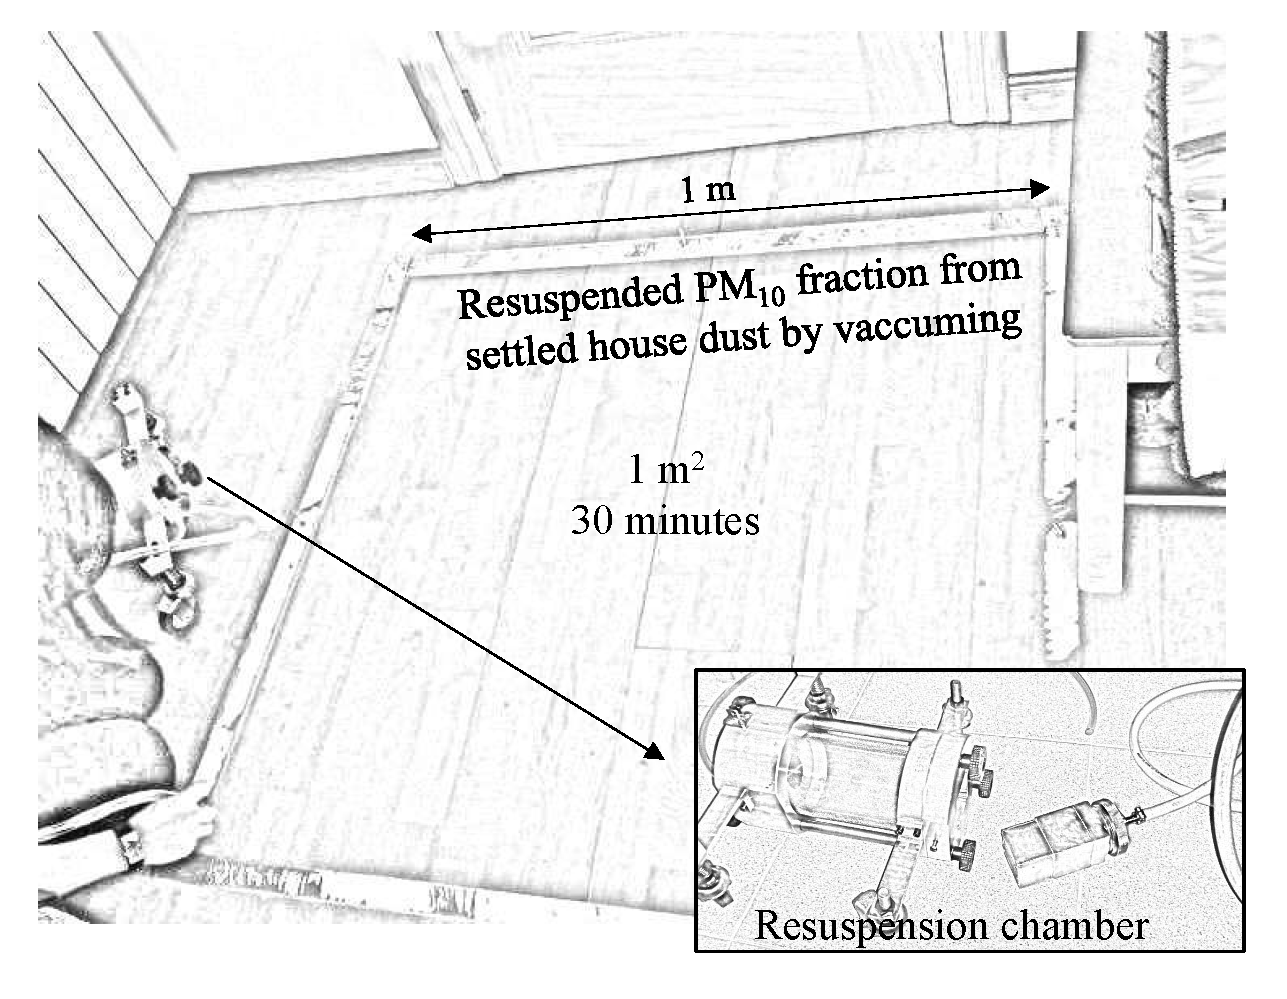
2.1. Sampling
2.2. Household Dust Characterization
2.3. Extraction Recoveries
2.4. Health Risk Evaluation
3. Results and Discussion
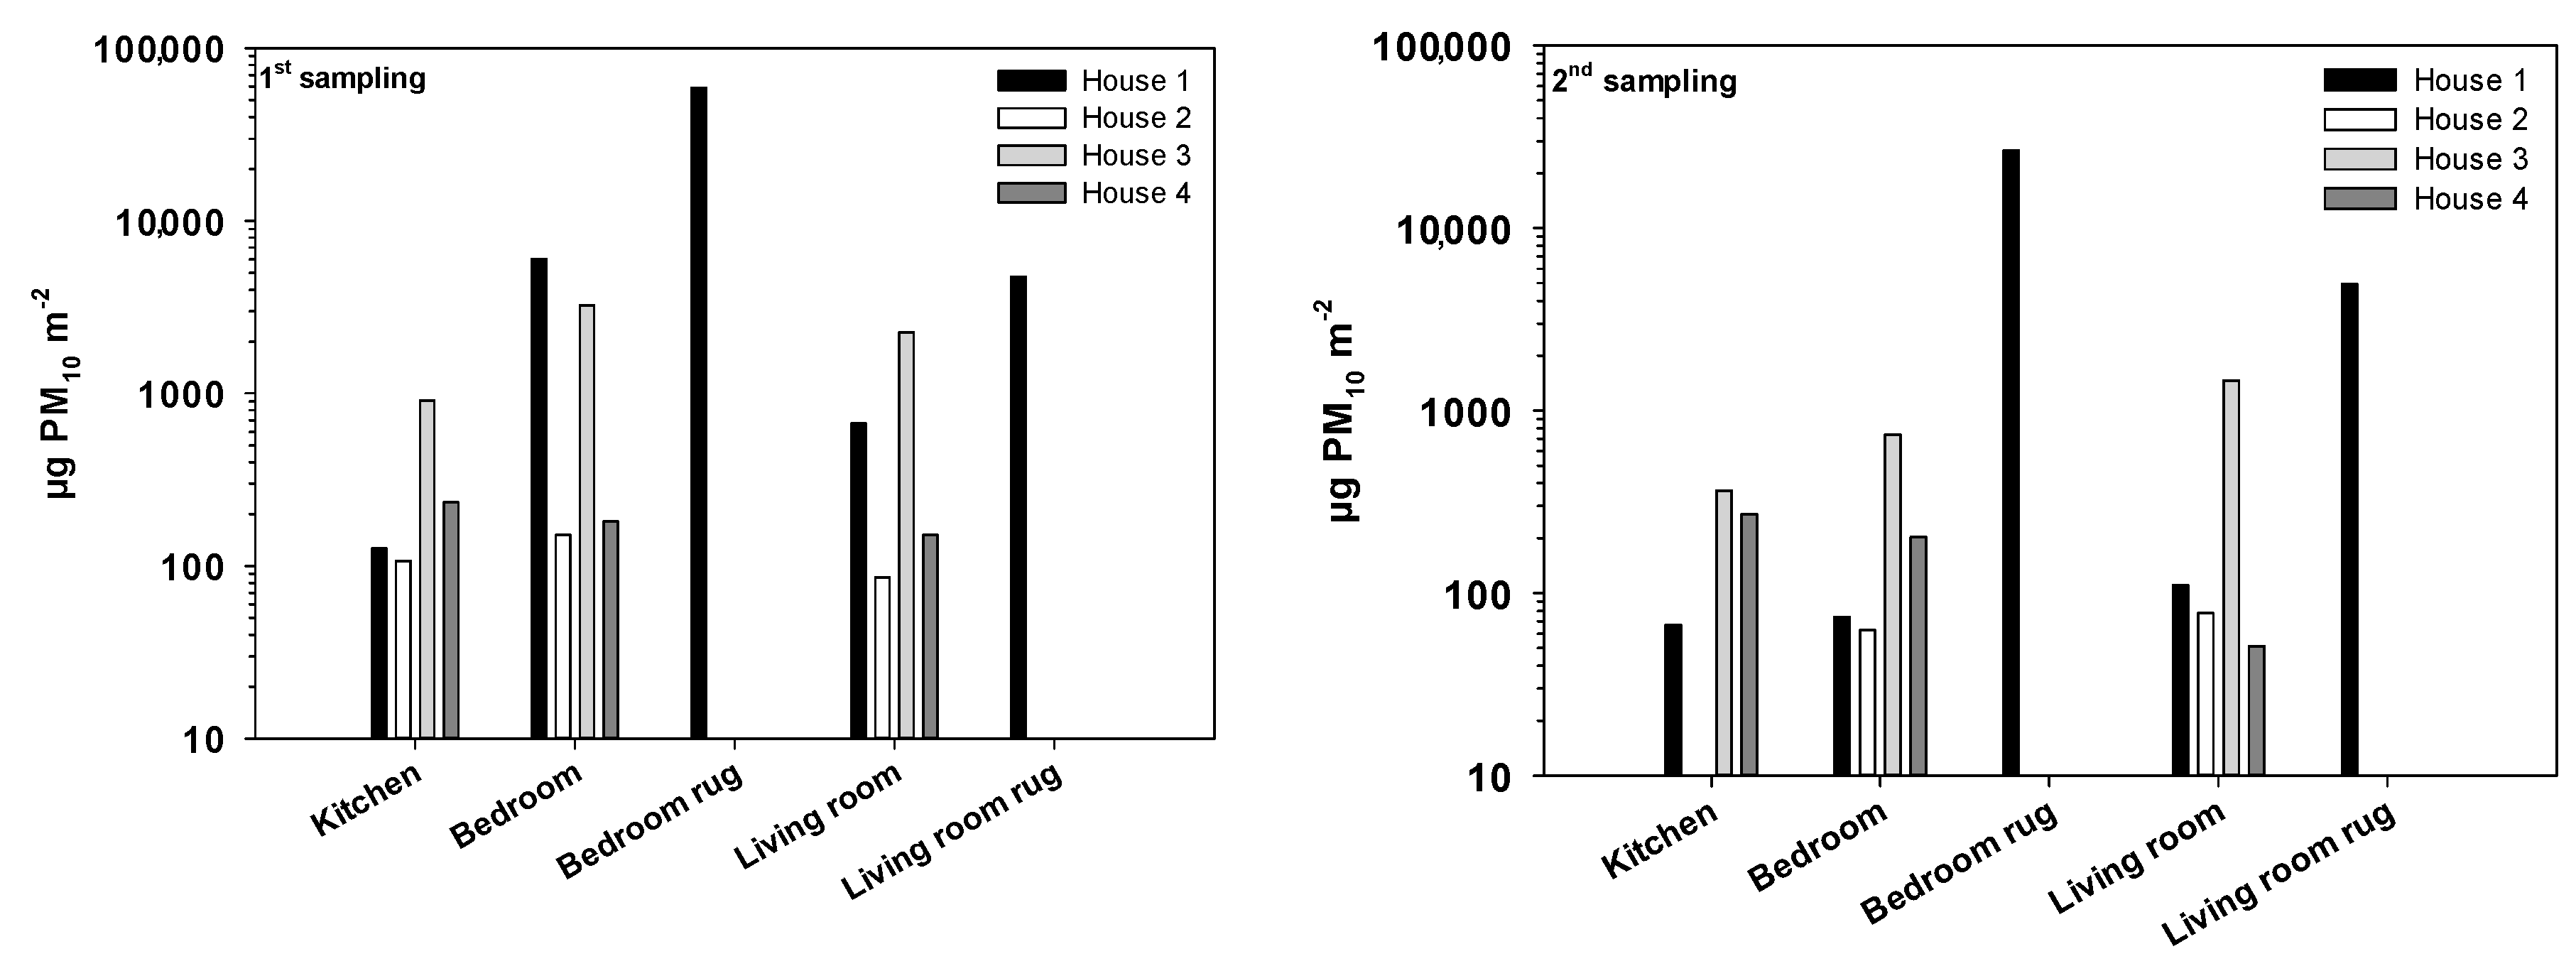
3.1. Dust Loadings
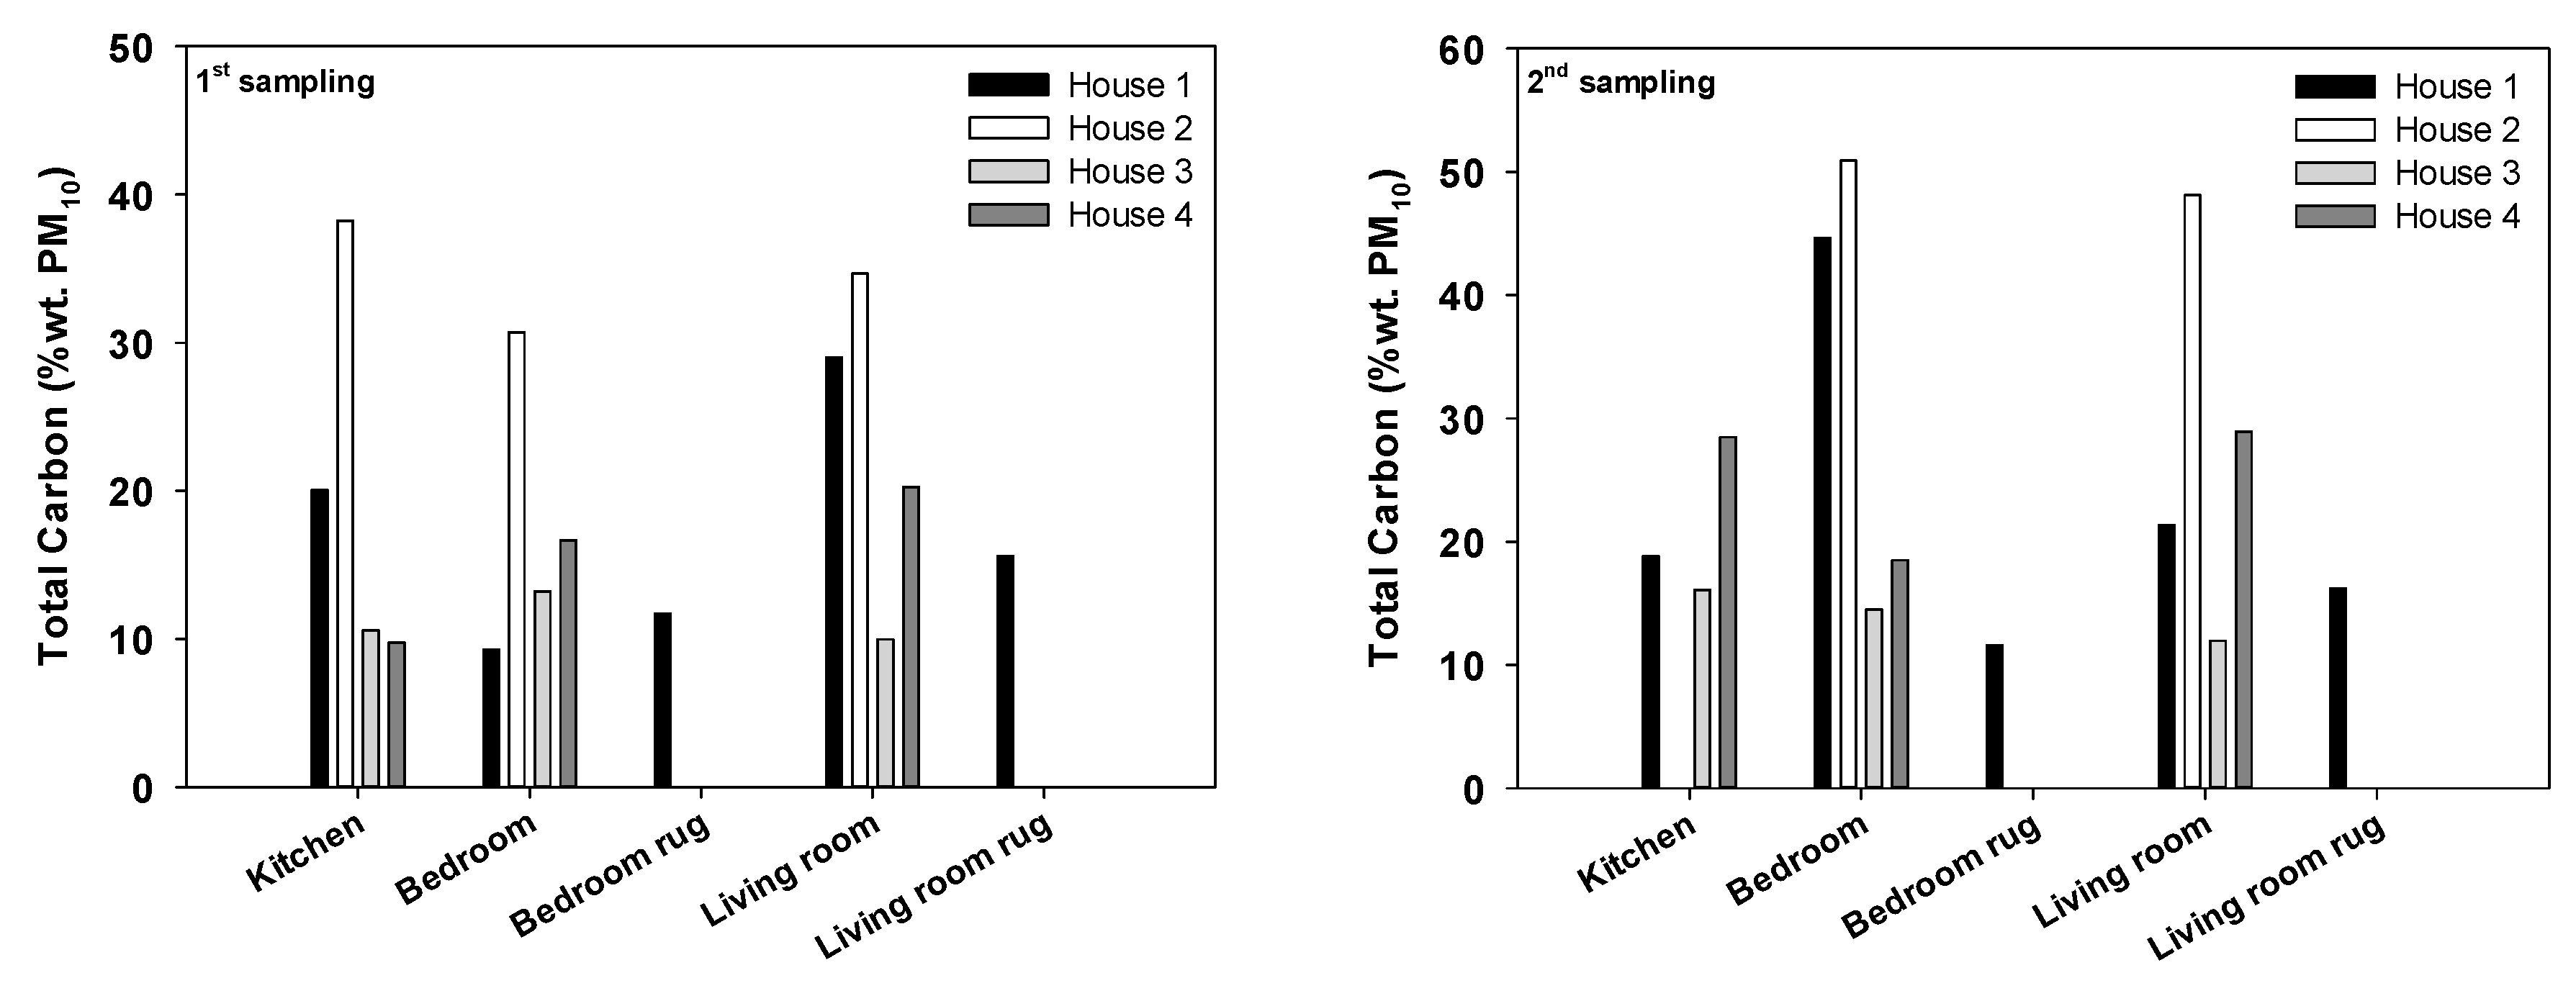
3.2. Carbonaceous, Plasticizer, and PAH Particulate Mass Fractions
3.3. Human Exposure to Plasticizers and PAHs in Resuspended Dust
4. Conclusions
Supplementary Materials
Author Contributions
Funding
Acknowledgments
Conflicts of Interest
References
- Schweizer, C.; Edwards, R.D.; Bayer-Oglesby, L.; Gauderman, W.J.; Ilacqua, V.; Juhani Jantunen, M.; Lai, H.K.; Nieuwenhuijsen, M.; Künzli, N. Indoor time–microenvironment–activity patterns in seven regions of Europe. J. Expo. Sci. Environ. Epidemiol. 2007, 17, 170–181. [Google Scholar] [CrossRef] [PubMed]
- Qian, J.; Peccia, J.; Ferro, A.R. Walking-induced particle resuspension in indoor environments. Atmos. Environ. 2014, 89, 464–481. [Google Scholar] [CrossRef]
- Tian, Y.; Sul, K.; Qian, J.; Mondal, S.; Ferro, A.R. A comparative study of walking-induced dust resuspension using a consistent test mechanism. Indoor Air 2014, 24, 592–603. [Google Scholar] [CrossRef] [PubMed]
- Bo, M.; Salizzoni, P.; Clerico, M.; Buccolieri, R. Assessment of indoor-outdoor particulate matter air pollution: A review. Atmosphere 2017, 8, 136. [Google Scholar] [CrossRef]
- Naspinski, C.; Lingenfelter, R.; He, L.Y.; Cizmas, L.; Naufal, Z.; Islamzadeh, A.; Li, Z.; Li, Z.; Donnelly, K.C.; McDonald, T. A comparison of concentrations of polycyclic aromatic compounds detected in dust samples from various regions of the world. Environ. Int. 2008, 34, 988–993. [Google Scholar] [CrossRef]
- Lioy, P.J.; Freeman, N.C.G.; Millette, J.R. Review Dust: A Metric for Use in Residential and Building Exposure Assessment and. Environ. Health Perspect. 2002, 110, 969–983. [Google Scholar] [CrossRef]
- Maertens, R.M.; Bailey, J.; White, P.A. The mutagenic hazards of settled house dust: A review. Mutat. Res. 2004, 567, 401–425. [Google Scholar] [CrossRef]
- Liu, H.Y.; Dunea, D.; Iordache, S.; Pohoata, A. A review of airborne particulate matter effects on young children’s respiratory symptoms and diseases. Atmosphere 2018, 9, 150. [Google Scholar] [CrossRef]
- Cipriani, F.; Calamelli, E.; Ricci, G. Allergen avoidance in allergic asthma. Front. Pediatr. 2017, 5, 103. [Google Scholar] [CrossRef]
- Ahluwalia, S.K.; Matsui, E.C. The indoor environment and its effects on childhood asthma. Curr. Opin. Allergy Clin. Immunol. 2011, 11, 137–143. [Google Scholar] [CrossRef]
- McCormack, M.C.; Breysse, P.N.; Matsui, E.C.; Hansel, N.N.; Peng, R.D.; Curtin-Brosnan, J.; Williams, D.L.; Wills-Karp, M.; Diette, G.B.; Center for Childhood Asthma in the Urban Environment. Indoor particulate matter increases asthma morbidity in children with non-atopic and atopic asthma. Ann. Allergy. Asthma Immunol. 2011, 106, 308–315. [Google Scholar] [CrossRef] [PubMed]
- Mitro, S.D.; Dodson, R.E.; Singla, V.; Adamkiewicz, G.; Elmi, A.F.; Tilly, M.K.; Zota, A.R. Consumer Product Chemicals in Indoor Dust: A Quantitative Meta-analysis of U.S. Studies. Environ. Sci. Technol. 2016, 50, 10661–10672. [Google Scholar] [CrossRef] [PubMed]
- Roberts, J.W.; Wallace, L.A.; Camann, D.E.; Dickey, P.; Gilbert, S.G.; Lewis, R.G.; Takaro, T.K. Monitoring and Reducing Exposure of Infants to Pollutants in House Dust. In Reviews of Environmental Contamination and Toxicology; Springer: Berlin, Germany, 2009; Volume 201, pp. 1–39. [Google Scholar]
- Langer, S.; Weschler, C.J.; Fischer, A.; Bekö, G.; Toftum, J.; Clausen, G. Phthalate and PAH concentrations in dust collected from Danish homes and daycare centers. Atmos. Environ. 2010, 44, 2294–2301. [Google Scholar] [CrossRef]
- Dodson, R.E.; Camann, D.E.; Morello-Frosch, R.; Brody, J.G.; Rudel, R.A. Semivolatile organic compounds in homes: strategies for efficient and systematic exposure measurement based on empirical and theoretical factors. Environ. Sci. Technol. 2015, 49, 113–122. [Google Scholar] [CrossRef] [PubMed]
- Yang, Q.; Chen, H.; Li, B. Polycyclic aromatic hydrocarbons (PAHs) in indoor dusts of Guizhou, southwest of China: Status, sources and potential human health risk. PLoS ONE 2015, 10, e0118141. [Google Scholar] [CrossRef]
- Mercier, F.; Glorennec, P.; Thomas, O.; Bot, B. Le Organic contamination of settled house dust, a review for exposure assessment purposes. Environ. Sci. Technol. 2011, 45, 6716–6727. [Google Scholar] [CrossRef]
- DellaValle, C.T.; Deziel, N.C.; Jones, R.R.; Colt, J.S.; De Roos, A.J.; Cerhan, J.R.; Cozen, W.; Severson, R.K.; Flory, A.R.; Morton, L.M.; et al. Polycyclic aromatic hydrocarbons: Determinants of residential carpet dust levels and risk of non-Hodgkin lymphoma. Cancer Causes Control 2016, 27, 1–13. [Google Scholar] [CrossRef]
- Boström, C.E.; Gerde, P.; Hanberg, A.; Jernström, B.; Johansson, C.; Kyrklund, T.; Rannug, A.; Törnqvist, M.; Victorin, K.; Westerholm, R. Cancer risk assessment, indicators, and guidelines for polycyclic aromatic hydrocarbons in the ambient air. Environ. Health Perspect. 2002, 110, 451–488. [Google Scholar]
- Kim, K.H.; Jahan, S.A.; Kabir, E.; Brown, R.J.C. A review of airborne polycyclic aromatic hydrocarbons (PAHs) and their human health effects. Environ. Int. 2013, 60, 71–80. [Google Scholar] [CrossRef]
- Deziel, N.C.; Rull, R.P.; Colt, J.S.; Reynolds, P.; Whitehead, T.P.; Gunier, R.B.; Month, S.R.; Taggart, D.R.; Buffler, P.; Ward, M.H.; et al. Polycyclic aromatic hydrocarbons in residential dust and risk of childhood acute lymphoblastic leukemia. Environ. Res. 2014, 133, 388–395. [Google Scholar] [CrossRef]
- Wang, B.L.; Pang, S.T.; Zhang, X.L.; Li, X.L.; Sun, Y.G.; Lu, X.M.; Zhang, Q.; Zhang, Z.D. Levels and neurodevelopmental effects of polycyclic aromatic hydrocarbons in settled house dust of urban dwellings on preschool-aged children in Nanjing, China. Atmos. Pollut. Res. 2014, 5, 292–302. [Google Scholar] [CrossRef]
- Kang, Y.; Cheung, K.C.; Wong, M.H. Polycyclic aromatic hydrocarbons (PAHs) in different indoor dusts and their potential cytotoxicity based on two human cell lines. Environ. Int. 2010, 36, 542–547. [Google Scholar] [CrossRef] [PubMed]
- Liu, R.; He, R.; Cui, X.; Ma, L.Q. Impact of particle size on distribution, bioaccessibility, and cytotoxicity of polycyclic aromatic hydrocarbons in indoor dust. J. Hazard. Mater. 2018, 357, 341–347. [Google Scholar] [CrossRef] [PubMed]
- World Health Organization International Agency for Research on Cancer. IARC Monographs on the Evaluation of Carcinogenic Risks to Humans. Some Non-Heterocyclic Polycyclic Aromatic Hydrocarbons and Some Related Exposures; WHO: Lyon, France, 2010. [Google Scholar]
- ATSDR. Priority List of Hazardous Substances. Available online: http://www.atsdr.cdc.gov/SPL/resources/ (accessed on 5 December 2019).
- Ma, W.-L.; Subedi, B.; Kannan, K. The Occurrence of Bisphenol A, Phthalates, Parabens and Other Environmental Phenolic Compounds in House Dust: A Review. Curr. Org. Chem. 2014, 18, 2182–2199. [Google Scholar] [CrossRef]
- Larsson, K.; Lindh, C.H.; Jönsson, B.A.; Giovanoulis, G.; Bibi, M.; Bottai, M.; Bergström, A.; Berglund, M. Phthalates, non-phthalate plasticizers and bisphenols in Swedish preschool dust in relation to children’s exposure. Environ. Int. 2017, 102, 114–124. [Google Scholar] [CrossRef]
- Subedi, B.; Sullivan, K.D.; Dhungana, B. Phthalate and non-phthalate plasticizers in indoor dust from childcare facilities, salons, and homes across the USA. Environ. Pollut. 2017, 230, 701–708. [Google Scholar] [CrossRef]
- Kang, Y.; Man, Y.B.; Cheung, K.C.; Wong, M.H. Risk assessment of human exposure to bioaccessible phthalate esters via indoor dust around the Pearl River Delta. Environ. Sci. Technol. 2012, 46, 8422–8430. [Google Scholar] [CrossRef]
- Kweon, D.J.; Kim, M.K.; Zoh, K.D. Distribution of brominated flame retardants and phthalate esters in house dust in Korea. Environ. Eng. Res. 2018, 23, 354–363. [Google Scholar] [CrossRef]
- Abb, M.; Heinrich, T.; Sorkau, E.; Lorenz, W. Phthalates in house dust. Environ. Int. 2009, 35, 965–970. [Google Scholar] [CrossRef]
- Kubwabo, C.; Rasmussen, P.E.; Fan, X.; Kosarac, I.; Wu, F.; Zidek, A.; Kuchta, S.L. Analysis of selected phthalates in Canadian indoor dust collected using household vacuum and standardized sampling techniques. Indoor Air 2013, 23, 506–514. [Google Scholar] [CrossRef]
- Bornehag, C.G.; Lundgren, B.; Weschler, C.J.; Sigsgaard, T.; Hagerhed-Engman, L.; Sundell, J. Phthalates in indoor dust and their association with building characteristics. Environ. Health Perspect. 2005, 113, 1399–1404. [Google Scholar] [CrossRef] [PubMed]
- Al Qasmi, N.N.; Al-Thaiban, H.; Helaleh, M.I.H. Indoor phthalates from household dust in Qatar: Implications for non-dietary human exposure. Environ. Sci. Pollut. Res. Int. 2019, 26, 421–430. [Google Scholar] [CrossRef] [PubMed]
- Zhang, Q.; Lu, X.M.; Zhang, X.L.; Sun, Y.G.; Zhu, D.M.; Wang, B.L.; Zhao, R.Z.; Zhang, Z.D. Levels of phthalate esters in settled house dust from urban dwellings with young children in Nanjing, China. Atmos. Environ. 2013, 69, 258–264. [Google Scholar] [CrossRef]
- Albar, H.M.S.A.; Ali, N.; Shahzad, K.; Ismail, I.M.I.; Rashid, M.I.; Wang, W.; Ali, L.N.; Eqani, S.A.M.A.S. Phthalate esters in settled dust of different indoor microenvironments; source of non-dietary human exposure. Microchem. J. 2017, 132, 227–232. [Google Scholar]
- Kashyap, D.; Agarwal, T. Concentration and factors affecting the distribution of phthalates in the air and dust: A global scenario. Sci. Total Environ. 2018, 635, 817–827. [Google Scholar] [CrossRef]
- Zhu, Q.; Jia, J.; Zhang, K.; Zhang, H.; Liao, C.; Jiang, G. Phthalate esters in indoor dust from several regions, China and their implications for human exposure. Sci. Total Environ. 2019, 652, 1187–1194. [Google Scholar] [CrossRef]
- Guo, Y.; Kannan, K. Comparative assessment of human exposure to phthalate esters from house dust in China and the United States. Environ. Sci. Technol. 2011, 45, 3788–3794. [Google Scholar] [CrossRef]
- Orecchio, S.; Indelicato, R.; Barreca, S. The distribution of phthalate esters in indoor dust of Palermo (Italy). Environ. Geochem. Health 2013, 35, 613–624. [Google Scholar] [CrossRef]
- Kay, V.R.; Bloom, M.S.; Foster, W.G. Reproductive and developmental effects of phthalate diesters in males. Crit. Rev. Toxicol. 2014, 44, 467–498. [Google Scholar] [CrossRef]
- Kay, V.R.; Chambers, C.; Foster, W.G. Reproductive and developmental effects of phthalate diesters in females. Crit. Rev. Toxicol. 2013, 43, 200–219. [Google Scholar] [CrossRef]
- Wormuth, M.; Scheringer, M.; Vollenweider, M.; Hungerbühler, K. What are the sources of exposure to eight frequently used phthalic acid esters in Europeans? Risk Anal. 2006, 26, 803–824. [Google Scholar] [CrossRef] [PubMed]
- Directive 2005/84/EC of the European Parliament and of the Council of 14 December 2005 amending for the 22nd time Council Directive 76/769/EEC on the approximation of the laws, regulations and administrative provisions of the Member States relating to restrictions on the marketing and use of certain dangerous substances and preparations (phthalates in toys and childcare articles). Available online: https://eur-lex.europa.eu/LexUriServ/LexUriServ.do?uri=OJ:L:2005:344:0040:0043:EN:PDF (accessed on 5 December 2019).
- Manigrasso, M.; Guerriero, E.; Avino, P. Ultrafine particles in residential indoors and doses deposited in the human respiratory system. Atmosphere 2015, 6, 1444–1461. [Google Scholar] [CrossRef]
- Morawska, L.; Salthammer, T. (Eds.) Indoor Environment, Airborne Particles and Settled Dust; Wiley-VCH GmbH & Co. KGaA: Weinheim, Germany, 2003; ISBN 978-352-7305254. [Google Scholar]
- Ma, Y.; Harrad, S. Spatiotemporal analysis and human exposure assessment on polycyclic aromatic hydrocarbons in indoor air, settled house dust, and diet: A review. Environ. Int. 2015, 84, 7–16. [Google Scholar] [CrossRef] [PubMed]
- Driver, J.H.; Konz, J.J.; Whitmyre, G.K. Soil adherence to human skin. Bull. Environ. Contam. Toxicol. 1989, 43, 814–820. [Google Scholar] [CrossRef] [PubMed]
- Amato, F.; Pandolfi, M.; Moreno, T.; Furger, M.; Pey, J.; Alastuey, A.; Bukowiecki, N.; Prevot, A.S.H.; Baltensperger, U.; Querol, X. Sources and variability of inhalable road dust particles in three European cities. Atmos. Environ. 2011, 45, 6777–6787. [Google Scholar] [CrossRef]
- Amato, F.; Pandolfi, M.; Viana, M.; Querol, X.; Alastuey, A.; Moreno, T. Spatial and chemical patterns of PM10 in road dust deposited in urban environment. Atmos. Environ. 2009, 43, 1650–1659. [Google Scholar] [CrossRef]
- Alves, C.A.; Evtyugina, M.; Vicente, A.M.P.; Vicente, E.D.; Nunes, T.V.; Silva, P.M.A.; Duarte, M.A.C.; Pio, C.A.; Amato, F.; Querol, X. Chemical profiling of PM10 from urban road dust. Sci. Total Environ. 2018, 634, 41–51. [Google Scholar] [CrossRef]
- Anderson, J.O.; Thundiyil, J.G.; Stolbach, A. Clearing the Air: A Review of the Effects of Particulate Matter Air Pollution on Human Health. J. Med. Toxicol. 2012, 8, 166–175. [Google Scholar] [CrossRef]
- Alves, C.A.; Vicente, A.; Monteiro, C.; Gonçalves, C.; Evtyugina, M.; Pio, C. Emission of trace gases and organic components in smoke particles from a wildfire in a mixed-evergreen forest in Portugal. Sci. Total Environ. 2011, 409, 1466–1475. [Google Scholar] [CrossRef]
- Fortune, A.; Gendron, L.; Tuday, M. Comparison of naphthalene ambient air sampling & analysis methods at former manufactured gas plant (MGP) remediation sites. Int. J. Soil Sediment Water 2010, 3, 1–15. [Google Scholar]
- Zha, Y.; Zhang, Y.L.; Tang, J.; Sun, K. Status, sources, and human health risk assessment of PAHs via foliar dust from different functional areas in Nanjing, China. J. Environ. Sci. Health Part A 2018, 53, 571–582. [Google Scholar] [CrossRef] [PubMed]
- Iwegbue, C.M.A.; Obi, G.; Uzoekwe, S.A.; Egobueze, F.E.; Odali, E.W.; Tesi, G.O.; Nwajei, G.E.; Martincigh, B.S. Distribution, sources and risk of exposure to polycyclic aromatic hydrocarbons in indoor dusts from electronic repair workshops in southern Nigeria. Emerg. Contam. 2019, 5, 23–30. [Google Scholar] [CrossRef]
- Abdullahi, K.L.; Delgado-Saborit, J.M.; Harrison, R.M. Emissions and indoor concentrations of particulate matter and its specific chemical components from cooking: A review. Atmos. Environ. 2013, 71, 260–294. [Google Scholar] [CrossRef]
- Licina, D.; Tian, Y.; Nazaroff, W.W. Emission rates and the personal cloud effect associated with particle release from the perihuman environment. Indoor Air 2017, 27, 791–802. [Google Scholar] [CrossRef] [PubMed]
- Lewis, R.D.; Ong, K.H.; Emo, B.; Kennedy, J.; Kesavan, J.; Elliot, M. Resuspension of house dust and allergens during walking and vacuum cleaning. J. Occup. Environ. Hyg. 2018, 15, 235–245. [Google Scholar] [CrossRef]
- Becher, R.; Øvrevik, J.; Schwarze, P.E.; Nilsen, S.; Hongslo, J.K.; Bakke, J.V. Do carpets impair indoor air quality and cause adverse health outcomes: A review. Int. J. Environ. Res. Public Health 2018, 15, 184. [Google Scholar] [CrossRef]
- Foarde, K.; Berry, M. Comparison of biocontaminant levels associated with hard vs. carpet floors in nonproblem schools: Results of a year long study. J. Expo. Anal. Environ. Epidemiol. 2004, 14, S41–S48. [Google Scholar] [CrossRef]
- Tranter, D.C. Indoor allergens in settled school dust: A review of findings and significant factors. Clin. Exp. Allergy 2005, 35, 126–136. [Google Scholar] [CrossRef]
- Causer, S.; Shorter, C.; Sercombe, J. Effect of floorcovering construction on content and vertical distribution of house dust mite allergen, Der p I. J. Occup. Environ. Hyg. 2006, 3, 161–168. [Google Scholar] [CrossRef]
- Roberts, J.W.; Clifford, W.S.; Glass, G.; Hummer, P.G. Reducing dust, lead, dust mites, bacteria, and fungi in carpets by vacuuming. Arch. Environ. Contam. Toxicol. 1999, 36, 477–484. [Google Scholar]
- Adgate, J.L.; Weisel, C.; Wang, Y.; Rhoads, G.G.; Lioy, P.J. Lead in house dust: Relationships between exposure metrics. Environ. Res. 1995, 70, 134–147. [Google Scholar] [CrossRef] [PubMed]
- Lioy, P.J.; Freeman, N.C.; Wainman, T.; Stern, A.H.; Boesch, R.; Howell, T.; Shupack, S.I. Microenvironmental analysis of residential exposure to chromium-laden wastes in and around New Jersey homes. Risk Anal. 1992, 12, 287–299. [Google Scholar] [CrossRef] [PubMed]
- Bai, Z.; Yiin, L.M.; Rich, D.Q.; Adgate, J.L.; Ashley, P.J.; Lioy, P.J.; Rhoads, G.G.; Zhang, J. Field evaluation and comparison of five methods of sampling lead dust on carpets. Am. Ind. Hyg. Assoc. J. 2003, 64, 528–532. [Google Scholar] [CrossRef]
- Polidori, A.; Turpin, B.; Meng, Q.Y.; Lee, J.H.; Weisel, C.; Morandi, M.; Colome, S.; Stock, T.; Winer, A.; Zhang, J.; et al. Fine organic particulate matter dominates indoor-generated PM2.5 in RIOPA homes. J. Expo. Sci. Environ. Epidemiol. 2006, 16, 321–331. [Google Scholar] [CrossRef] [PubMed]
- Bamai, Y.A.; Araki, A.; Kawai, T.; Tsuboi, T.; Saito, I.; Yoshioka, E.; Kanazawa, A.; Tajima, S.; Shi, C.; Tamakoshi, A.; et al. Associations of phthalate concentrations in floor dust and multi-surface dust with the interior materials in Japanese dwellings. Sci. Total Environ. 2014, 468, 147–157. [Google Scholar] [CrossRef]
- Afshari, A.; Gunnarsen, L.; Clausen, P.A.; Hansen, V. Emission of phthalates from PVC and other materials. Indoor Air 2004, 14, 120–128. [Google Scholar] [CrossRef]
- Koniecki, D.; Wang, R.; Moody, R.P.; Zhu, J. Phthalates in cosmetic and personal care products: Concentrations and possible dermal exposure. Environ. Res. 2011, 111, 329–336. [Google Scholar] [CrossRef]
- U.S. National Library of Medicine. National Center for Biotechnology Information. PubChem, 2019. Available online: https://pubchem.ncbi.nlm.nih.gov/ (accessed on 5 December 2019).
- Luongo, G.; Östman, C. Organophosphate and phthalate esters in settled dust from apartment buildings in Stockholm. Indoor Air 2016, 26, 414–425. [Google Scholar] [CrossRef]
- Brouwere, K.; Standaert, A.; Torfs, R. Integrated Exposure for Risk Assessment in Indoor Environment (INTERA); Final Report; INTERA: Boeretang, Belgium, 2012. [Google Scholar]
- Kolarik, B.; Bornehag, C.G.; Naydenov, K.; Sundell, J.; Stavova, P.; Nielsen, O.F. The concentrations of phthalates in settled dust in Bulgarian homes in relation to building characteristic and cleaning habits in the family. Atmos. Environ. 2008, 42, 8553–8559. [Google Scholar] [CrossRef]
- Xu, Y.; Cohen Hubal, E.A.; Little, J.C. Predicting residential exposure to phthalate plasticizer emitted from vinyl flooring: Sensitivity, uncertainty, and implications for biomonitoring. Environ. Health Perspect. 2010, 118, 253–258. [Google Scholar] [CrossRef]
- Weschler, C.J. Indoor/outdoor connections exemplified by processes that depend on an organic compound’s saturation vapor pressure. In Proceedings of the Atmospheric Environment; Elsevier: Amsterdam, The Netherlands, 2003; Volume 37, pp. 5455–5465. [Google Scholar]
- Institute for Health and Consumer Protection, Toxicology and Chemical Substances. Benzyl Butyl Phthalate. In Summary Risk Assessment Report; EUR 22773 EN/2; Institute for Health and Consumer Protection, Toxicology and Chemical Substances, European Chemicals Bureau: Ispra, Italy, 2008. [Google Scholar]
- Santillo, D.; Labunska, I.; Davidson, H.; Johnston, P.; Strutt, M.; Knowles, O. Consuming Chemicals–Hazardous Chemicals in House Dust as an Indicator of Chemical Exposure in the Home; Greenpeace Research Laboratories: Exeter, UK, 2003. [Google Scholar]
- European Chemicals Agency. Evaluation of New Scientific Evidence Concerning DINP and DIDP in Relation to Entry 52 of Annex XVII to Reach Regulation (EC) No 1907/2006; ECHA: Helsinki, Finland, 2013. [Google Scholar]
- Fromme, H.; Lahrz, T.; Piloty, M.; Gebhart, H.; Oddoy, A.; Rüden, H. Occurrence of phthalates and musk fragrances in indoor air and dust from apartments and kindergartens in Berlin (Germany). Indoor Air 2004, 14, 188–195. [Google Scholar] [CrossRef] [PubMed]
- Gevao, B.; Al-Ghadban, A.N.; Bahloul, M.; Uddin, S.; Zafar, J. Phthalates in indoor dust in Kuwait: Implications for non-dietary human exposure. Indoor Air 2013, 23, 126–133. [Google Scholar] [CrossRef] [PubMed]
- Kanazawa, A.; Saito, I.; Araki, A.; Takeda, M.; Ma, M.; Saijo, Y.; Kishi, R. Association between indoor exposure to semi-volatile organic compounds and building-related symptoms among the occupants of residential dwellings. Indoor Air 2010, 20, 72–84. [Google Scholar] [CrossRef] [PubMed]
- Yadav, I.C.; Devi, N.L.; Li, J.; Zhang, G. Polycyclic aromatic hydrocarbons in house dust and surface soil in major urban regions of Nepal: Implication on source apportionment and toxicological effect. Sci. Total Environ. 2018, 616, 223–235. [Google Scholar] [CrossRef]
- Mannino, M.R.; Orecchio, S. Polycyclic aromatic hydrocarbons (PAHs) in indoor dust matter of Palermo (Italy) area: Extraction, GC-MS analysis, distribution and sources. Atmos. Environ. 2008, 42, 1801–1817. [Google Scholar] [CrossRef]
- Maertens, R.M.; Yang, X.; Zhu, J.; Gagne, R.W.; Douglas, G.R.; White, P.A. Mutagenic and carcinogenic hazards of settled house dust I: Polycyclic aromatic hydrocarbon content and excess lifetime cancer risk from preschool exposure. Environ. Sci. Technol. 2008, 42, 1747–1753. [Google Scholar] [CrossRef]
- Qi, H.; Li, W.L.; Zhu, N.Z.; Ma, W.L.; Liu, L.Y.; Zhang, F.; Li, Y.F. Concentrations and sources of polycyclic aromatic hydrocarbons in indoor dust in China. Sci. Total Environ. 2014, 491, 100–107. [Google Scholar] [CrossRef]
- Vicente, E.D.; Alves, C.A. An overview of particulate emissions from residential biomass combustion. Atmos. Res. 2018, 199, 159–185. [Google Scholar] [CrossRef]
- Cheruyiot, N.K.; Lee, W.J.; Mwangi, J.K.; Wang, L.C.; Lin, N.H.; Lin, Y.C.; Cao, J.; Zhang, R.; Chang-Chien, G.P. An overview: Polycyclic aromatic hydrocarbon emissions from the stationary and mobile sources and in the ambient air. Aerosol Air Qual. Res. 2015, 15, 2730–2762. [Google Scholar] [CrossRef]
- Ong, S.; Ayoko, G.; Kokot, S.; Morawska, L. Polycyclic aromatic hydrocarbons in house dust samples: Source identification and apportionment. In Proceedings of the 14th International IUAPPA World Congress, Brisbane, QLD, Australia, 9–13 September 2007. [Google Scholar]
- Ali, N.; Ismail, I.M.I.; Khoder, M.; Shamy, M.; Alghamdi, M.; Costa, M.; Ali, L.N.; Wang, W.; Eqani, S.A.M.A.S. Polycyclic aromatic hydrocarbons (PAHs) in indoor dust samples from Cities of Jeddah and Kuwait: Levels, sources and non-dietary human exposure. Sci. Total Environ. 2016, 573, 1607–1614. [Google Scholar] [CrossRef]
- Qu, C.; Qi, S.; Yang, D.; Huang, H.; Zhang, J.; Chena, W.; Yohannes, H.K.; Sandy, E.H.; Yang, J.; Xing, X. Risk assessment and influence factors of organochlorine pesticides (OCPs) in agricultural soils of the hill region: A case study from Ningde, southeast China. J. Geochem. Explor. 2015, 149, 43–51. [Google Scholar] [CrossRef]
- Roy, D.; Seo, Y.C.; Sinha, S.; Bhattacharya, A.; Singh, G.; Biswas, P.K. Human health risk exposure with respect to particulate-bound polycyclic aromatic hydrocarbons at mine fire-affected coal mining complex. Environ. Sci. Pollut. Res. 2019, 26, 19119–19135. [Google Scholar] [CrossRef] [PubMed]


| House | Characteristics | Room | Flooring |
|---|---|---|---|
| 1 | Suburban two-story house with well-ventilated kitchen, two occupants | Kitchen Bedroom Living room Living room rug Bedroom rug | Tile Parquet Parquet Cut pile carpet/rug Long threads shag rug |
| 2 | Single story apartment located in the city center, two occupants | Kitchen Bedroom Living room | Tile Parquet Parquet |
| 3 | Rural two-story house with open fireplace in the living room, two occupants | Kitchen Bedroom Living room | Tile Parquet Tile |
| 4 | Single story apartment with small kitchen open to the living room, one occupant | Kitchen Bedroom Living room | Tile Tile Tile |
| Sampling Information | Statistics | DMP | DMPP | DEP | DIBP | DBP | DNHP | BBP | DEHA | DCHP | DEHP | DNOP | DINP | DIDP | Ref. |
|---|---|---|---|---|---|---|---|---|---|---|---|---|---|---|---|
| Kitchens | Mean min-max | 0.27 <0.1–1.89 | 142 <0.1–567 | 562 <0.1–3301 | 6.3 <0.1–12 | 17 <0.1–97 | 271 <0.1–795 | 927 <0.1–3270 | 10 <0.1–25 | 6.6 <0.1–46 | This study | ||||
| Median | <0.1 | <0.1 | <0.1 | 6.4 | <0.1 | <0.1 | 407 | 9.0 | <0.1 | ||||||
| Bedrooms | Mean min-max | 0.33 <0.1–1.57 | 45 <0.1–354 | 2353 <0.1–9397 | 10.4 4.25–26 | 36 <0.1–191 | 897 <0.1–2864 | 969 <0.1–2594 | 20 4.15–78 | 35 <0.1–215 | This study | ||||
| Median | 0.19 | <0.1 | 964 | 7.0 | 7.4 | 442 | 316 | 7.3 | 3.9 | ||||||
| Living rooms | Mean min-max | 0.93 <0.1–4.5 | 139 <0.1–924 | 1181 <0.1–6044 | 11 5.1–21 | 19 <0.1–109 | 1352 <0.1–8374 | 751 <0.1–2468 | 28 <0.1–145 | 66 <0.1–300 | This study | ||||
| Median | <0.1 | 16 | <0.1 | 9.3 | <0.1 | 218 | 473 | 8.2 | 16.6 | ||||||
| Living room rug * | Mean | 0.60 | 21 | 893 | 8.54 | 23.4 | 1997 | 807 | 9.8 | 23.8 | This study | ||||
| Bedroom rug * | Mean | 1.31 | 5.8 | 139 | 3.44 | 3.7 | 92 | 119 | 5.3 | 9.1 | This study | ||||
| Dust samples (<180 µm) from houses of China collected with brushes | Mean | 0.693 | 0.187 | 17.1 | 26.4 | 0.003 | 0.040 | 0.015 | 105 | 0.342 | [39] | ||||
| Median | 0.181 | 0.116 | 9.33 | 12.9 | 0.001 | 0.014 | 0.007 | 25.6 | 0.130 | ||||||
| 30 household dust samples (<63 µm) from vacuum cleaner | Median | 87.4 | 15.2 | 604 | 129 | 33.6 | [32] | ||||||||
| Dust from 30 apartments in bags of vacuum cleaner | Mean | 10.8 | 54.6 | 44.6 | 55.6 | 86.1 | 776 | [82] | |||||||
| Median | 1.5 | 37.5 | 6.1 | 47.0 | 29.7 | 703 | |||||||||
| Dust (<250 µm) from 11 houses, 3 labs and 1 hospital in vacuum cleaner bags, Qatar | Mean | 0.89 | 7.9 | 12.5 | 1.6 | 2.6 | 10.7 | 288 | 5.8 | 106 | 11.4 | [35] | |||
| Median | 0.98 | 7.0 | 17.0 | 0.12 | 1.95 | 9.6 | 395 | 3.0 | 101 | 11.0 | |||||
| Dust samples (<250 µm) from homes in Kuwait from vacuum cleaner bags | Mean | 0.01 | 1.5 | 51 | 0.2 | 6.4 | 0.3 | 1700 | 14 | [83] | |||||
| Median | 0.03 | 1.8 | 45 | 0.39 | 8.6 | 2.9 | 2256 | 14 | |||||||
| House dust from China collected by sweeping the floor and wiping the top of furniture (<2 mm) | Median | 0.2 | 0.4 | 17.2 | 20.1 | nd | 0.2 | nd | 228 | 0.2 | [40] | ||||
| Dust from Albany, USA, from vacuum cleaner bags of several homes (<2 mm) | Median | 0.08 | 2.0 | 3.8 | 13.1 | 0.6 | 21.1 | nd | 304 | 0.4 | [40] | ||||
| Saudi floor dust from vacuum cleaner bags (<250 µm) | Mean | 1.4 | 4.2 | 33.6 | 80.2 | 1.5 | 1140 | 102.4 | [37] | ||||||
| Median | 0.6 | 1.4 | 22.1 | 33.3 | 0.8 | 1020 | 26.8 | ||||||||
| Kuwaiti floor dust from vacuum cleaner bags (<250 µm) | Mean | 0.2 | 5.1 | 20.0 | 4.0 | 1.3 | 220 | 2.4 | [37] | ||||||
| Median | 0.1 | 2.7 | 17.2 | 1.6 | 0.8 | 240 | 2.8 | ||||||||
| Settled dust collected in child′s room, above the floor level, in Bulgarian homes by vacuum cleaner | Mean | 260 | 350 | 7850 | 320 | 960 | 250 | [76] | |||||||
| Median | 280 | 340 | 9930 | 340 | 1050 | 300 | |||||||||
| Dust from rooms in Germany collected with vacuum cleaner (<2 mm) | Mean | 1.32 | 80.7 | 107.1 | 384 | 85.8 | 1026 | 114 | 13.5 | [80] | |||||
| Median | 1.42 | 12.9 | 36.5 | 44.1 | 82.2 | 996 | 113 | < 0.1 | |||||||
| Dust from rooms in Spain (Madrid) collected with vacuum cleaner (<2 mm) | Mean | 0.14 | 14.0 | 265 | 131 | 6.55 | 464 | 69.5 | 10.2 | [80] | |||||
| Median | < 0.1 | 7.88 | 201 | 145 | 5.3 | 370 | <0.1 | <0.1 | |||||||
| Dust from rooms in France (Paris) collected with vacuum cleaner (<2 mm) | Mean | <0.1 | 9.88 | 91.4 | 174 | 227 | 111 | 122 | 48.2 | [80] | |||||
| Median | <0.1 | 8.72 | 86.1 | 65.8 | 200 | 356 | 115 | <0.1 | |||||||
| Dust from rooms in Italy (Rome) collected with vacuum cleaner (<2 mm) | Mean | 0.30 | 9.60 | 221 | 36.6 | 89.0 | 503 | 76.0 | 142 | [80] | |||||
| Median | <0.1 | 6.78 | 180 | 42.8 | 23.6 | 434 | <0.1 | <0.1 | |||||||
| Dust from rooms in the UK collected with vacuum cleaner (<2 mm) | Mean | 0.12 | 12.2 | 52 | 50.2 | 56.5 | 192 | 48.5 | 20.8 | [80] | |||||
| Median | <0.1 | 3.5 | 43.2 | 52.8 | 24.5 | 195 | <0.1 | <0.1 | |||||||
| Settled dust from apartments in Stockholm from vacuum cleaner | Median | 0.47 | 14 | 104 | 103 | 16 | 449 | 0.00 | 106 | 56 | [74] | ||||
| Dust from the floor surface and from objects within 35 cm above the floor with vacuum cleaner in Japanese dwellings | Median | <0.5 | < 0.5 | 3.1 | 16.6 | 2.0 | 8.0 | 1110 | 139 | [70] | |||||
| Floor dust samples collected with vacuum cleaner from living rooms in 41 dwellings, Sapporo (Japan) | Median | <0.2 | 0.33 | 2.9 | 19.8 | 4.2 | 6.5 | 880 | 126 | [84] | |||||
| Dust samples from household vacuum cleaner bags in French dwellings (<100 µm) | Mean | 0.26 | 10.6 | 111 | 10.5 | 25.8 | 441 | 158 | [17] | ||||||
| Median | 0.25 | 4.9 | 20 | 9.1 | 6.1 | 462 | 139 | ||||||||
| House dust from urban dwellings in Nanjing, China, collected with vacuum cleaner (150 µm) | Mean | 0.4 | 0.9 | 52.3 | 2.9 | 462 | 1.6 | [36] | |||||||
| Median | 0.1 | 0.2 | 23.7 | 1.6 | 183 | 0.1 | |||||||||
| Dust from homes across the USA with vacuum cleaner (<1.4 mm) | Mean | 0.05 | 2.34 | 6.24 | 4.17 | 214 | 77.1 | 97.2 | 144 | [29] | |||||
| Median | 0.04 | 0.49 | 4.08 | 3.54 | 51.2 | 21.8 | 73.1 | 74.9 |
| PAHs | This Study | [91] | [85] | [87] | [88] | [92] | ||||||||||||
|---|---|---|---|---|---|---|---|---|---|---|---|---|---|---|---|---|---|---|
| Kitchens | Living Rooms | Bedrooms | Rug Bedroom | Rug Living Room | House Vacuum Samples Brisbane | Indoor Dust from Distinct Buildings Nepal | Settled Dust from Homes in Ottawa | Dust Samples from Private Domiciles and Public Buildings, China | Saudi Household Floor Dust | Kuwaiti Household Floor Dust | ||||||||
| Mean Min-Max | Median | Mean Min-Max | Median | Mean Min-Max | Median | Mean | Mean | Mean | Median | Mean | Median | Mean | Median | Mean | Median | Mean | Median | |
| ACY | 1.75 <0.001–7.89 | 0.432 | 3.22 <0.001–11.8 | 1.15 | 4.70 0.125–13.0 | 2.04 | 0.988 | <0.001 | 6.92 | 0.031 | 0.039 | 0.005 | 0.173 | 0.055 | 0.160 | 0.080 | 0.090 | 0.060 |
| ACE | 0.344 <0.001–1.50 | <0.001 | 0.74 <0.001–2.81 | 0.215 | 0.246 <0.001–1.45 | 0.063 | 0.067 | 0.136 | 202 | 0.018 | 0.093 | 0.052 | 0.110 | 0.105 | 0.065 | 0.060 | ||
| FLU | 0.073 <0.001–0.349 | <0.001 | 0.036 <0.001–0.287 | <0.001 | 0.017 <0.001–0.081 | <0.001 | 0.036 | 0.012 | 12.6 | 0.048 | 0.170 | 0.093 | 0.464 | 0.200 | 0.290 | 0.170 | 0.165 | 0.080 |
| PHE | 0.213 <0.001–0.876 | <0.001 | 0.260 <0.001–0.987 | 0.154 | 0.306 <0.001–1.16 | 0.177 | 0.169 | 0.275 | 8.77 | 0.173 | 2.78 | 1.48 | 4.19 | 1.67 | 0.425 | 0.160 | 0.510 | 0.410 |
| ANT | 1.56 <0.001–10.0 | <0.001 | 1.07 <0.001–8.57 | <0.001 | < 0.001 <0.001–0.003 | <0.001 | 0.002 | 1.52 | 3.61 | 0.062 | 0.485 | 0.196 | 0.418 | 0.196 | 0.105 | 0.050 | 0.032 | 0.025 |
| FLUA | 1.56 <0.001–8.48 | 0.277 | 1.12 <0.001–4.58 | <0.001 | 1.60 <0.001–11.4 | 0.045 | <0.001 | 0.197 | 53.6 | 0.128 | 4.26 | 1.77 | 0.425 | 0.175 | 0.220 | 0.140 | ||
| PYR | 4.46 <0.001–19.3 | 2.17 | 3.67 <0.001–11.2 | 1.51 | 4.65 <0.001–27.0 | 0.604 | 0.003 | 1.06 | 77.3 | 0.107 | 2.89 | 1.18 | 0.385 | 0.160 | 0.035 | 0.017 | ||
| CHR | 0.921 <0.001–3.65 | 0.404 | 0.695 <0.001–2.36 | 0.506 | 0.610 <0.001–3.41 | 0.23 | 0.120 | 0.053 | 5.42 | 0.157 | 3.29 | 1.19 | 1.79 | 0.717 | 0.095 | 0.085 | 0.055 | 0.040 |
| PER | 4.29 <0.001–22.4 | <0.001 | 3.73 <0.001–16.8 | 1.70 | 3.26 0.001–14.3 | 1.25 | 0.301 | 0.602 | ||||||||||
| CAR | 1.08 <0.001–7.89 | <0.001 | 1.83 <0.001–7.76 | 0.440 | 1.64 <0.001–11.6 | <0.001 | 0.001 | 0.141 | ||||||||||
| TER | <0.001 | <0.001 | 0.135 <0.001–0.765 | <0.001 | 0.021 <0.001–0.106 | <0.001 | 0.028 | <0.001 | ||||||||||
| RET | 3.15 <0.001–15.4 | 0.737 | 5.02 <0.001–16.2 | 2.20 | 5.28 <0.001–21.4 | 0.966 | <0.001 | 2.09 | ||||||||||
| BaA | 1.55 <0.001–3.60 | 1.78 | 0.516 <0.001–1.67 | 0.136 | 0.333 <0.001–2.38 | <0.001 | 0.040 | 1.40 | 6.39 | 0.078 | 2.38 | 0.696 | 2.37 | 0.569 | 0.090 | 0.080 | 0.090 | 0.055 |
| BbF | 1.91 <0.001–6.68 | 1.63 | 2.10 <0.001–5.28 | 1.31 | 1.50 <0.001–6.21 | 0.124 | 0.304 | 1.07 | 11.3 | 0.018 | 4.87 | 1.66 | 6.23 | 1.52 | 0.700 | 0.575 | 0.245 | 0.210 |
| BkF | 1.10 <0.001–5.56 | <0.001 | 1.02 <0.001–3.51 | < 0.001 | 0.960 <0.001–4.84 | <0.001 | <0.001 | 0.710 | 3.48 | 0.075 | 1.60 | 0.582 | 0.763 | 0.248 | 0.110 | 0.105 | 0.070 | 0.040 |
| BeP | 0.206 <0.001–1.44 | <0.001 | 0.844 <0.001–4.50 | <0.001 | <0.001 | <0.001 | <0.001 | 0.746 | ||||||||||
| BaP | 1.53 <0.001–4.91 | 1.63 | 1.23 <0.001–3.27 | 0.564 | 1.11 <0.001–3.43 | 0.219 | 0.061 | 1.43 | 2.97 | 0.094 | 2.91 | 0.803 | 1.71 | 0.310 | 0.550 | 0.290 | 0.140 | 0.080 |
| IcdP | 3.48 0.170–12.9 | 1.75 | 3.11 0.979–5.13 | 2.85 | 2.76 <0.001–8.29 | 2.32 | 2.61 | 0.565 | 3.34 | 0.115 | 3.07 | 0.911 | 1.97 | 0.356 | 0.015 | <0.001 | 0.055 | <0.001 |
| DahA | 0.289 0.290–1.22 | <0.001 | 0.790 <0.001–4.31 | 0.314 | 0.395 <0.001–1.52 | 0.155 | 0.162 | 0.071 | 20.1 | 0.046 | 0549 | 0.185 | 0.510 | 0.090 | 0.016 | <0.001 | 0.015 | <0.001 |
| BghiP | 2.43 <0.001–13.2 | 0.922 | 1.10 <0.001–4.40 | 0.275 | 1.46 <0.001–6.40 | <0.001 | <0.001 | 0.263 | 6.08 | 0.068 | 2.79 | 0.793 | 2.14 | 0.398 | 0.105 | 0.075 | 0.070 | <0.001 |
| Room | DMP | DEP | DBP | BBP | DEHA | DEHP | DNOP | DINP | DIDP | Σ |
|---|---|---|---|---|---|---|---|---|---|---|
| DIing–CHILDREN | ||||||||||
| Kitchens | 1.78 | 934 | 3695 | 41.4 | 112 | 1782 | 6095 | 67.1 | 43.4 | 12,772 |
| Bedrooms | 2.17 | 296 | 15,472 | 68.4 | 237 | 5898 | 6372 | 131 | 232 | 28,707 |
| Living rooms | 6.12 | 914 | 7765 | 73.0 | 125 | 8890 | 4938 | 185 | 437 | 23,333 |
| DIinh–CHILDREN | ||||||||||
| Kitchens | 0.000 | 0.0261 | 0.103 | 0.003 | 0.001 | 0.050 | 0.170 | 0.002 | 0.001 | 0.357 |
| Bedrooms | 0.000 | 0.0083 | 0.432 | 0.007 | 0.002 | 0.165 | 0.178 | 0.004 | 0.006 | 0.802 |
| Living rooms | 0.000 | 0.0255 | 0.217 | 0.003 | 0.002 | 0.248 | 0.138 | 0.005 | 0.012 | 0.652 |
| DIder–CHILDREN | ||||||||||
| Kitchens | 0.002 | 1.07 | 4.25 | 0.129 | 0.048 | 2.05 | 7.01 | 0.077 | 0.050 | 14.7 |
| Bedrooms | 0.003 | 0.340 | 17.8 | 0.272 | 0.079 | 6.78 | 7.33 | 0.150 | 0.267 | 33.0 |
| Living rooms | 0.007 | 1.05 | 8.93 | 0.144 | 0.084 | 10.2 | 5.68 | 0.213 | 0.502 | 26.8 |
| DIing–ADULTS | ||||||||||
| Kitchens | 0.190 | 100 | 396 | 12.0 | 4.44 | 191 | 653 | 7.19 | 4.65 | 1368 |
| Bedrooms | 0.232 | 31.7 | 1658 | 25.4 | 7.33 | 632 | 683 | 14.0 | 24.9 | 3076 |
| Living rooms | 0.655 | 97.9 | 832 | 13.4 | 7.82 | 952 | 529 | 19.9 | 46.8 | 2500 |
| DIinh–ADULTS | ||||||||||
| Kitchens | 0.000 | 0.009 | 0.037 | 0.001 | 0.000 | 0.018 | 0.062 | 0.001 | 0.000 | 0.129 |
| Bedrooms | 0.000 | 0.003 | 0.156 | 0.002 | 0.001 | 0.059 | 0.064 | 0.001 | 0.002 | 0.289 |
| Living rooms | 0.000 | 0.009 | 0.078 | 0.001 | 0.001 | 0.090 | 0.050 | 0.002 | 0.004 | 0.235 |
| DIder–ADULTS | ||||||||||
| Kitchens | 0.000 | 0.150 | 0.595 | 0.018 | 0.0067 | 0.287 | 0.981 | 0.011 | 0.007 | 2.05 |
| Bedrooms | 0.000 | 0.048 | 2.49 | 0.038 | 0.0110 | 0.949 | 1.03 | 0.021 | 0.037 | 4.62 |
| Living rooms | 0.001 | 0.147 | 1.25 | 0.020 | 0.0117 | 1.43 | 0.794 | 0.030 | 0.070 | 3.75 |
| Cancer risk | Kitchens | Bedrooms | Living Rooms | |
|---|---|---|---|---|
| ILCRing | Children | 9.2 ×10⁻⁶ | 7.2 × 10⁻⁶ | 9.4 × 10⁻⁶ |
| Adults | 1.4 × 10⁻⁵ | 1.1 × 10⁻⁵ | 1.4 × 10⁻⁵ | |
| ILCRinh | Children | 1.4 × 10⁻¹⁰ | 1.1 × 10⁻¹⁰ | 1.4 × 10⁻¹⁰ |
| Adults | 6.9 × 10⁻¹⁰ | 5.4 × 10⁻¹⁰ | 9.0 × 10⁻¹⁰ | |
| ILCRder | Children | 3.6 × 10⁻⁸ | 2.8 × 10⁻⁸ | 3.7 × 10⁻⁸ |
| Adults | 7.1 × 10⁻⁸ | 5.6 × 10⁻⁸ | 7.3 × 10⁻⁸ | |
| Total ILCR | Children | 9.3 × 10⁻⁶ | 7.2 × 10⁻⁶ | 9.4 × 10⁻⁶ |
| Adults | 1.4 × 10⁻⁵ | 1.1 × 10⁻⁵ | 1.4 × 10⁻⁵ | |
© 2019 by the authors. Licensee MDPI, Basel, Switzerland. This article is an open access article distributed under the terms and conditions of the Creative Commons Attribution (CC BY) license (http://creativecommons.org/licenses/by/4.0/).
Share and Cite
Vicente, E.D.; Vicente, A.; Nunes, T.; Calvo, A.; del Blanco-Alegre, C.; Oduber, F.; Castro, A.; Fraile, R.; Amato, F.; Alves, C. Household Dust: Loadings and PM10-Bound Plasticizers and Polycyclic Aromatic Hydrocarbons. Atmosphere 2019, 10, 785. https://doi.org/10.3390/atmos10120785
Vicente ED, Vicente A, Nunes T, Calvo A, del Blanco-Alegre C, Oduber F, Castro A, Fraile R, Amato F, Alves C. Household Dust: Loadings and PM10-Bound Plasticizers and Polycyclic Aromatic Hydrocarbons. Atmosphere. 2019; 10(12):785. https://doi.org/10.3390/atmos10120785
Chicago/Turabian StyleVicente, E. D., A. Vicente, T. Nunes, A. Calvo, C. del Blanco-Alegre, F. Oduber, A. Castro, R. Fraile, F. Amato, and C. Alves. 2019. "Household Dust: Loadings and PM10-Bound Plasticizers and Polycyclic Aromatic Hydrocarbons" Atmosphere 10, no. 12: 785. https://doi.org/10.3390/atmos10120785
APA StyleVicente, E. D., Vicente, A., Nunes, T., Calvo, A., del Blanco-Alegre, C., Oduber, F., Castro, A., Fraile, R., Amato, F., & Alves, C. (2019). Household Dust: Loadings and PM10-Bound Plasticizers and Polycyclic Aromatic Hydrocarbons. Atmosphere, 10(12), 785. https://doi.org/10.3390/atmos10120785