Article

Influence of Individual Household Heating on PM2.5 Concentration in a Rural Settlement

Chair of Thermal Engineering and Industrial Facilities, Opole University of Technology, 45−271 Opole, Poland
Atmosphere 2019, 10(12), 782; https://doi.org/10.3390/atmos10120782
Submission received: 29 October 2019 / Revised: 29 November 2019 / Accepted: 2 December 2019 / Published: 5 December 2019

Abstract

:
This article reports the results of research on the concentration of particulate matter (PM) in two places in one village named Kotórz Mały (Poland). The main point of the research was to check the influence scale of different low-emission source forms as components of the anthropogenic factor driving the changes in local air quality. Measurements were made over five cold seasons. To investigate the dust concentrations, the gravimetric and optical method was used. The weather conditions were measured with portable weather stations. It was found that the character of individual heating systems had a major influence on local air quality. The presence of a permanent state of the troposphere and temperature inversion led to the inhibition of pollution dispersion processes and significant local changes, exceeding the recommended PM2.5 concentrations limit. The effects of policy still don’t influence air quality trends in the Polish village. The main problem of high concentrations of PM2.5 is the old generation of individual heating systems and the lack of significant support from local and national authorities. For the terms considered and the period of observation, meteorological measurements can be considered a sufficient foundation for the estimation of the occurrence of worrying conditions.

1. Introduction

The available works concerned with the subject of air pollution focus primarily on data presentation with regard to air quality in urban and industrialized areas [1,2,3,4,5,6,7] or areas exposed to the impact of heavy road transport [8]. Papers discussing the results of research on air quality in rural areas usually cover rural areas located near industrial zones and large metropolitan spaces [9,10]. Given the key criterion determining the necessity of air quality monitoring, that is, the population density, this approach is fully justified. However, the toxic influence of the compounds enriching the earth’s atmosphere negatively affects human health, flora, fauna and the material goods found within rural areas [11]. Authors usually compare urban concentrations of particulate matter (PM) with remote rural areas and find the latter to be much cleaner. In the last century, occasional increase in rural aerosol concentrations were mostly attributed to the transportation of particles from polluted urban or industrial areas and remote natural sources [12]. Of course, this cannot be challenged and is confirmed by a number of observations [13,14,15]. On the other hand, the air quality in rural areas is largely affected by local emission sources. This issue is better recognized nowadays; over the last decade the number of papers reporting results of studies conducted in the areas of compact rural buildings and small villages has increased. Unfortunately, a significant number of papers aren’t concerned with the situation in rural settlements in European countries. In several papers [10,16,17,18,19,20,21] it was remarked that, in the cold season (in France, Czech Republic, Austria, Belgium and Poland), the principal source of PM emission is associated with the combustion of conventional fuels in domestic heating systems. The authors mentioned also clearly state that the combustion of biomass has a considerable effect on the local level of air quality. In the case of the former countries of the eastern bloc, the problem of air quality in rural settlements has only been raised in a few papers [21,22,23,24]. Particularly noteworthy is the work devoted to the situation in the Czech countryside. Branis et al. [23] discuss the results of a short, three-week study involving measurements of the concentration of PM (PM2.5 and PM10) in the area of compact rural buildings. The authors state that traditional heating methods in villages contribute a great extent to local air pollution, which can represent a considerable issue. In fact, this statement is still true. In most small towns and villages in Poland, individual heating systems are still based on the combustion of low-quality coal, or even waste [25]. Households constitute the most significant group of consumers in the small coal recipients sector. In the years 2005–2015, this group consumed between 8.0 to 10.8 million tons of hard coal annually, and its share in the consumption of coal in the sector of small consumers on a national scale changed in the range of 77–81% [25]. Despite many projects carried out in Poland to improve air quality, its condition does not meet the standards set out in the CAFE Directive (Directive 2008/50/EC), especially for dust sub-fractions and related substances (like Polycyclic aromatic hydrocarbons). Poland is one of the countries in which the communal and household sector is the main source of total dust emission (TSP) and its PM10 and PM2.5 fractions, respectively: 47.8%, 50.9%, and 54.0%. In the case of PM2.5 fraction total emission, the share of household heating systems is arising year by year [26].
Concentrations of aerosol particles within local air sheds are affected by meteorological parameters; Khedairia and Khadir [27] stated that it is extremely important to consider the effect of meteorological conditions on air pollution, because they directly influence the dispersion effect of the atmosphere. Locally, clearly unfavorable situations occur under constant atmospheric conditions. Triantafyllou [1] concluded that the highest concentration of PM particles was associated with stagnant air conditions; in such circumstances, local circulations in the area result in recirculation and accumulation of pollutants. During the cold, winter period, stable atmospheric conditions are very often connected with temperature inversion, which traps polluted air masses and provides the highest concentration of particulates. Robinson et al. [28] emphasized that inversion and lack of wind can play a huge role in the retention of the contaminants in a separate area related to high emission.
A review of the literature indicates that the local aerosanitary condition is relative to the intensity of emissions and meteorological parameters. The correlations between PM2.5 concentrations and specific meteorological parameters are different for various study areas. The climate conditions, location, and local emission sources, as well as the effects of long-range transport, have a considerable effect on the results. For example, on the Greek coast and in Algeria, higher concentrations of aerosols are noted in the summer than in the winter [14,27]. This means that each region needs to be considered individually. Unfortunately, in contrast to many Asian and American countries, in Poland there is a virtual lack of studies on air quality around compact rural buildings. The number of measuring stations in rural areas against the number of inhabitants per square kilometer is also an alarming index [24].
In Poland, around 14% of households have a problem with so-called “energy poverty”. The three main factors affecting “energy poverty” are low household income, the low energy efficiency of inhabited buildings and equipment, and inefficient use of energy and equipment by households. Over 76% of these households are located in villages [29]. Branis et al. [23] explained why the permanent use of cheap energy carriers is popular in the countries in the former eastern bloc: “the economic transformation has not positively influenced combustion practices of inhabitants in small towns and villages to the same extent. Hand in hand with the increasing prices of oil, electricity and natural gas, the people have tended to return to traditional and cheaper fuels”. For the same reason, not only in the Czech Republic, but especially in Poland, many households still use or have returned to traditional hard coal burning. A crucial presumption seems to be that more ecological fuels are still not frequently used for heating purposes and that this situation may be even worse in poorer Eastern European countries and regions in Romania, Bulgaria, Ukraine, and Belarus [23]. The authors clearly point out the need for more information and research into local air quality, which is needed to better understand this issue.
Taking into account the above factors, the absence of long-term measurements and the small number of publications on the quality of air in rural settlements in the Polish countryside, steps have been taken to analyze the quality of air in non-industrialized rural areas.
The main purpose of this study was to compare the PM2.5 levels in two areas of one village, which differ in terms of the individual heating systems used. In addition, to check the potential impact of mitigation policy, the PM2.5 mass concentration was compared in different periods of observation. The main focus was on the cold periods of the year, during the steady atmospheric conditions that were strengthened by an anticyclone and the occurrence of tropospheric temperature inversion. The scope, type, place, and conditions of observation enabled the verification of the following hypotheses:
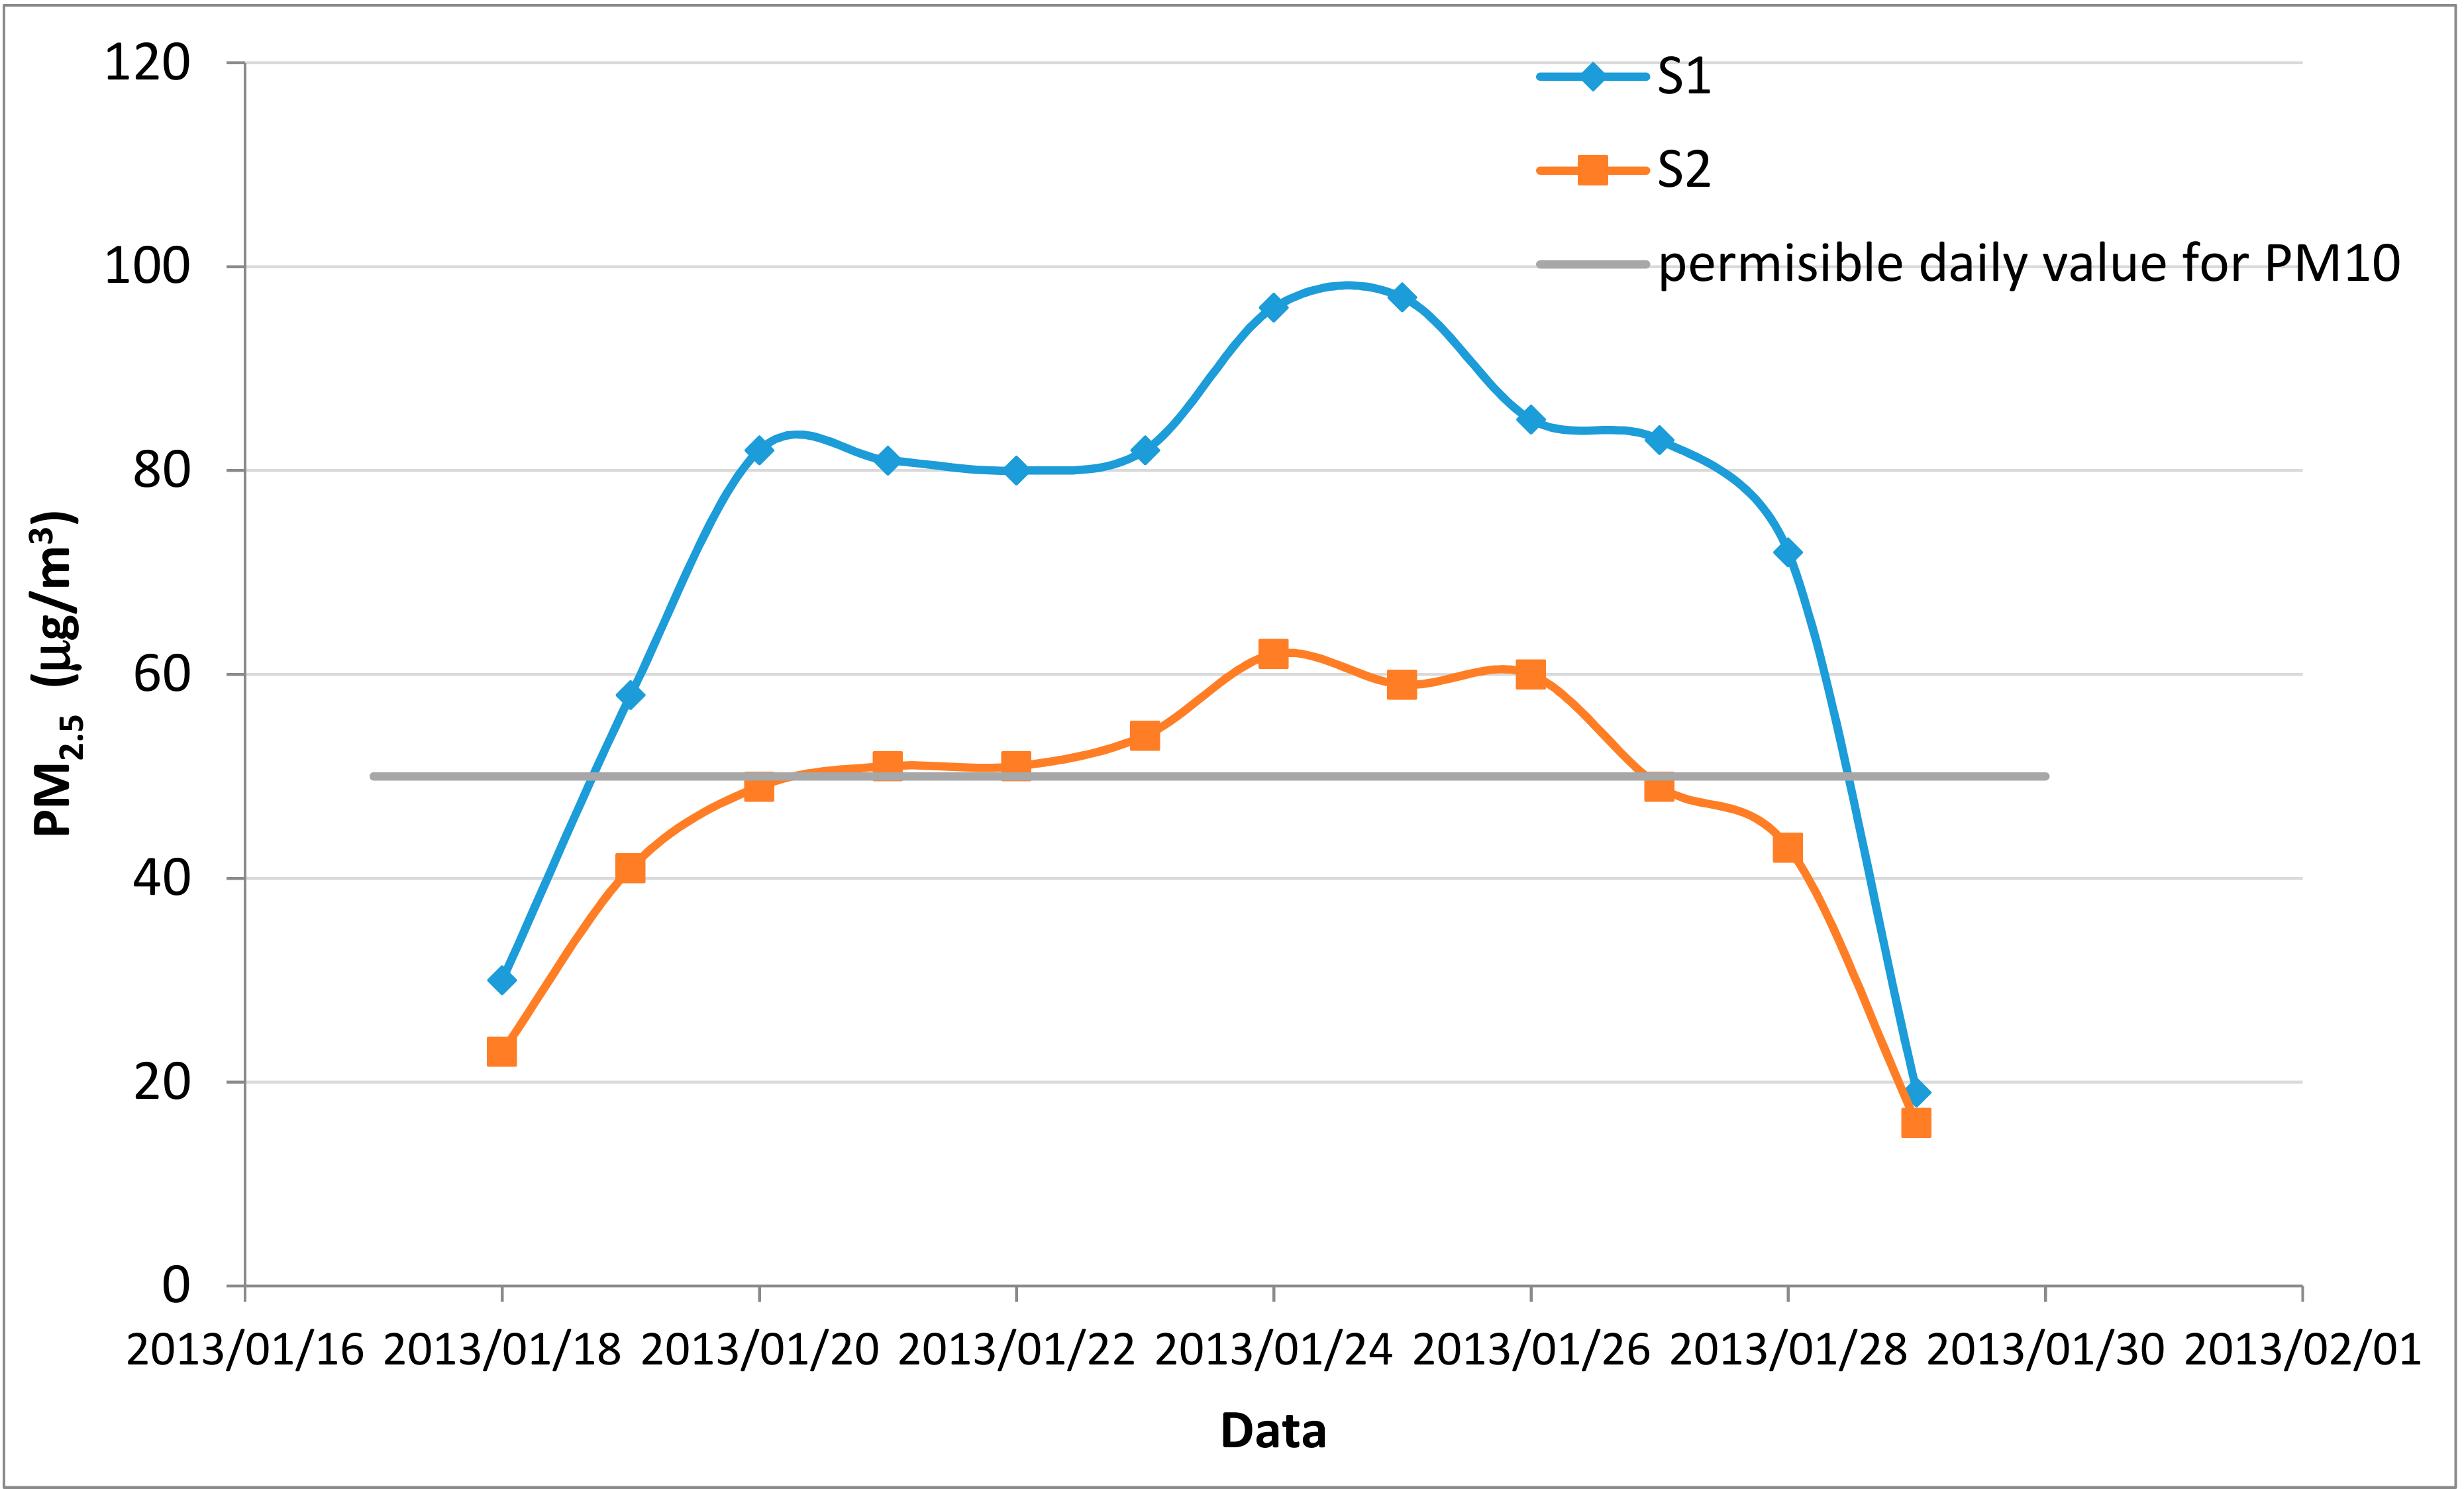
  • during cold seasons, the average daily PM2.5 concentrations are similar on the borders of one village (I),
  • during cold seasons and unstable atmosphere conditions, the average daily PM2.5 concentrations are similar on the borders of one village (II),
  • during cold seasons and stable atmosphere conditions, the average daily PM2.5 concentrations are similar on the borders of one village (III),
  • during stable atmosphere conditions, hourly PM2.5 concentrations are similar on the borders of one village and no differences exist at any point during the day (IV),
  • after undertaken mitigation measures in the form of implementing the low-emission reduction program, average winter PM2.5 concentrations are similar for the base season (2010/11) and the last season campaign (2019) (V).

2. Materials and Methods

2.1. Measurement Area Description

Experiments involved the observations of air quality within the two separate zones of the village of Kotórz Mały, Poland (Figure 1). Both zones were indicated as an area of 300 m radius from the receptors. The first zone (S1) with 94 individual point emitters (IPE) is characterized by rural development, which predominantly uses obsolete individual heating systems (hard coal, 91%, wood, 6%, only 2% of non-emission heating systems). The second zone with 71 IPE in 2010–2014 and 84 IPE in 2019 is a modern building area (S2), where the production of heat energy mainly uses gaseous fuel or pellets (43%), eco-coal and wood (33%) and electricity and heating pumps (19%). At both sites, the emission activity was indicated by using ad oculos observations, on the base of local authorities’. data and individual answers from the heating systems users. Measurement points were located in the centre of both zones. In S1 and S2, the nearest chimneys were situated 15 m from measurement points. The distance between S1 and S2 is 1.4 km.
Kotórz Mały is a small village (with a population of approx. 1000). Except for two small carpentries, there is a lack of local industry or enterprises that substantially affect air quality (both carpenters are equipped with high-efficiency dust collection systems). During the cold season, in the rural populated area, the main local source of air pollution is associated with domestic heating [21,22,23,30]. The annual-average fuel consumption in individual households varies widely and depends not only on the efficiency of energy devices, the expected thermal comfort but also on the wealth of household residents (in the Opole Voivodeship, over 27,000 households are affected by the problem of “energy poverty” [25], no data about situation in Kotórz Mały). Table 1 presents survey data for tested village (n = 92).
The choice of research site was determined by minimizing the influence of the industry and the urban background. The nearest large city (the capital city of the province, Opole, with 122,000 inhabitants) is located 15 km southwest of the village. For the realization of the project criteria (isolated area without significant external emission) Kotórz Mały proved to be a suitable spot due to of the existence of a natural forest barrier, and on an annual scale, the share of winds from the southwest amounts to ca. 10%, thus greatly limiting the emissions from urbanized areas [24]. The average altitude for Kotórz Mały is 163–166 m (the average for the Province is 270 m, and for the entire country, is 173 m), and the population density is 106.3 inhabitants per km2 (the average for the province is 110 inhabitants per km2, and for the entire country, is 120 inhabitants per km2).

2.2. PM2.5 Sampling Procedure and Meteorological Data

Measurements of PM2.5 mass concentration were taken over four successive cold seasons (361 days; December to February 2010 to 2014). Additionally, the trends were checked during a single measurement campaign in the winter of 2018/19 (38 days from December to January). The last campaign of measurements was to check whether there were differences in air quality after five years, that is, from the possible use of aid programs by the people, enabling a potentially low-cost change of the heating system (and type of fuel) in the household. PM2.5 mass concentration measurements were performed in accordance to the European standards PN-EN 12341:2006 (first four measurement campaigns) and PN-EN 12341:2014-07 (the last campaign). The reference method, which is often relied upon [31], was also applied in this case. The aspiration of the PM2.5 in the air (at both points) was measured using Tecora® (TCR Tecora, Cogliate, IT) automatic low-volume dust samplers with filters sequential changers. The aspiration headers were installed 2 m above ground level. In both sites, the airflow rate passed filters was 2.3 m3·h−1. The PM separators applied Whatman GF/A fiberglass air filters with a diameter of 47 mm. Prior to and after aspiration, the filters were seasoned for a minimum 24 h under conditions of constant temperature and humidity, and, subsequently, their weight was determined using a differential scale RADWAG XA 52/2X ® (Radwag Balances and Scales, Radom, PL). At both sites, PM2.5 concentration was measured at 24 h intervals (during stable atmosphere conditions and, of course, temperature inversion occurring at 1 h intervals). The expanded concentration measurement uncertainty did not exceed 13.2%. The time interval guaranteed the PM2.5 collection to a degree that was sufficient to determine the mass of the captured PM, even in conditions when its concentration in the air was low (EC Working Group 2000), and ensured that the effect of synoptic processes and activity of the sources of PM emissions on the variability of aerosols was limited. Additionally, during the selected days of the last measurement campaign, to estimate 1-hour changes in PM2.5 mass concentrations, real-time optical DustTrak™ DRX Aerosol Monitors were used. To avoid mistakes in the representativeness of the sample, the aerosol monitors were equipped with the DustTrak Environmental Enclosure 8535.
A portable weather station DAVIS® (Davis Instruments, Hayward, CA, USA) was used to determine weather conditions. Portable stations are usually used for the registration of weather conditions in tests [32]. Weather stations were installed 12 m from the PM aspirators. The sensors, which determined relative humidity (RH), temperature (T), atmospheric pressure (Ap), wind speed (Ws) and wind direction (Wd), similar to the case of the PM10 aspiration headers, were installed 2 m above the ground. The standard measurement uncertainty was equal to RH 0.5%, T 0.5 °C, Ap 0.06 h Pa, Ws 0.06 m·s−1 and Wd 1°, respectively. To determine the occurrence and duration of a stable atmosphere (and temperature inversion episodes), weather balloons equipped with radiosonde and temperature detectors were used. At both sites, weather balloons (2 × 3) connected with nylon cords were exposed 25, 50 and 100 m above the ground. All meteorological data were collected with data loggers.
A statistical analysis of the results for the verification of the research hypotheses was undertaken by means of the STATISTICA 13.3® (TIBCO Software Inc., Palo alto, CA, USA).

3. Results and Discussion

The analysis of the basic meteorological parameters (Wilcoxon test, α = 0.05) registered in the specific season at locations S1 and S2 indicated that there were no considerable statistical differences with regard to the values of RH, T, Ap, Ws and Wd. Table 2 contains a summary of overall meteorological data for Kotórz Mały settlement registered in the cold season. The average fuel consumption correlated well with outdoor air temperature. During the five seasons of observation, the mean temperature was around –0.8 °C, and almost 46% of the days were characterized by low wind speeds (<0.26 m·s−1). A large number of days with no wind were observed, in particular, in the first and third periods. Furthermore, the mean atmospheric pressure was 1003 h Pa; however, 50% of the days were characterized by high atmospheric pressure (>1010 h·Pa), which was associated with the presence of a large anticyclone from Russia. The measurements indicate that over 43% of observation days were characterized by the presence of a stable atmosphere with no-wind conditions, high atmospheric pressure, and significant temperature inversion, with over 2 °C differences between 0 and 25 m above the ground. The majority of the observation days also showed steady atmospheric conditions in the first and third season of the measurements.
The mean concentration of PM2.5 in the winter seasons (2010–2014 and 2019) in the study area was equal to 36.9 μg·m−3. In Europe, Poland is classified as a net emitter, as more emissions are produced than are brought into the country. The results indicate that, not only the urban emissions, but also village emissions, play an important role in degrading aerosanitary parameters.
Table 3 presents comparison of data received during winter measurement campaigns in different places.
The value from Kotórz Mały was significantly higher than the ones registered in the rural background and regional background stations in Poland and the Czech Republic. The results clearly show differences between the effectiveness of low-emission sources in Polish villages and those existing in European main cities. It is important to compare the average PM2.5 concentration for villages in the Czech Republic and Poland. Both locations were characterized by a similar number of houses. Despite the significant difference in the measurement period (environmental protection regulations were less stringent in 2003), the difference is significant and shows how big a problem exists in the Polish countryside. The problem of emissions from rural settlements is a current one, as those emissions could have an effect on the local scale and could enrich the atmospheric aerosol in the remote areas and in towns under favorable weather conditions [12]. As a result, as remarked by Branis et al. [23]: “it is possible that urban aerosol may not be the only (important) source of ‘regional aerosol cloud’ which can be transported over relatively long distances affecting remote areas by means of long-range transport”. For example, the differences in air quality between cities and remote areas in Hungary were noted to be inconsiderable [41]. These authors believed that this situation was due to long-range transport associated with winds. In other words, in winter in particular, rural areas in Poland can contribute to air pollution in the countries of west Europe.
During the cold season, the mean daily concentration of PM2.5 was around 58% higher in the old part of the village. Nevertheless, in the first period of the observation, the difference was as much as 71%, which corresponds to the prolonged periods associated with cold air temperatures accompanied by steady atmospheric conditions. Branis et al. established the existence of differences between the concentration of PM10 in an area of rural development and a forest area located at a distance of 2.5 km at a level of around 42% (it could be similar in the case of PM2.5) [23]. However, it was noted that the air quality in the forest area was influenced by the transport of PM from the polluted urban areas. In the case of the measurements taken in Kotórz Mały, both locations were responsible for some amount of emissions, and the distance between the measurement points was considerably smaller. In the same manner, one can note that the influence of the local household heating systems (their types, number and volume of emission) on the air quality was significant. By examining the proportions of the classical, low-emission sources in the two study areas, this situation was puzzling. For example, the total emissions from a chimney of a single-family house with wood-based heating was two orders of magnitude greater than from an emitter that introduced a load of pollutants into the atmosphere after the combustion of natural gas [42].
By comparing test locations S1 and S2, considerable differences were noted with respect to the number of days in which the 24 h mass concentration of PM2.5 exceeded the maximum recommended value. According to the World Health Organization (WHO) recommendation, only 3 days per calendar year are permitted to have mean daily PM2.5 concentrations of above 25 µg·m−3. In EU legislation there are not any limitations connected with 24-h mean value of PM2.5. During only one, the most “clean period” (2014) of the measurement campaign, the WHO level was exceeded 36 times at S1 and 27 times at S2. For the remaining cold seasons, the number of days with a higher than recommended level of pollution was over 40 days in both locations. This is a significant problem, if only because of the results presented in [30,43], and referring to the content of heavy metals, PAHs, mercury or elemental and organic carbon in “rural-born” PM2.5. Concurrently, the comparison of unpublished data from own field measurements at S1 for the warm season (2019) shows that the average mass concentration of PM2.5 in the area of compact rural buildings was over three times lower than during the winter months (cold avg; 45.9, warm avg; 14.3 µg·m−3). This is confirmation of selected conclusions made in [43]. The values identified in this manner were higher than the ones registered in the rural areas in Flanders (Belgium) [17] and, concurrently, were lower than in India [19]. These differences seem to confirm that anthropogenic origins of emissions associated with (specific to certain periods of the year) weather conditions play a key role and strongly affect the local concentration levels of PM2.5.
The results of the statistical analysis (Mann-Whitney U test, α= 0.05) indicated the existence of considerable differences in the mean daily values of PM2.5 concentrations at both test locations. The values of the probability test (p-value) were equal to 0.004, 0.023, 0.003, 0.019, and 0.007, respectively, for the 2010/11, 2011/12, 2012/13, 2013/14, and 2018/19 measurement seasons. The results gained in this manner concurrently indicate that hypothesis I should be rejected. The graphical representation of the results found in Figure 2 indicates that this condition is principally attributable to meteorological parameters.
During the days characterized by relatively high temperatures and noticeable horizontal and vertical air mass exchange, the results of the measurements were quite balanced. The p-value for the Mann-Whitney U test, for the respective seasons 2010/11, 2011/12, 2012/13, 2013/14, and 2018/19, were higher than the level of relevance (α = 0.05) and equal to 0.068, 0.054, 0.107, 0.07, and 0.19, respectively. The above indicates that hypothesis II should be accepted. The verification of hypothesis III conducted by the use of the same test refuses its justification altogether. For days with steady atmospheric conditions, considerable differences can be observed. The daily mass concentrations of PM2.5 in S1 were from 63 to 75% higher than in S2. The values of the test probability were considerably lower from the relevance level and, for all seasons, the p-value was lower than 0.005. Insignificant statistical differences in weather conditions between the two observation sites clearly show that the type of individual heating systems is the principal factor responsible for the deterioration of the local aerosanitary conditions. Nevertheless, this statement only forms a confirmation of the observations made by earlier authors, such as Błaszczyk et al. [21].
Of course, long-term trends can’t be discussed. But a five year gap doesn’t provide significant changes in PM2.5 mass concentration on both sites of observation. At the local scale, especially at S1, there weren’t any changes in the characteristic of sources, but for full analysis the chemical profile of PM2.5 compounds is needed. Researchers from the Czech Republic found a declining trend of the elemental concentrations in the respirable fraction at background rural area [44]. But it wasn’t directly connected with air quality inside the area of compact rural buildings. The difference between the old and the new part of the village is still significant, even despite the clear increase emitters in S2 compared to the base period. On the other hand, what should be considered as positive, a greater number of IHS at S2 don’t provide greater amount of dust pollution (p-value = 0.16 for 2010-14 and 2019 relation).
The verification of hypothesis V conducted by the Mann-Whitney test, with final p-values 0.88 and 0.85 for S1 and S2, respectively, shows that there are no differences in tested seasons. The hypothesis is true. Average winter PM2.5 mass concentrations changed about 3.0 and 2.3 percent in S1 and S2, respectively. These results don’t correspond with average fuel consumption data related to both seasons (Table 1). In S1, there are a lot of very old heating systems, which can have a very significant impact on air quality. The low-emission reduction program for the Opolskie Voivodeship did not bring the expected results. Admittedly, 303 contracts have been signed for the total value of loans of around 1.7 million EUR in the Voivodeship. Most contracts for co-financing were signed as part of investments involving the exchange of heat sources (172 units for a total value of approximately 0.63 million EUR) and using renewable energy (96 units for a total value of approximately 0.65 million EUR) [45]. However, only three contracts were signed in Kotórz Mały. According to declarations, the vast majority of residents want to replace boilers or install renewable energy sources equipment. Simultaneously, respondents point out that the costs of such investments are too high.
The permanent presence of the stable state of the atmosphere and a temperature inversion result in the inhibition of pollution dispersion processes and significant local changes, exceeding the recommended/safe daily PM2.5 concentrations. The measurements show that the three-day period of temperature inversion enhanced by the occurrence of an anticyclone (during a steady state of the atmosphere) only caused a situation in which local air emission levels did not meet the standards required for the protection of human health.
Figure 3 presents selected data for nine days of the permanent occurrence of a temperature inversion. The short description of meteorological parameters changes for the indicated case: January 19 Ap is arising from 989 to 1020 h Pa, T is starting to reduce and Ws is almost stopped (below 1 ms−1). For the next 9 days, the avg. T is stable −9 to −11 °C, Ap also (1023 h Pa), Ws is < 0.6 ms−1. January 28 Ap is starting to fast reduce, T is going higher and Ws is arising significantly. It can be seen that the inhibition of the dispersion in the atmosphere, for a similar temperature and size of local emission conditions, leads to a noticeable enrichment of the local atmosphere by PM. Similar conclusions were made by Robinson et al. [28] and Trivedi et al. [46] who indicated that temperature inversion and no-wind conditions play an important role in the maintenance of pollution in a remote location characterized with a high emission level. By observing the graphical illustration, one can note that, in an area with a specific structure of energy carrier use, the levels of PM2.5 concentrations registered over a period of several days assume distinct values. The relatively small distance of the source of PM2.5 does not bring about the process of balancing aerosol concentrations, even at small distances. The difference in the PM2.5 concentrations registered between sites S1 and S2 during the occurrence of specific meteorological conditions and changes caused by higher activity of home boilers could be considered a constant value (ratio S1/S2 = 1.8). The lack of convection and advection, high and constant atmospheric pressure, and the low and steady temperature contribute to the enrichment of the local troposphere with respirable particles [47]. The occurrence of local high levels of PM in the air accompanying the anticyclone period and no-wind condition was also recorded in Greece [1] and Spain [15]. A reverse approach was used in a study conducted in Greece [47], in which specific meteorological conditions were discussed. However, theoretical studies indicate the existence of a relevant negative correlation between the concentration of aerosols and wind speed [48,49]. The studies performed also show that, in a temperate-transitional climate, the occurrences of unstable states of the atmosphere and the horizontal movement of air masses >2.5 ms−1 result in a noticeable improvement of the aerosanitary conditions in only one day. The results of original studies and other reports indicate that the weather conditions and climate location play a significant role in the change in air quality characteristics.
The effect of various sources of emissions on the hourly changes in the PM2.5 concentration under the same specific weather conditions is shown in Figure 4. Explicit differences in the concentration of PM2.5 at both measurement sites can also be observed with regard to a short period of observation. The maximum peaks (morning peak and especially evening one), which are associated with increased exploitation of specific emission sources, are more than two times greater in relation to the mean in the older part of the village. Graphical data also indicates that emissions from modern heating systems are more regular, because of the automatic process of providing fuel. The statistical analysis confirms the existence of considerable differences in the hourly PM2.5 concentrations between sites S1 and S2 for all cases when the condition of the steady atmosphere was noted, and it was accompanied by temperature inversion during the cold seasons. The results of the Mann-Whitney U test for each of the analyzed seasons was lower than the adopted relevance level (0.05). Figure 5 contains a comparison of the mass concentration of PM2.5 depending on the activity of the emission sources in the two locations examined. A graphical interpretation of the results suggests the existence of differences while simultaneously confirming the existence of the periodic influence of the considerable point emission activity of sources on the quality of the surrounding air. A detailed analysis with the use of a two-tailed multiple comparison does not only indicate statistically relevant differences between the values of PM2.5 mass concentration in the site S2 determined during high and low activity of local sources (p-value = 0.08). The results imply that it is not the number of emitters but the type of energy fuel combusted that has the predominant effect on the local aerosanitary conditions. The results of the statistical analyses showed that hourly PM2.5 concentrations measured during steady atmospheric conditions are not similar on the borders of one village, and there are differences throughout the entire day. Hence, hypothesis IV should be rejected.
Table 4 presents data gained from the analysis of the impact of weather conditions on PM2.5 mass concentrations. The data were statistically analyzed, and the estimated trend model adequately justified the correlation between meteorological parameters and PM2.5 concentration. A positive dependence was observed between suspended dust concentrations, atmospheric pressure and average daily air temperature (but only during the warm period). These results confirm the observations made by Mues et al. [50]. A negative relationship, in turn, was observed between PM2.5 concentrations, the average daily wind speed and the average daily air temperature (but only during the cold period). The results of the statistical analysis confirmed that meteorological conditions are also a significant factor affecting changes in aerosanitary conditions. During the cold period of the year, in such cases, a rise in temperature and wind speed contributes to the dispersion of PM2.5. One can additionally note that, during the cold season and with the occurrence of most adverse meteorological conditions, both positive and negative correlations are characterized by higher values, even for the lowest adopted relevance level.

4. Conclusions

The results of air quality monitoring conducted over five cold seasons in rural building-surrounding areas uniformly indicate that the problem of enriching local air with PM2.5 is relevant and current. On the other hand, the considerable load of pollutants emitted from point sources is diluted by the vertical and, in particular, horizontal motion of air masses, and has a considerable and negative effect on remote areas. In consideration of the conditions and the period of observation, meteorological measurements can be considered a useful tool for the estimation of the occurrence of worrying conditions. The characteristics of an emission source (fuel type used, emission activity, the efficiency of heat boilers) play a key role on local-rural air quality. On a local scale, the results of the experiment show that there is a need to replace obsolete heating systems with new ones to ensure that significant amounts of dust and other pollutants are not emitted. Unfortunately, a lack of help from local authorities causes Polish villages to stagnate. Aid programs and direct funding to reduce low emissions are financially unattractive to ordinary households. Perhaps a significant improvement will be seen in the years to come after the completion of the new programs “Clean Air” and “Stop Smog” (up to 70% subsidies for thermo-modernization and the replacement of heating sources for “energy poverty” households). The government has also introduced 15 recommendations for improving air quality in Poland. In the case of dispersed sources, these are: thermo-modernization and thermo-renovation of replacing coal with gas; using renewable energy sources; or replacing old inefficient domestic coal combustion installations with highly energy-efficient and ecologically efficient combustion installations, powered by authorized solid-fossil fuels and solid biofuels.

Funding

The research project was funded with private initiative.

Acknowledgments

The author wish to kindly thank the authorities of the Mechanics Department of The Opole University of Technology for providing the necessary equipment and financial support without which it would not be possible to carry out this research project.

Conflicts of Interest

An author declares no conflicts of interest.

References

  1. Triantafyllou, A.G. PM10 pollution episodes as a function of synoptic climatology in a mountainous industrial area. Environ. Pollut. 2001, 112, 491–500. [Google Scholar] [CrossRef]
  2. Lonati, G.; Cernuschi, S.; Giugliano, M. The duration of PM10 concentration in a large metropolitan area. Atmos. Environ. 2011, 45, 137–146. [Google Scholar] [CrossRef]
  3. Unal, Y.S.; Toros, H.; Deniz, A.; Incecik, S. Influence of meteorological factors and emission sources on spatial and temporal variations of PM10 concentrations in Istanbul metropolitan area. Atmos. Environ. 2011, 45, 5504–5513. [Google Scholar] [CrossRef]
  4. Samek, L.; Furman, L.; Mikrut, M.; Regiel-Futyra, A.; van Eldik, R. Chemical composition of submicron and fine particulate matter collected in Krakow, Poland. Consequences for the APARIC project. Chemosphere 2017, 187, 430–439. [Google Scholar] [CrossRef]
  5. Dzikuć, M. Problems associated with the low emission limitation in Zielona Góra (Poland): Prospects and challenges. J. Clean. Prod. 2017, 166, 81–87. [Google Scholar] [CrossRef]
  6. Samek, L.; Stegowski, Z.; Styszko, K.; Furman, L.; Fiedor, J. Seasonal contribution of assessed sources to submicron and fine particulate matter in a Central European urban area. Environ. Pollut. 2018, 241, 406–411. [Google Scholar] [CrossRef]
  7. Chambers, S.D.; Podstawczyńska, A. Improved method for characterising temporal variability in urban air quality part II: Particulate matter and precursors in central Poland. Atmos. Environ. 2019, 219, 117040. [Google Scholar] [CrossRef]
  8. Ozan, C.; Haldenbilen, S.; Ceylan, H. Estimating emissions on vehicular traffic based on projected energy and transport demand on rural roads: Policies for reducing air pollutant emissions and energy consumption. Energy Policy 2011, 39, 2542–2549. [Google Scholar] [CrossRef]
  9. Gomiscek, B.; Frank, A.; Puxbaum, H.; Stopper, S.; Preining, O.; Hauck, H. Case study analysis of PM burden at an urban and a rural site during the AUPHEP project. Atmos. Environ. 2004, 38, 3935–3948. [Google Scholar] [CrossRef]
  10. Gaudry, A.; Moskura, M.; Mariet, C.; Ayrault, S.; Denayer, F.; Bernard, N. Inorganic Pollution in PM10 Particles Collected Over Three French Sites Under Various Influences: Rural Conditions, Traffic and Industry. Water Air Soil Pollut. 2008, 193, 91–106. [Google Scholar] [CrossRef]
  11. Nam, K.M.; Selin, N.E.; Reilly, J.M.; Paltsev, S. Measuring welfare loss caused by air pollution in Europe: ACGE analysis. Energy Policy 2010, 38, 5059–5071. [Google Scholar] [CrossRef] [Green Version]
  12. Karagulian, F.; Belisd, C.A.; Dorab, C.F.C.; Prüss-Ustünb, A.M.; Bonjourb, S.; Adair-Rohanib, H.; Amann, M. Contributions to cities’ ambient particulate matter (PM): A systematic review of local source contributions at global level. Atmos. Environ. 2015, 120, 475–483. [Google Scholar] [CrossRef]
  13. Querol, X.; Alastuey, A.; Rodrıguez, S.; Viana, M.M.; Artınano, B.; Salvador, P.; Mantilla, E.; Garcıa do Santos, S.; Fernandez Patier, R.; de La Rosa, J.; et al. Levels of particulate matter in rural, urban and industrial sites in Spain. Sci. Total Environ. 2004, 334, 359–376. [Google Scholar] [CrossRef] [PubMed]
  14. Glavas, S.D.; Nikolakis, P.; Ambatzoglou, D.; Mihalopoulos, N. Factors affecting the seasonal variation of mass and ionic composition of PM2.5 at a central Mediterranean coastal site. Atmos. Environ. 2008, 42, 5365–5373. [Google Scholar] [CrossRef]
  15. Pérez, N.; Pey, J.; Castillo, S.; Viana, M.; Alastuey, A.; Querol, X. Interpretation of the variability of levels of regional background aerosols in the Western Mediterranean. Sci. Total Environ. 2008, 40, 527–540. [Google Scholar] [CrossRef]
  16. Caseiro, A.; Bauer, H.; Schmidl, C.; Puxbaum, H. Wood burning impact on PM10 in three Austrian regions. Atmos. Environ. 2009, 43, 2186–2195. [Google Scholar] [CrossRef]
  17. Maenhaut, W.; Vermeylen, R.; Claeys, M.; Vercauteren, J.; Matheeussen, C.; Roekens, E. Assessment of the contribution from wood burning to the PM10 aerosol in Flanders, Belgium. Sci. Total Environ. 2012, 437, 226–236. [Google Scholar] [CrossRef]
  18. Grange, S.K.; Salmond, J.A.; Trompetter, W.J.; Davy, P.K.; Ancelet, T. Effect of atmospheric stability on the impact of domestic wood combustion to air quality of a small urban township in Winter. Atmos. Environ. 2013, 70, 28–38. [Google Scholar] [CrossRef]
  19. Massey, D.D.; Kulshrestha, A.; Taneja, A. Particulate matter concentrations and their related metal toxicity in rural residential environment of semi-arid region of India. Atmos. Environ. 2013, 67, 278–286. [Google Scholar] [CrossRef]
  20. Khoshsima, M.; Ahmadi-Givi, F.; Bidokhti, A.A.; Sabetghadam, S. Impact of meteorological parameters on relation between aerosol optical indices and air pollution in a sub-urban area. J. Aerosol Sci. 2014, 68, 46–57. [Google Scholar] [CrossRef]
  21. Błaszczyk, B.; Rogula-Kozłowska, W.; Klejnowski, K.; Kubiesa, P.; Fulara, F. Indoor air quality in urban and rural kindergartens: Short-term studies in Silesia, Poland. Air Qual. Atmos. Health 2017, 10, 1207–1220. [Google Scholar] [CrossRef] [PubMed] [Green Version]
  22. Branis, M.; Domasova, M. PM10 and black smoke in a small settlement: Case study from the Czech Republic. Atmos. Environ. 2003, 37, 83–92. [Google Scholar] [CrossRef]
  23. Branis, M.; Domasova, M.; Rezacova, P. Particulate air pollution in a small settlement: The effect of local heating. J. Apgeochem. 2007, 22, 1255–1264. [Google Scholar] [CrossRef]
  24. Olszowski, T.; Tomaszewska, B.; Góralna-Włodarczyk, K. Air quality in non-industrialised area in the typical Polish countryside based on measurements of selected pollutants in immission and deposition phase. Atmos. Environ. 2012, 50, 139–147. [Google Scholar] [CrossRef]
  25. Stala-Szlugaj, K. Analysis of the municipal and housing hard coal consumers sector. Energy Policy J. 2017, 20, 117–134. (In Polish) [Google Scholar]
  26. KOBIZE. The National Centre For Emissions Management. Poland’s Informative Inventory Report. 2019. Available online: https://www.kobize.pl/uploads/materialy/materialy_do_pobrania/krajowa_inwentaryzacja_emisji/IIR_2019_Poland.pdf (accessed on 22 November 2019).
  27. Khedairia, S.; Khadir, M.T. Impact of clustered meteorological parameters on air pollutants concentrations in the region of Annaba, Algeria. Atmos. Res. 2012, 113, 89–101. [Google Scholar] [CrossRef]
  28. Robinson, D.L.; Monro, J.M.; Campbell, E.A. Spatial variability and population exposure to PM2.5 pollution from woodsmoke in a New South Wales country town. Atmos. Environ. 2007, 41, 5464–5478. [Google Scholar] [CrossRef]
  29. Sałach, K.; Lewandowski, P. Measurement of Energy Poverty Based on BBGD data—Methodology and Application. IBS Research Report 2018. Available online: http://ibs.org.pl//app/uploads/2018/02/IBS_Research_Report_pl_01_2018.pdf (accessed on 21 November 2019). (In Polish).
  30. Pyta, H.; Rogula-Kozłowska, W.; Mathews, B. Co-occurrence of PM2.5-bound mercury and carbon in rural areas affected by coal combustion. Atmos. Pollut. Res. 2017, 8, 127–135. [Google Scholar] [CrossRef]
  31. Connan, O.; Maro, D.; Hébert, D.; Roupsard, P.; Goujon, R.; Letellie, B. Wet and dry deposition of particles associated metals (Cd, Pb, Zn, Ni, Hg) in a rural wetland site, Marais Vernier, France. Atmos. Environ. 2013, 67, 394–403. [Google Scholar] [CrossRef]
  32. Castro, A.; Alonso-Blanco, E.; González-Colino, M.; Calvo, A.; Fernández-Raga, M.; Fraile, R. Aerosol size distribution in precipitation events in León, Spain. Atmos. Res. 2010, 96, 421–435. [Google Scholar] [CrossRef]
  33. Hazenkamp-von Arx, M.E.; Fellmann, T.G.; Oglesby, L.; Ackermann Liebrich, U.; Poli, A.; Ponzio, M.; Soon, A.; Vermeire, P.; Künzli, N. PM2.5 Assessment in 21 European Study Centers of ECRHS II: Method and First Winter Results. J. Air Waste Manag. 2003, 53, 617–628. [Google Scholar] [CrossRef] [Green Version]
  34. Rogula-Kozłowska, W.; Klejnowski, K.; Rogula-Kopiec, P.; Mathews, B.; Szopa, S. A Study on the Seasonal Mass Closure of Ambient Fine and Coarse Dusts in Zabrze, Poland. Bull. Environ. Contam. Toxicol. 2012, 88, 722–729. [Google Scholar] [CrossRef]
  35. Sillanpää, M.; Hillamo, R.; Saarikoski, S.; Frey, A.; Pennanen, A.; Makkonen, U.; Spolnik, Z.; Van Grieken, R.; Braniš, M.; Brunekreef, B.; et al. Chemical composition and mass closure of particulate matter at six urban sites in Europe. Atmos. Environ. 2006, 40, 212–223. [Google Scholar] [CrossRef]
  36. Mirante, F.; Salvador, P.; Pio, C.; Alves, C.; Artiñano, B.; Caseiro, A.; Revuelta, M.A. Size fractionated aerosol composition at roadside and background environments in the Madrid urban atmosphere. Atmos. Res. 2014, 138, 278–292. [Google Scholar] [CrossRef]
  37. Polish Chief Inspectorate of Environmental Protection Database. Available online: http://powietrze.gios.gov.pl/pjp/current/station_details/archive/10414 (accessed on 21 November 2019).
  38. Polish Chief Inspectorate of Environmental Protection Database. Available online: http://powietrze.gios.gov.pl/pjp/current/station_details/chart/11279 (accessed on 21 November 2019).
  39. Polish Chief Inspectorate of Environmental Protection Database. Available online: http://powietrze.gios.gov.pl/pjp/current/station_details/chart/853 (accessed on 21 November 2019).
  40. Schwarz, J.; Cusack, M.; Karban, J.; Chalupníčková, E.; Havránek, V.; Smolík, J.; Ždímal, V. PM2.5 chemical composition at a rural background site in Central Europe, including correlation and air mass back trajectory analysis. Atmos. Res. 2016, 176, 108–120. [Google Scholar] [CrossRef]
  41. Ferenczi, Z.; Bozo, L. Effect of the long-range transport on the air quality of greater Budapest area. Int. J. Environ. Pollut. 2017, 62, 407–416. [Google Scholar] [CrossRef]
  42. Olszowski, T.; Bożym, M. Pilot study on using an alternative method of estimating emission of heavy metals from wood combustion. Atmos. Environ. 2014, 94, 22–27. [Google Scholar] [CrossRef]
  43. Rogula-Kozłowska, W.; Klejnowski, K.; Rogula-Kopiec, P.; Ośródka, L.; Krajny, E.; Błaszczyk, B.; Mathews, B. Spatial and seasonal variability of the mass concentration and chemical composition of PM2.5 in Poland. Air Qual. Atmos. Health 2014, 7, 41–58. [Google Scholar] [CrossRef] [Green Version]
  44. Pokorna, P.; Schwarz, J.; Krejci, R.; Swietlicki, E.; Havranek, V.; Zdímal, V. Comparison of PM2.5 chemical composition and sources at a rural background site in Central Europe between 1993/1994/1995 and 2009/2010: Effect of legislative regulations and economic transformation on the air quality. Environ. Pollut. 2018, 241, 841–851. [Google Scholar] [CrossRef]
  45. Voivodeship Fund for Environmental Protection and Water Management in Opole Database. Available online: https://www.wfosigw.opole.pl/aktualnosci/realizacja-programu-ograniczenia-niskiej-emisji (accessed on 22 November 2019).
  46. Trivedi, D.K.; Ali, K.; Beig, G. Impact of meteorological parameters on the development of fine and coarse particles over Delhi. Sci. Total Environ. 2014, 478, 175–183. [Google Scholar] [CrossRef]
  47. Sfetsos, A.; Vlachogiannis, D. A new approach to discovering the causal relationship between meteorological patterns and PM10 exceedances. Atmos. Res. 2010, 98, 500–511. [Google Scholar] [CrossRef]
  48. Jones, A.M.; Harrison, R.M.; Baker, J. The wind speed dependence of the concentrations of airborne particulate matter and NOx. Atmos. Environ. 2010, 44, 1682–1690. [Google Scholar] [CrossRef]
  49. Łowicki, D. Landscape pattern as an indicator of urban air pollution of particulate matter in Poland. Ecol. Indic. 2019, 97, 17–24. [Google Scholar] [CrossRef]
  50. Mues, A.; Manders, A.; Schaap, M.; Kerschbaumer, A.; Stern, R.; Builtjes, P. Impact of the extreme meteorological conditions during the summer 2003 in Europe on particulate matter concentrations. Atmos. Environ. 2012, 55, 377–391. [Google Scholar] [CrossRef]
Figure 1. Location of the experiment sites.
Atmosphere 10 00782 g001
Figure 2. Average daily PM2.5 concentration at S1 and S2. On the left, data for days with steady atmosphere conditions. On the right, data for days with unstable atmosphere conditions. Boxes show the range between the 25th and 75th percentiles. The whiskers extend from the edge of the box to the 5th and 95th percentile of the data. The line inside indicates the median value.
Atmosphere 10 00782 g002
Figure 3. Comparison of PM2.5 concentrations at S1 and S2 during the stable state of the atmosphere and a permanent temperature inversion event: 19 January 2013–28 January 2013. The horizontal line is for indicating the scale of the problem only.
Atmosphere 10 00782 g003
Figure 4. A case of hourly changes in PM2.5 concentration at S1 and S2 under a steady state of the atmosphere.
Atmosphere 10 00782 g004
Figure 5. Comparison of PM2.5 concentration at S1 and S2 during high (morning and evening hrs) and low (nights and middle day hrs) activity of individual heating systems. Results are shown for the stable state of the atmosphere and temperature inversion condition periods.
Atmosphere 10 00782 g005
Table 1. Average fuel consumption (Mg) in the single village household during winter season S1/S2.
SeasonHard CoalEco-CoalWoodPelletsGas
2010/117.2/7.13.4/3.53.1/3.81.79/1.72442/449
2011/126.9/7.03.3/3.52.9/3.21.75/1.83440/446
2012/13no datano datano datano datano data
2013/146.6/6.53.1/3.12.9/3.01.52/1.64436/432
2018/196.4/6.53.0/3.22.8/2.91.35/1.42419/426
Table 2. Meteorological data for Kotórz Mały village. Related to the sampler’s level.
Meteorological RecordsPeriods of Cold Season
12.10–02.1112.11–02.1212.12–02.1312.13–02.1412.18–01.19
Air temperature T (°C)
avg−1.6−1.6−0.7−0.50.8
med−1.5−1.00.00.00.2
max12.08.08.08.012.0
min−21.0−23.0−20.0−19.0−11.0
Wind speed: (m s−1)
avg1.21.91.12.12.3
med0.31.90.51.92.0
max5.14.95.05.36.4
min0.00.00.00.00.0
Atmospheric pressure (h Pa)
avg1004.81003.91003.11001.01003.0
med1003.51004.01003.01001.01002.0
max1029.01032.01030.01026.01043.0
min976.0974.0973.0972.0982.0
Table 3. Average mass concentrations of particulate matter (PM2.5) at selected urban, suburban and rural sites in Europe.
City/Town/Village (Country), Site Type, Averaging Period.PM2.5 (μg·m−3)References
Turin (IT), urban, winter 2003 *69.2[33]
Pavia (IT), urban, winter 2003 *52.6[33]
Antwerp City (BE), urban, winter 2003 *28.3[33]
Barcelona (ES), urban, winter 2003 *31.9[33]
Paris (FR), urban, winter 2003 *21.0[33]
Grenoble (FR), urban, winter 2003 *28.0[33]
Basel (CH), urban, winter 2003 *19.1[33]
Zabrze (PL), urban, winter 200966.8[34]
Prague (CZ), urban, winter 2002–2003 *29.6[35]
Madrid (ES), urban, winter 201113.8[36]
Horyniec-Park (PL), suburban background, winter 201930.3[37]
Rymanów Zdrój (PL), suburban background, winter 201923.2[38]
Złoty Potok (PL), rural background, winter 201924.3[39]
Košetice (CZ), regional background, winter 2009; 201022.5[40]
Zloukovice (CR), rural—inside settlement, heating season 2003 *26.0[23]
Kotórz Mały (PL), rural—inside settlement, winter, 2010–14, 201936.9this MS
* data received before CAFE Directive 2008/50/EC.
Table 4. Relationship between the PM2.5 concentration and meteorological parameters.
Variables/Periods12.10−02.1112.11–02.1212.12–02.1312.13–02.1412.18–01.19
PM2.5T (°C)−0.25 *−0.24 *−0.42 *−0.35 *−0.29 **
PM2.5V (m s−1)−0.41 *−0.43 *−0.34 *−0.52 *−0.34 *
PM2.5P (h Pa)0.40 *0.32 *0.28 * *0.33 *0.31 *
C. c. R –only when PM2.5 concentration was > 40 g m−3 and temp. inversion occurring
PM2.5T (°C)−0.36 *−0.39 *−0.49 *−0.46 *−0.39 **
PM2.5V (m s−1)−0.42 *−0.45 *−0.35 *−0.49 *−0.37 *
PM2.5P (h Pa)0.48 *0.35 *0.32 *0.36 *0.40 *
* statistically significant at p < 0.01; ** statistically significant at p < 0.05.

