Article

Long-Term Aerosol Trends and Variability over Central Saudi Arabia Using Optical Characteristics from Solar Village AERONET Measurements

1
Environment, Health & Safety Support Section, EHSS Department; HADEED/SABIC, Jubail Industrial City 31961, Saudi Arabia
2
Department of Geosciences, College of Petroleum Engineering and Geosciences; King Fahd University of Petroleum & Minerals, Dhahran 31261, Saudi Arabia
3
Department of Physics, College of General Studies, King Fahd University of Petroleum, & Minerals, Dhahran 31261, Saudi Arabia
4
Department of Mathematics and Statistics, College of Science, King Fahd University of Petroleum & Minerals, Dhahran 31261, Saudi Arabia
5
Information & Computer Science Department, King Fahd University of Petroleum & Minerals, Dhahran 31261, Saudi Arabia
6
National Space Science and Technology Center, Department of Geography and Urban Sustainability, College of Humanities and Social Sciences, United Arab Emirates University, Al Ain, Abu Dhabi 15551, UAE
7
School of Life and Environmental Sciences, Schmid College of Science and Technology, Chapman University, Orange, CA 92866, USA
*
Authors to whom correspondence should be addressed.
Atmosphere 2019, 10(12), 752; https://doi.org/10.3390/atmos10120752
Submission received: 21 October 2019 / Revised: 20 November 2019 / Accepted: 26 November 2019 / Published: 28 November 2019
(This article belongs to the Special Issue Atmospheric Aerosol Regional Monitoring)

Abstract

:
Natural and anthropogenic aerosols over the Kingdom of Saudi Arabia (KSA) play a major role in affecting the regional radiation budget. The long-term variability of these aerosols’ physical and optical parameters, including aerosol optical depth (AOD) and Ångström exponent (α), were measured at a location near central KSA using the Solar Village (SV) AERONET (Aerosol Robotic Network) station during the period December 1999–January 2013. The AERONET measurements show an overall increase in AOD on an annual basis. This upward trend is mainly attributed to a prolonged increase in the monthly/seasonal mean AOD during March–June and during August–September. In contrast, lower AOD values were observed during November–December. This can be attributed to a low frequency of dust outbreaks and higher precipitation rates. An overall, weak declining trend in α was observed, except during the summer. The spring and summer seasons experienced a pronounced increase in the number of coarse particles (~2 µm) during April 2006–January 2013 as compared to December 1999–March 2006, suggesting an increase in natural aerosol loadings. Using the HYSPLIT model, it was found that the March 2009 dust storm contributed to the mixing of long-transported dust with anthropogenic local emissions near the SV. The results suggest that extensive industrial activity contributed to the increase of anthropogenic emissions over KSA during the period April 2006–January 2013.

Graphical Abstract

1. Introduction

Atmospheric aerosols play an important role in the earth’s climate through the absorption, diffusion, and scattering of solar radiation, in addition to altering cloud properties [1,2]. Aerosols over the Kingdom of Saudi Arabia (KSA) exhibit strong inter-annual and seasonal variability, which are mainly driven by frequent dust events, industrial emissions, mega-infrastructure, and volatile organic compounds released from ships [3]. The large increase in anthropogenic aerosols over KSA has a significant impact on the regional climate and on human health [4,5].
Detailed aerosol categorization across several Aerosol Robotic Network (AERONET) stations located in the Middle East and North Africa during the period 1995–2015 was investigated in [6]. The dominance of aerosol particles associated with major dust events at different locations over KSA was observed.
Dust storms over KSA are common throughout the year; however, major dust events occur during the cooler months, from February–April [7,8]. Due to a lack of rainfall, the role of precipitation is limited in affecting aerosol characteristics over KSA; however, dust transport and local anthropogenic emissions play a major role in influencing aerosol properties. Moreover, the satellite and ground-based data reveal that the pronounced increase in aerosol loadings is due to the increase in anthropogenic activities over the central and eastern regions of KSA [6,8].
The physical and optical properties of aerosols (aerosol optical depth (AOD), Ångström exponent (α), and the volume size distribution (VSD)) are key parameters in determining the aerosol radiative forcing in the upper atmosphere and near the Earth’s surface. AOD is a dimensionless indicator of the aerosol extinction effect on solar radiation. Meanwhile, α is a parameter that defines how the aerosol optical depth depends on the wavelength. As α is inversely related to the average size of the particles in the aerosol, it is used to represent the size of the aerosol particles, where large α values indicate small-size aerosol particles, which could represent new particle formation and the increase of smoke particles, while small α values characterize larger particles like dust particles [9]. The parameter α has also been used to categorize aerosols based on their type and size [10,11], and is considered to be a direct indicator of the size of aerosols in the atmosphere. For example, α ≤ 1 indicates that the air is mainly dominated by aerosol particles with an effective radius r > 0.5 μm [9]. These aerosol particles usually originate from desert dust or sea-spray. VSD provides detailed size distribution and aerosol optical properties in the total atmospheric column [12]. The spatial and temporal variability in aerosol parameters are controlled by the type of sources (e.g., sea salt, biomass, dust, volcanic eruptions, or biogenic characteristics) and the aerosol processing (e.g., hydration, condensation, gas-to-particle conversion, or coagulation). Among many factors that could lead to aerosol deposition, precipitation (wet deposition) and gravitational settling (dry deposition) are the two main dynamics that could lead to the removal of aerosol mass from the atmosphere. Other factors like coagulation (collision between particles during their Brownian motion) and aerosol transport could also lead to the removal of atmospheric aerosol particles. Coagulation could lead to the rapid growth of ultrafine (<0.1 µm diameter size range) to fine (0.1–1.0 µm diameter size range) aerosol particles. Slower random motion of aerosol particles (>102 µm diameter size range) reduces coagulation rate and large size particles eventually settle. High wind speeds cause aerosol particle transport and dispersion. Particles larger than 103 µm usually have short atmospheric lifetimes, as they are not easily lifted by the wind. The time aerosol particles spend in the atmosphere and the rate of the deposition process depends on the aerosol’s physical and chemical properties and meteorological conditions. The study of the optical properties, size distribution, and the long-term variability of aerosols is important in understanding concentration, dynamics, and climate implications [12].
The petrochemical, cement, and fertilizer industries, together with infrastructure, energy demands, and water desalination plants make significant contributions to anthropogenic particle emissions across KSA. At the height of summer and the beginning of the fall, the temperatures and humidity over KSA increase the electric energy demand [3], enhancing fine-mode pollutants. The electricity consumption in KSA has increased from ~107, 131, 231 MWh (Mega Watt Hour) in the year 1999 to ~256, 687, 605 MWh in the year 2013 [13]; while only two new plants were added to the KSA water desalination network during 1999–2006, although four additional plants were constructed during 2006–2013 [14]. Moreover, in KSA, the population has increased from ~19, 882, 458 in the year 1999 to ~29, 944, 476 in the year 2013 [15] and the estimated number of registered motor vehicles increased from 200,000 to 705,000 vehicles during the same period.
The Solar Village (SV) AERONET station located in central KSA (24.907° N, 46.397° E) (Figure 1a) has been operational since December 1999 and, for the first time, we present long-term trends in aerosol variability over central KSA during December 1999–January 2013, as observed by the SV.
Although data from the SV station is available up to December 2015, the study period was selected based on the availability of high quality measurements at the SV station. The trends in the long-term variability of the aerosol optical parameters, including AOD and α, are studied using the available SV measurements during the study period. Aerosol properties for two independent periods (S1: December 1999–March 2006; S2: April 2006–January 2013) are also characterized in order to investigate the statistical changes in the aerosol properties. An analysis of natural versus anthropogenic aerosols is performed using α at two spectral bands (400–870 nm and 380–500 nm), and then compared with the aerosol size distribution data. Finally, the effect of major dust storms like the 11 March 2009 dust outbreak (Figure 1b) on the aerosol characteristics of the SV measurements is studied using the HYSPLIT Model.

2. Materials and Methods
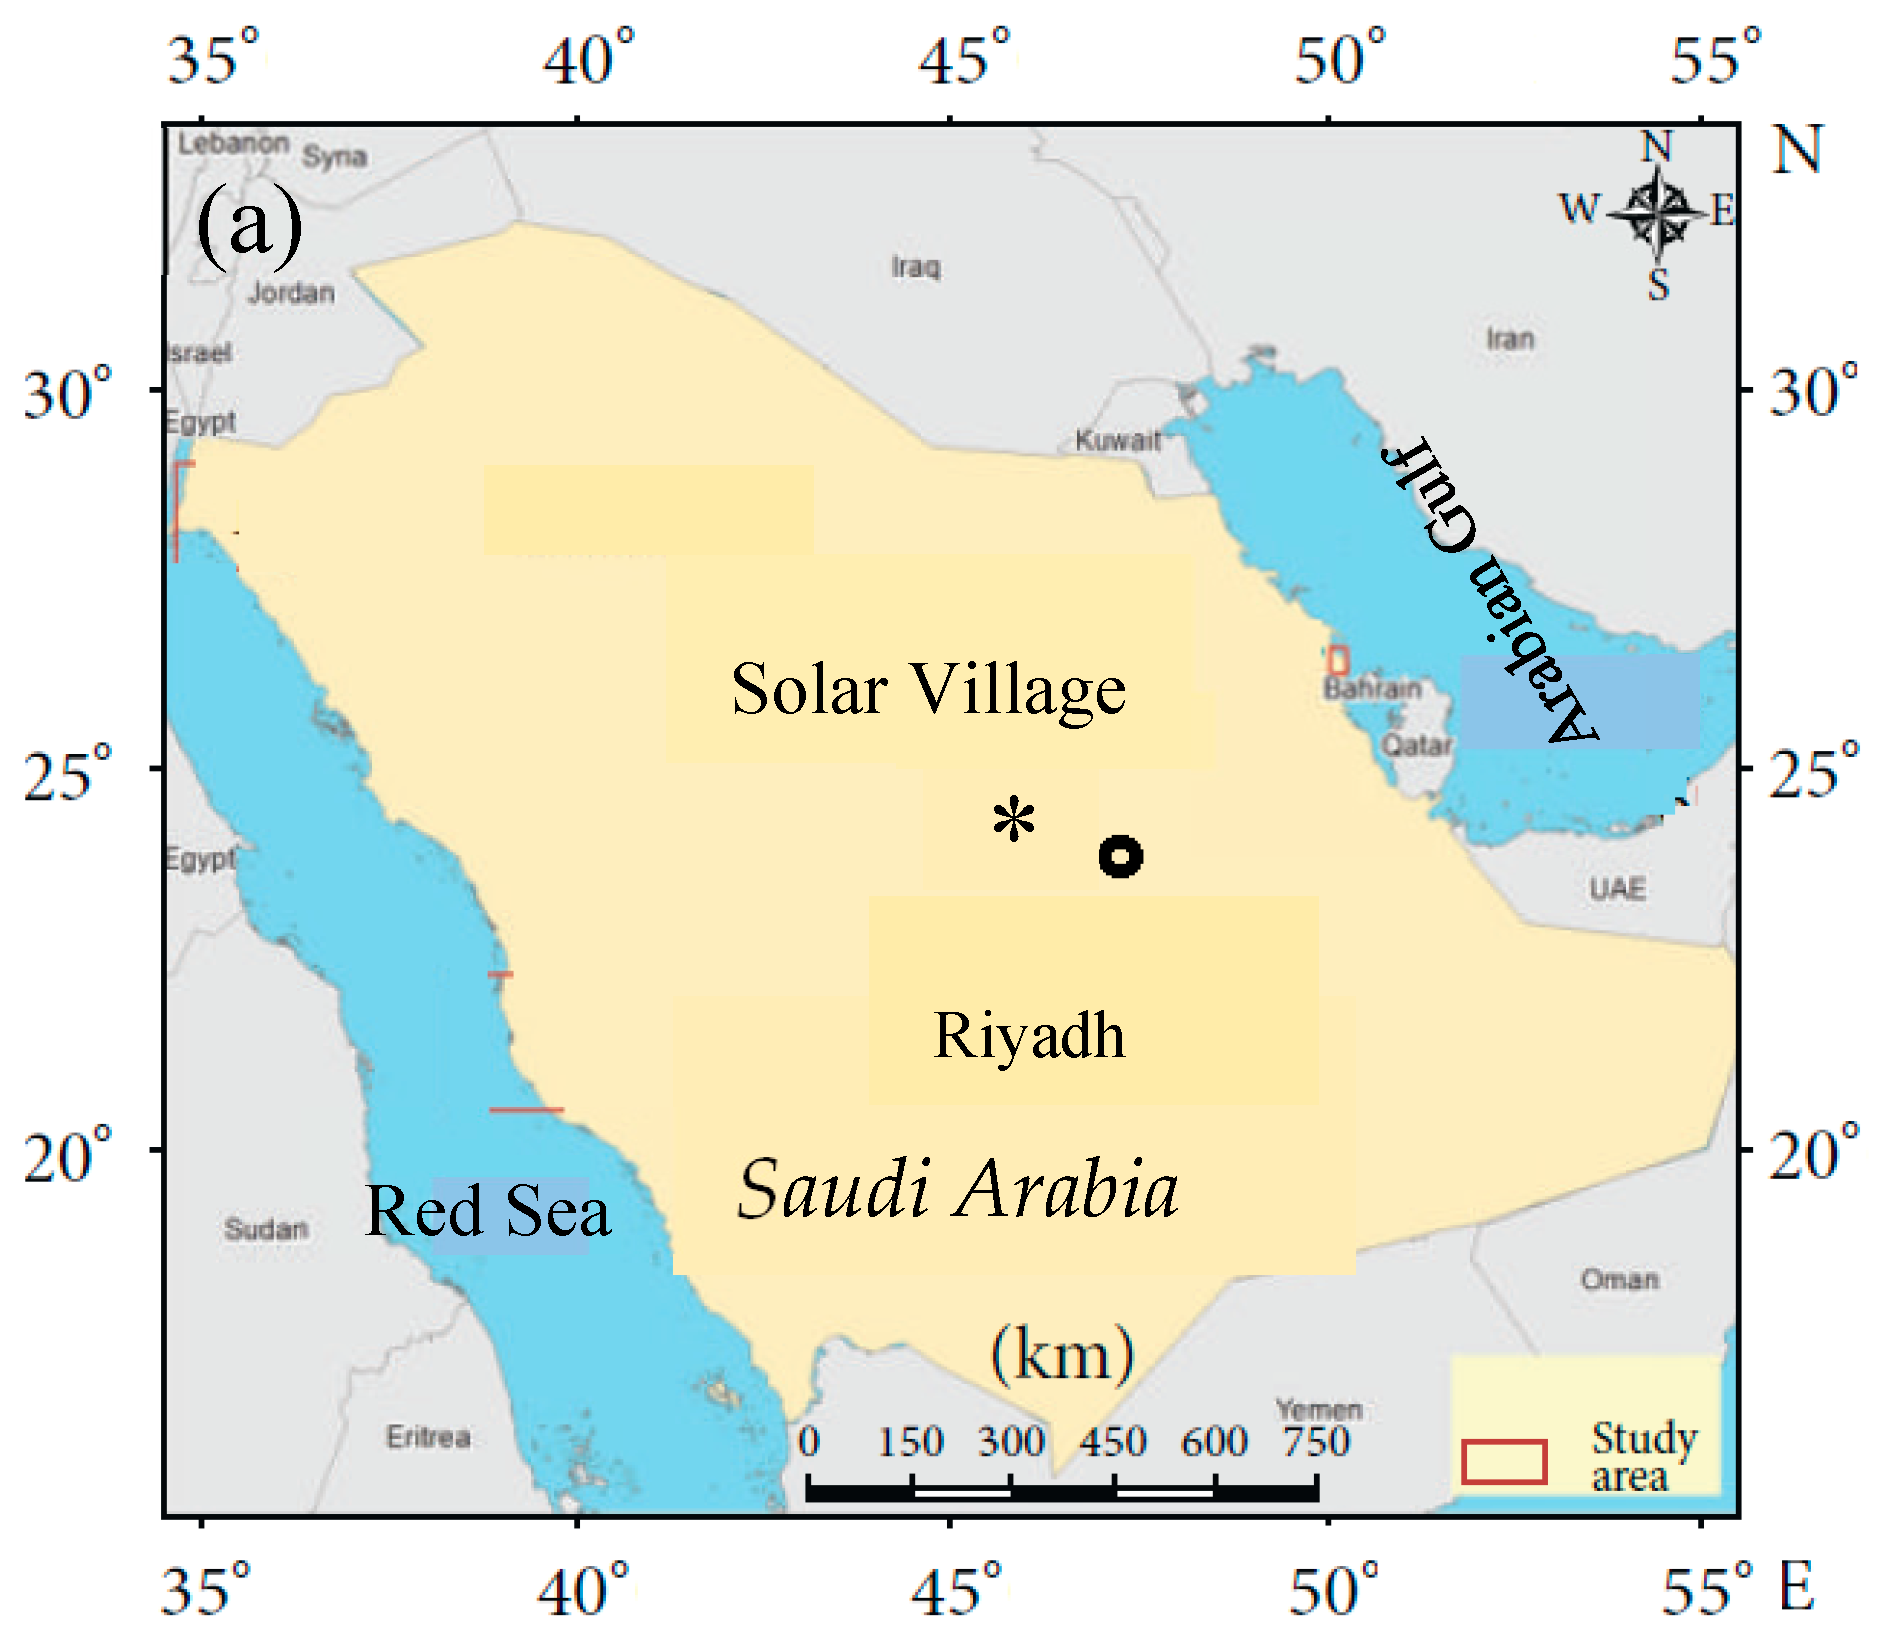
2.1. Study Area

The Kingdom of Saudi Arabia (KSA) (Figure 1a) occupies about 80% of the Arabian Peninsula, with an area of about 2.15 million km2. KSA hosts most of the Empty Quarter (Rub’ Al Khali) desert, one of the largest deserts in the world, with a total area of about 650,000 km2, and the Al-Nefud desert with an area of about 103,600 km2. In general, most of the country can be classified as an arid/semiarid region with a desert climate. Dust storms frequently blow over KSA, resulting in a high loading of aerosols in the atmosphere and affecting daily life activities.
In the past three decades, KSA has witnessed large industrial and infrastructure activities, accompanied by a booming oil industry. For example, the number of factories and industrial units increased from 206 to 7630 from 1974–2018 in KSA [16]. The unprecedented high economic growth and population increase have resulted in negative environmental impacts and a low air quality over KSA.
Central KSA is the most populated region in the country, hosting Riyadh (24.7° N, 46.6° E), the capital city of KSA, with a population of about 6.9 million people as of 2018 (www.stats.gov.sa). Rapid urbanization, industrialization, and heavy traffic increase anthropogenic emission over Riyadh [17]. For instance, air samples collected over Riyadh from September 2011–September 2012 [4] revealed that particulate matter (PM) concentrations were about 3 times higher than World Health Organization (WHO) air quality standards (https://www.who.int/). Moreover, the low precipitation rate during the winter season (Figure 2) creates favorable conditions for dust emission during the spring, which, in turn, enhances the loading of coarse aerosol particles in the atmosphere [18]. Riyadh is located on a desert plateau at about 600 m above sea level, and this results in the city being affected by many of the dust storms frequently blowing over KSA [3].

2.2. AERONET

AERONET is a large network of sun photometers located globally to measure the physical and optical properties of aerosols, with a temporal resolution of 600–900 s and at different wavelengths (340–1640 nm). From the AERONET measurements, water vapor and various aerosol parameters are retrieved at eight wavelengths [19]. AOD is retrieved using an AERONET inversion code, which uses a spectral direct beam and diffuse solar radiation [20]. Furthermore, fine- and coarse-mode AODs, α, and aerosol volume size distribution (VSD) can also be determined for high aerosol loading conditions with an AOD greater than 0.4 and zenith angles greater than 50° [21]. The AERONET inversion code considers that aerosol particles are homogeneous spheres with a non-fixed index of refraction. The algorithm calculates volume particle size distribution (dV/dln R (µm3/µm2)) for 22 logarithmically equidistant discrete points (Ri) in the range 0.05–15 µm.
In the present study, we used the SV AERONET station (Figure 1a), located about 35 km North West (NW) the city of Riyadh, which has been operational since January 1999 (https://aeronet.gsfc.nasa.gov/). Cloud screened Version 3, Level 2.0 AERONET data retrievals from SV were used, while taking into consideration retrieval uncertainty [22]. We studied seasonal, monthly, and daily variability and analyzed the spectral variations of α and AOD following the approach used by Ångström [23,24,25].
α = dln [ AOD ( λ ) ] dln ( λ )
Equation (1) indicates that α is the negative of the first derivative (or slope) of the AOD (λ) in the logarithmic space [26]. The slope can be used as an indicator for aerosol particle size, where particles with diameter <1 µm are considered as fine-mode particles, while those with particle diameter ≥1 µm are considered as coarse-mode particles [27].
In order to analyze inter-seasonal natural and anthropogenic aerosol particles, we investigated the fine- and coarse-mode trends by examining α at shorter and longer wavelengths. The shorter (380–500 nm) wavelength α characterizes fine-mode aerosols, while coarse-mode aerosols are characterized by longer (400–870 nm) wavelengths [28]. A decrease in α380–500 values indicates an increase in the size of fine-mode particles (large diameter fine-mode), and an increase in α380–500 values indicates a decrease in fine-mode particles’ size (small diameter fine-mode) [29].

2.3. MODIS

The Moderate Resolution Imaging Spectroradiometer (MODIS) instrument on board the Terra (launched December 1999) and Aqua satellites (launched May 2002) provides daily coverage of aerosol properties with spatial resolutions of 250 m in 36 wavelength bands, 0.412–41.2 µm. The Deep Blue (DB) algorithm is used to compute AOD retrievals over land, while the Dark Target (DT) algorithm is used over water. Only Level-2 Collection 6.1 of the Deep Blue algorithm for aerosol retrieval from MODIS was used in the present study. MODIS has a scan rate of 20.3 rev/min (revolution per minute) with swath dimensions of 2330 km × 10 km using 14 spectral band radiance values to calculate atmospheric aerosols and to remove the effect of cloud shadow [30]. With its high radiometric sensitivity and swath resolution, MODIS retrievals provide information about aerosols’ optical and physical characteristics. The MODIS data are considered through the NASA Giovanni portal (giovanni.gsfc.nasa.gov/giovanni). MODIS Collection 6.1 was used in this study to retrieve MODIS AOD time series data at 550 nm. The DB and DT retrievals include uncertainty of ±(0.15AOD + 0.05) and ±(0.05AOD + 0.03), respectively. This uncertainty is caused by surface reflectance, cloud masking, SSA computational uncertainty, and instrument calibration errors [31].

2.4. HYSPLIT Model

The Hybrid Single Particle Lagrangian Integrated Trajectory (HYSPLIT) model is a computational tool that predicts simple and complex air mass transport and direction. A complete description of the model is available from this website: https://www.arl.noaa.gov/hysplit/hysplit/. Gridded meteorological parameters are used [32] to determine air mass trajectories at specific time intervals.
We computed the HYSPLIT back trajectories to find the origin of air parcels, and their sources and tracks. The model calculation method is a hybrid between the Lagrangian approach and the Eulerian methodology, which uses a fixed three-dimensional mesh as a reference frame to estimate air pollution loadings.

2.5. Methodology

In order to test if a linear trend can be described, linear regression analysis was carried out on annual, monthly, and daily SV AERONET data. Aerosol parameters, including AOD and α (α440–870, α380–500), were collected for the period December 1999–January 2013. During periods of system failure, maintenance, or calibration, some AERONET data were not available. This may have caused some inaccuracies in the data. Thus, we carried out regression analysis to identify the data outliers during the periods with limited data. If the outliers are scarce and closer to the bulk of the data points, the discrepancy between the mean and median monthly trends is reduced.
Daily/monthly/annual mean variation of aerosol parameters represent average percentage (%) increase/decrease of the parameters over a certain period. It can be calculated for a sample N (days, months, years) for any trend of the parameters of interest (AOD, α440–870, and α380–500) using the following equation:
d ( % ) = ( mN d ¯ ) × 100
where d is the parameter, N is the number of valid data points, and m is the slope calculated from the linear regression. Moreover, the statistical p-value and t-test were applied while computing the monthly average values of the aerosol parameters for two sub-periods, S1 and S2, and to find the statistical significance of the difference between the values of the parameters. The probability value (p-value) indicates how likely it is that the difference between the parameter’s values occurred by chance. A small p-value indicates that the result was unlikely to have occurred by chance alone. These results are called statistically significant. The t-test is another statistical tool to check whether the means of the parameters’ measurements, in the two groups S1 and S2, are reliably different from each other. This is done by comparing the variance between the two groups and the variance within each group. A small t-value indicates that the pattern of data in the sample could be produced by random data and the results are not reliable. In order to minimize the randomness in our results, we imposed a 95% confidence level (a two-tailed p-value <0.05) on all data and a t-value >1.

3. Results and Discussion

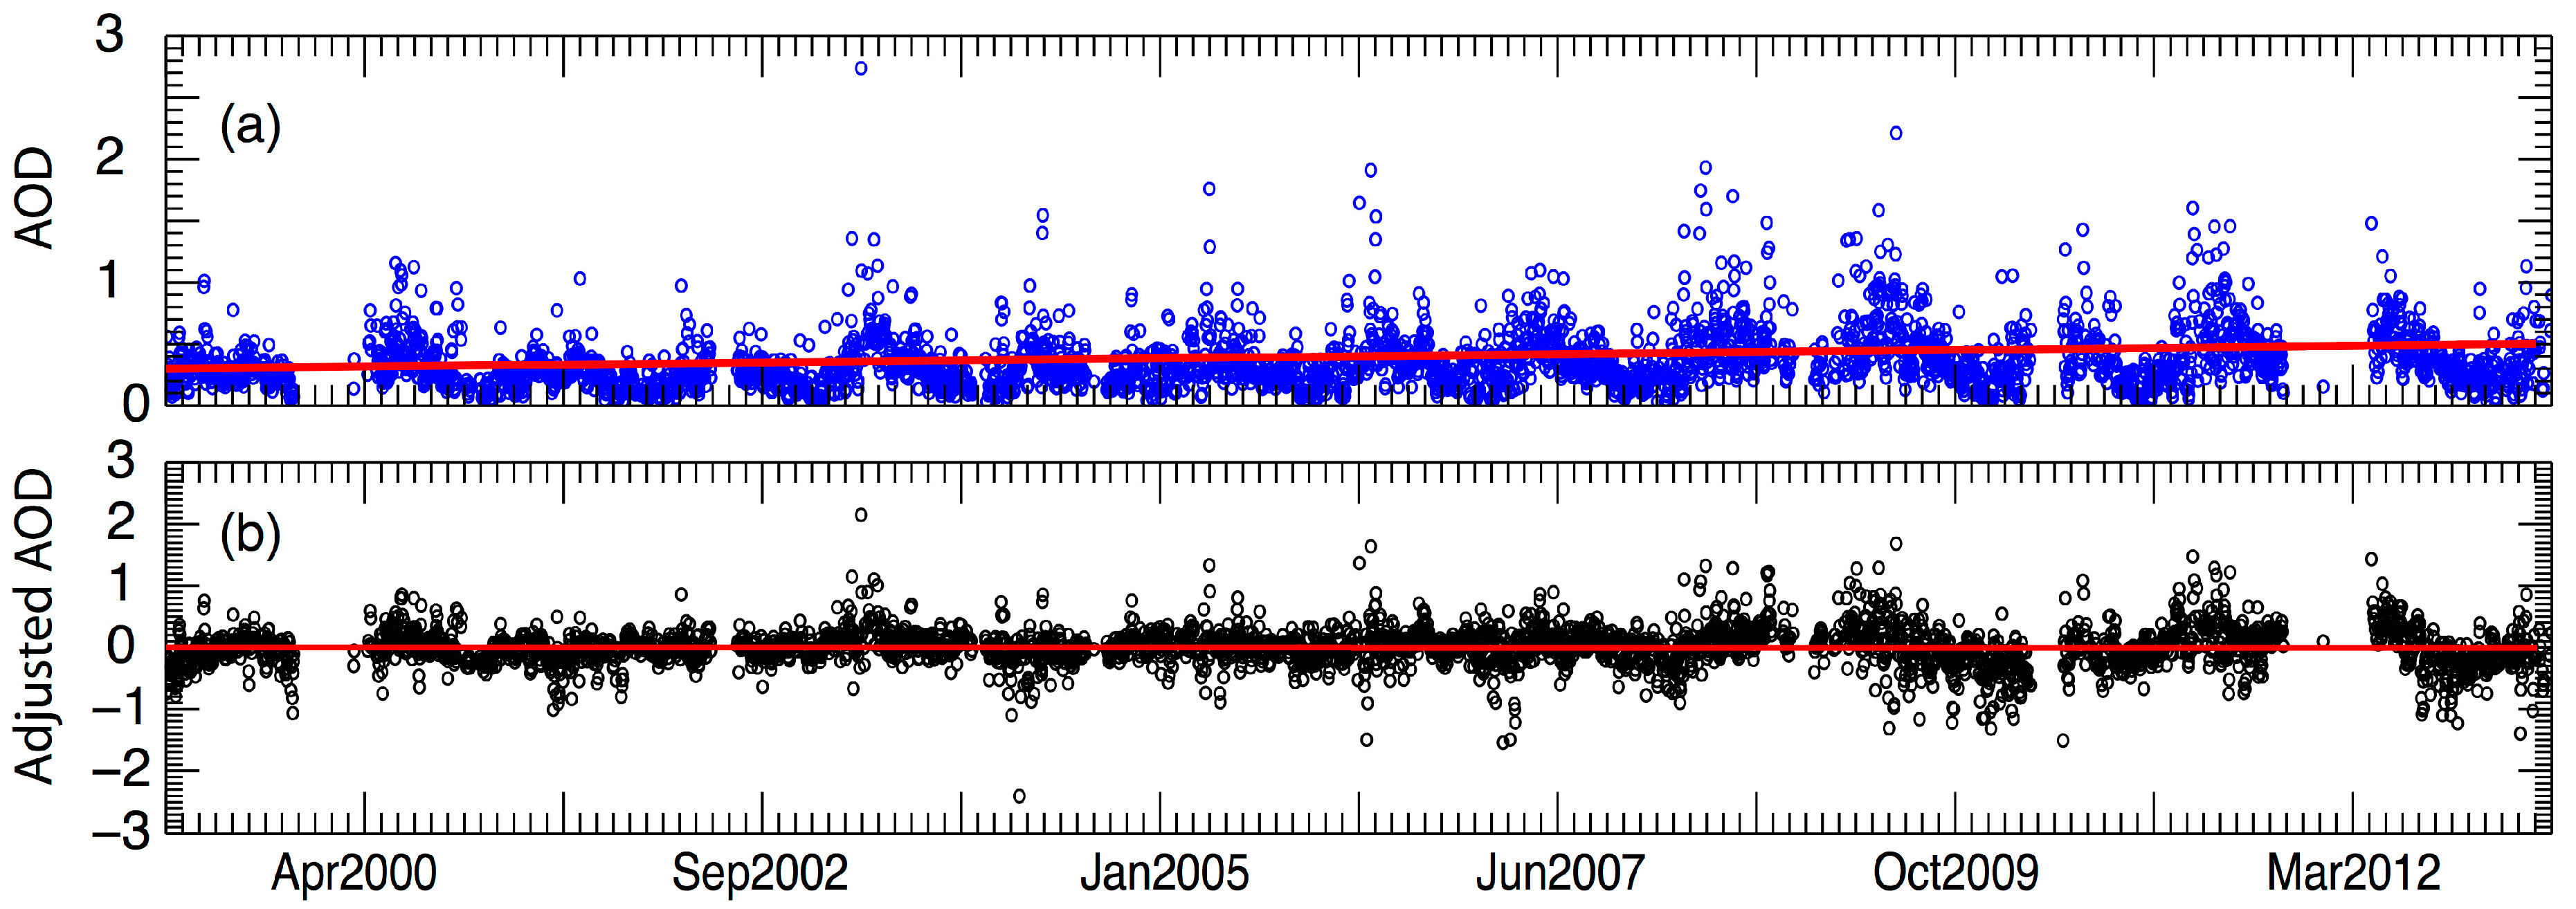
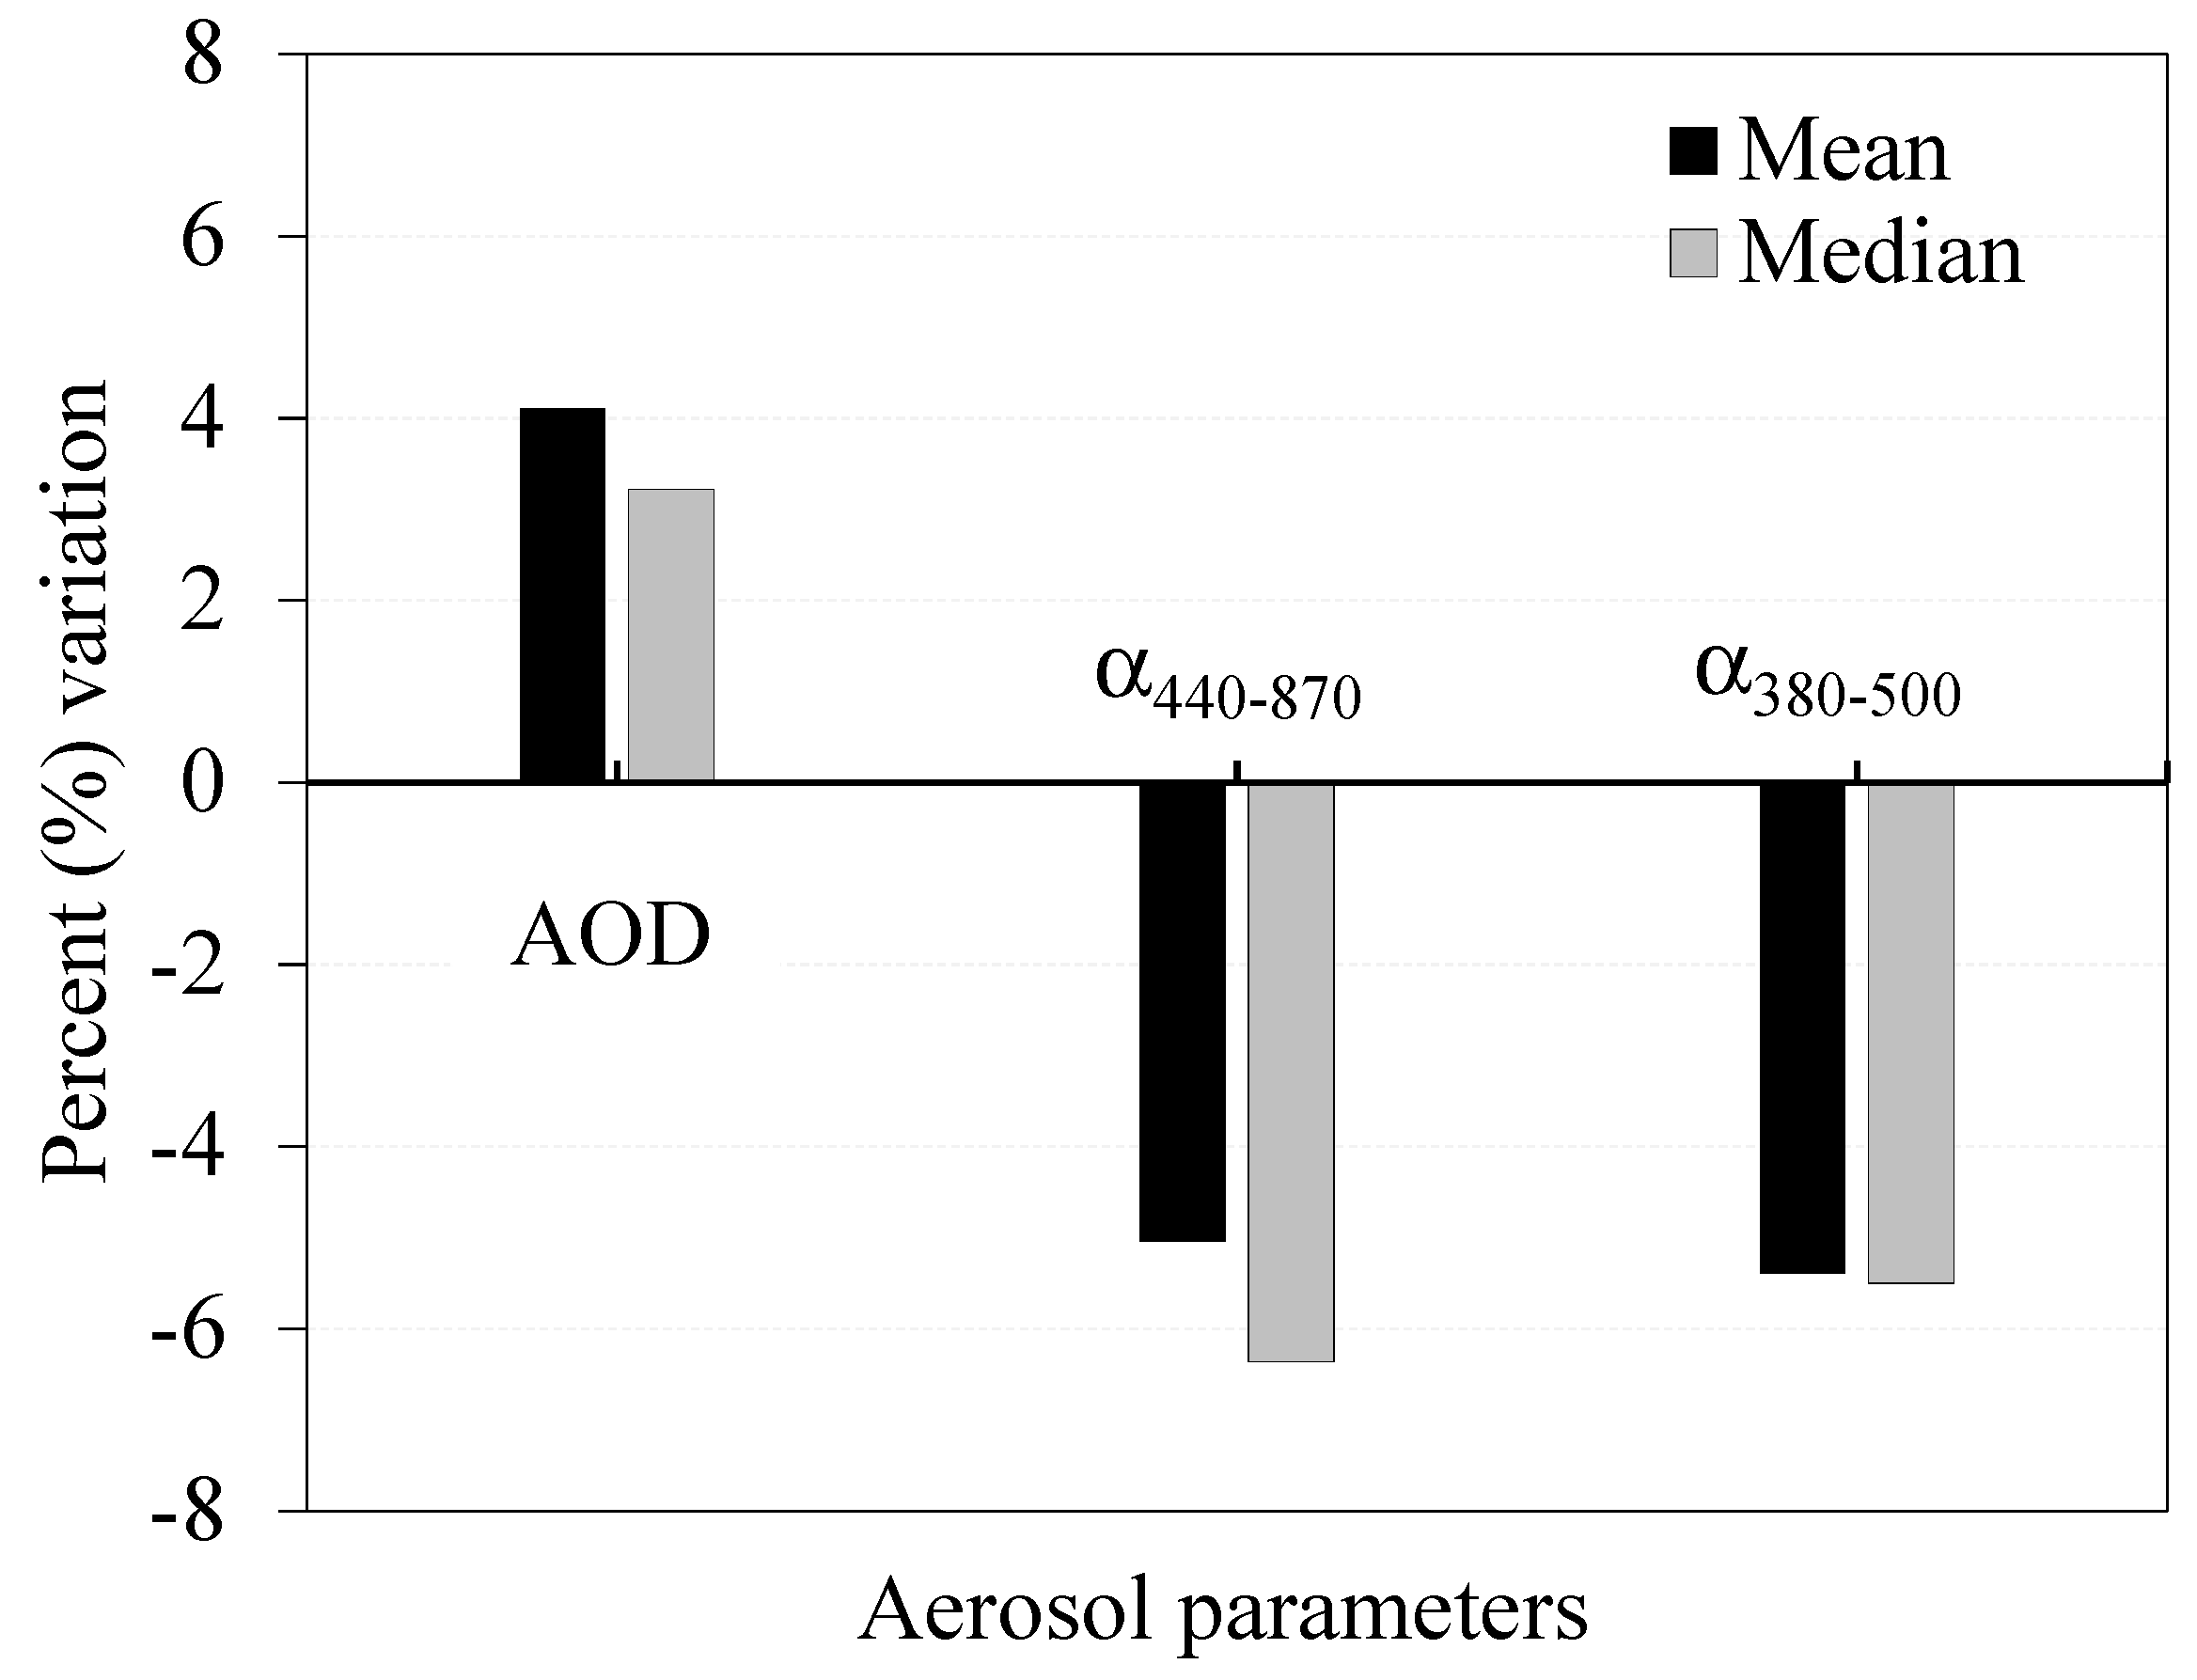
3.1. Variability of Aerosol Parameters During 1999–2013

The daily mean values of AOD (Figure 3a) show about 3918 observed values by SV AERONET for the period December 1999–January 2013, with some missing data during 1999 and 2012 due to technical issues. The results show a large daily and monthly variability in AOD, which is mostly dependent on local meteorological conditions and anthropogenic emissions [33,34]. To remove the influence of seasonal variations, we decomposed the time series and subtracted the inferred periodicity in the data (Figure 3b). A linear regression of the long time series data shows a trend with a very small positive slope (~0), even after removing the influence of seasonal variations (Figure 3b).
Despite the very small linear trend over the years, percent variations (mean and medians) in different seasons can provide important information about aerosol optical parameters. Figure 4 shows the annual percent variations of AOD, α440–870, and α380–500 for the period December 1999–January 2013. We observed an overall increase in AOD (~4%) and a decrease (~5%) in α440–870. AOD variability indicates an increase in aerosol loading, which could be attributed to the increase in the frequency of dust events across KSA and anthropogenic emissions during the last decade [35].
Coarse-mode particles are mainly produced by natural desert dust, but they can also be produced from other sources, including dust stirred up by vehicles on roads and grinding or crushing operation. As for the vast desert area surrounding central KSA, dust particles dominate most of the year over the SV station [6]. Moreover, fine-mode particles can be produced by industrial emissions and smoke particles, but they can also exist during the formation of new aerosol particles. During the past two decades, the oil, petrochemical, and cement industries have boomed in KSA and many studies have pointed to the environmental impacts of industrial emission and low air quality around big cities in KSA [3]. In this study, coarse-mode particles were assumed to be generated from natural sources, while fine-mode particles were assumed to be generated by anthropogenic sources. The decrease in the α440–870 values indicates an increase in anthropogenic particles compared to natural dust. This increase in anthropogenic emissions could be related to infrastructure, industrial activities, and vehicle emissions near Riyadh, the capital of KSA, or it could be transported from other regions in KSA or across its borders [8].
The percent variations were found to be sensitive to yearly, monthly, and daily datasets. For example, a few months with insufficient data samples will influence the inter-annual variations. Monthly median values are good for identifying data outliers, especially for months with limited available daily observations. The small difference (1–3%) between the calculated mean and the median values for AOD, α440–870, and α380–500 (Figure 4) confirms that the computed aerosol variability is not a result of the sampling outliers that originated from the limited data availability for some months.
In order to check the sensitivity of data to observational frequency, we also performed a regression analysis, percent variations, and p-value on a month-by-month basis using the mean and median measurements (Figure 5).
Our detailed analysis shows a general increase in AOD values for all months, with a monthly mean variation of 1–7%, with higher measurements observed during January, March, June, and July (Figure 5). In general, a pronounced decrease in α440–870 values was found during January–April and July, coincidental with high dust activity and the high-temperature dry season over the SV during these months (Figure 5) [4]. The decrease in the α trends observed in the aforementioned months suggests an increase in the coarse-mode natural aerosols, while the lower α values during the June–August months show the dominance of the fine anthropogenic emissions.
A statistically significant decrease in α380–500 was observed for the months January–April that shows a high concentration of large diameter fine-mode particles, which could be attributed to particles’ coagulation or nucleation processes.

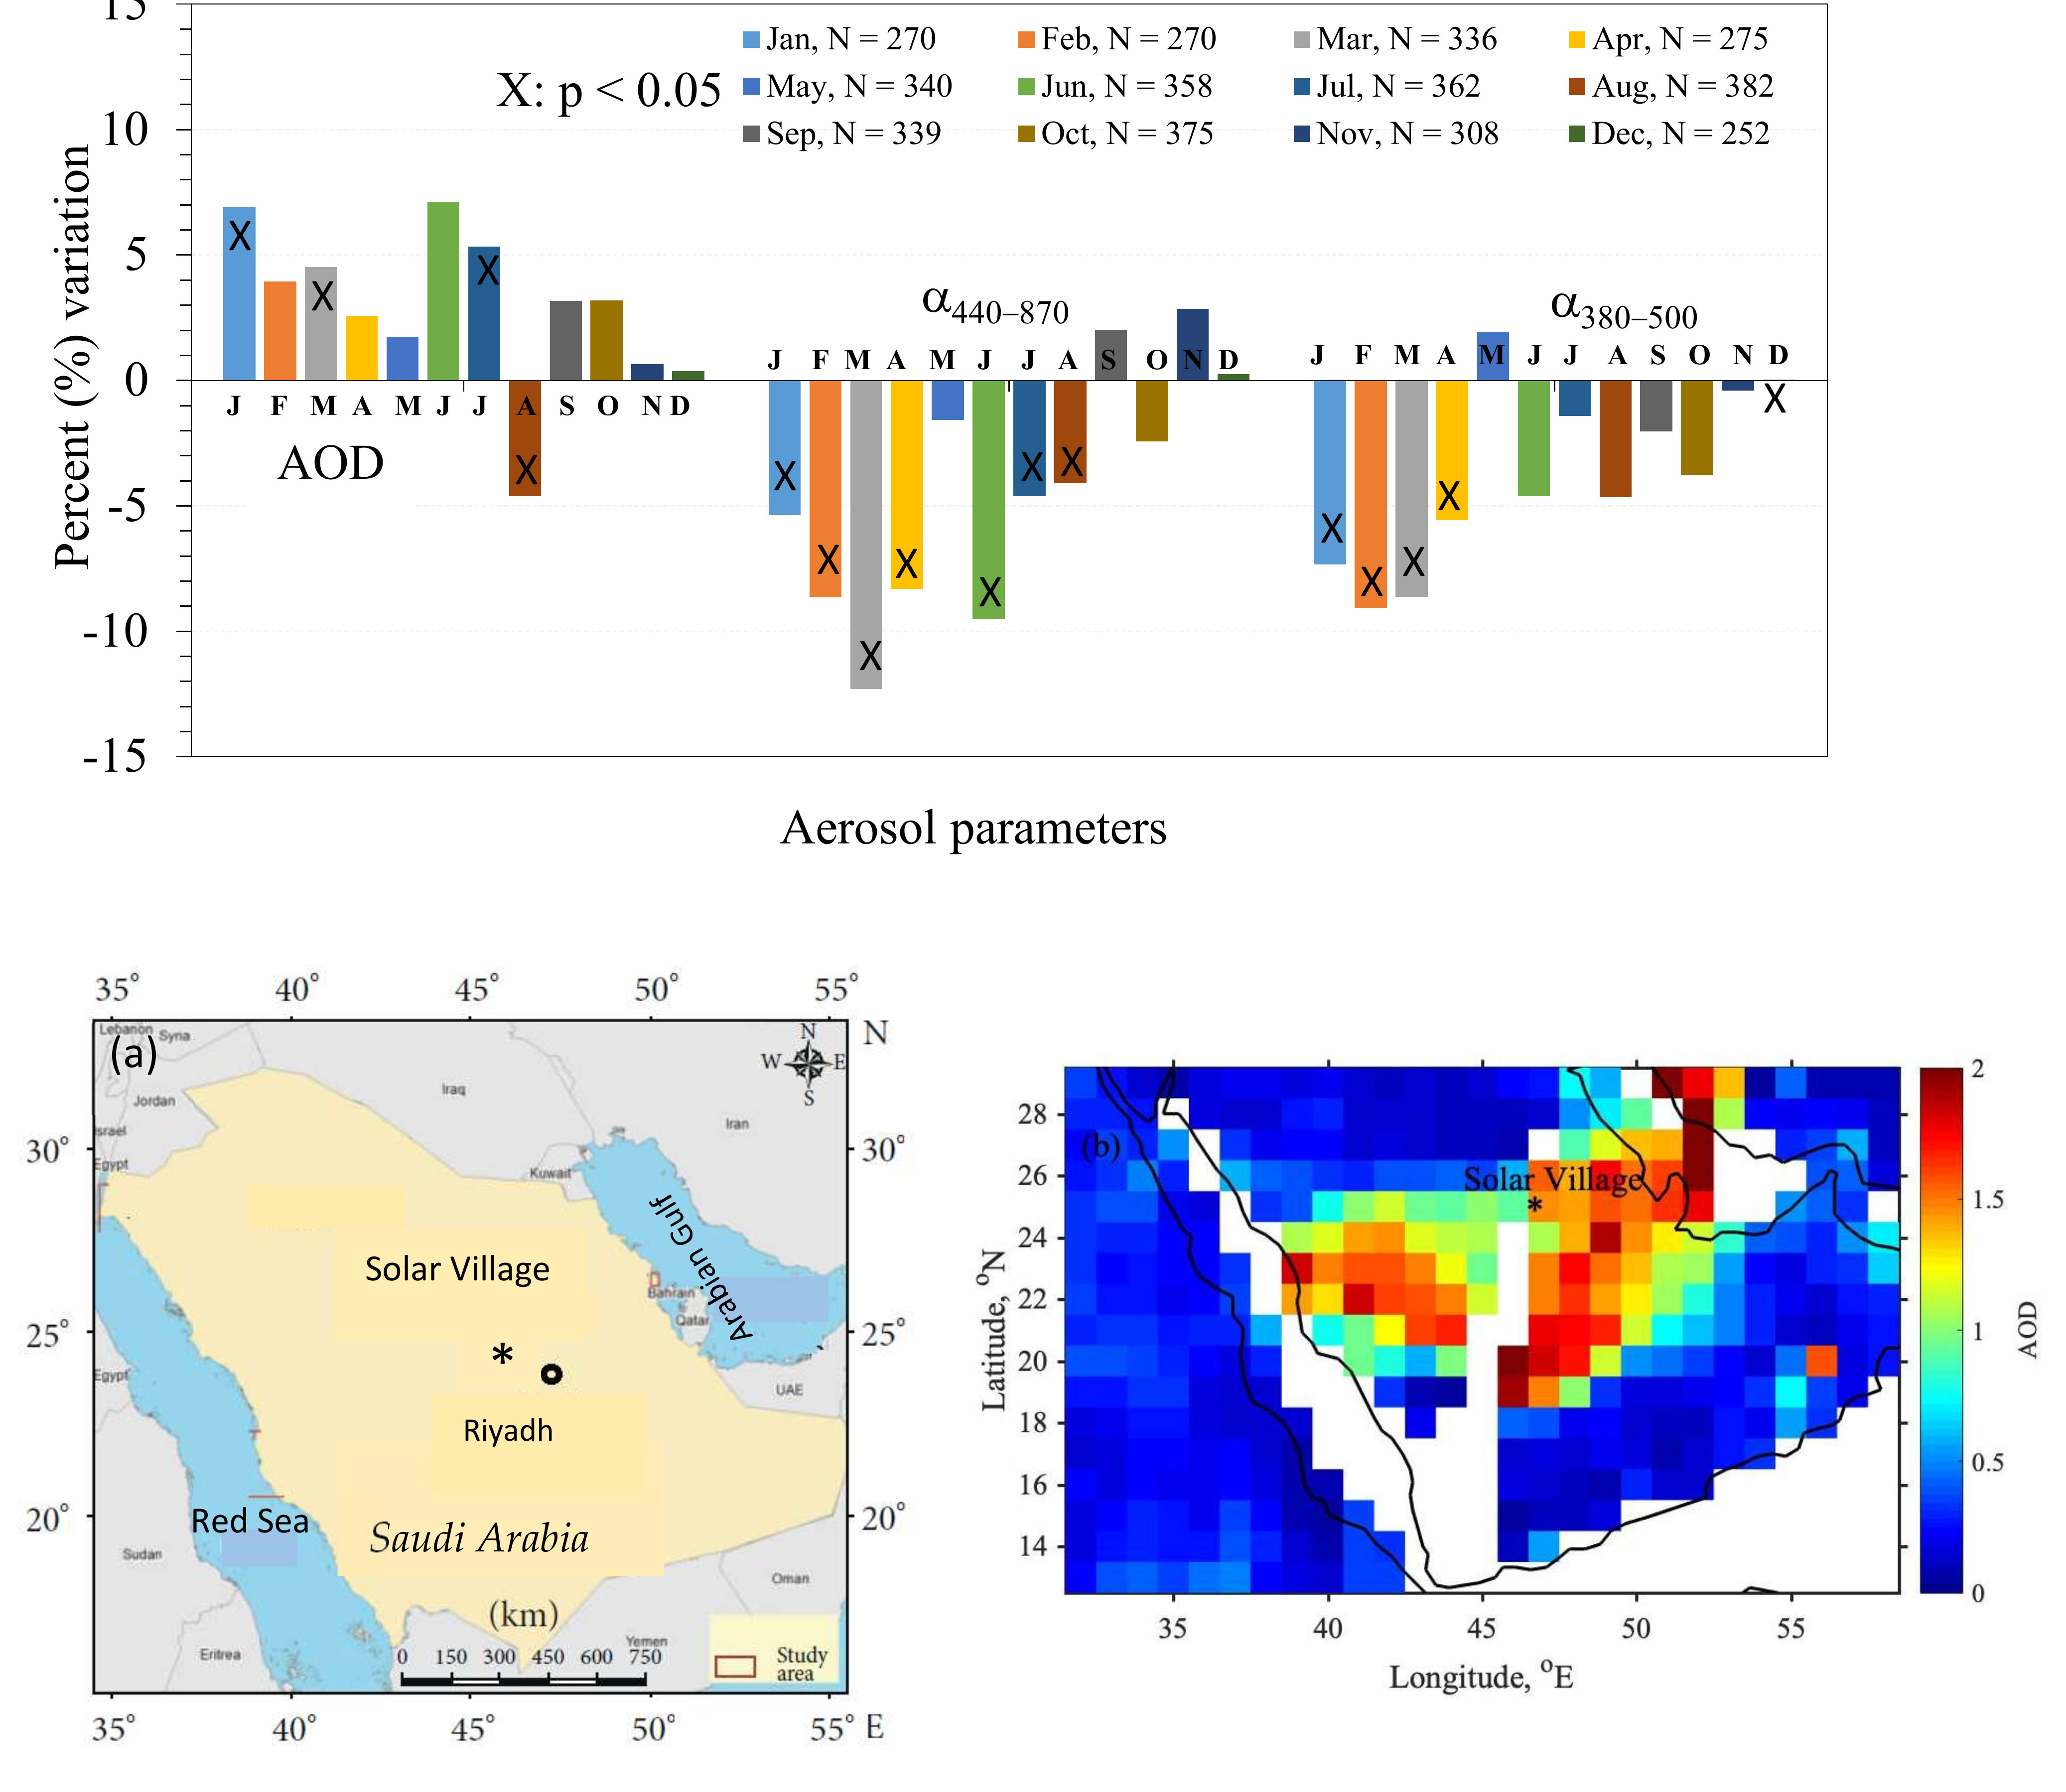
3.2. Monthly and Seasonal Trends

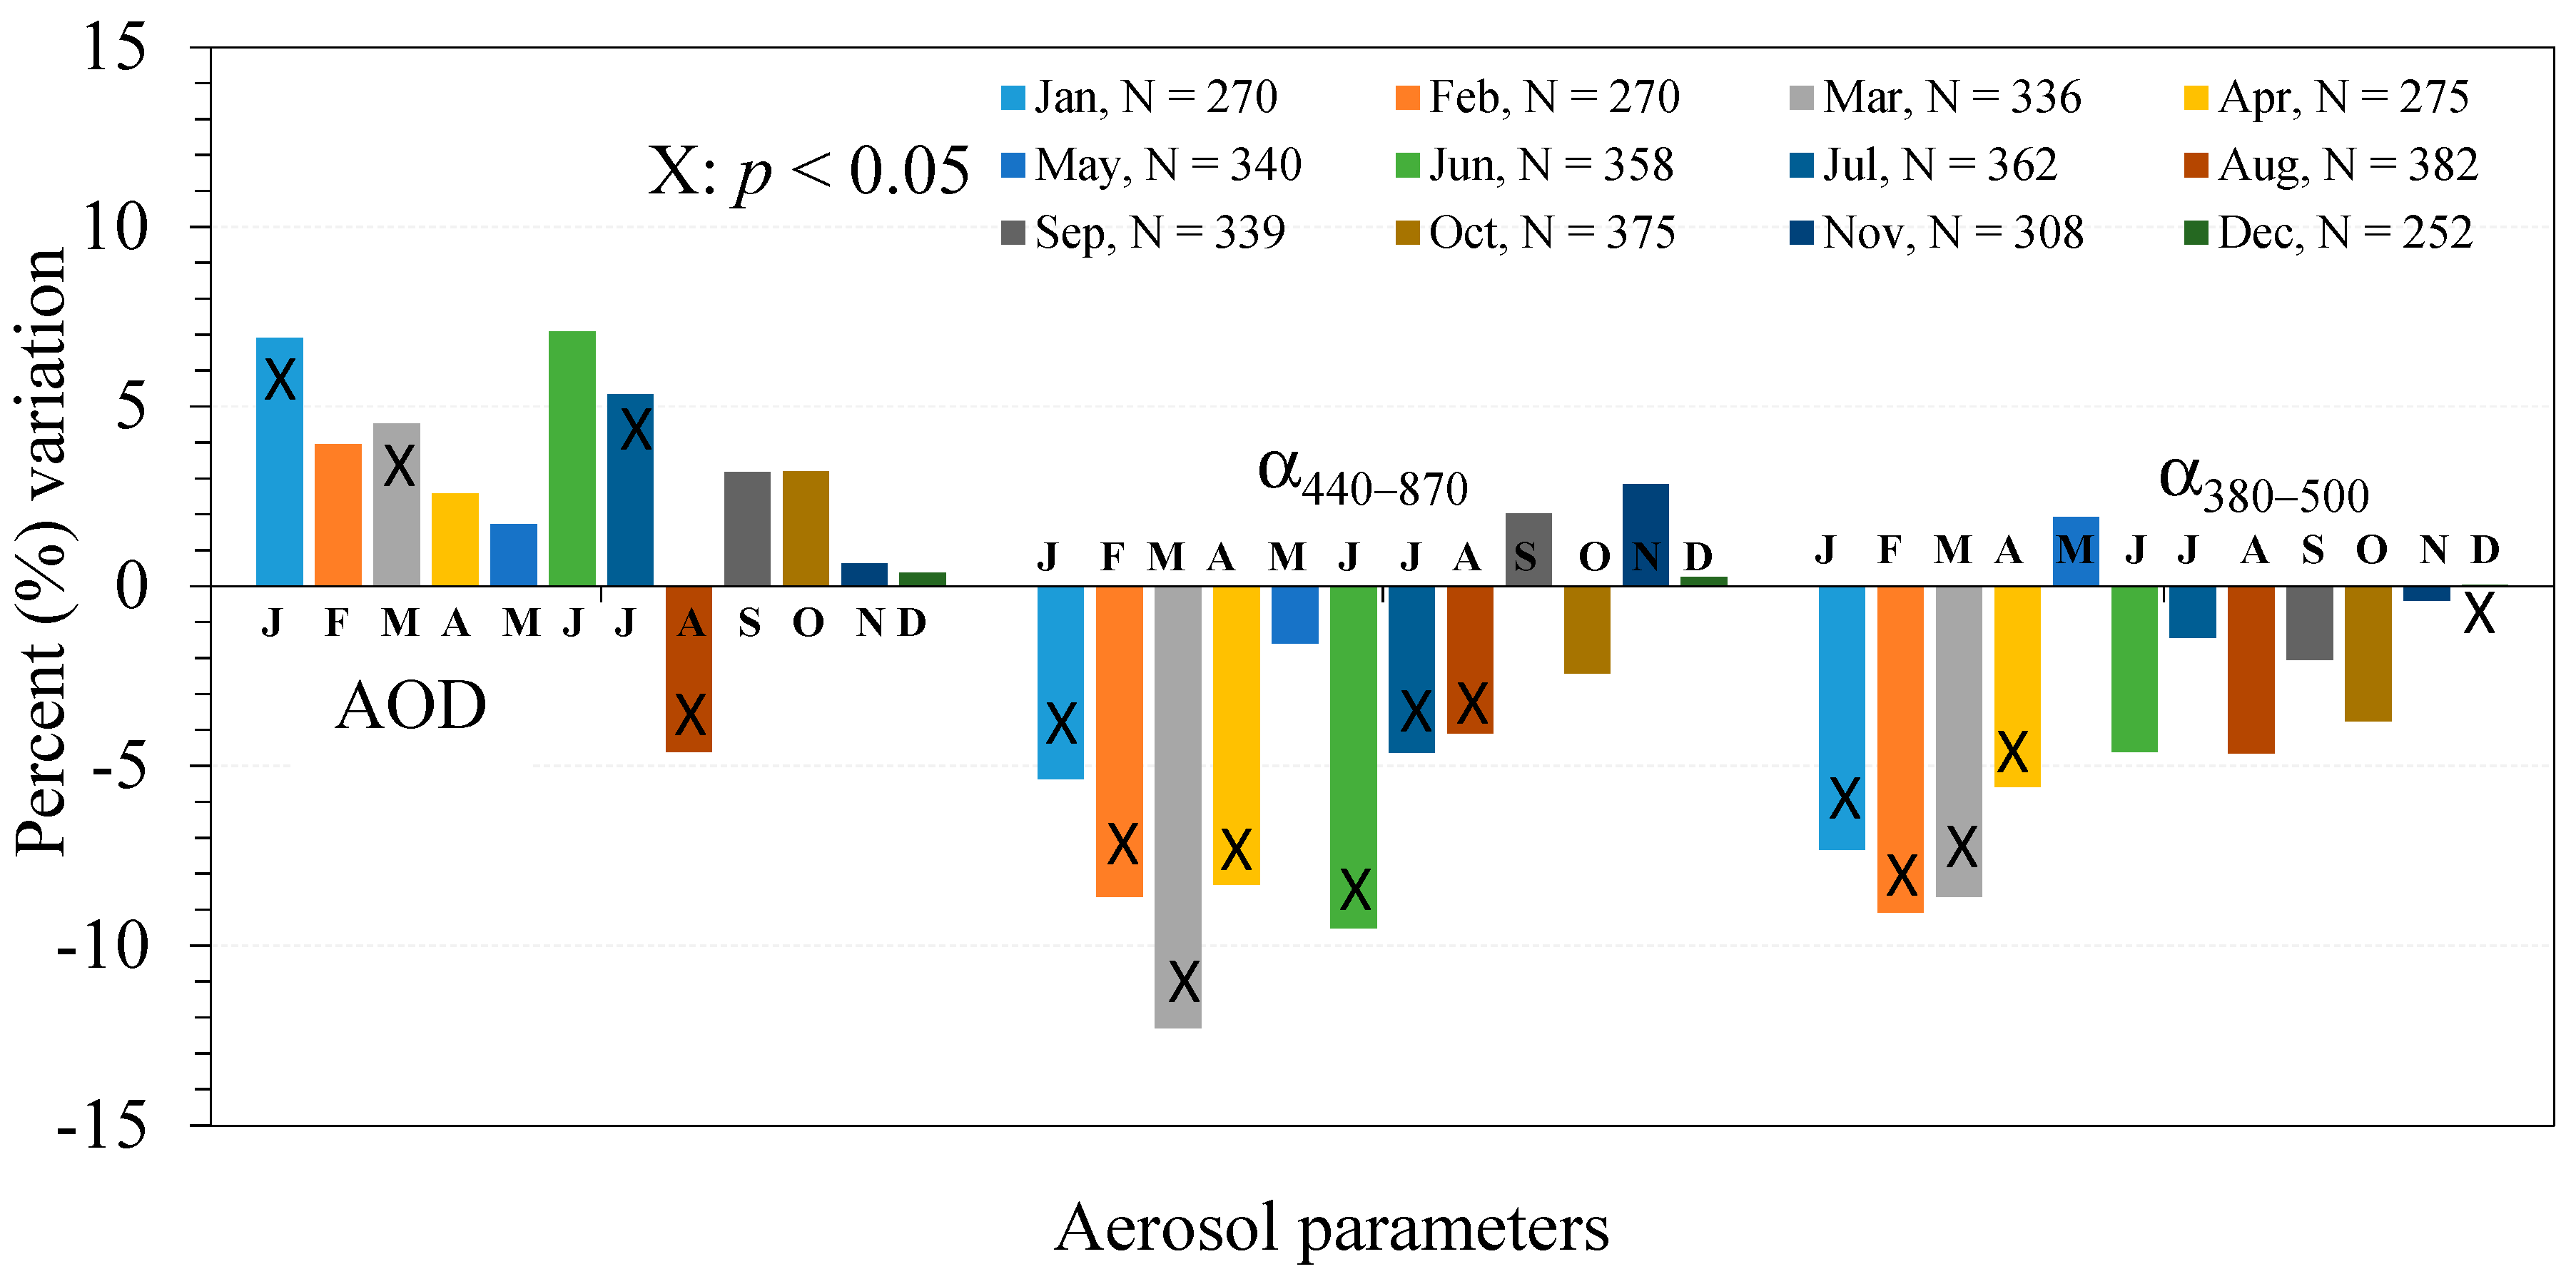
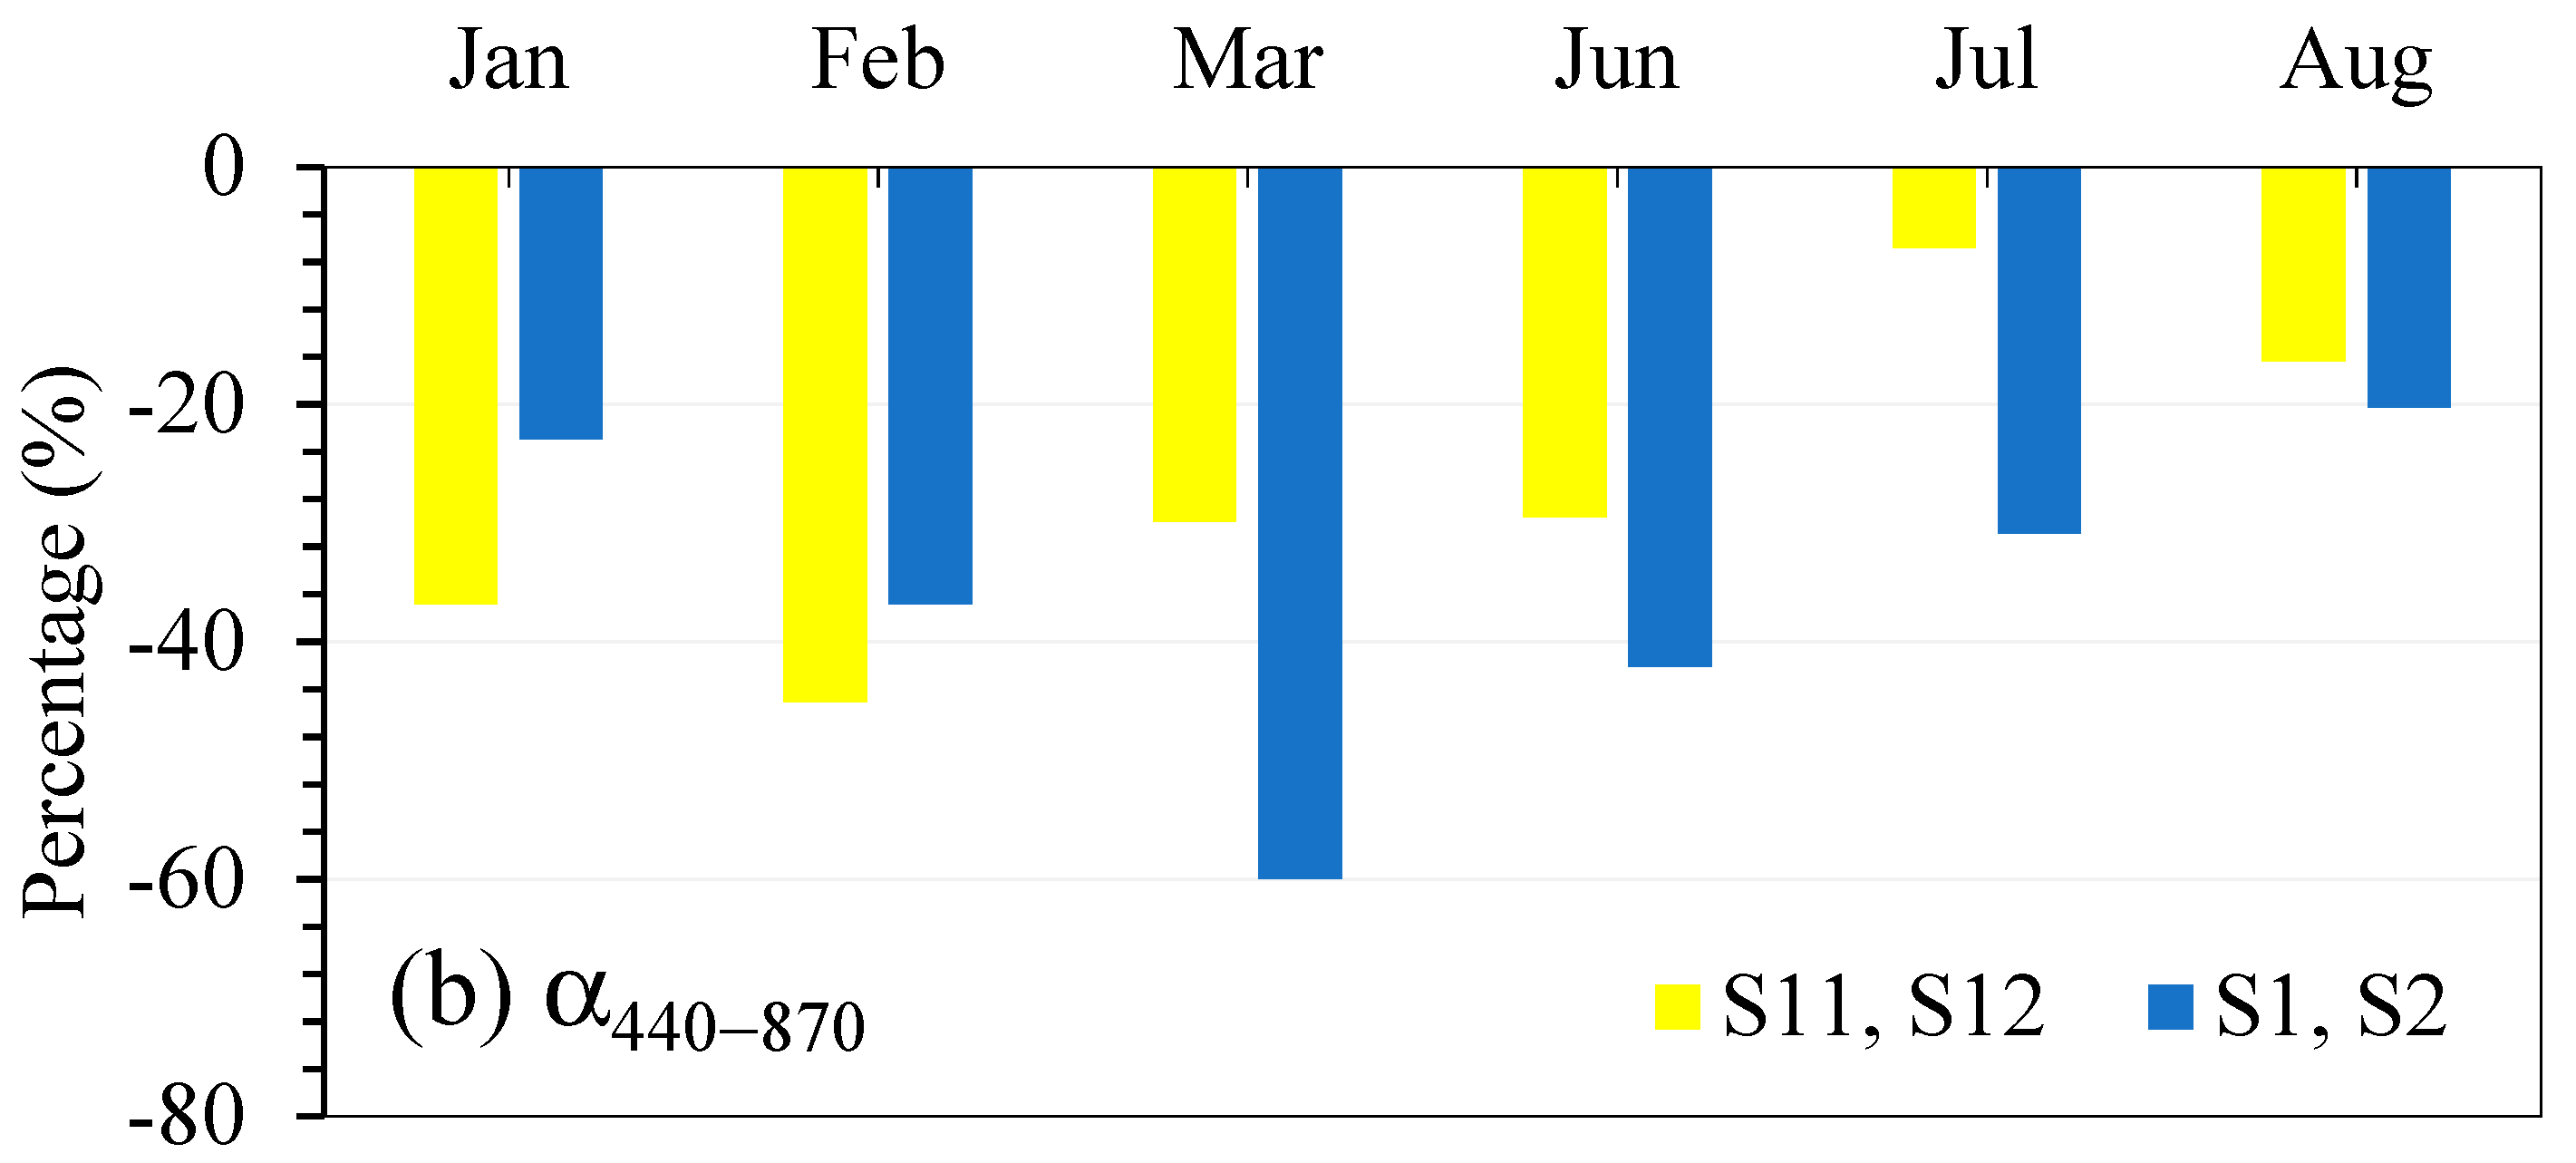
3.2.1. Monthly Trends

Table 1 shows the difference in the monthly average of the aerosol characteristics between the two sub-periods (S1 and S2) with the p- and t-values indicated.
A statistically significant increase in AOD during the study period was observed only during the January–March and June–October months at a 95% confidence level (p < 0.05). A decrease in α values was observed during S2 in all months, except during May and November, where an increase was observed. This increase in α indicates an increase in anthropogenic emissions in May and November during S2 compared to S1. A larger decrease in α values was observed during the months of February, March, and October compared to the rest of the months.
A sensitivity analysis test was performed to confirm the robustness of the results presented in Figure 5 and Table 1 if different years were selected for the two sub-periods S1 and S2. Figure 6 illustrates a comparison of the variability percentage for AOD and α440–870 for the two periods S1 and S2 and two other selected sub-periods, December 1999–December 2002 (S11) and January 2003–December 2006 (S12). The two sub-periods S11 and S12 were selected such that they fall within sub-period S1 and the beginning of sub-period S2. Aerosol parameters during statistically significant months (January, February, March, June, July, and August) were only used in the data selection sensitivity test.
With the exception of α440–870 variability percentage during January and February, it is clear that aerosol parameter variability during the two sub-periods S1 and S2, used in this study, is higher than the other two sub-periods S11 and S12 selected for the sensitivity analysis, which confirms the robustness of our results. Missing aerosol parameter data from the SV AERONET station during January 1999, 2000, and Feb 2000 could have affected mean monthly variability during these two months.

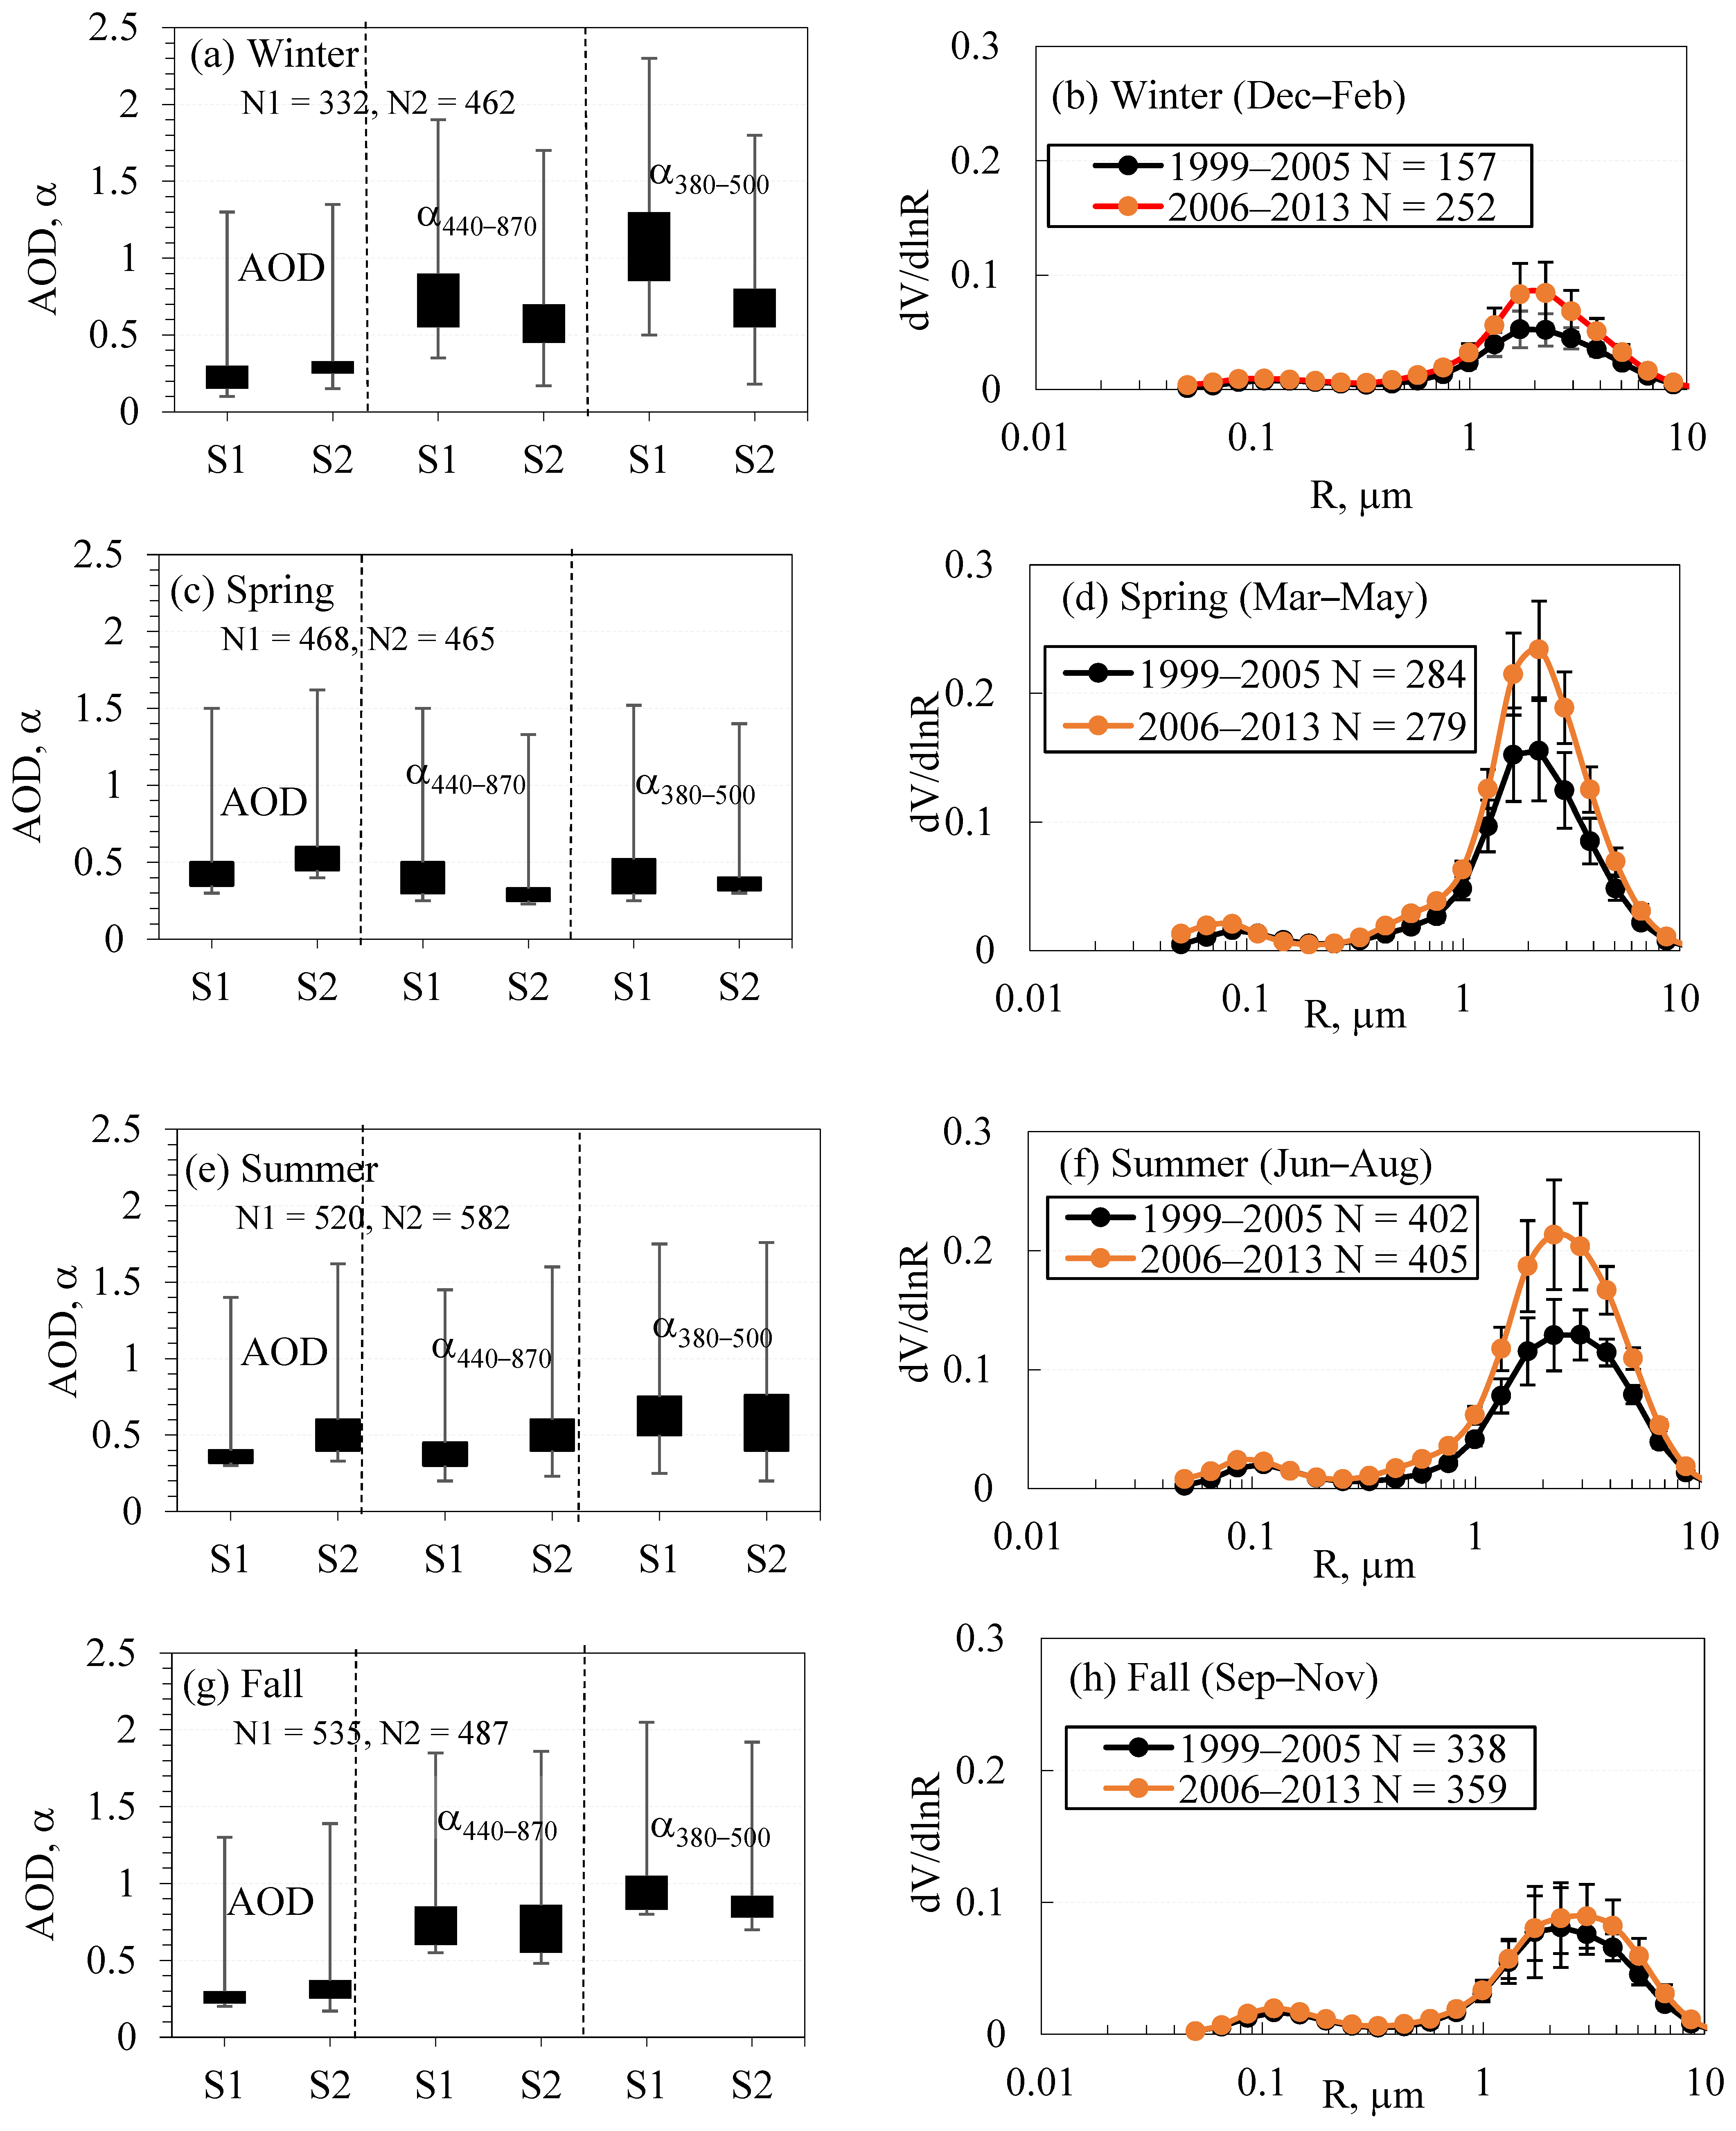
3.2.2. Seasonal Trends

Figure 7 shows a seasonal comparison of the mean values of aerosol measurements (AOD, α440–870, and α380–500,) between the two sub-periods. Moreover, the seasonal effect on particle size distribution during the two sub-periods is illustrated in the aerosol column size distribution (VSD) (Figure 8).
During the winter months (December–February) (Figure 7a), S2 showed higher AOD (0.263 compared to 0.195 in S1), and lower α440–870 (0.596 compared to 0.776 S1) and α380–500 (0.730 compared to 1.044 S1). The statistically significant decrease in the α380–500 values during S2, compared to the earlier period S1, suggests an increase in the size of fine aerosol particles [24].
During winter season of S2, an increase of accumulation-mode fraction and a slight shift towards larger fine-mode diameter values were observed compared to the winter of S1 (Figure 7b), which is consistent with the decrease in α380–500 during S2. The pronounced increase in the dV/dlnR values around 2 µm (coarse particles) were observed during S2, suggesting an increase in natural aerosol particles.
During spring season (March–May), an increase in AOD was observed. This increase is statistically significant in the month of March, but not in the months of April or May (Table 1). Both major and small dust events are frequently observed over KSA during the spring [4], which leads to a large increase in AOD compared to the winter season. During S2, higher AOD (0.502 compared to 0.383 at S1), and lower α440–870 (0.192 compared to 0.321 at S1) and α380–500 (0.282 compared to 0.372 at S1) were observed (Figure 7c).
The VSD shows similar patterns for both sub-periods in the spring season, except for the larger coarse-mode fraction around 2 µm during the S2 period, which leads to the reduction of α440–870 compared to the winter season (Figure 7d).
Variations in aerosol properties during the summer (June–August) (Figure 7e) showed lower AOD values compared to the spring season, with slightly higher AOD observed during S2. The AOD values increased from 0.33 to 0.47 between S1 and S2; meanwhile, α440–870 decreased to 0.37 from 0.57, and α380–500 to 0.54 from 0.63 during S1. The higher AOD observed during S2 was influenced by the statistically significant increase in AOD values during the June–August months. The strong increase in α440–870 values during S2 shows an increase in the anthropogenic emissions during the summer season in KSA [3].
The changes in VSD during the summer (Figure 7f) were similar to those observed during the spring, with a higher proportion of fine-mode particles observed around 0.1 µm.
As per Figure 7g, it was observed that aerosols during the fall season (September–October) are characterized by a low proportion of coarse-mode particles, similar to those observed during the winter season, as observed from the relatively high α values.
A comparison of the AOD and α values shows a slightly higher AOD in the sub-period S2 (0.292) compared to the S1 (0.240), and lower α values for α440–870 (S2: 0.686 compared to S1: 0.738) and α380–500 (S2: 0.886 compared to S1: 0.998).
Similar VSD trends were observed in the two contrasting periods S1 and S2, with a slight increase in the coarse-mode particles larger than 2 µm (Figure 7h). The statistically significant increase in AOD during the month of September is offset by the slight increase in the month of October and a decrease in November, resulting in only small variations in AOD values between the two periods.

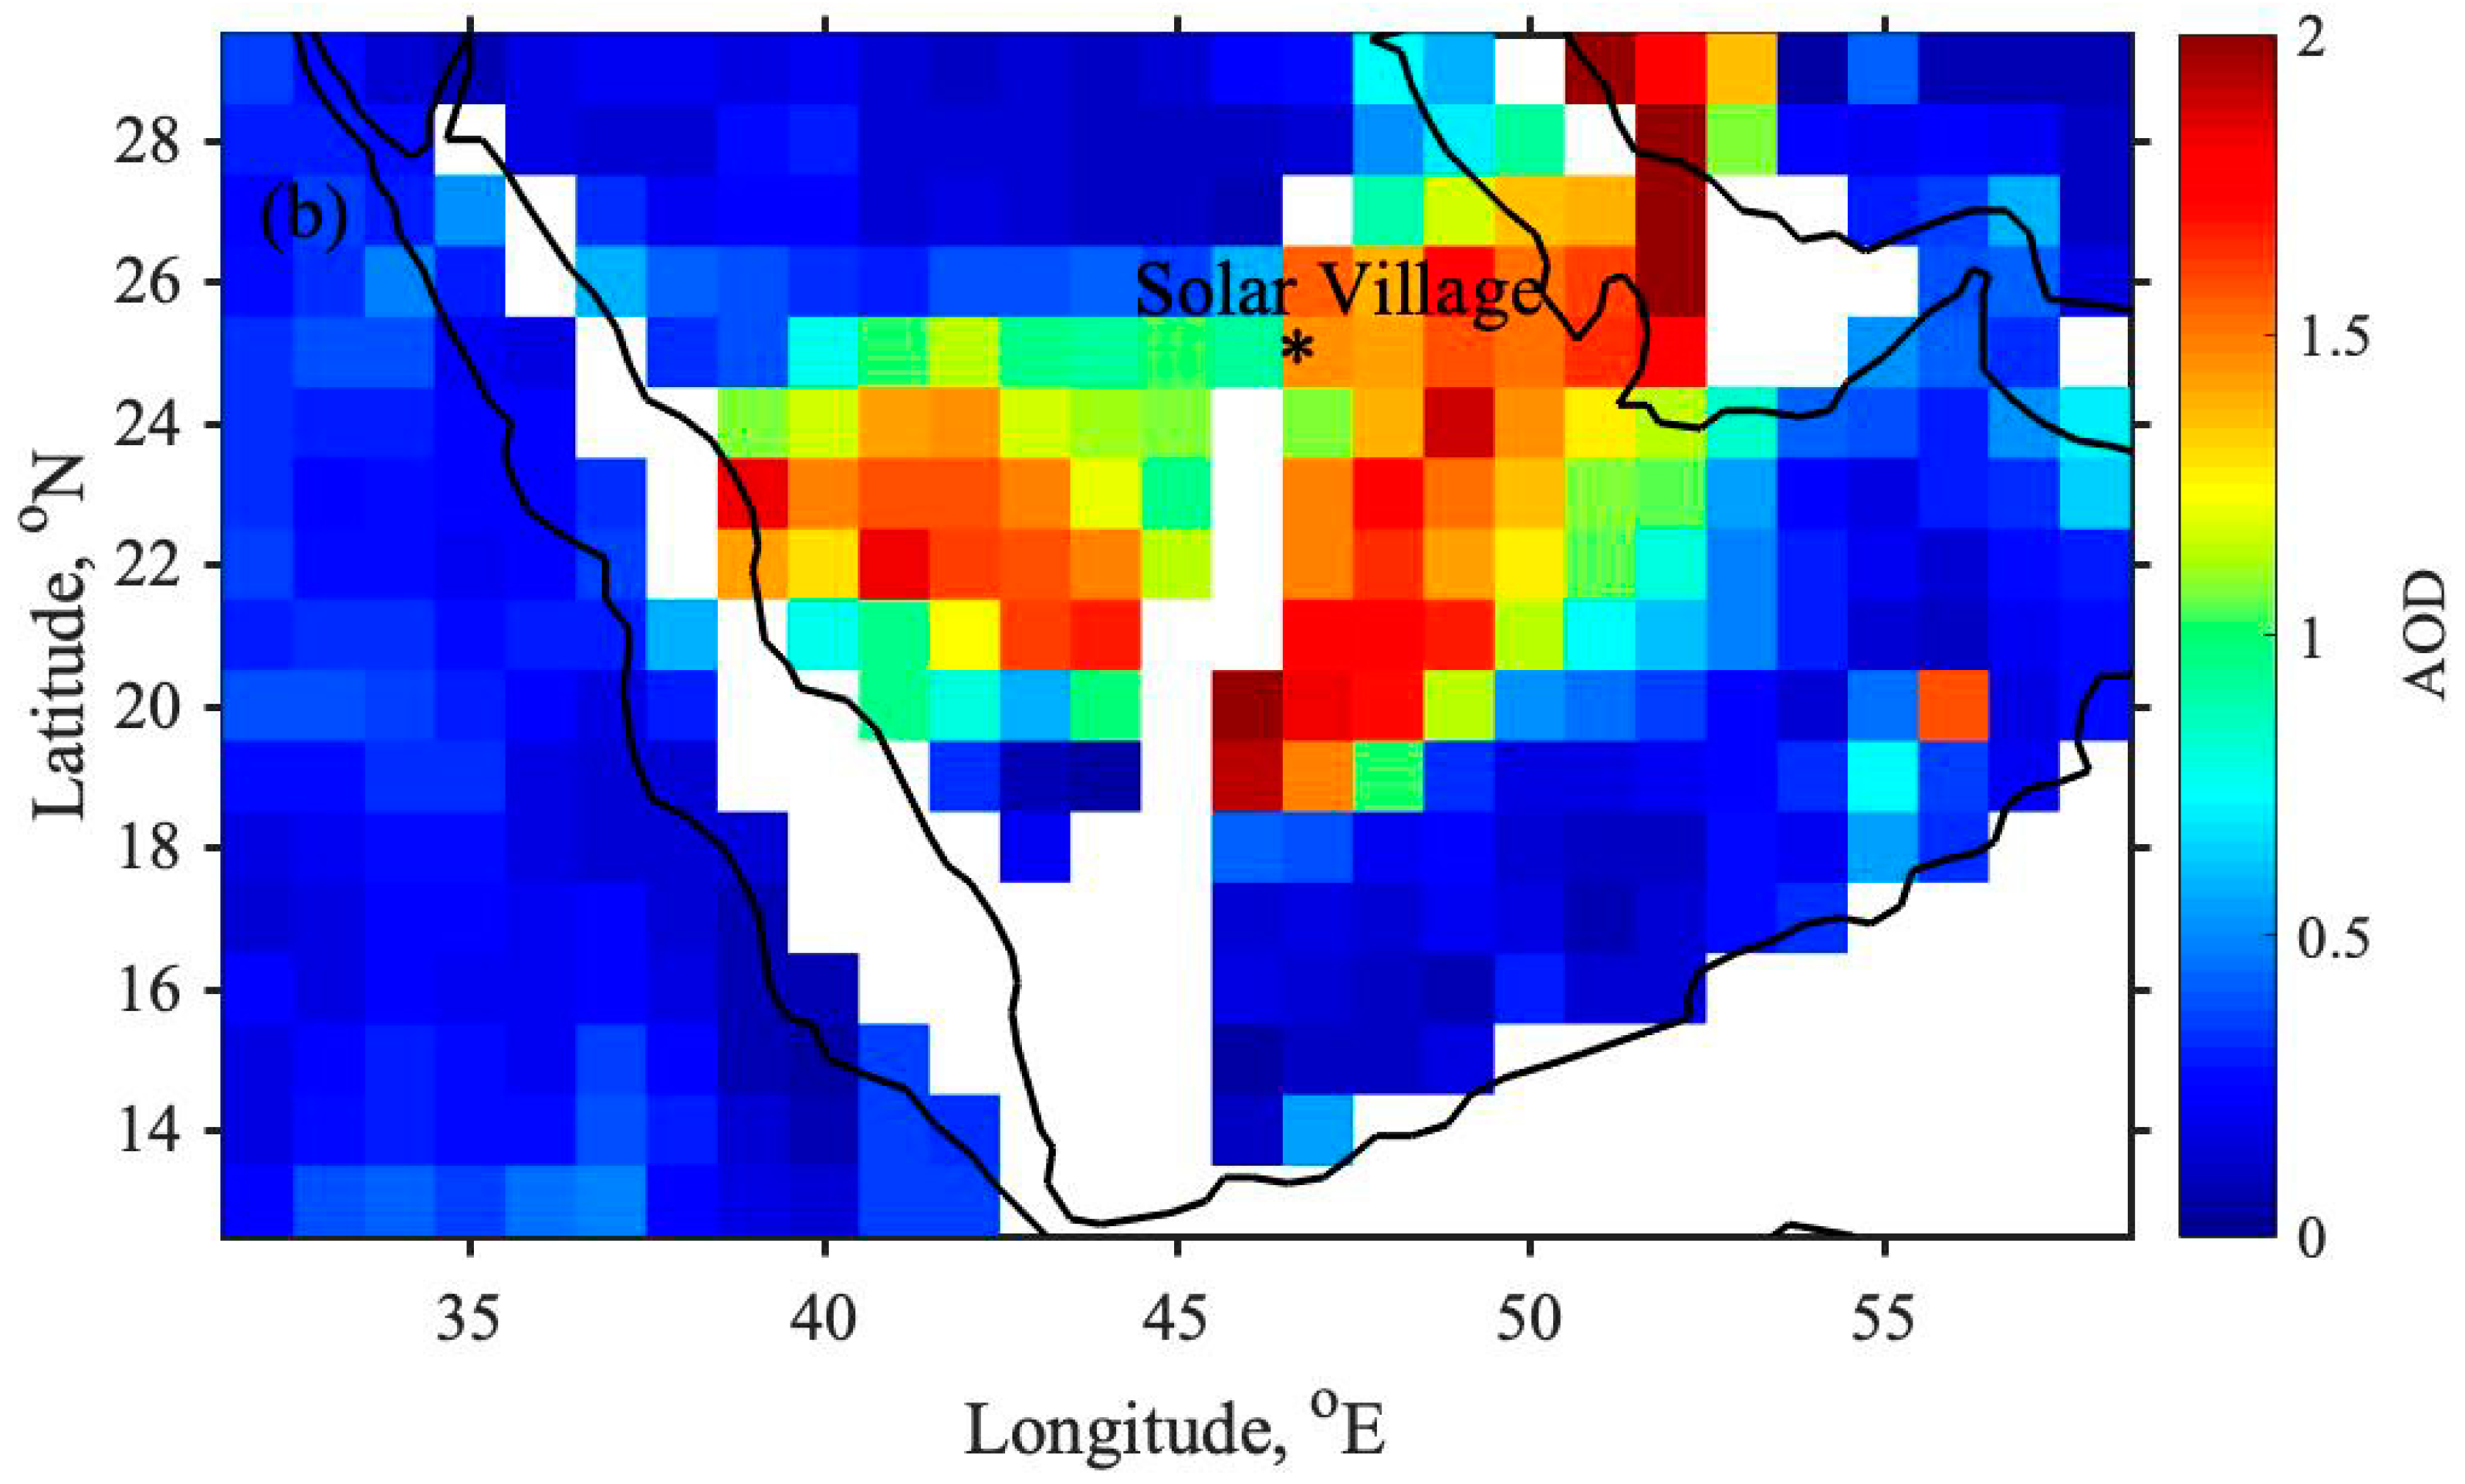
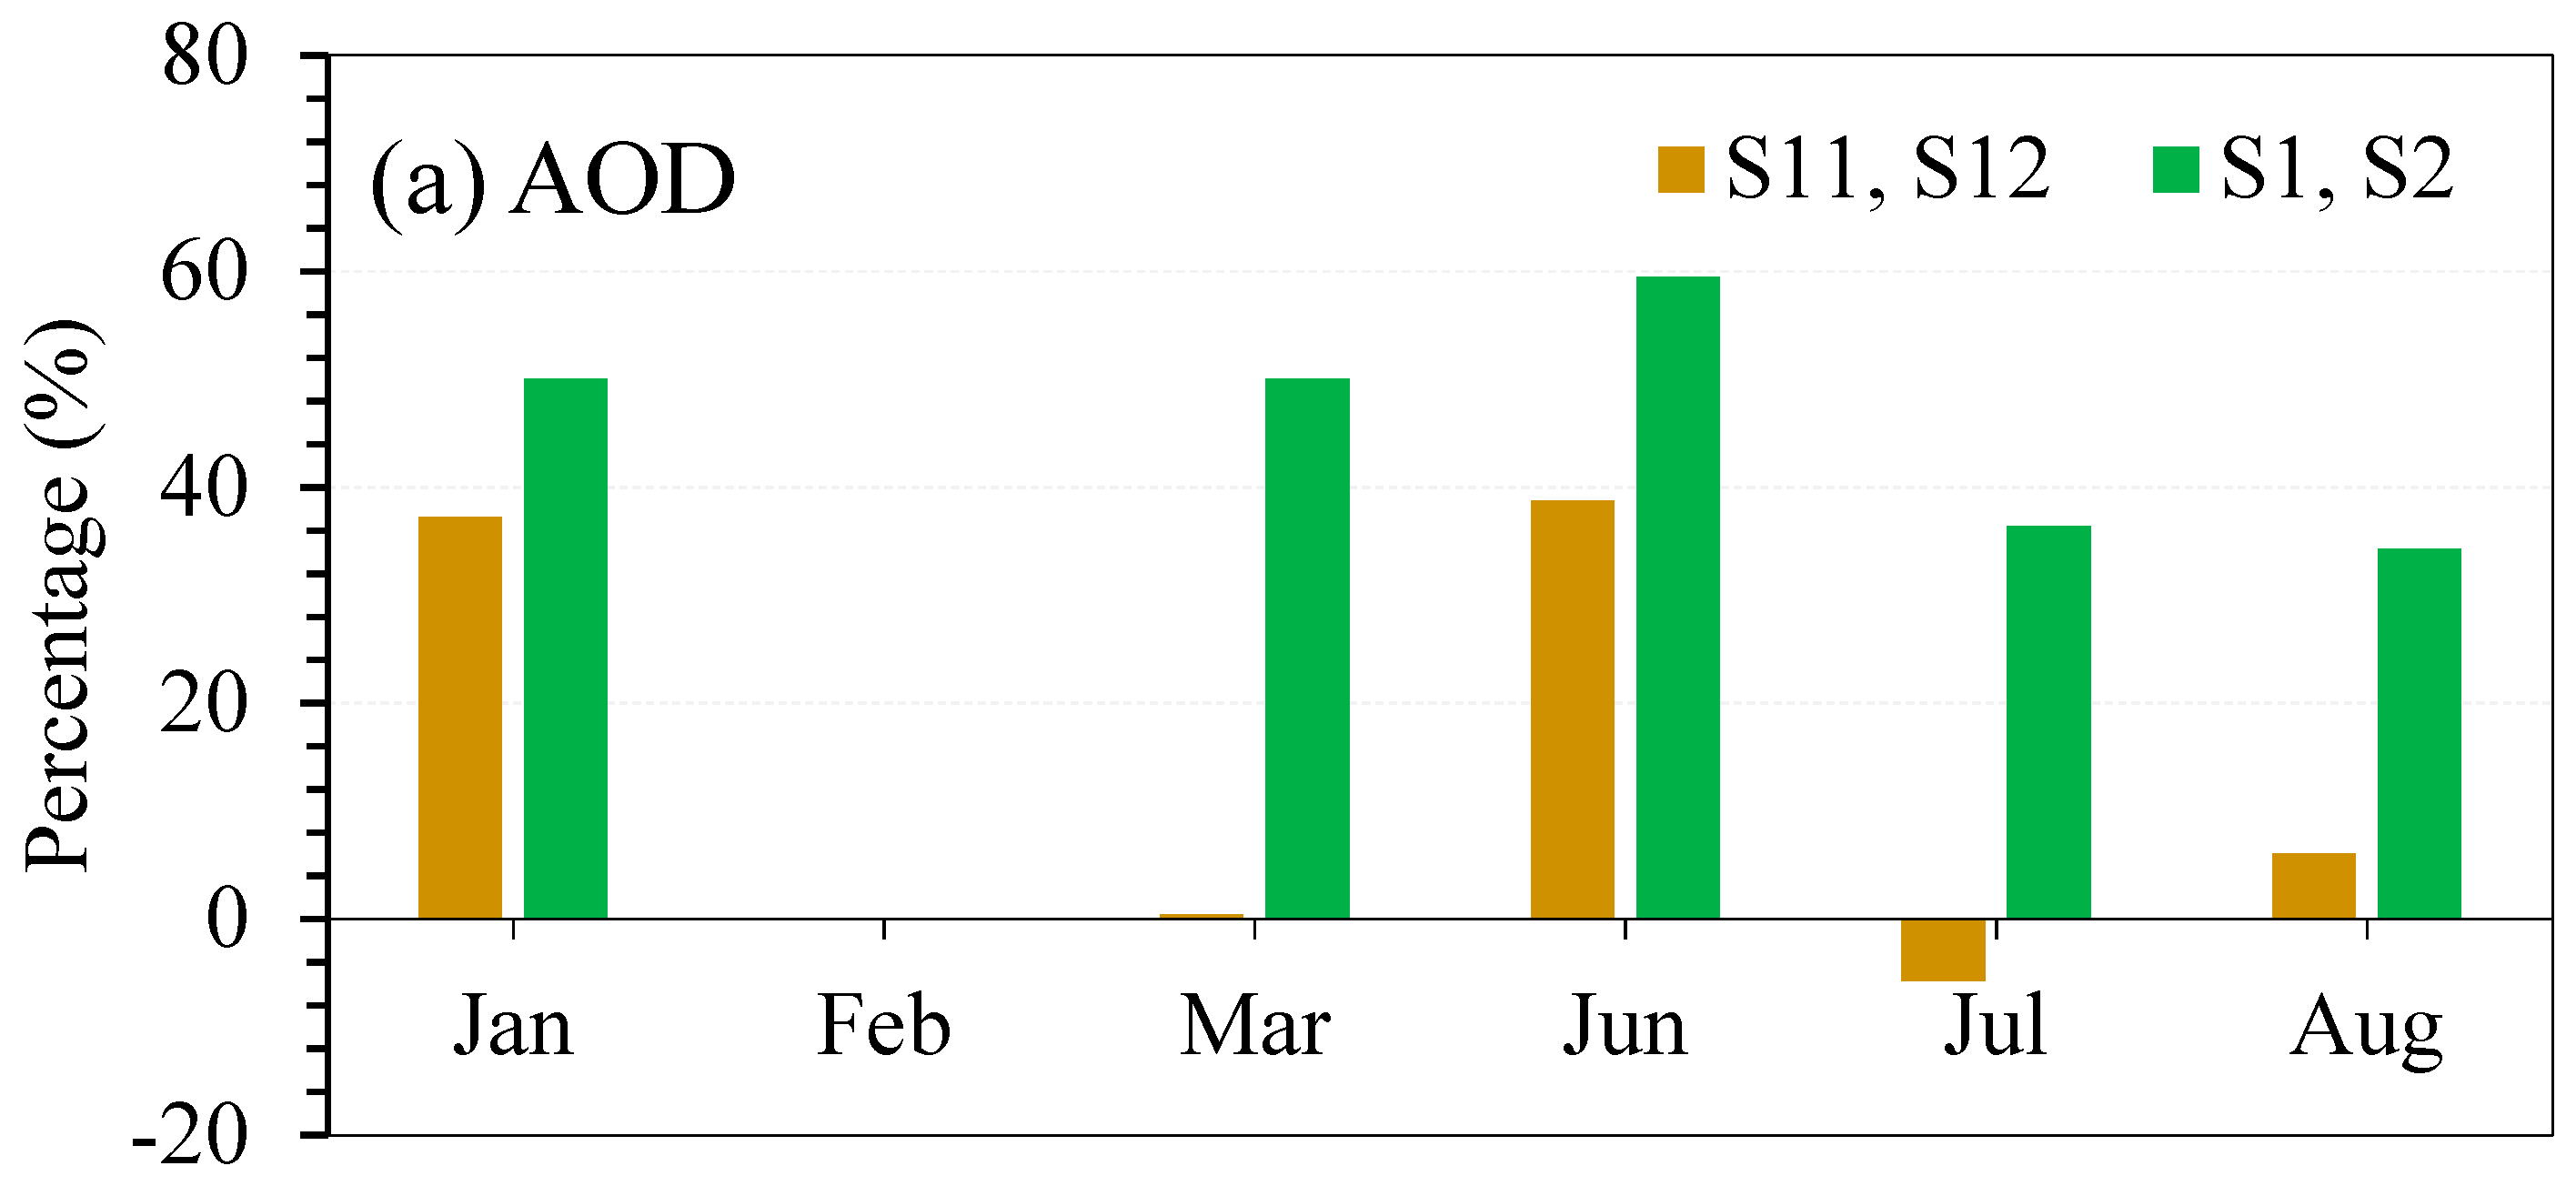
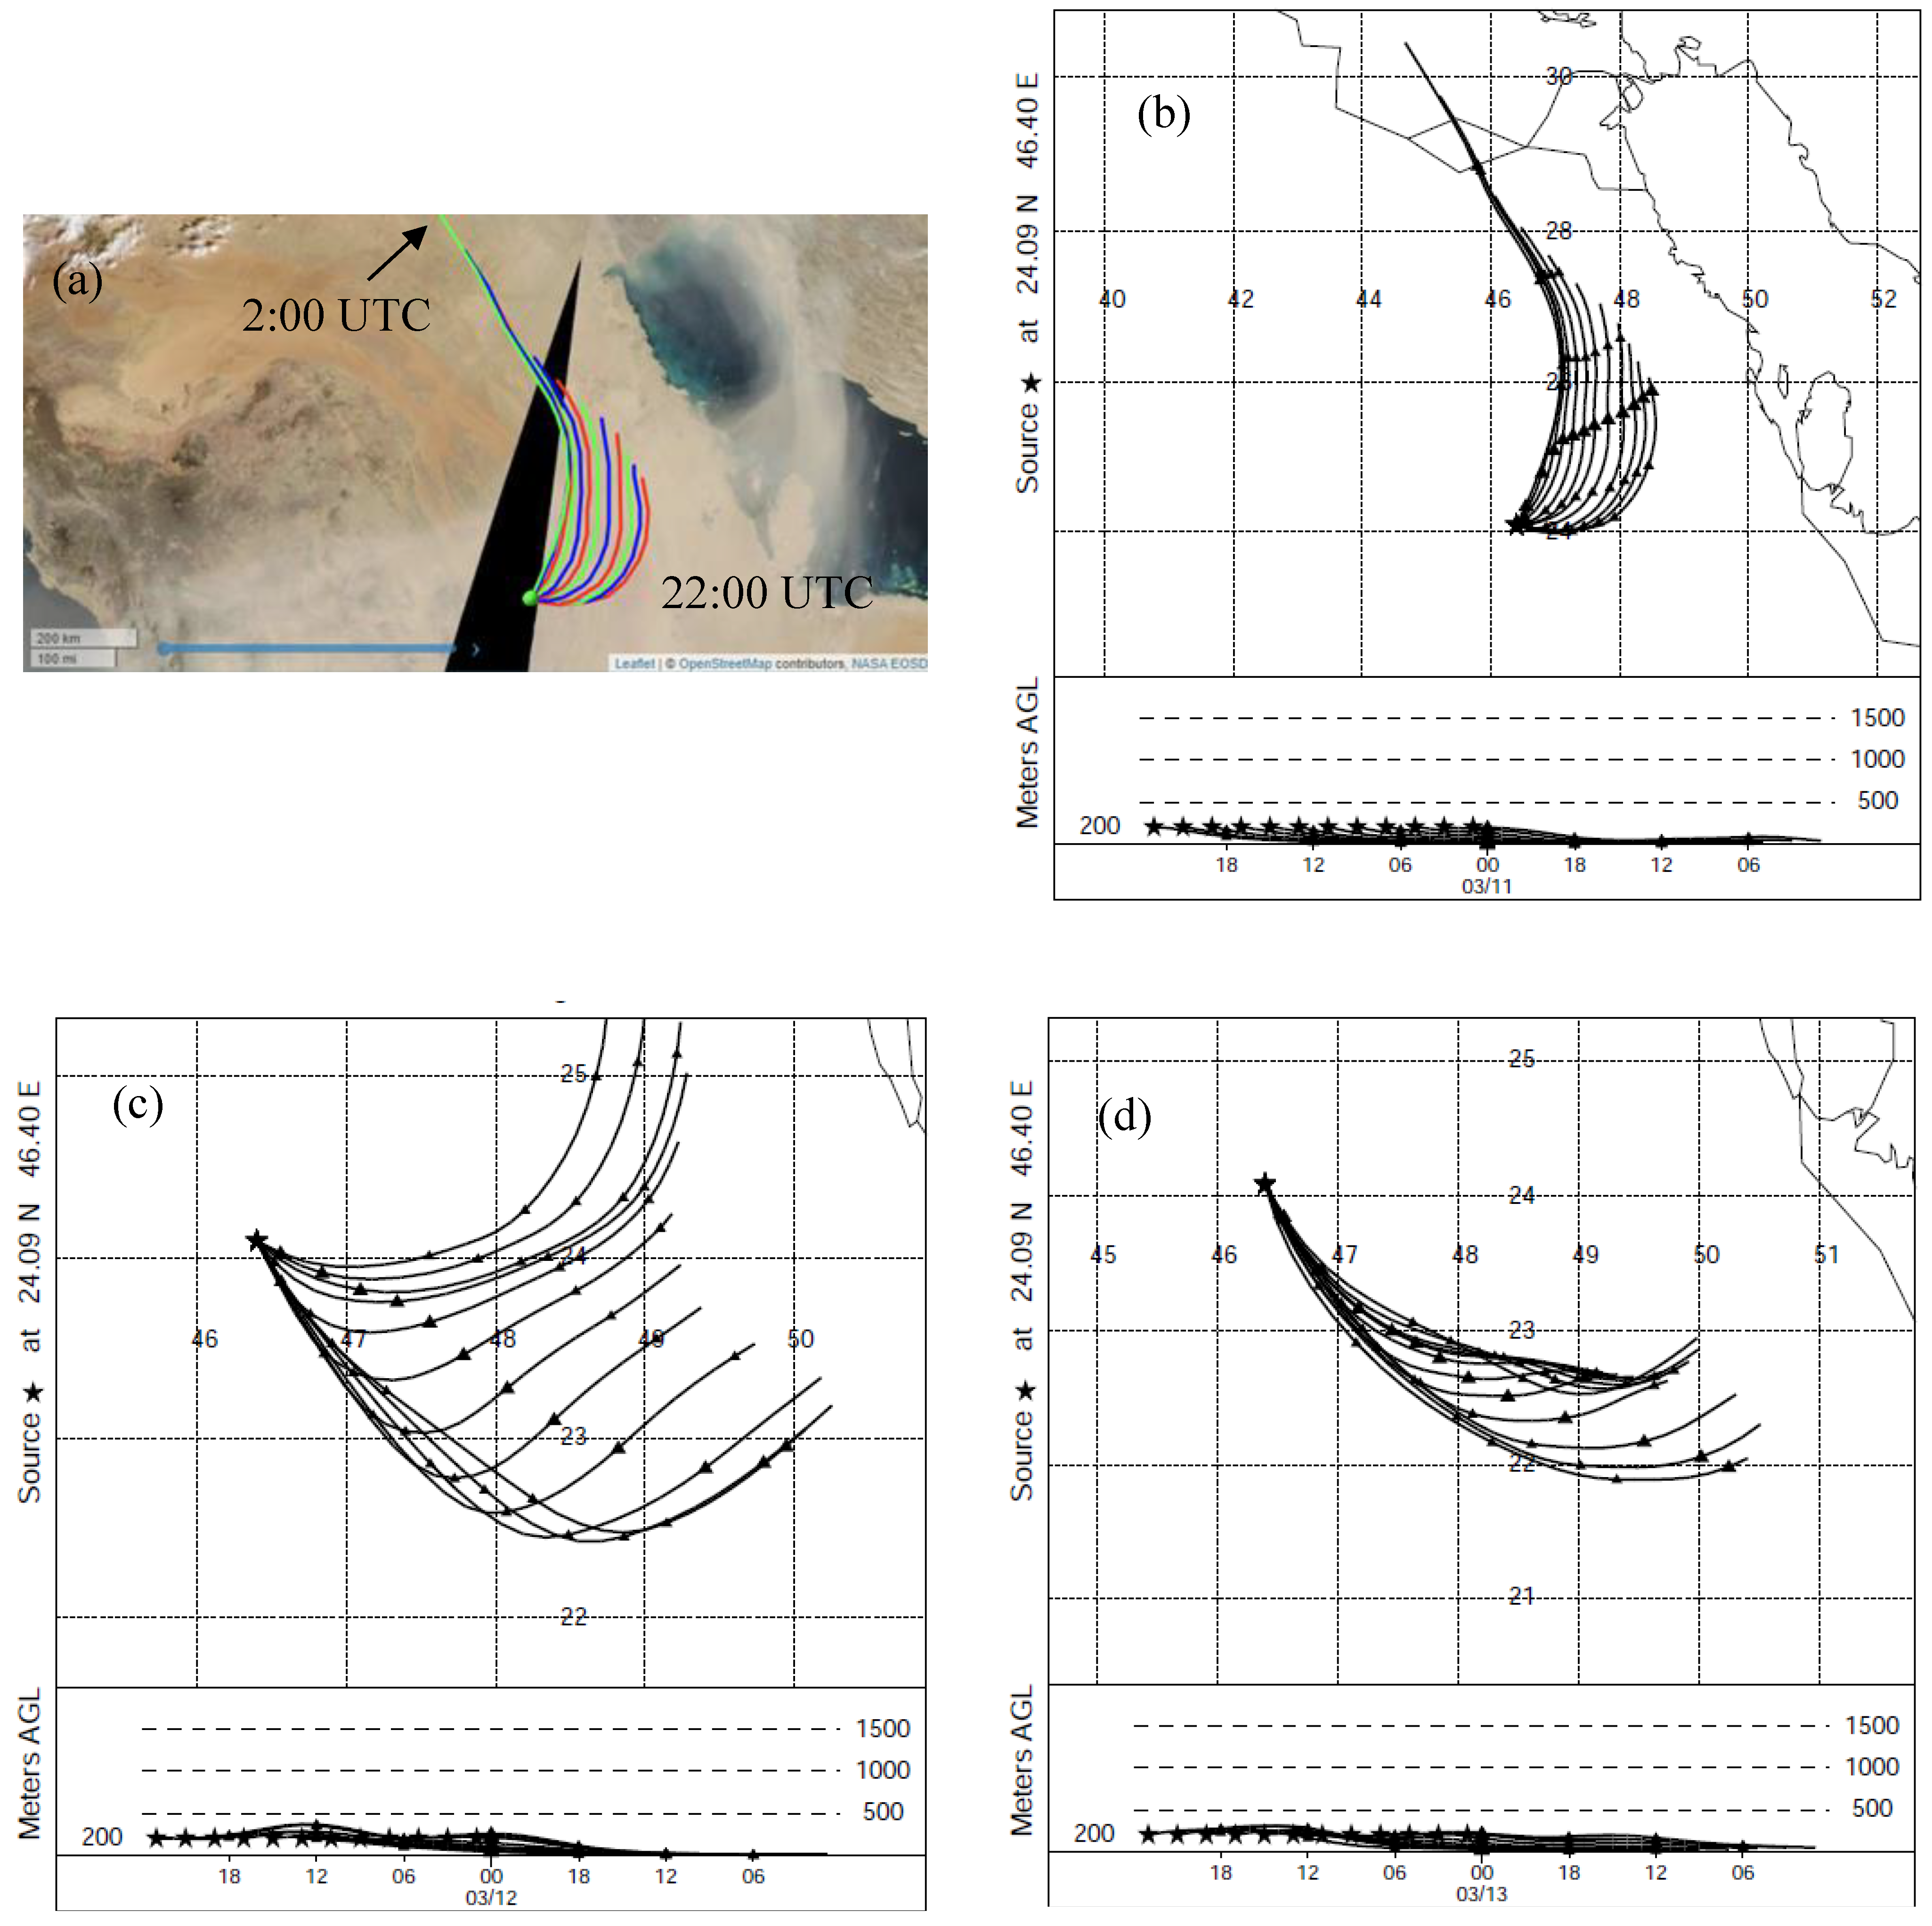
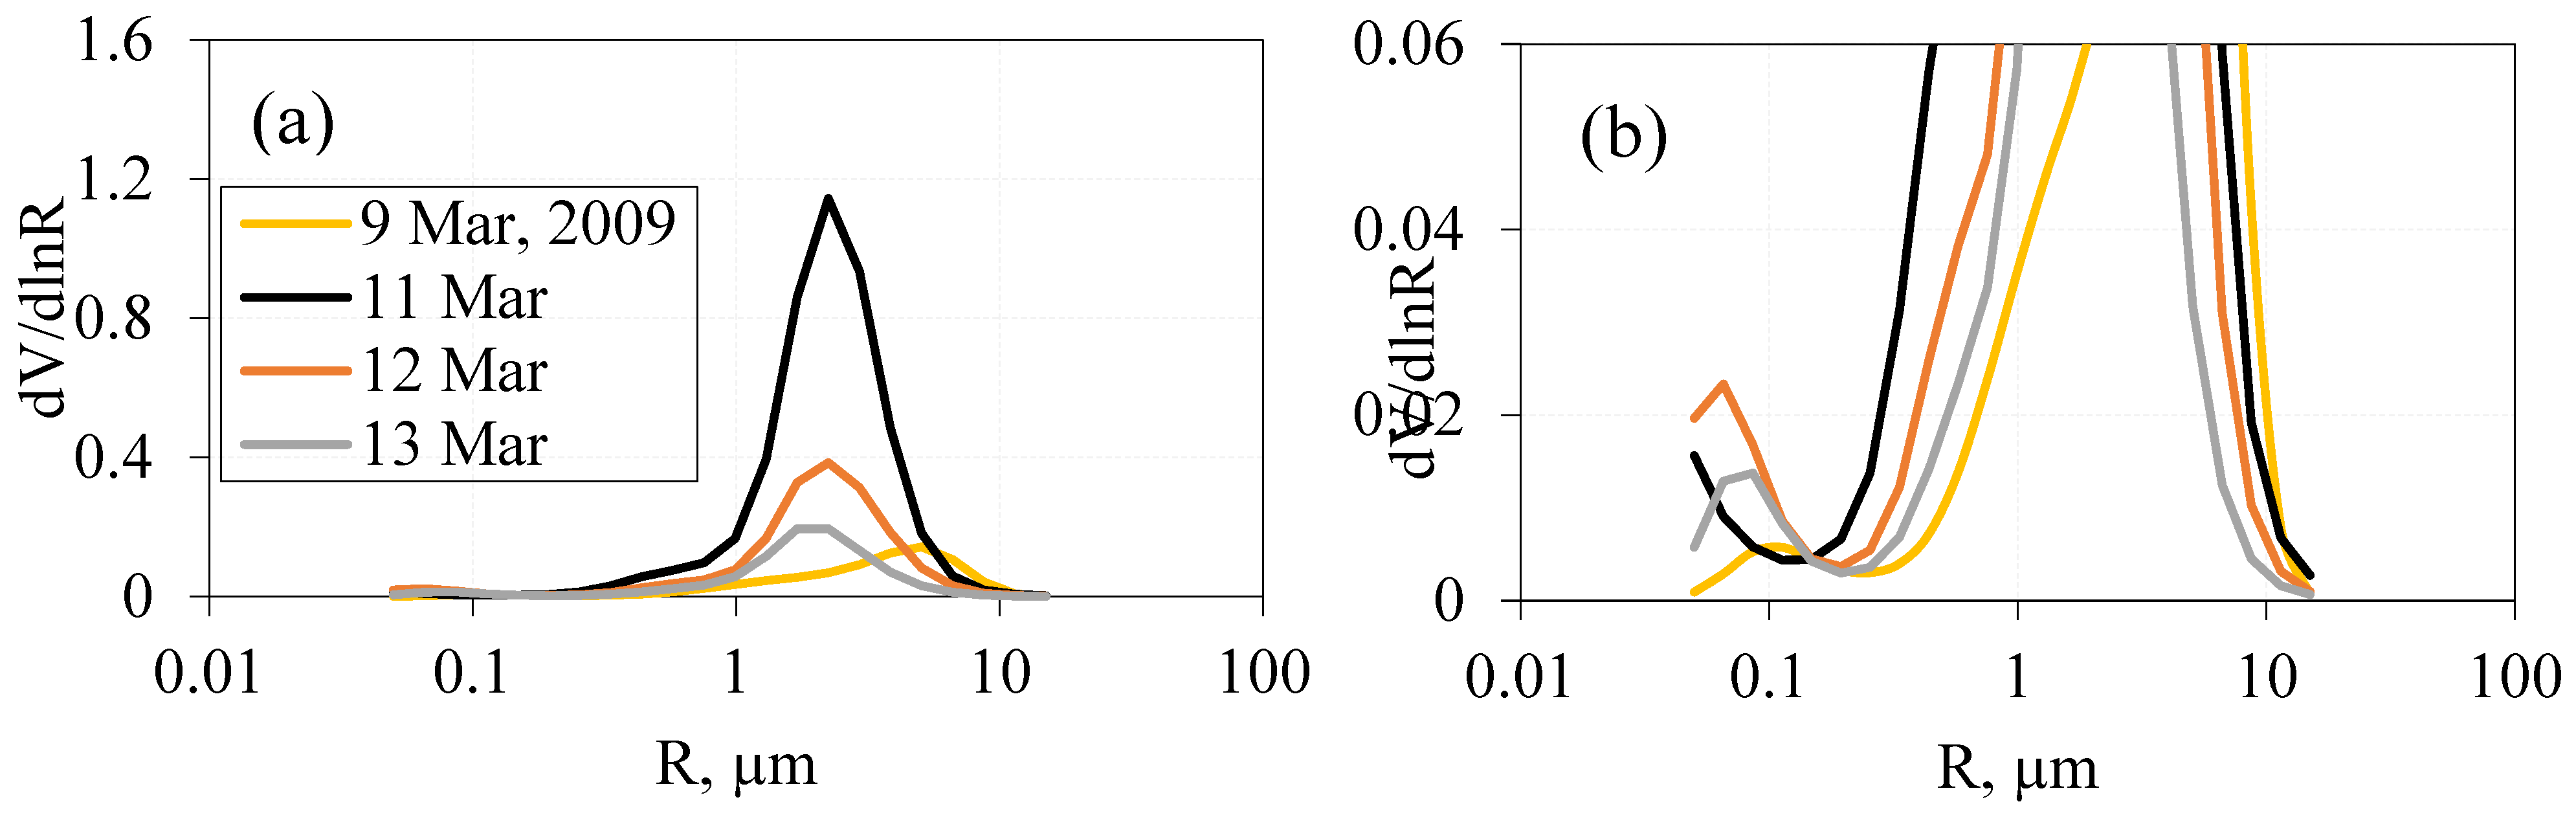
3.3. Effect of Air Mass Transport During Dust Events

The Hybrid Single Particle Lagrangian Integrated Trajectory (HYSPLIT) model was used to study the transport of air mass to the SV AERONET station. The back trajectory (Figure 8a,b) shows air mass reaching around SV AERONET station on 11 March 2009, which was associated with a massive dust storm event (Figure 8b) over KSA. The air mass that reached around the SV AERONET site was transported from the surrounding Arabian Gulf region, NE KSA, and Iraq. These regions are known for their oil, petrochemical, and cement industries, along with mega infrastructures, which are the source of high atmospheric pollution and poor air quality [3].
The 11 trajectories shown in Figure 8a–d represent different trajectories initiated every 2 h using the Global Data Assimilation System (GDAS1) Archive Information of the HYSPLIT model [28]. The first red trajectory (right) (Figure 8a) represents air mass transport during 11 March 2009 at 22:00 UTC, while the last green trajectory (left) represents air mass transport at 2:00 UTC. Air mass was still transported from the NE KSA and the Arabian Gulf during 12 and 13 March 2009 (Figure 8c,d), which clearly shows the transport of dust from Gulf region. The lower panels of Figure 8b–d show that air mass was mostly transported near the surface.
Figure 9a,b shows the effect of local transport in increasing the concentration of both coarse- and fine-mode aerosol particles, and hence, contributing to the loading of dust and pollutants, which are a source of atmospheric haze that impacts people’s health. Figure 9a shows the increase in concentration of coarse particles on 11 March 2009 and, afterwards, the decrease in coarse particles over the SV on the 12 and 13 March. The concentrations of finer particles were high on 12 and 13 March compared to 9 and 11 March over the SV (Figure 9b). This clearly shows that the dust event on 11 March transported pollutants from the Gulf of Arabia and Northern KSA to the SV region.

4. Conclusions

The present study examined the long-term variation and trends of aerosol properties over central Saudi Arabia (KSA). Data from the Solar Village (SV) AERONET station located near central KSA was used to analyze aerosol optical parameters, including aerosol optical depth (AOD) and the Ångström exponent (α) during a period of almost 14 years from December 1999–January 2013. AERONET parameters such as VSD were used to investigate the emerging aerosol variability for each season. The result indicates an increase in aerosol concentration during the spring and the beginning of the summer, caused by dust storms, whereas a lower aerosol concentration was found during the fall and winter, which is caused by low dust frequency and higher precipitation rates. The HYSPLIT backward trajectories clearly show that during the major dust event of 11 March 2009, air mass was transported from the Arabian Gulf region and the north-east borders of KSA, especially bordering Kuwait and Iraq. The results discussed in this work indicate that higher natural and anthropogenic aerosol loading was observed during the period April 2006–January 2013 (S2) compared to the period December 1999–March 2006 (S1), with a general increase in the size of fine aerosol particles during the spring. This could be attributed to climate conditions, the petrochemical, fertilizer, and cement industries, along with infrastructure and vehicle emissions. Future work is suggested to examine the long-range transport of natural and anthropogenic particles from Saudi Arabia to south Asia.

Author Contributions

Each co-author contributed to the completion of this paper. Specifically, their individual contributions are as follows: Conceptualization, M.A.O., B.T., A.F., M.H.O., and R.P.S.; data curation, M.A.O., E.R., and A.F.; formal analysis, M.A.O., B.T., and A.F.; methodology, M.A.O. and A.F.; project administration, A.F. and A.A.; supervision, B.T., A.F., and R.P.S.; writing—original draft, M.A.O. and A.F.; writing—review and editing, M.A.O., B.T., A.F., A.A., and R.P.S.

Funding

The authors would like to acknowledge the support provided by the Deanship of Scientific Research (DSR) at the King Fahd University of Petroleum and Minerals (KFUPM) for funding this work through project no. IN161053. Author A. A would like to acknowledge the support provided through grant NSS 28 -2017 from the United Arab Emirates University (UAEU).

Acknowledgments

The authors would like to thank Maher Dayeh at South West Research Institute (SwRI) for useful discussion. The authors thank the SV NASA AERONET team for making AERONET Data available for the present study. The authors thank the four anonymous Reviewers and the Editor for their comments/suggestions, which have helped us to improve earlier versions of the manuscript.

Conflicts of Interest

The authors declare no conflicts of interest

References

  1. Schwartz, S.E.; Arnold, F.; Blanchet, J.-P.; Durkee, P.A.; Hofmann, D.J.; Hoppel, W.A.; King, M.D.; Lacis, A.A.; Nakajima, T.; Ogren, J.A.; et al. Group Report: Connections between Aerosol Properties and Forcing of Climate in Aerosol Forcing of Climate; Charlson, R.J., Heintzenberg, J., Eds.; John Wiley & Sons, Inc.: New York, NY, USA, 1995; pp. 251–280. [Google Scholar]
  2. Rosenfeld, D.; Woodley, W.L.; Axisa, D.; Freud, E.; Hudson, J.G.; Givati, A. Aircraft measurements of the impacts of pollution aerosols on clouds and precipitation over the Sierra Nevada. J. Geophys. Res. 2008, 113, D15203. [Google Scholar] [CrossRef]
  3. Farahat, A. Air pollution in the Arabian Peninsula (Saudi Arabia, the United Arab Emirates, Kuwait, Qatar, Bahrain, and Oman): Causes, effects, and aerosol categorization. Arab. J. Geosci. 2016, 9, 196. [Google Scholar] [CrossRef]
  4. Alharbi, H.; Pasha, M.; Tapper, N. Assessment of ambient air quality in Riyadh City, Saudi Arabia. Curr. World Environ. 2014, 9, 227. [Google Scholar] [CrossRef]
  5. Butt, M.; Assiri, M.; Ali, M. Assessment of AOD variability over Saudi Arabia using MODIS Deep Blue products. Environ. Pollut. 2017, 231, 143–153. [Google Scholar] [CrossRef]
  6. Farahat, A.; El-Askary, H.; Adetokunbo, P.; Fuad, A. Analysis of aerosol absorption properties and transport over North Africa and the Middle East using AERONET data. Ann. Geophys. 2016, 34, 1031–1044. [Google Scholar] [CrossRef]
  7. Said, S.; Kadry, H. Generation of representative weather—Year data for Saudi Arabia. Appl. Energy 1994, 48, 131–136. [Google Scholar] [CrossRef]
  8. Notaro, M.; Alkolibi, F.; Fadda, E.; Bakhrjy, F. Trajectory analysis of Saudi Arabian dust storms. J. Geophys. Res. Atmos. 2013, 118, 6028–6043. [Google Scholar] [CrossRef]
  9. Singh, S.; Singh, B.; Gera, B.S.; Srivastava, M.K.; Dutta, H.N.; Garg, S.C.; Singh, R.A. Study of aerosol optical depth in the central Indian region (During ISRO-GBP Field Campaign. Atmos. Environ. 2006, 40, 6494–6503. [Google Scholar] [CrossRef]
  10. Kalapureddy, M.C.R.; Devara, P.C.S. Pre-Monsoon aerosol optical properties and spatial distribution over the Arabian Sea during 2006. Atmos. Res. 2010, 95, 186–196. [Google Scholar] [CrossRef]
  11. Kedia, S.; Ramachandran, S. Variability in aerosol optical and physical characteristics over the Bay of Bengal and the Arabian Sea deduced from Ångström Exponents. J. Geophys. Res. 2009, 114, D14207. [Google Scholar] [CrossRef]
  12. Ghan, S.J.; Schwartz, S.E. Aerosol Properties and Processes: A path from field and laboratory measurements to Global Climate Models. Bull. Am. Meteorol. Soc. 2007, 88, 1059–1083. [Google Scholar] [CrossRef]
  13. Ministry of Environment, Water and Agriculture, Saudi Arabia Electricity: Consumption. Available online: https://www.ceicdata.com/en/saudi-arabia/electricity-statistics/electricity-consumption (accessed on 15 November 2019).
  14. Nada, N. Desalination in Saudi Arabia: An overview. Available online: http://www.sawea.org/pdf/waterarabia2013/Session_A/Desalination_In_Saudi_Arabia_An_Overview1_Dr_Nada.pdf (accessed on 10 November 2019).
  15. Saudi Arabia Population (LIVE). Available online: https://www.worldometers.info/world-population/saudi-arabia-population (accessed on 15 November 2019).
  16. Industry in Saudi Arabia. Available online: https://www.sidf.gov.sa/en/IndustryinSaudiArabia/Pages/default.aspx (accessed on 8 November 2019).
  17. Alyemeni, M.N.; Almohisen, I.A. Traffic and industrial activities around Riyadh cause the accumulation of heavy metals in legumes: A. case study. Saudi J. Biol. Sci. 2014, 21, 2. [Google Scholar] [CrossRef] [PubMed]
  18. Prospero, J.; Ginoux, P.; Torres, O.; Nicholson, S.; Gill, T. Environmental characterization of global sources of atmospheric soil dust identified with the NIMBUS 7 Total Ozone Mapping Spectrometer (TOMS) absorbing aerosol product. Rev. Geophys. 2002, 40, 1002. [Google Scholar] [CrossRef]
  19. Holben, B.N.; Eck, T.F.; Slutsker, I.; Tanré, D.; Buis, J.P.; Setzer, A.; Vermote, E.; Reagan, J.A.; Kaufman, Y.J.; Nakajima, T.; et al. AERONET: A federated instrument network and data archive for aerosol characterization. Remote Sens. Environ. 1998, 66, 1–16. [Google Scholar] [CrossRef]
  20. Eck, T.F.; Holben, B.N.; Ward, D.E.; Dubovik, O.; Reid, J.S.; Smirnov, A.; Mukelavi, M.M.; Hsu, N.C.; O’Neill, N.T.; Slutsker, I. Characterization of the optical properties of biomass burning aerosols in Zambia during the 1997 ZIBBEE Field Campaign. J. Geophys. Res. 2001, 106, 3425–3448. [Google Scholar] [CrossRef]
  21. Dubovik, O.; Smirnov, A.; Holben, B.; King, M.; Kaufman, Y.; Eck, T.; Slutsker, I. Accuracy assessments of aerosol properties retrieved from aerosol robotic network (AERONET) sun and sky radiance measurements. J. Geophys. Res. 2000, 105, 9791–9806. [Google Scholar] [CrossRef]
  22. Giles, D.M.; Holben, B.N.; Eck, T.F.; Sinyuk, A.; Smirnov, A.; Slutsker, I.; Dickerson, R.R.; Thompson, A.M.; Schafer, J.S. An analysis of AERONET aerosol absorption properties and classifications representative of aerosol source regions. J. Geophys. Res. 2012, 117, D17203. [Google Scholar] [CrossRef]
  23. Ångström, A. The parameters of atmospheric turbidity. Tellus 1964, 16, 64–75. [Google Scholar] [CrossRef]
  24. Smirnov, A.; Holben, B.N.; Dubovik, O.; O’Neill, N.T.; Eck, T.F.; Westphal, D.L.; Goroch, A.K.; Pietras, C.; Slutsker, I. Atmospheric aerosol optical properties in the Persian Gulf. J. Atmos. Sci. 2002, 59, 620–634. [Google Scholar] [CrossRef]
  25. Smirnov, A.; Holben, B.N.; Eck, T.F.; Dubovik, O.; Slutsker, I. Cloud-screening and quality control algorithms for the AERONET database. Remote Sens. Environ. 2000, 73, 337–349. [Google Scholar] [CrossRef]
  26. Knobelspiesse, K.D.; Pietras, C.; Fargion, G.S.; Wang, M.; Frouin, R.; Miller, M.A.; Subramaniam, A.; Balch, W.M. Maritime aerosol optical thickness measured by handheld sun photometers. Remote Sens. Environ. 2004, 93, 87–106. [Google Scholar] [CrossRef]
  27. Nakajima, T.; Tanaka, M.; Yamano, M.; Shiobara, M.; Arao, K.; Nakanishi, Y. Aerosol optical characteristics in the yellow sand events observed in May, 1982 in Nagasaki. J. Meteorol. Soc. Jpn. 1989, 67, 279–291. [Google Scholar] [CrossRef]
  28. Schuster, G.L.; Dubovik, O.; Holben, B.N. Ångström exponent derived aerosol optical depth over the Ganga basin, India. Ann. and bimodal aerosol size distributions. J. Geophys. Res. 2006, 111, D07207. [Google Scholar]
  29. Reid, J.S.; Eck, T.F.; Christopher, S.A.; Hobbs, P.V.; Holben, B.N. Use of the Ångström exponent to estimate the variability of optical and physical properties of aging smoke particles in Brazil. J. Geophys. Res. 1999, 104, 27473–27489. [Google Scholar] [CrossRef]
  30. Ackerman, S.; Strabala, K.; Menzel, W.; Frey, R.; Moeller, C.; Gumley, L. Discriminating clear sky from clouds with MODIS. J. Geophys. Res. 1998, 103, 32141–32157. [Google Scholar] [CrossRef]
  31. Levy, R.C.; Remer, L.A.; Kleidman, R.G.; Mattoo, S.; Ichoku, C.; Kahn, R.; Eck, T.F. Global evaluation of the Collection 5 MODIS dark-target aerosol products over land. Atmos. Chem. Phys. 2010, 10, 10399–10420. [Google Scholar] [CrossRef]
  32. Stein, A.; Draxler, R.; Rolph, G.; Stunder, B.; Cohen, M.; Ngan, F. 2015: NOAA’s HYSPLIT Atmospheric Transport and Dispersion Modeling System. Bull. Am. Meteorol. Soc. 2015, 96, 2059–2077. [Google Scholar] [CrossRef]
  33. Streets, D.; Yan, F.; Chin, M.; Diehl, T.; Mahowald, N.; Schultz, M.; Wild, M.; Wu, Y.; Yu, C. Anthropogenic and natural contributions to regional trends in aerosol optical depth, 1980–2006. J. Geophys. Res. 2009, 114, 148–227. [Google Scholar] [CrossRef]
  34. Ng, D.; Li, R.; Raghavan, S.; Liong, S. Investigating the relationship between aerosol optical depth and precipitation over Southeast Asia with relative humidity as an influencing factor. Sci. Rep. 2017, 7, 1. [Google Scholar] [CrossRef] [Green Version]
  35. Labban, A. Dust Storms over Saudi Arabia: Temporal and Spatial Characteristics, Climatology and Synoptic Case Studies. Ph.D. Thesis, RMIT University, Melbourne, Australia, 2015. [Google Scholar]
Figure 1. (a) Map of the Kingdom of Saudi Arabia (KSA) with the Solar Village (SV) AERONET Station location highlighted about 50 km from the city of Riyadh (Google Maps). (b) MODIS Terra image showing the strong dust event on 11 March 2009 around Riyadh, the capital of KSA.
Atmosphere 10 00752 g001aAtmosphere 10 00752 g001b
Figure 2. Rainfall frequency over central Saudi Arabia (SA) (1999–2013). (X-axis represent months (in order), J: January, F: February, M: March, A: April, M: May, J: June, J: July, A: August, S: September, O: October, N: November, D: December.). Source: Saudi Arabia Presidency of Meteorology and Environment (PME). https://www.pme.gov.sa/.
Atmosphere 10 00752 g002
Figure 3. (a) Solar Village (SV) daily aerosol optical depth (AOD) values and trends for December 1999–January 2013. (b) Adjusted data after removing the annual seasonality. Red lines indicate a linear regression.
Atmosphere 10 00752 g003
Figure 4. Percent (%) variation of mean and median values of AOD, α440870, and α380500 of aerosol optical properties over the Solar Village (SV) during the period December 1999–January 2013.
Atmosphere 10 00752 g004
Figure 5. Inter-annual trend analysis, including variation percent over Solar Village (SV) during the period December 1999–January 2013. N indicates the number of valid observations. X indicates data are significant (p < 0.05). Months are abbreviate as, J: January, F: February, M: March, A: April, M: May, J: June, J: July, A: August, S: September, O: October, N: November, D: December.
Atmosphere 10 00752 g005
Figure 6. Sensitivity analysis for the data presented in Figure 5 and Table 1 (statistically significant months only) (a) AOD (b) α400870. S11: December 1999–December 2002, S12: January 2003–December 2006, S1: December 1999–March 2005, S2: April 2006–January 2013.
Atmosphere 10 00752 g006aAtmosphere 10 00752 g006b
Figure 7. Aerosol characteristics and size distribution during the (a,b) winter season (December–February); (c,d) spring season (March–May); (e,f) summer season (June–August); (g,h) fall season (September–November). Left panel (a,c,e,g) represents a comparison of values of AOD, α440–870, and α380–500 across two sub-periods. R: particles’ radius.
Atmosphere 10 00752 g007
Figure 8. NOAA HYSPILT back trajectories showing the air mass reaching the area around the SV AERONET station during (a,b) the 11 March 2009 dust storm; (c) 12 March 2009; and (d) 13 March 2009. Aerosol height above ground level (AGL) is displayed at the lower panel of each figure. The first red trajectory (right) in panel (a) represents air mass transport during 11 March 2009 at 22:00 UTC, while the last green trajectory (left) represents air mass transport at 2:00 UTC.
Atmosphere 10 00752 g008
Figure 9. Volume size distribution of aerosols at the SV site on 11 March 2009 showing (a) coarse mode particles and (b) fine mode particles. R: particles’ radius.
Atmosphere 10 00752 g009
Table 1. Monthly statistical comparison between mean values of AOD, α440–870, and α380–500 over Solar Village (SV) during the sub-periods December 1999–March 2006 (S1) and April 2006–January 2013 (S2). N is the number of valid daily observations, t and p are the statistically variables of the two-pair t-test. Differences that are statistically significant (p < 0.05) are highlighted in bold.
MS1S2ptMS1S2pt
NJan112158 Mar183153
AOD0.160.240.021.810.280.420.011.89
α440–8700.870.670.102.010.500.200.042.35
α380–5001.190.780.022.010.560.300.012.13
NFeb115157 Apr140135
AOD0.260.330.051.790.420.540.102.13
α440–8700.570.360.031.890.340.190.082.35
α380–5000.840.470.011.850.390.260.021.94
NMay163177 Jul158204
AOD0.520.600.142.020.330.450.011.83
α440–8700.230.210.382.010.550.380.021.94
α380–5000.270.330.231.890.680.580.151.94
NJun171187 Aug191191
AOD0.370.590.011.850.350.470.011.83
α440–8700.380.220.062.010.690.550.082.13
α380–5000.470.350.081.850.780.740.291.89
NSep162177 Nov170138
AOD0.280.410.011.890.230.2190.402.13
α440–8700.650.570.262.350.660.880.022.02
α380–5000.890.770.101.941.000.970.432.35
NOct203172 Dec105147
AOD0.230.300.011.890.180.230.152.35
α440–8700.830.690.011.890.890.770.081.94
α380–5001.100.860.042.131.170.840.102.91

