Abstract
The heat imbalance is the fundamental driver for the atmospheric circulation. Therefore, it is crucially important to understand how it responds to global warming. In this study, the role of the ocean in reshaping the atmospheric meridional heat imbalance is explored based on observations and climate simulations. We found that ocean tends to strengthen the meridional heat imbalance over the mid-latitudes. This is primarily because of the uneven ocean heat uptake between the subtropical and subpolar oceans. Under global warming, the subtropical ocean absorbs relatively less heat as the water there is well stratified. In contrast, the subpolar ocean is the primary region where the ocean heat uptake takes place, because the subpolar ocean is dominated by upwelling, strong mixing, and overturning circulation. We propose that the enhanced meridional heat imbalance may potentially contribute to strengthening the water cycle, westerlies, jet stream, and mid-latitude storms.
1. Introduction
The uneven heat distribution between the tropics and the poles is the fundamental driver for the atmospheric circulation [1]. Therefore, to understand how the climate will change in the future, it is important to know how the heat imbalance responds to global warming.
As the lower boundary of the atmosphere, the oceans impact the weather and climate primarily by exchanging heat with the atmosphere [2]. There are two forms of heat exchanges between the atmosphere and the ocean, i.e., shortwave and longwave radiations as well as the turbulent heat fluxes (THF) of latent and sensible heat. Among which, the THF primarily explain the variability of ocean-atmosphere heat exchange, and are commonly referred to as the language of ocean-atmosphere interaction [3,4]. The variability of THF reflects the ocean-atmosphere interaction on multiple temporal and spatial scales.
On a mesoscale, ocean fuels storms by supplying water vapour and latent heat flux, causing extreme precipitation and strong winds [5,6]. On the basin scale, the El Nino-Southern Oscillation (ENSO) cycle associated with strong THF variability [7], leads to climate extremes across the world [8,9,10]. On a multi-decadal timescale, sea surface temperature (SST) anomalies control the variability of THF over the North Atlantic Ocean [3] and shape the climate over North America and Europe [11,12]. Under global warming, significant increases of THF over the subtropical extensions of western boundary currents are identified as an indicator of intensification and poleward shift of the western boundary currents [13,14]. On shorter timescale, the winter cold air over the Labrador Sea introduces a variability of ocean surface THF and triggers the ocean convective overturning, contributing to the Atlantic Meridional Overturning Circulation (AMOC) [15,16,17]. Knowledge of THF variability is vital for the understanding of the coupled climate system.
In the present paper, we investigate the trend of ocean surface THF in the framework of zonal mean distribution. We demonstrate that the subtropical ocean tends to release more THF compared to that of the subpolar ocean. Our results, supported by both observations and climate simulations, highlight that ocean induces a strengthening meridional heat imbalance over the mid-latitude, even though there is an overall weakening meridional heat imbalance as a consequence of polar amplification [18,19].
2. Data and Method
Four observational THF datasets were used to investigate trends in THF. They are the Objectively Analyzed Air-Sea Heat Fluxes for the Global Ice-Free Oceans (OAFlux, 1958–2018) [20], the NCEP/NCAR Reanalysis 1 (1948–2018) [21], the NCEP-DOE Reanalysis 2 (1979–2018) [22], and the ERA-Interim (1979–2018) [23]. Moreover, the observational ocean temperature data from the Global Ocean Heat and Salt Content dataset (1955–2018) [24] was used to examine the vertical ocean temperature trend. The ocean reanalysis dataset, Simple Ocean Data Assimilation (SODA2.2.0, 1948–2008) [25], was also used to investigate the mechanism.
To evaluate the response of ocean surface THF under global warming, climate model simulations based on the historical (1979–2005) and Representative Concentration Pathway 4.5 (RCP4.5, 2006–2100) experiments from the Coupled Model Intercomparison Project Phase 5 (CMIP5) [26] were used as well. The historical experiment was designed to hindcast the recent past climate, in which the climate is forced by historical evolutions of greenhouse gases, ozone, land-use, aerosols, volcano eruption, and solar radiation. The RCP4.5 experiment is a medium range emission scenario which has the largest ensemble members among other scenarios within the CMIP5 [26]. A total of 31 climate models are included to obtain the multi-model ensemble trends. By averaging a large ensembles of climate simulations, the amplitude of the natural climate variability is substantially reduced. Therefore, the multi-model ensemble trends are treated as the real forced climate trends [27]. Detailed information on the models we use is summarized in Table 1.

Table 1.
List of CMIP5 (Coupled Model Intercomparison Project Phase 5) models used in this study.
Considering that the available observational records cover a relatively short period, natural variations, such as ENSO, may contribute to the linear trend in these datasets. To eliminate the influence of ENSO variability on the trend analysis, we identified and removed it from the observational THF datasets by applying a linear regression of Nino 3.4 index [28] against the THF data. A similar approach has also been used by Ionita et al. [29].
3. Enhanced Mid-Latitude Meridional Heat Imbalance Induced by the Ocean
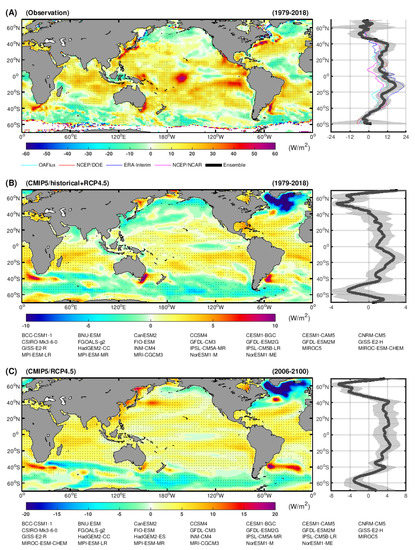
Since THF datasets differ in their temporal coverage, here, we present the linear trend of THF in their overlapped period, i.e., 1979–2018. As presented in Figure 1, the observational data shows that a large fraction of the tropical and subtropical oceans experienced a positive trend of THF, indicating an increased ocean heat release into the atmosphere. In contrast, negative trends of THF mostly present themselves over the Southern Ocean, the North Atlantic subpolar ocean, and the North Pacific subpolar ocean, suggesting that these regions tend to release less heat into the atmosphere. We noticed that individual datasets present distinct details of THF trends. However, these datasets generally agree on the fact that positive/negative trends of THF dominate the subtropical/subpolar oceans, respectively.

Figure 1.
Linear trend of ocean surface turbulent heat fluxes (THF, positive upward). The datasets and models used to derive the results are listed below each panel. (A) Observational trend of THF during 1979–2018 based on four THF datasets. The ENSO (El Nino-Southern Oscillation) signal has been removed before calculating the linear trend. Stippling indicates region where the trend pass a 95% confidence level (Student’s t-test). The right panel gives the zonal mean profile of THF trend. Grey shading illustrates the standard deviation of THF variations. The coloured lines present the THF trend from individual datasets. (B) Simulated trend of THF based on the CMIP5/historical (1979–2018) experiment. Since historical experiment only covers the period until 2005, the results are extended into 2018 based on the CMIP5/RCP4.5 experiment. Stippling illustrate region where at least 2/3 of the models agree on the sign of the trend. The right panel gives the zonal mean profile of THF trend. Grey shading illustrates the standard deviation of model projections. (C) is similar to (B), but the results are based on the CMIP5/RCP4.5 experiment (2006–2100).
Comparing with the observational results, the historical and RCP4.5 climate simulations also show an overall positive trend of THF over the low latitude regions, while negative THF trends occupy the subpolar oceans (Figure 1B,C). The zonal mean distribution of THF trends implies that the atmospheric heat imbalance over the mid-latitude has strengthened. Besides the common characteristic of zonal mean heat flux trend, both observations and climate models showed significant positive THF trends over the subtropical extensions of western boundary currents, especially over the Southern Hemisphere. This is primarily induced by the strengthening and poleward shift of the subtropical western boundary currents, as identified by Yang et al. [13,14].
It is worth noting that the CMIP5 models projected a much stronger decrease of THF over the North Atlantic subpolar ocean, which is different from the observations. This is due to a significant decrease in the northward oceanic heat transport as a result of weakening AMOC in the CMIP5 simulations [30]. In contrast, observations did not show a similar weakening AMOC during 1979–2018 [31]. Besides the discrepancy over the North Atlantic Ocean, we also noticed that the simulated magnitude of the THF trend was much smaller than that of the observations. Such a discrepancy may be partially due to the natural climate variability within the observations. Alternatively, it may be also be because of the uncertainty of the physical processes’ parameterization in the climate models. Our preliminary analysis indicated that climate models in general underestimate the variability of THF in compared with observations. Further investigations are needed to provide more robust clues on such a discrepancy. However, in the present paper, we primarily focus on the reason for the enhanced mid-latitude heat imbalance.
4. Mechanism
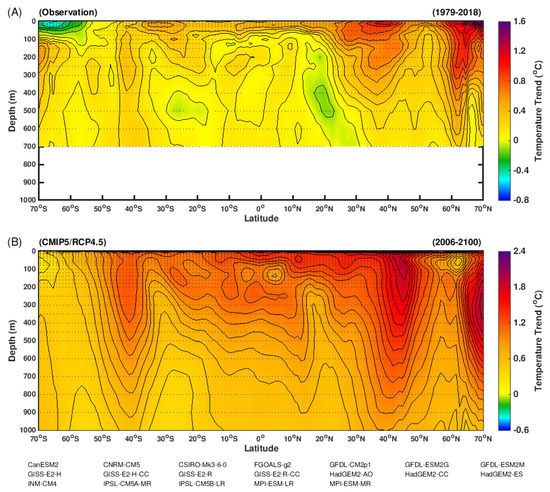
Given that the ocean surface heat fluxes are related to the ocean temperature change, accordingly, to understand the mechanism of enhanced mid-latitude heat imbalance, we examine the vertical ocean temperature trends (Figure 2). Observation shows that the ocean warming over the low latitudes were mostly limited to the upper layers (within 200 m), while the warming over the mid and higher latitudes were found at both surface and deeper oceans (up to 700 m, note that observational data only records the temperature change in the upper 700 m). Consistent with this observation, climate simulations also presented a relative shallow warming at low latitudes and deeper warming over the higher latitudes. It is worth mentioning that there was also a warming signal below 300 m over the low latitude regions. However, such a warming signal was originally generated from the higher latitudes, as illustrated by the contour lines.

Figure 2.
Vertical distribution of zonal mean ocean temperature trend. (A) Observational result based on the Global Ocean Heat and Salt Content dataset (1979–2018) [24]. The stippling indicates region where the trend pass 95% confidence level (Student’s t-test). (B) multi-model ensemble trend of ocean temperature. Results based on multi-model simulations under the CMIP5/RCP4.5 scenario (2006–2100). Stippling indicates regions where the trends are stronger than two times of the standard deviation of the internal variability.
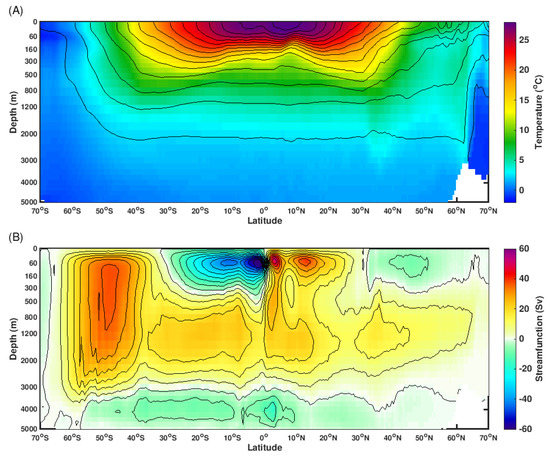
To understand why the trends of vertical ocean temperature have different characteristics between low latitude and high latitude, we present the background climatology ocean conditions in Figure 3. As shown, the tropical and subtropical ocean is characterized by warm/light surface water and cold/dense deep water. Therefore, the low-latitude ocean is well stratified and the vertical heat exchange is suppressed. Consequently, under global warming, the ocean temperature increases over the low latitude is constrained at the surface and subsurface (Figure 2). In contrast, over the subpolar oceans, the surface water is relative dense due to cold surface conditions. In addition, the near surface westerly winds produce upwelling and strong mixing, which enhance the water exchange between the surface and deeper ocean. Hence, the subpolar ocean is the region where deep water is formulated. In a warming climate, the subpolar oceans are the primary gateway for transporting surface heat into deep ocean. The surface warming over the subpolar ocean is highly coupled to the warming in the deep ocean [32].

Figure 3.
(A) Climatology ocean water temperature (shading) and density (contours). (B) Climatological streamfunction of globally meridional overturning circulation. Results based on the ocean reanalysis dataset Simple Ocean Data Assimilation (SODA2.2.0, 1948–2008). Note that the y-axis has been scaled in order to better present the entire vertical structure.
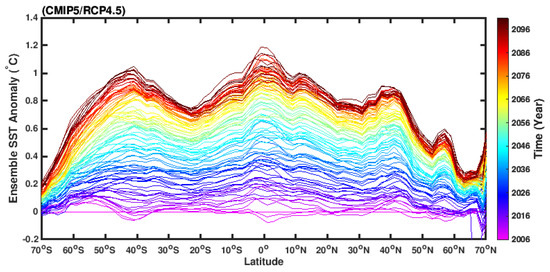
For these reasons, under global warming, the SST increases over the low latitude are much faster than that over the subpolar oceans. As shown in Figure 4, under the RCP4.5 scenario, the SST trend over the low-latitude (between S and N) was on the order of 0.8–1.2 degree Celsius, while the SST trend over the subpolar ocean (between and ) was on the order of 0.2–0.8 degree Celsius in 2100. A warmer low-latitude surface ocean tended to enhance the ocean heat release into the atmosphere, and vice versa for the subpolar ocean. Such mechanism maintained a stronger heat imbalance between the low and high latitudes, in particularly over the mid-latitude bands.

Figure 4.
Multi-model ensemble zonal mean sea surface temperature anomaly (in comparison with the SST ( sea surface temperature) between 2006–2010) under the CMIP5/RCP4.5 scenario. The coloured lines represent individual years.
Over the North Atlantic Ocean, the weakening of AMOC under global warming [33,34], transports less heat from low-latitude towards higher latitudes, which further reduces the ocean heat release over the Northern Atlantic subpolar ocean, causing an additional enhanced meridional heat imbalance over there.
5. Discussion and Conclusions
In this study, we presented both observational and modelling trends of ocean surface THF. The results showed more ocean heat uptake over the subpolar oceans than that over the tropical and subtropical oceans. We proposed that the greenhouse gases induced warming was trapped within the upper ocean over the low latitude zones, while the heat could transport into the deep ocean over the subpolar regions. The different responses of ocean warming to the radiation forcing introduced an enhanced atmospheric heat imbalance over the mid-latitude.
The mid-latitude bands are the regions where the storms, jet stream, and westerlies occur [35,36], primarily due to the strong meridional heat imbalance [37]. Under global warming, a strengthening mid-latitude heat imbalance are proposed to force stronger westerlies, jet stream, and storms, as illustrated by model projections [38,39].
It is believed that polar atmosphere experiences more warming than the lower latitudes under global warming, a phenomenon which is called polar amplification [18,19]. In contrast to atmospheric polar amplification, however, our results indicated that the tropical and subtropical oceans tended to warm faster due to ocean stratification. Regarding the low-latitude bands already being the warmest regions on the Earth, the faster ocean surface warming will put additional living pressure to the humans inhabited there.
The subtropical oceans are characterized by more evaporation than precipitation, associating with dry climate over the adjacent continents, such as the Sahara Desert and semi-arid Australia. In contrast, the subpolar oceans are featured by more precipitation than evaporation, contributing to a wet climate, like Europe. The strengthening heat imbalance between the subtropical and subpolar ocean is supposed to reinforce the evaporation over the subtropical regions and strengthen the water cycle, as revealed by the ocean salinity trend [40,41,42].
Last but not least, we identified an enhanced meridional heat imbalance based on the past four decades of observations and two transient experiments (historical and RCP4.5) from the CMIP5. In both cases, the climates are approaching into a warming world, in which the ocean keeps absorbing heat from the atmosphere. However, we need to point out that such processes are likely to occur only in a transient climate. In an equilibrium warmer climate, when the ocean does not experience a warming trend, the situation may be different from what we have observed here.
Author Contributions
Conceptualization, H.Y.; methodology, H.Y. and X.S.; validation, G.L., X.S. and C.L.; investigation, X.S.; resources, G.L.; writing–original draft preparation, H.Y.; writing–review and editing, G.L., X.S. and C.L.; visualization, H.Y. and X.S.; supervision, G.L.
Funding
This research was funded in part through a grant: Global sea level change since the Mid Holocene: Background trends and climate-ice sheet feedbacks from the Deutsche Forschungsgemeinschaft (DFG) as part of the Special Priority Program (SPP)-1889 “Regional Sea Level Change and Society” (SeaLevel). X.S. received funding through the project PACMEDY. G.L. was supported by the BMBF through PACES and REKLIM.
Acknowledgments
We acknowledge the helpful discussions with Uta Krebs-Kanzow. We acknowledge the World Climate Research Programme’s Working Group on Coupled Modelling, which is responsible for CMIP5, and we thank the climate modelling groups (listed in Table 1 of this paper) for producing and making available their model output. For CMIP, the U.S. Department of Energy’s Program for Climate Model Diagnosis and Intercomparison provides coordinating support and led development of software infrastructure in partnership with the Global Organization for Earth System Science Portals.
Conflicts of Interest
The authors declare no conflict of interest.
References
- Trenberth, K.E.; Solomon, A. The global heat balance: Heat transports in the atmosphere and ocean. Clim. Dyn. 1994, 10, 107–134. [Google Scholar] [CrossRef]
- Cronin, M.F.; Gentemann, C.L.; Edson, J.B.; Ueki, I.; Bourassa, M.; Brown, S.; Clayson, C.A.; Fairall, C.; Farrar, J.T.; Gille, S.T.; et al. Air-sea fluxes with a focus on heat and momentum. Front. Mar. Sci. 2019, 6, 430. [Google Scholar] [CrossRef]
- Gulev, S.K.; Mojib, L.; Noel, K.; Wonsun, P.; Klaus Peter, K. North Atlantic Ocean control on surface heat flux on multidecadal timescales. Nature 2013, 499, 464–467. [Google Scholar] [CrossRef] [PubMed]
- Herman, A. Trends and variability of the atmosphere–ocean turbulent heat flux in the extratropical Southern Hemisphere. Sci. Rep. 2015, 5, 14900. [Google Scholar] [CrossRef] [PubMed]
- Cione, J.J.; Raman, S.; Pietrafesa, L.J. The effect of Gulf Stream-induced baroclinicity on US East Coast winter cyclones. Mon. Weather Rev. 1993, 121, 421–430. [Google Scholar] [CrossRef]
- Small, R.D.; DeSzoeke, S.; Xie, S.; O’neill, L.; Seo, H.; Song, Q.; Cornillon, P.; Spall, M.; Minobe, S. Air–sea interaction over ocean fronts and eddies. Dyn. Atmos. Oceans 2008, 45, 274–319. [Google Scholar] [CrossRef]
- Gao, S.; Chiu, L.S.; Shie, C.L. Trends and variations of ocean surface latent heat flux: Results from GSSTF2c data set. Geophys. Res. Lett. 2013, 40, 380–385. [Google Scholar] [CrossRef]
- Wyrtki, K. Water displacements in the Pacific and the genesis of El Niño cycles. J. Geophys. Res. Oceans 1985, 90, 7129–7132. [Google Scholar] [CrossRef]
- Chongyin, L. Interaction between anomalous winter monsoon in East Asia and El Nino events. Adv. Atmos. Sci. 1990, 7, 36–46. [Google Scholar] [CrossRef]
- Bove, M.C.; Elsner, J.B.; Landsea, C.W.; Niu, X.; O’Brien, J.J. Effect of El Niño on US landfalling hurricanes, revisited. Bull. Am. Meteorol. Soc. 1998, 79, 2477–2482. [Google Scholar] [CrossRef]
- Ghosh, R.; Müller, W.A.; Baehr, J.; Bader, J. Impact of observed North Atlantic multidecadal variations to European summer climate: A linear baroclinic response to surface heating. Clim. Dyn. 2017, 48, 3547–3563. [Google Scholar] [CrossRef]
- Zampieri, M.; Toreti, A.; Schindler, A.; Scoccimarro, E.; Gualdi, S. Atlantic multi-decadal oscillation influence on weather regimes over Europe and the Mediterranean in spring and summer. Glob. Planet. Chang. 2017, 151, 92–100. [Google Scholar] [CrossRef]
- Yang, H.; Liu, J.; Lohmann, G.; Shi, X.; Hu, Y.; Chen, X. Ocean-atmosphere dynamics changes associated with prominent ocean surface turbulent heat fluxes trends during 1958–2013. Ocean Dyn. 2016, 66, 353–365. [Google Scholar] [CrossRef]
- Yang, H.; Lohmann, G.; Wei, W.; Dima, M.; Ionita, M.; Liu, J. Intensification and poleward shift of subtropical western boundary currents in a warming climate. J. Geophys. Res. Oceans 2016, 121, 4928–4945. [Google Scholar] [CrossRef]
- Clarke, R.A.; Gascard, J.C. The formation of Labrador Sea water. Part I: Large-scale processes. J. Phys. Oceanogr. 1983, 13, 1764–1778. [Google Scholar] [CrossRef]
- Moore, G.; Pickart, R.S.; Renfrew, I.A.; Våge, K. What causes the location of the air-sea turbulent heat flux maximum over the Labrador Sea? Geophys. Res. Lett. 2014, 41, 3628–3635. [Google Scholar] [CrossRef]
- Scholz, P.; Kieke, D.; Lohmann, G.; Ionita, M.; Rhein, M. Evaluation of Labrador Sea Water formation in a global Finite-Element Sea-Ice Ocean Model setup, based on a comparison with observational data. J. Geophys. Res. Oceans 2014, 119, 1644–1667. [Google Scholar] [CrossRef]
- Polyakov, I.V.; Alekseev, G.V.; Bekryaev, R.V.; Bhatt, U.; Colony, R.L.; Johnson, M.A.; Karklin, V.P.; Makshtas, A.P.; Walsh, D.; Yulin, A.V. Observationally based assessment of polar amplification of global warming. Geophys. Res. Lett. 2002, 29, 25. [Google Scholar] [CrossRef]
- Holland, M.M.; Bitz, C.M. Polar amplification of climate change in coupled models. Clim. Dyn. 2003, 21, 221–232. [Google Scholar] [CrossRef]
- Yu, L.; Weller, R.A. Objectively Analyzed Air–Sea Heat Fluxes for the Global Ice-Free Oceans (1981–2005). Bull. Am. Meteorol. Soc. 2007, 88, 527–540. [Google Scholar] [CrossRef]
- Kalnay, E.; Kanamitsu, M.; Kistler, R.; Collins, W.; Deaven, D.; Gandin, L.; Iredell, M.; Saha, S.; White, G.; Woollen, J.; et al. The NCEP/NCAR 40-year reanalysis project. Bull. Am. Meteorol. Soc. 1996, 77, 437–471. [Google Scholar] [CrossRef]
- Kanamitsu, M.; Ebisuzaki, W.; Woollen, J.; Yang, S.K.; Hnilo, J.; Fiorino, M.; Potter, G. NCEP-DOE AMIP-II Reanalysis (r-2). Bull. Am. Meteorol. Soc. 2002, 83, 1631–1643. [Google Scholar] [CrossRef]
- Dee, D.P.; Uppala, S.; Simmons, A.; Berrisford, P.; Poli, P.; Kobayashi, S.; Andrae, U.; Balmaseda, M.; Balsamo, G.; Bauer, D.P.; et al. The ERA-Interim reanalysis: Configuration and performance of the data assimilation system. Q. J. R. Meteorol. Soc. 2011, 137, 553–597. [Google Scholar] [CrossRef]
- Levitus, S.; Antonov, J.I.; Boyer, T.P.; Baranova, O.K.; Garcia, H.E.; Locarnini, R.A.; Mishonov, A.V.; Reagan, J.; Seidov, D.; Yarosh, E.S.; et al. World ocean heat content and thermosteric sea level change (0–2000 m), 1955–2010. Geophys. Res. Lett. 2012, 39. [Google Scholar] [CrossRef]
- Carton, J.A.; Giese, B.S. A reanalysis of ocean climate using Simple Ocean Data Assimilation (SODA). Mon. Weather Rev. 2008, 136, 2999–3017. [Google Scholar] [CrossRef]
- Taylor, K.E.; Stouffer, R.J.; Meehl, G.A. An overview of CMIP5 and the experiment design. Bull. Am. Meteorol. Soc. 2012, 93, 485–498. [Google Scholar] [CrossRef]
- Frankignoul, C.; Gastineau, G.; Kwon, Y.O. Estimation of the SST response to anthropogenic and external forcing and its impact on the Atlantic multidecadal oscillation and the Pacific decadal oscillation. J. Clim. 2017, 30, 9871–9895. [Google Scholar] [CrossRef]
- Rayner, N.; Parker, D.E.; Horton, E.; Folland, C.K.; Alexander, L.V.; Rowell, D.; Kent, E.; Kaplan, A. Global analyses of sea surface temperature, sea ice, and night marine air temperature since the late nineteenth century. J. Geophys. Res. Atmos. 2003, 108. [Google Scholar] [CrossRef]
- Ionita, M.; Felis, T.; Lohmann, G.; Rimbu, N.; Pätzold, J. Distinct modes of East Asian Winter Monsoon documented by a southern Red Sea coral record. J. Geophys. Res. Oceans 2014, 119, 1517–1533. [Google Scholar] [CrossRef]
- Cheng, W.; Chiang, J.C.; Zhang, D. Atlantic Meridional Overturning Circulation (AMOC) in CMIP5 Models: RCP and Historical Simulations. J. Clim. 2013, 26, 7187–7197. [Google Scholar] [CrossRef]
- Chen, X.; Tung, K.K. Global surface warming enhanced by weak Atlantic overturning circulation. Nature 2018, 559, 387. [Google Scholar] [CrossRef]
- Manabe, S.; Bryan, K.; Spelman, M.J. Transient response of a global ocean-atmosphere model to a doubling of atmospheric carbon dioxide. J. Phys. Oceanogr. 1990, 20, 722–749. [Google Scholar] [CrossRef]
- Dima, M.; Lohmann, G. Evidence for two distinct modes of large-scale ocean circulation changes over the last century. J. Clim. 2010, 23, 5–16. [Google Scholar] [CrossRef]
- Caesar, L.; Rahmstorf, S.; Robinson, A.; Feulner, G.; Saba, V. Observed fingerprint of a weakening Atlantic Ocean overturning circulation. Nature 2018, 556, 191. [Google Scholar] [CrossRef]
- Nakamura, H.; Sampe, T.; Tanimoto, Y.; Shimpo, A. Observed associations among storm tracks, jet streams and midlatitude oceanic fronts. Earth’s Clim. Ocean Atmos. Interact. Geophys. Monogr. 2004, 147, 329–345. [Google Scholar]
- Hudson, R. Measurements of the movement of the jet streams at mid-latitudes, in the Northern and Southern Hemispheres, 1979 to 2010. Atmos. Chem. Phys. 2012, 12, 7797–7808. [Google Scholar] [CrossRef]
- Pierrehumbert, R.; Swanson, K. Baroclinic instability. Annu. Rev. Fluid Mech. 1995, 27, 419–467. [Google Scholar] [CrossRef]
- Knutson, T.; Camargo, S.J.; Chan, J.C.; Emanuel, K.; Ho, C.H.; Kossin, J.; Mohapatra, M.; Satoh, M.; Sugi, M.; Walsh, K.; et al. Tropical Cyclones and Climate Change Assessment: Part II. Projected Response to Anthropogenic Warming. Bull. Am. Meteorol. Soc. 2019. [Google Scholar] [CrossRef]
- Russell, J.L.; Dixon, K.W.; Gnanadesikan, A.; Stouffer, R.J.; Toggweiler, J. The Southern Hemisphere westerlies in a warming world: Propping open the door to the deep ocean. J. Clim. 2006, 19, 6382–6390. [Google Scholar] [CrossRef]
- Durack, P.J.; Wijffels, S.E. Fifty-year trends in global ocean salinities and their relationship to broad-scale warming. J. Clim. 2010, 23, 4342–4362. [Google Scholar] [CrossRef]
- Durack, P.J.; Wijffels, S.E.; Matear, R.J. Ocean salinities reveal strong global water cycle intensification during 1950 to 2000. Science 2012, 336, 455–458. [Google Scholar] [CrossRef] [PubMed]
- Putnam, A.E.; Broecker, W.S. Human-induced changes in the distribution of rainfall. Sci. Adv. 2017, 3, e1600871. [Google Scholar] [CrossRef] [PubMed]
© 2019 by the authors. Licensee MDPI, Basel, Switzerland. This article is an open access article distributed under the terms and conditions of the Creative Commons Attribution (CC BY) license (http://creativecommons.org/licenses/by/4.0/).