Article

In-Field Emission Measurements from Biogas and Liquified Petroleum Gas (LPG) Stoves

1
Environmental Engineering, University of Illinois Urbana-Champaign, Urbana-Champaign, IL 61801, USA
2
Mountain Air Engineering, Cottage Grove, OR 97424, USA
3
Schatz Energy Research Center, Arcata, CA 95521, USA
4
Independent Researcher, Kathmandu 44600, Nepal
5
Center for Rural Technology, Lalitpur 44600, Nepal
6
Anthropology, University of Illinois Urbana-Champaign, Urbana-Champaign, IL 61801, USA
7
Berkeley School of Public Health, University of California, Berkeley, CA 94720, USA
8
Society for Legal & Environmental Analysis and Development Research (LEADERS Nepal), Kathmandu 44600, Nepal
*
Author to whom correspondence should be addressed.
Atmosphere 2019, 10(12), 729; https://doi.org/10.3390/atmos10120729
Submission received: 26 September 2019 / Revised: 10 November 2019 / Accepted: 13 November 2019 / Published: 21 November 2019
(This article belongs to the Special Issue Real World Air Pollutant Emissions from Combustion Sources)

Abstract

:
Household air pollution from solid fuel cooking causes millions of deaths each year and contributes to climate change. These emissions can be reduced if households transition to cleaner cooking fuels such as LPG or biogas, yet emission measurements during actual use are limited. Six LPG and 57 biogas cooking event emissions were measured during typical cooking practices in Nepal. Emission factors are reported for elemental carbon (EC), organic carbon (OC), particulate matter (PM 2.5 ), and carbon monoxide (CO) and compared to measurements from wood stoves in the same households. Biogas cooking emission factors were 7.4 ± 10.9 mg MJ 1 for PM 2.5 and 0.2 ± 0.3 mg MJ 1 for EC on a fuel energy basis, and were not significantly different from LPG stoves (9.5 ± 6.8 mg MJ 1 for PM 2.5 and 0.3 ± 0.3 mg MJ 1 for EC, p > 0.05). Wood stoves emitted 50 times more PM 2.5 than biogas on a fuel energy basis and 230 times more EC. EC emissions were about 3% of total particle emissions from biogas and LPG stoves. Most PM 2.5 emissions from gas stoves were attributed to food frying and stove ignition (90%), not the gas fuel (10%), implying that there is a limit to emission reductions that can be achieved with improved fuels.

1. Introduction

Three billion people cook with solid fuels, such as wood, dung, and coal [1], emitting pollutants that contribute to climate change and poor health. Solid fuel cooking causes mortality and poor health, largely due to exposure to indoor emissions of particulate matter with an aerodynamic diameter smaller than 2.5 μ m (PM 2.5 ) [2]. Emission rates need to be hundreds of times lower than those for traditional stoves burning solid fuels to reach World Health Organization (WHO) guidelines for indoor air quality [3,4,5] and interventions with improved solid fuel stoves typically do not demonstrate improved health outcomes [6,7,8]. Thus, health-motivated national and multinational initiatives often advocate for household transitions to clean fuels, such as liquified petroleum gas (LPG) or electricity [9]. However, both have drawbacks, especially for the rural poor. For LPG, supply chain development in rural communities has been slow and ongoing fuel cost is a barrier to adoption for cash-strained households [10]. Electricity access requires large infrastructure development and often, in rural or developing regions, has not provided sufficient power levels or reliability required for cooking. Nonetheless, these clean fuels are rapidly penetrating into cooking markets.
Biogas is a less common cooking fuel and is a mixture of gases produced from anaerobic digestion of carbonaceous material, such as brush, leaves, dung, and agricultural waste, which are also commonly directly combusted as solid fuels for cooking. Biogas digester feedstocks are generated or collected freely by many rural households, so systems generally have low operating costs and are not reliant on distribution networks beyond the household or community, yet upfront installation costs can be prohibitively high for many households.
Biogas has global use for household cooking, and has been promoted by governments and NGOs for decades. In India, 0.4% of households use biogas as a primary fuel (about one million households), and many more likely use it a as secondary fuel [11]. There is evidence that biogas systems exhibit a high level of sustained use, unlike many improved biomass household cooking technologies in South Asia [12]. Digesters that are over 15 years old can be found in and around Kathmandu valley.
Laboratory-based measurements of biogas stoves suggest pollutant emissions are low and similar to LPG [13,14]; however, no field-based assessments exist to confirm whether biogas in actual homes exhibit similar levels of performance, and field measurements of LPG emissions are also rare, consisting of only a few water boiling tests [13,14,15]. Field emission measurements include factors that are not typically tested in current laboratory methods, including user variability, fuel variability, and emissions from food during cooking. Field measurements are necessary to improve assessments of health and climate impacts of household transitions to gas fuels. This study provides emission factors of climate and health impacting pollutants that were collected in the field and encompass the complexities of gas fuel cooking under real-world use cases.
Emissions were measured from 79 cooking events (16 wood, 57 biogas, and 6 LPG) in households in Kavre, Nepal, a region where biogas and LPG stoves are common. Health and climate relevant pollutants were measured, including black carbon, measured as elemental carbon (EC), organic carbon (OC), PM 2.5 , CO, CO 2 , and optical particle scattering and absorption from biogas, LPG and wood stoves. The analysis included seasonality, emission factor comparisons, fuel and food emissions from cooking, and an assessment of the climate impact of aerosol emissions from cooking using different fuels. These measurements were compared to the International Standards Organization (ISO) laboratory performance tiers (ISO TR 19867-3), providing a field measurement benchmark for consideration in ongoing ISO guideline development [3].

2. Materials and Methods

Emissions were measured from cooking events in 20 households in Kavre, Nepal, over three seasons.

2.1. Cooking Events

Cooking events were defined as the period from lighting to completion of activities on the stove. All cooking events were uncontrolled; they were conducted by participants using their own stoves in their own homes. Multiple cooking events were measured in each home, as summarized in Table S3.
Stoves were lit with matches, butane lighters, or by transferring fire from another stove with paper; neither gas nor biogas stoves had a spark ignition system. The typical meal observed was rice and lentils cooked in a pressure cooker served with vegetables that were fried in a bowl-shaped aluminum or iron pot locally known as “karai”. Most emission measurements were of lunch or dinner meals because breakfasts were small, typically tea and leftovers from the previous evening meal. Wood, LPG, and biogas fuels were all used to cook meals, but wood stoves were also used for non-meal activities, including cooking large pots (10–30 liters) of animal food and heating water. Periods within each cooking event were identified as stove lighting, boiling, frying, or other (unknown) based on observations during the event.
Households were asked not to cook using additional stoves while measurements were being conducted. However, this did not prevent all background pollutants, and observations in the community suggested that most background contamination was due to outdoor wood cooking by neighborhood homes.

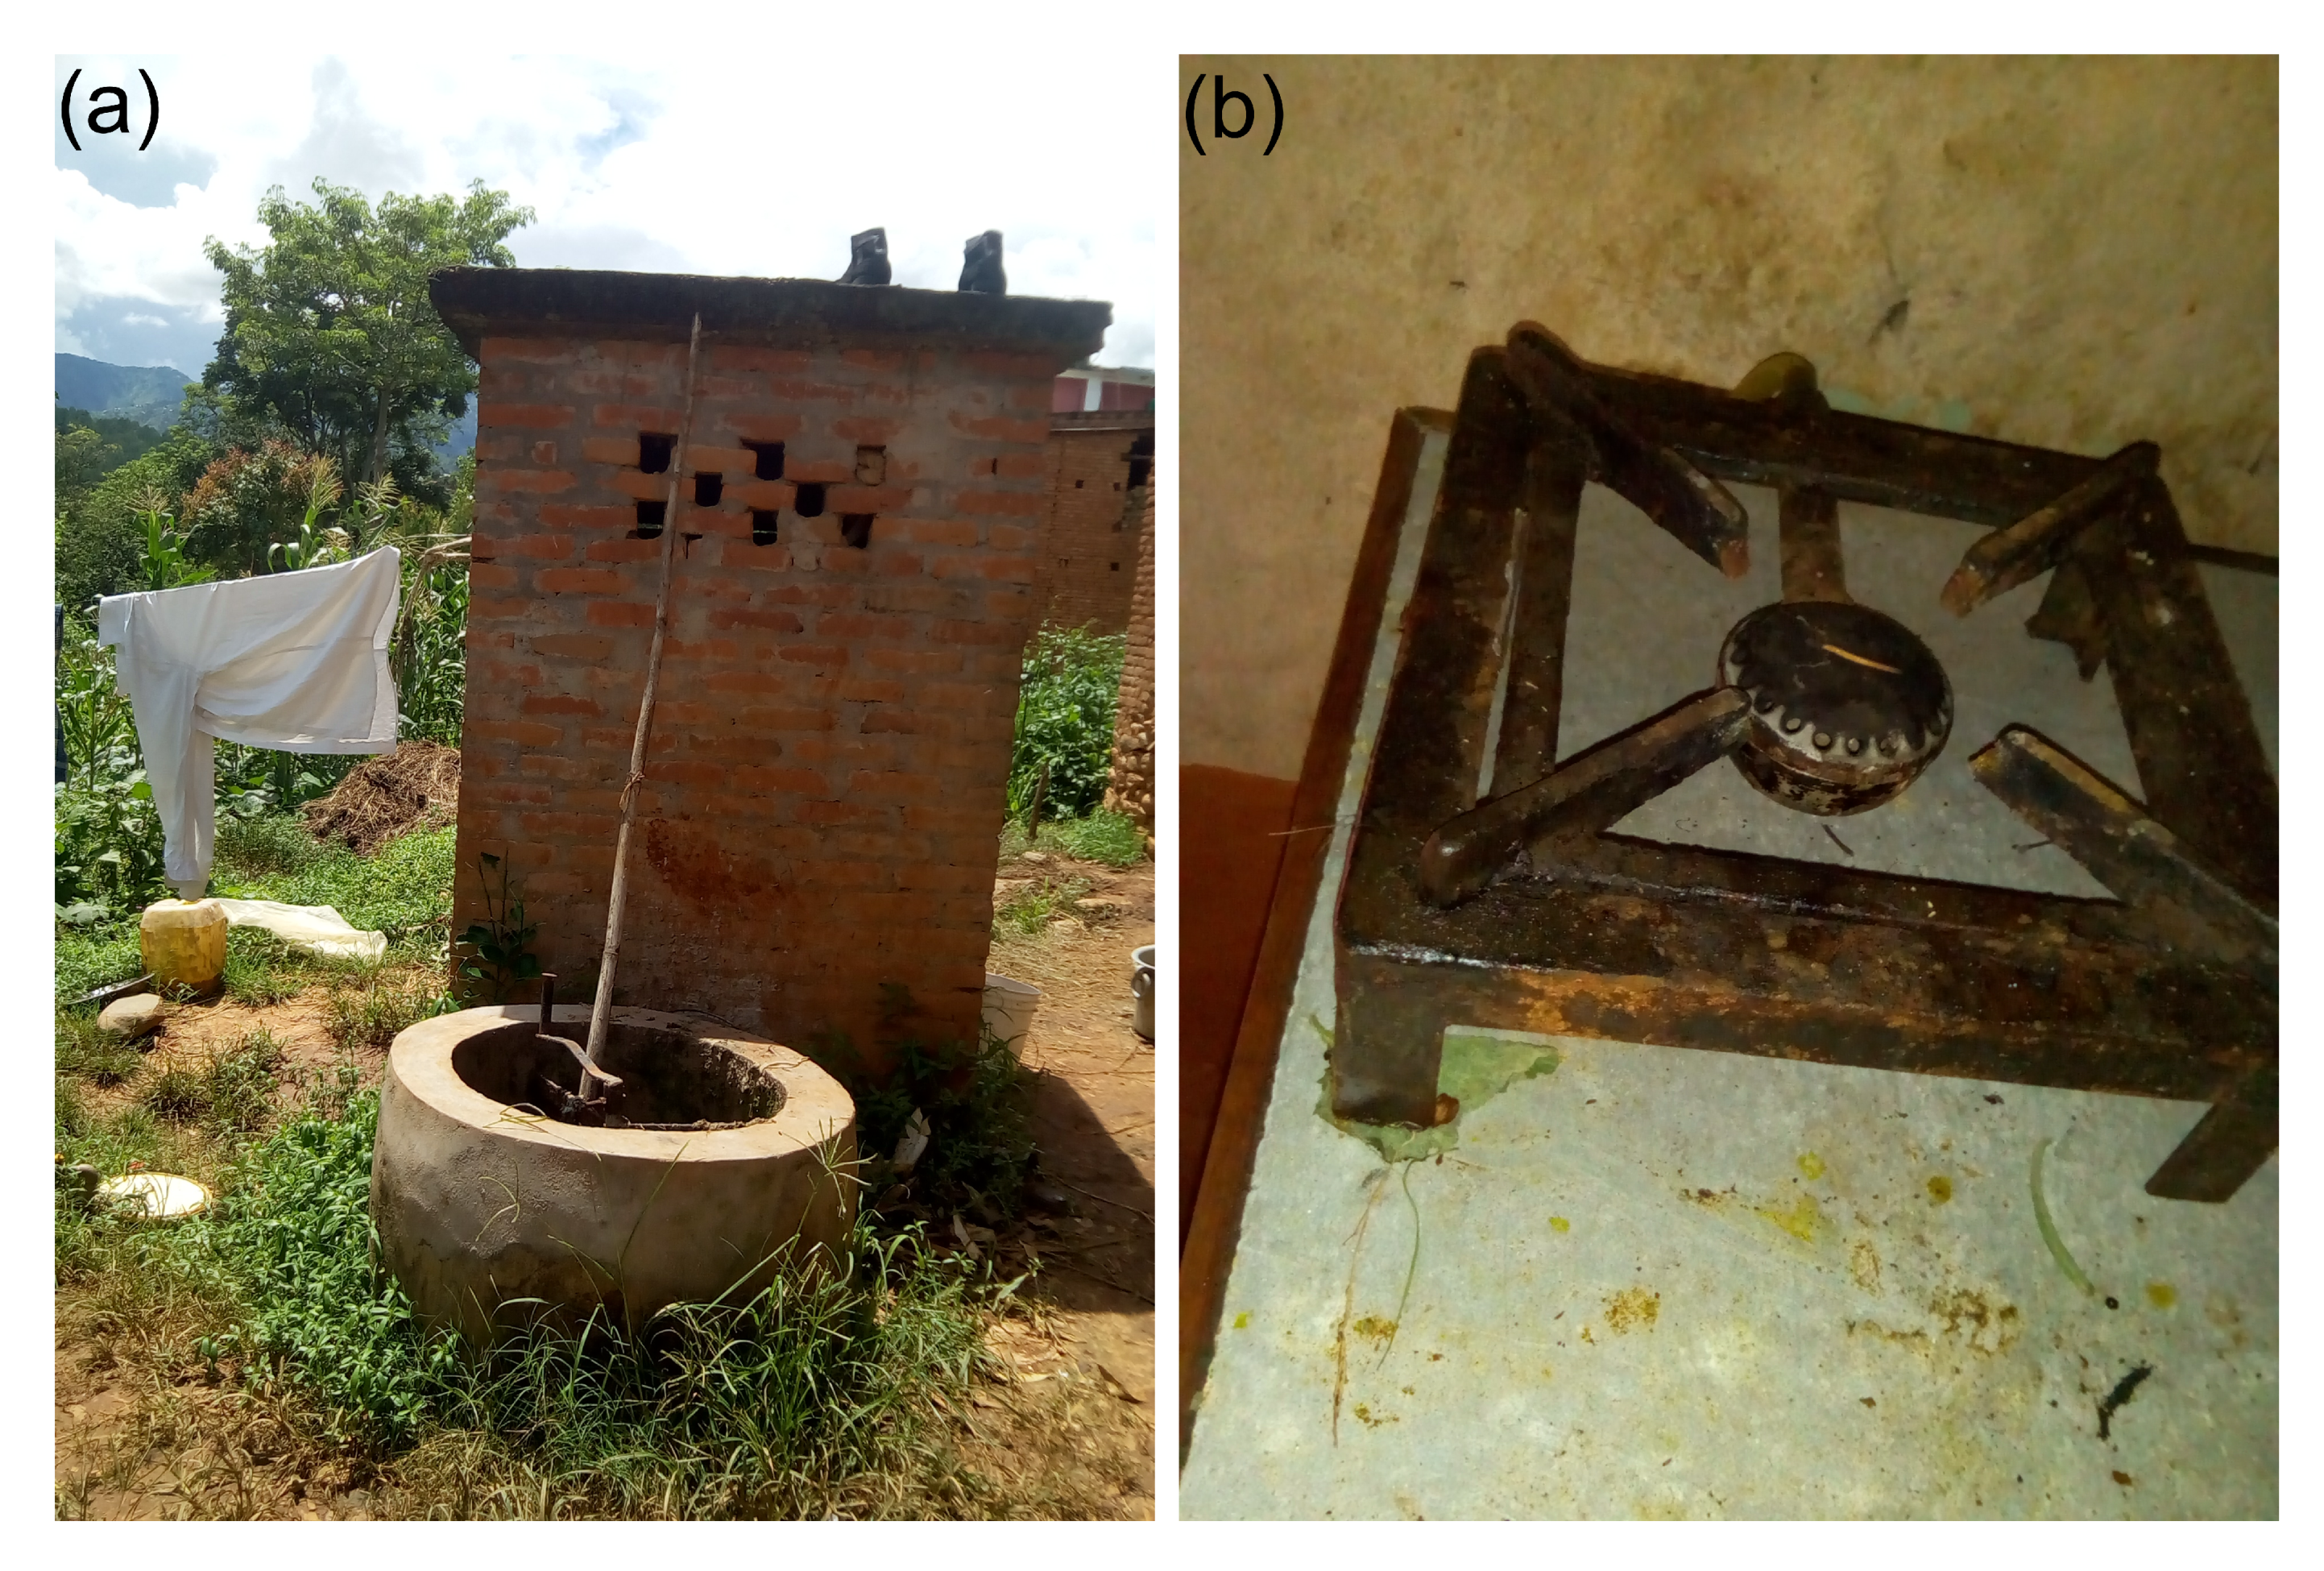
2.2. Stoves and Fuels

Households in the study had between one and five stoves (median: 3, Table S2). Of the 20 households monitored, 19 had a LPG stove, 15 had biogas, and 17 had wood stoves.
Biogas stoves were common in households in the study region, where fixed-dome anaerobic biogas digesters had been installed as part of Nepali government initiatives between 1997 and 2009. The systems consisted of an underground anaerobic digestion tank (4, 6, or 8 m 3 ), an above-ground inlet port with a mixing chamber for adding animal dung waste (Figure 1a), and a sludge outlet pit. In addition, underground plumbing to a latrine allowed human waste to be added directly to the digester. A pipe from the digestion tank to the household was connected by flexible hose to a single burner stove (Figure 1b). Installation diagrams of the biogas systems are shown in Figure S1. Biogas stove owners reported using them daily during all seasons. However, they acknowledged that gas availability did fluctuate seasonally, affecting how long the stove could be operated.
In biogas stoves, an air valve controlled the amount of primary air that was mixed with biogas before the gas passed through the burner (Figure S4). The biogas system instruction manual indicated that the primary air valve should be closed to light the stove, and open during cooking, but the valves were usually stuck in one position, and were not adjusted, suggesting that the fuel-to-air ratio might not be optimum. During winter and spring seasons, the position of the primary air valve was recorded for each biogas cooking event as open (9/35), half open (13/35), or closed (13/35).
One water boiling test [16] was conducted on a similar biogas stove and digester at the National Renewable Energy Test Station (RETS, Kathmandu, Nepal) during winter. Emissions were measured for 20 min with the primary air valve closed and 20 min with the valve open. The results from this test are discussed in Section S31.
LPG stoves were all two-burner aluminum body stoves with 30 kg replaceable LPG tanks, containing about 15 kg of gas (Figure S3). Households that used biogas and LPG all had biogas stoves for 4–16 years before purchasing an LPG stove. A typical use case was for families to cook with the biogas stove until their biogas was depleted and then complete their cooking task on an LPG stove.
Wood stoves were homemade from mud or bricks, typical of biomass stoves found throughout South Asia. In most wood stove cooking events (15/16), wood and corncobs were used as fuel, and in one event, only wood was used. Dung, while available and used regionally as a cooking fuel, was only observed used to produce biogas.

2.3. Description of Seasons

Sampling was conducted in three seasons: monsoon (hot and rainy), winter (cold and dry), and spring (warm and mostly dry). Table S1 shows the sampling periods and the weather conditions during each field campaign. These seasons were selected based on historical weather data.

2.4. Emission Sampling

Emissions were measured with custom instrumentation (Fumitron, University of Illinois Urbana-Champaign, and Musakonak Gobargas, Mountain Air Engineering). The Fumitron is similar to and modeled from designs used previously for cookstove emission measurements [17,18,19]. Concentrations were measured of CO 2 , CO, PM 2.5 , OC, EC, and particle light scattering and absorption (Tricolor Absorption Photometer, Betchtel). Sensor and measurement details are discussed in Section S7.
Adjustments to the sampling system were made to accommodate both high particle concentrations from wood stoves and low particle concentrations from gas stoves. For wood stoves, forced dilution was added at 1:1 to 1:2 (dilution:sample) in addition to natural plume dilution. To reduce particle loading on filters, a low flow cyclone was used (1.5 lpm, 2.5 μ m cut point), keeping total system flows under 1.5 lpm. The Polytetrafluoroethylene (PTFE) and quartz fiber filter flows were set low to 500 ccm, and the TAP flow was set to 50 ccm. For gas stoves, no forced dilution was added. To maximize particle loading, the volume of air passed through the filters was increased. This was achieved by replacing the cyclone with one with a higher flow (3 lpm, 2.5 μ m cut point). The PTFE and quartz filter flows could then be set higher, to 1250 ccm, and the TAP flow was set to 500 ccm. In addition, the PM light scattering sensor sensitivity was increased by a factor of eight for gas stoves relative to wood stoves.
Adjustments were also made in the OCEC analysis to accommodate EC filter loadings near the detection limit of the OCEC analyzer. In all biogas and LPG emission samples, the area of the filter used in the analysis was tripled, from 1 cm 2 to 3 cm 2 , thus lowering the detection limit. This was accomplished by loading two 1.5 cm 2 filter punches on top of each other in the instrument. The bottom filter punch was analyzed a second time to confirm that all carbon mass had been released in the initial run (Section S23).

2.5. Data Analysis Methods

Emission factors in grams of pollutant per kilogram dry fuel (g kg 1 ) and grams of pollutant per megajoule dry fuel (g MJ 1 ) were calculated using the carbon-balance method, which relies on conservation of carbon mass before and after combustion [14,17,18], and is described in Section S9. In addition, the mass scattering cross-section (MSC) is the scattering (530 nm) observed for a given aerosol mass, and is useful to translate real-time scattering measurements to approximate mass measurements. The mass absorption cross-section (MAC EC ) is an indication of the absorptivity of EC and is defined as the average absorption at 528 nm divided by the EC mass.
Estimates of carbon mass fraction were assumed for wood (0.5 g Cg fuel 1 ) and LPG (0.82 g Cg fuel 1 , using 60% butane and 40% propane), and were calculated for biogas using CO 2 and CH 4 measurements, assuming balance nitrogen (mean: 0.44 ± 0.02 g Cg fuel 1 ). Estimates of lower heating value are required to convert emission factors from base fuel mass (kg) to base fuel energy (MJ); 14.9 MJ kg 1 was used for wood, 46.4 MJ kg 1 was used for LPG, and 55.5 MJ kg 1 multiplied by the mass fraction of CH 4 was used for biogas (mean: 22.7 ± 2.3 MJ kg 1 ). A summary of biogas properties is provided in Section S25.
For real-time analyses, each minute of data was averaged and emission factors were calculated. These are termed “one-minute” averages, while the average of an entire cooking event is termed an “event average”. Statistics are reported at the event level, household level, and activity levels. The ANOVA test was used to test differences and significance was reported at the 0.05 level. Two limits of detection (LOD) were computed for PM 2.5 , OC, and EC. LOD blank was determined from the blank filters and represents the LOD of the filter analysis. LOD background was three times the background standard deviation and represents the LOD given a contaminated background. LOD and uncertainty analyses are detailed in Sections S12–S22).
The forcing per MJ of fuel energy was estimated using global average forcing per emission estimates for BC (approximated as EC) and primary organic aerosol, (POA, approximated as 1.9*OC) found in Bond et al. (2013), Table C1 [20], and methods described in Bond et al. (2011) [21]. These estimates assume that the emissions from the stove fuel are equally distributed across the globe, and do not represent climate responses particular to Nepal. The estimate also does not capture forcing from other species, such as secondary organic aerosols or gases. Further details on the method uncertainty can be found in Bond et al. (2013), Sections 11.8 and 12.6 [20]. This estimate of forcing per consumption of 1 MJ is used to demonstrate the relative climate impact due to the ratio of BC to OM emitted from each cooking fuel. These estimates do not consider the efficiency of the stove, which would change the magnitude, but not the sign of the forcing.

3. Results and Discussion

Table 1 shows fuel energy-based emission factors and MSC for each fuel and season in the measurement dataset. Previous measurements usually report mass-based emission factors, so comparisons with literature values use these units. Note that all other gas fuel emission factors compared from literature were from water boiling and did not include food cooking emissions.

3.1. Wood Stove Emission Factors

Pollutant emission factors were substantially higher from wood compared to gas stoves (p < 0.001, for all gas to wood comparisons). On a fuel energy basis, the CO emission factor from wood was five times higher than biogas and 10 times higher than LPG. Particulate matter emission factors were 50 times higher from wood compared to gas stoves, and the EC emission factor was over 230 times higher than from biogas stoves, and 150 times higher than from LPG stoves (Figure 2). The emission factors and optical characteristics from wood stoves were similar to previous studies of biomass emission factors from South Asia stoves (Section S28).

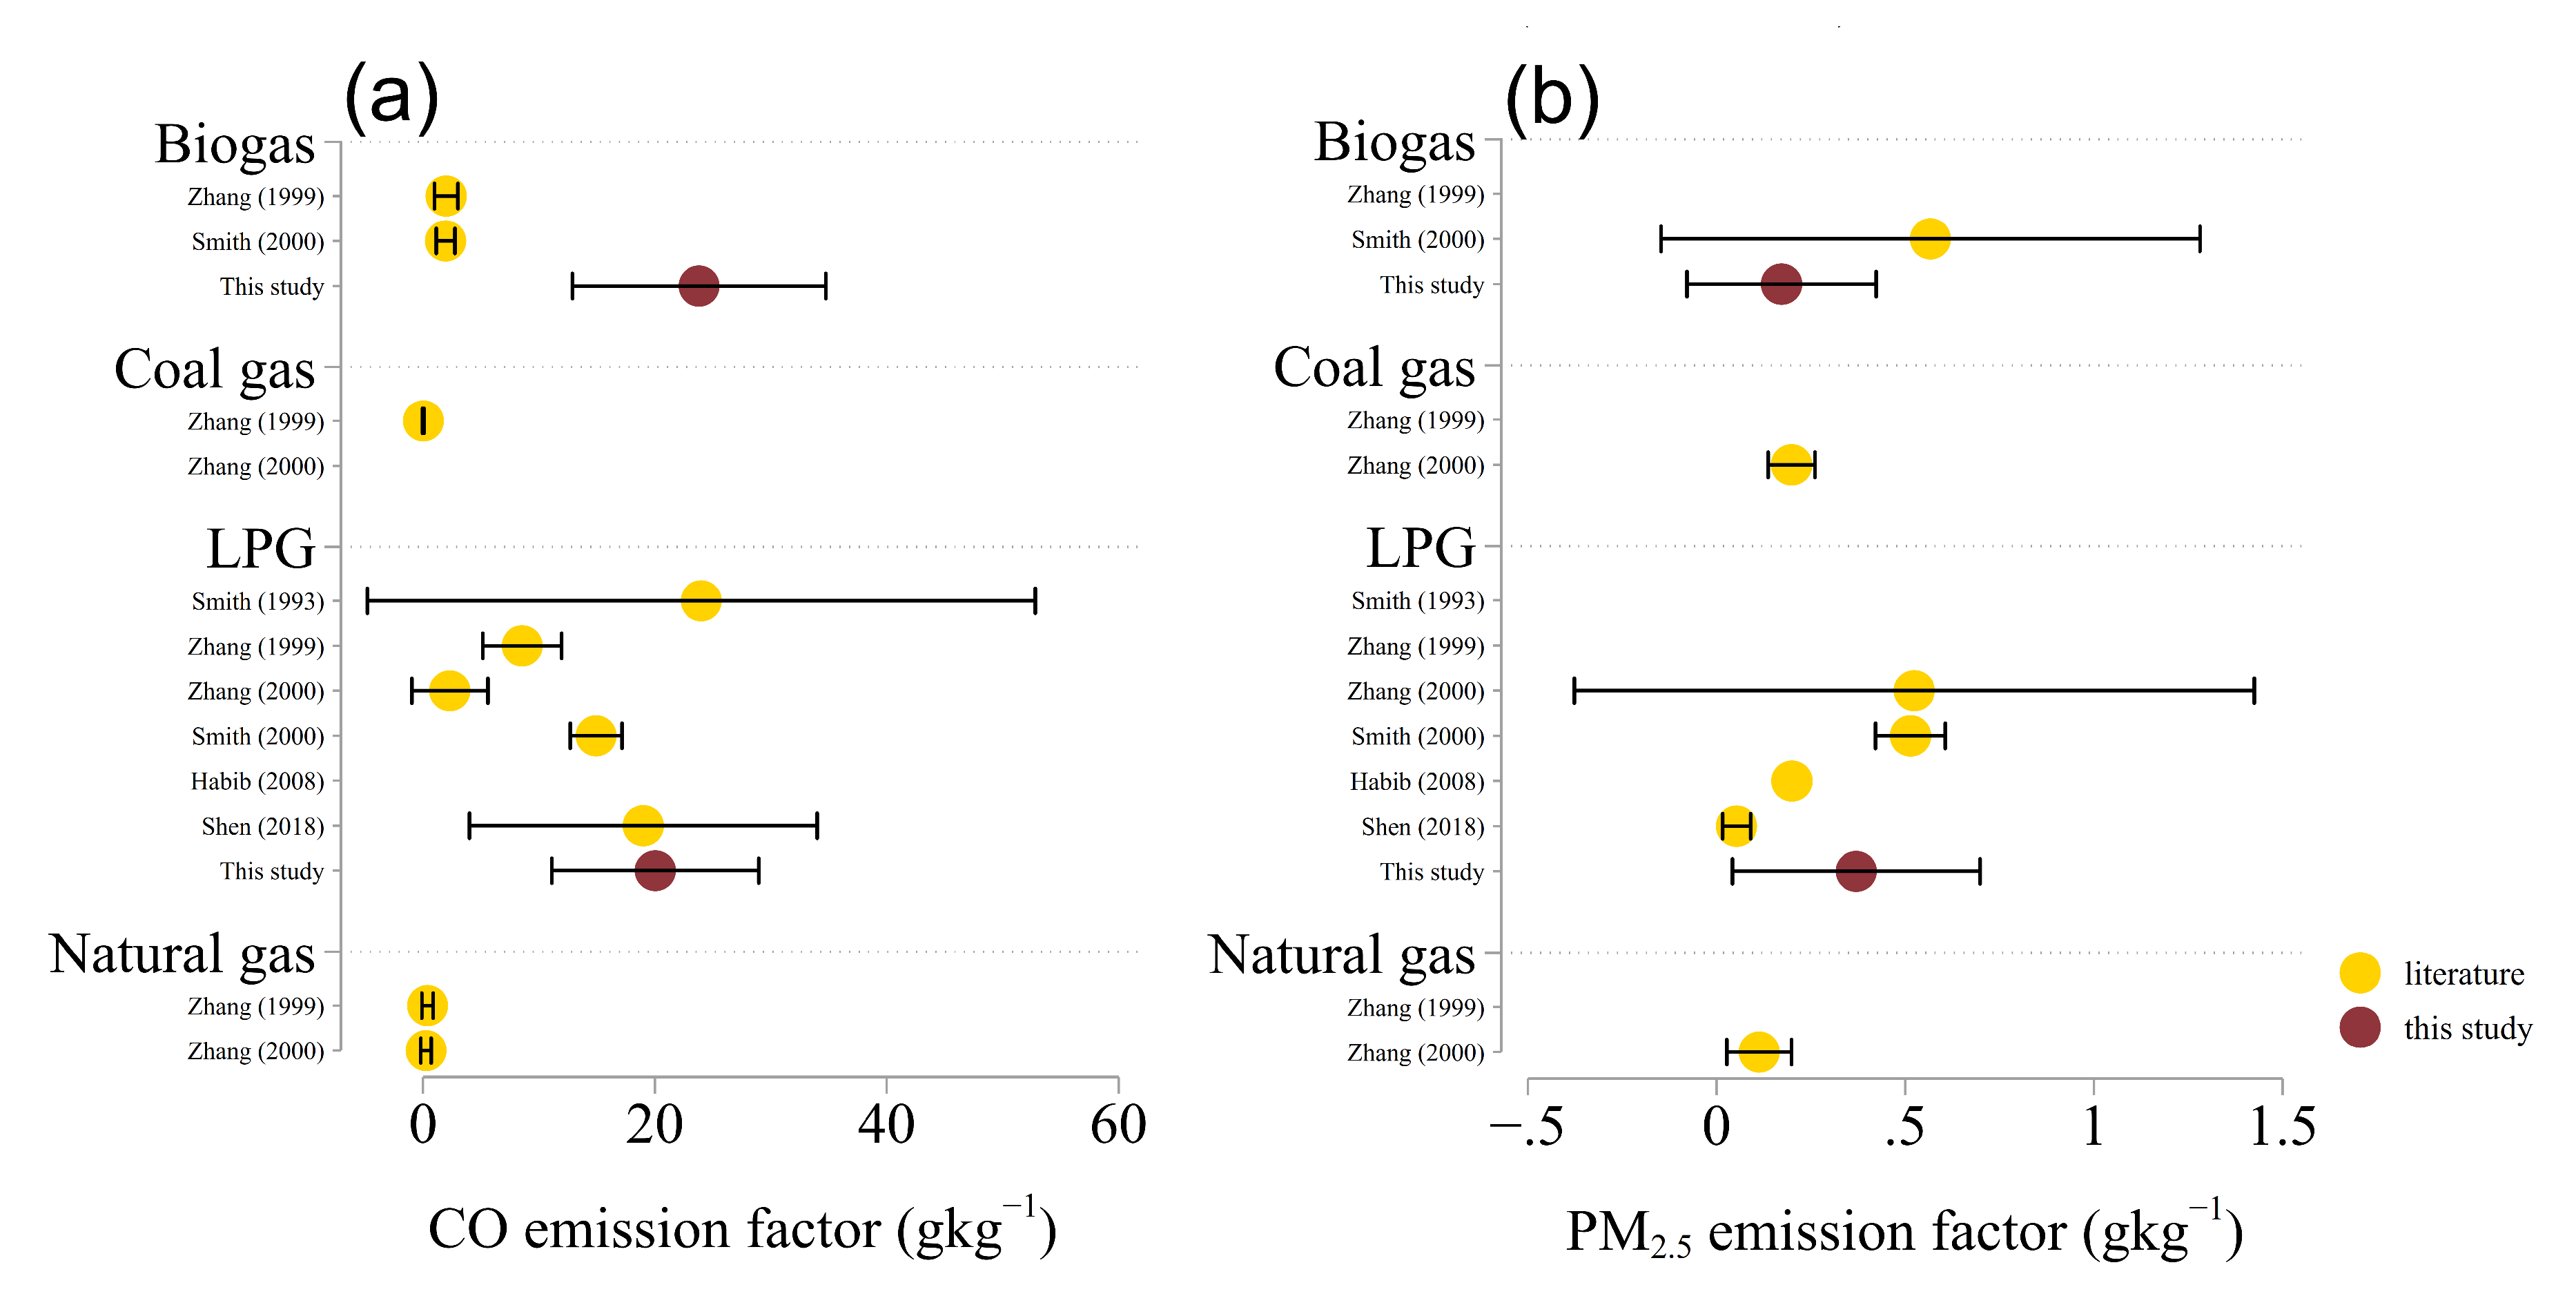
3.2. Biogas and LPG: Carbon Monoxide

Carbon monoxide emission factors from biogas stoves were an average of 1.1 ± 0.5 g MJ 1 (22 ± 10 g kg 1 ) across all seasons. The CO emission factor for LPG was 0.4 ± 0.2 g MJ 1 (20 ± 9 g kg 1 ), about the same as biogas on a fuel-mass basis, and less than half on a fuel energy basis. Figure 3 compares these results to emission factors from gas fuels in previous studies, also compiled in Table S15. Biogas CO emission factors were about 10 times higher than from two laboratory studies (2 ± 1 g kg 1 ) [14,22]. No events were observed that were as low as previous measurements.
In biogas stoves, CO emission factors were influenced by the fuel-to-air mixing ratio, a phenomenon commonly observed in gas combustion [23]. Carbon monoxide emission factors were similar when the air intake valve was open (16 ± 4.0 g kg 1 and half open (17 ± 4.1 g kg 1 ), and nearly twice as high when the valve was closed (33 ± 9.0 g kg 1 , p < 0.001). In the laboratory test, the CO emission factor was three times higher when the valve was closed, corroborating that the highest fuel-to-air ratio decreased the combustion efficiency for this stove design.
The CO emission factors from LPG were similar to those found by Smith et al. (1993) of 24 ± 29 g kg 1 , Smith et al. (2000) of 15 ± 2 g kg 1 , and Shen et al. (2018) of 19 ± 15 g kg 1 [15,22,24]. LPG emission factors of Zhang et al. (1999) and Zhang (2000) were 9 ± 3.4 g kg 1 and 2 ± 3 g kg 1 and were lower than found here [14,25].
In context, the CO emission factors from both biogas and LPG were low compared to typical biomass fuel combustion (35–130 g kg 1 , 2–9 g MJ 1 , Table S6 in Weyant et al. 2019) [18], or coal combustion (5.8 ± 2 g MJ 1 ) [19]. The emission factors were also low compared to field observations of improved solid fuel stoves, such as gasifiers (about 6 ± 2 g MJ 1 ) [26] and forced draft stoves (4 g MJ 1 ) [27]. Some laboratory tests of improved biomass stoves have been in this range, such as the Oorja stove and the StoveTec TLUD [28]. However, these types of stove have higher emissions when used sub-optimally in the field (3.2 g MJ 1 ) [29].

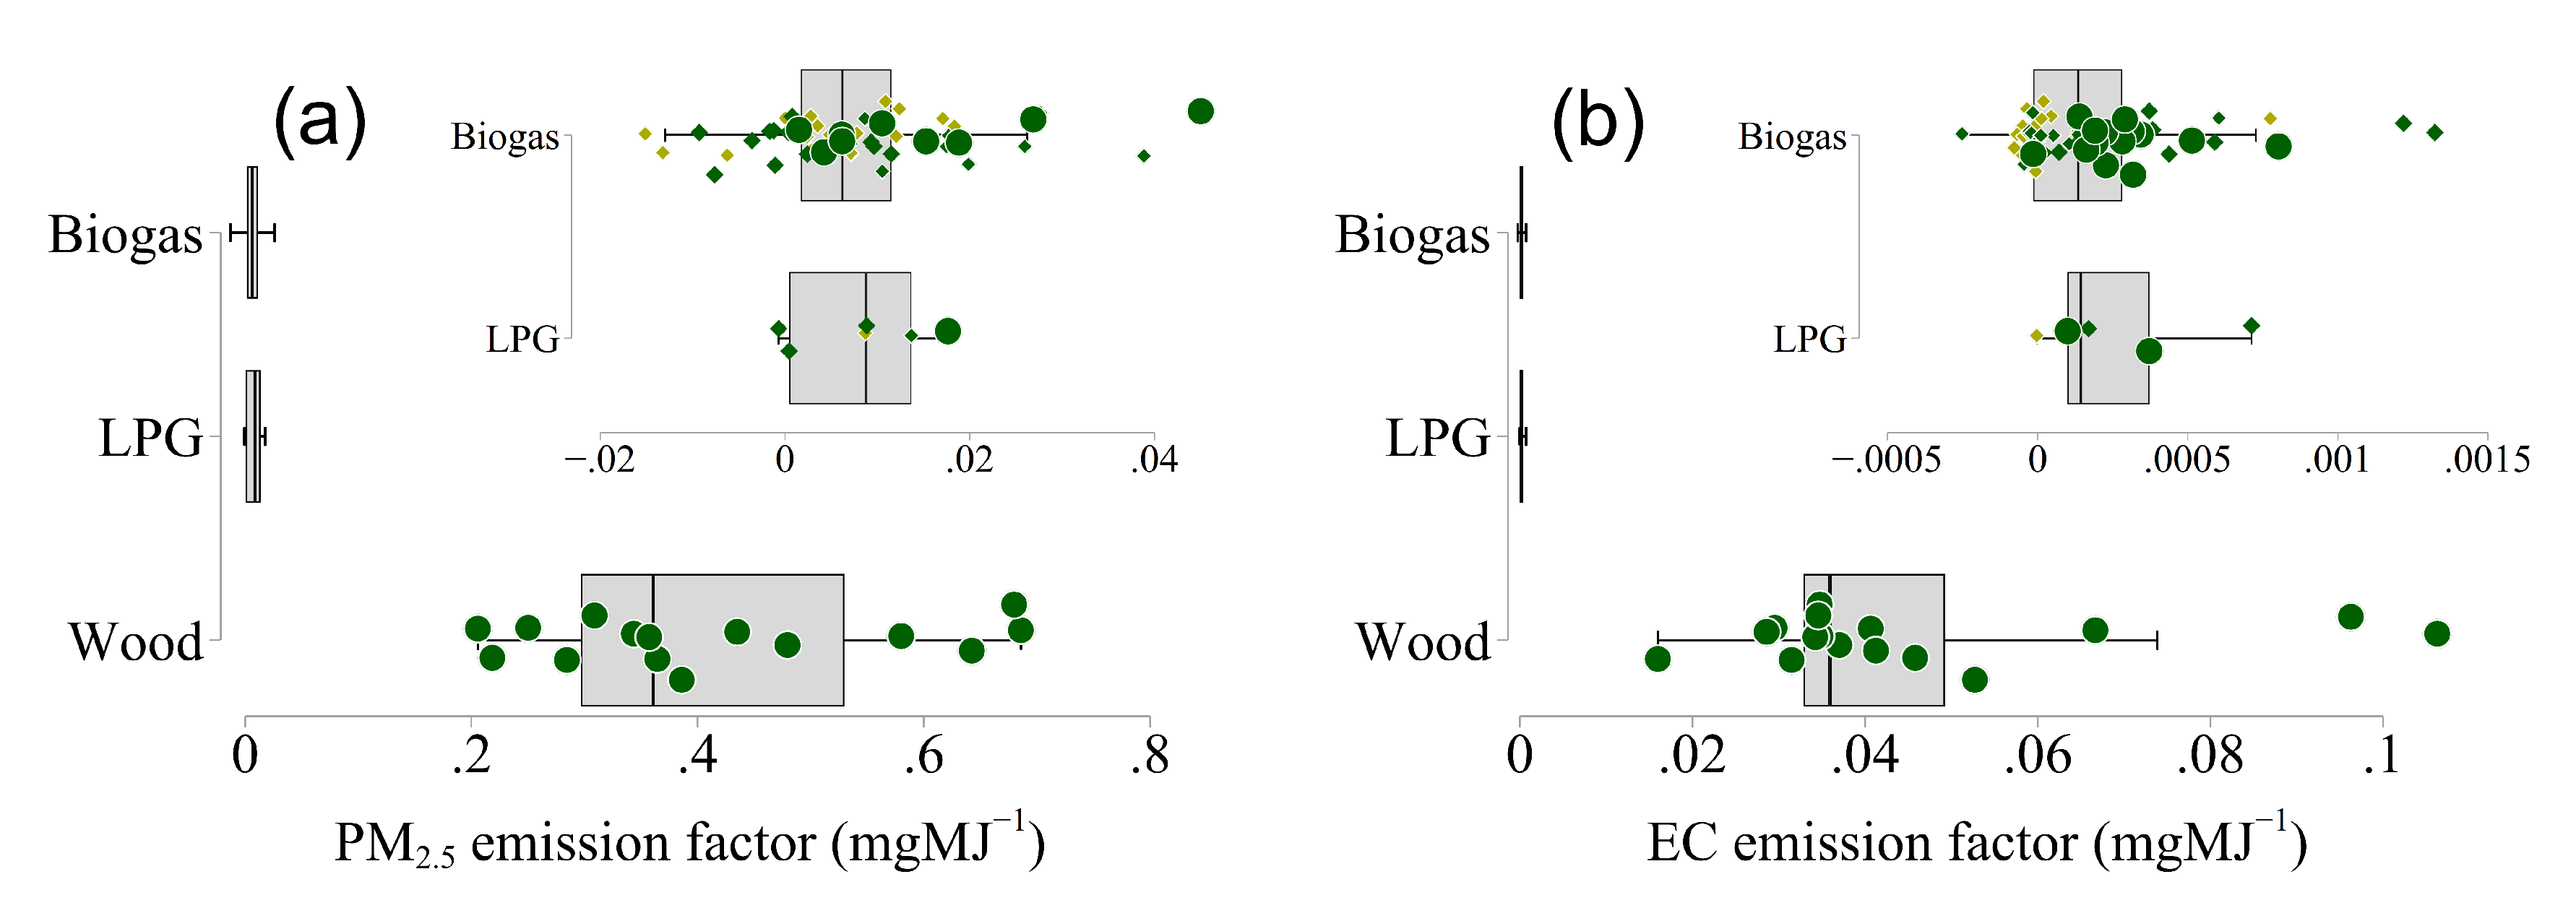
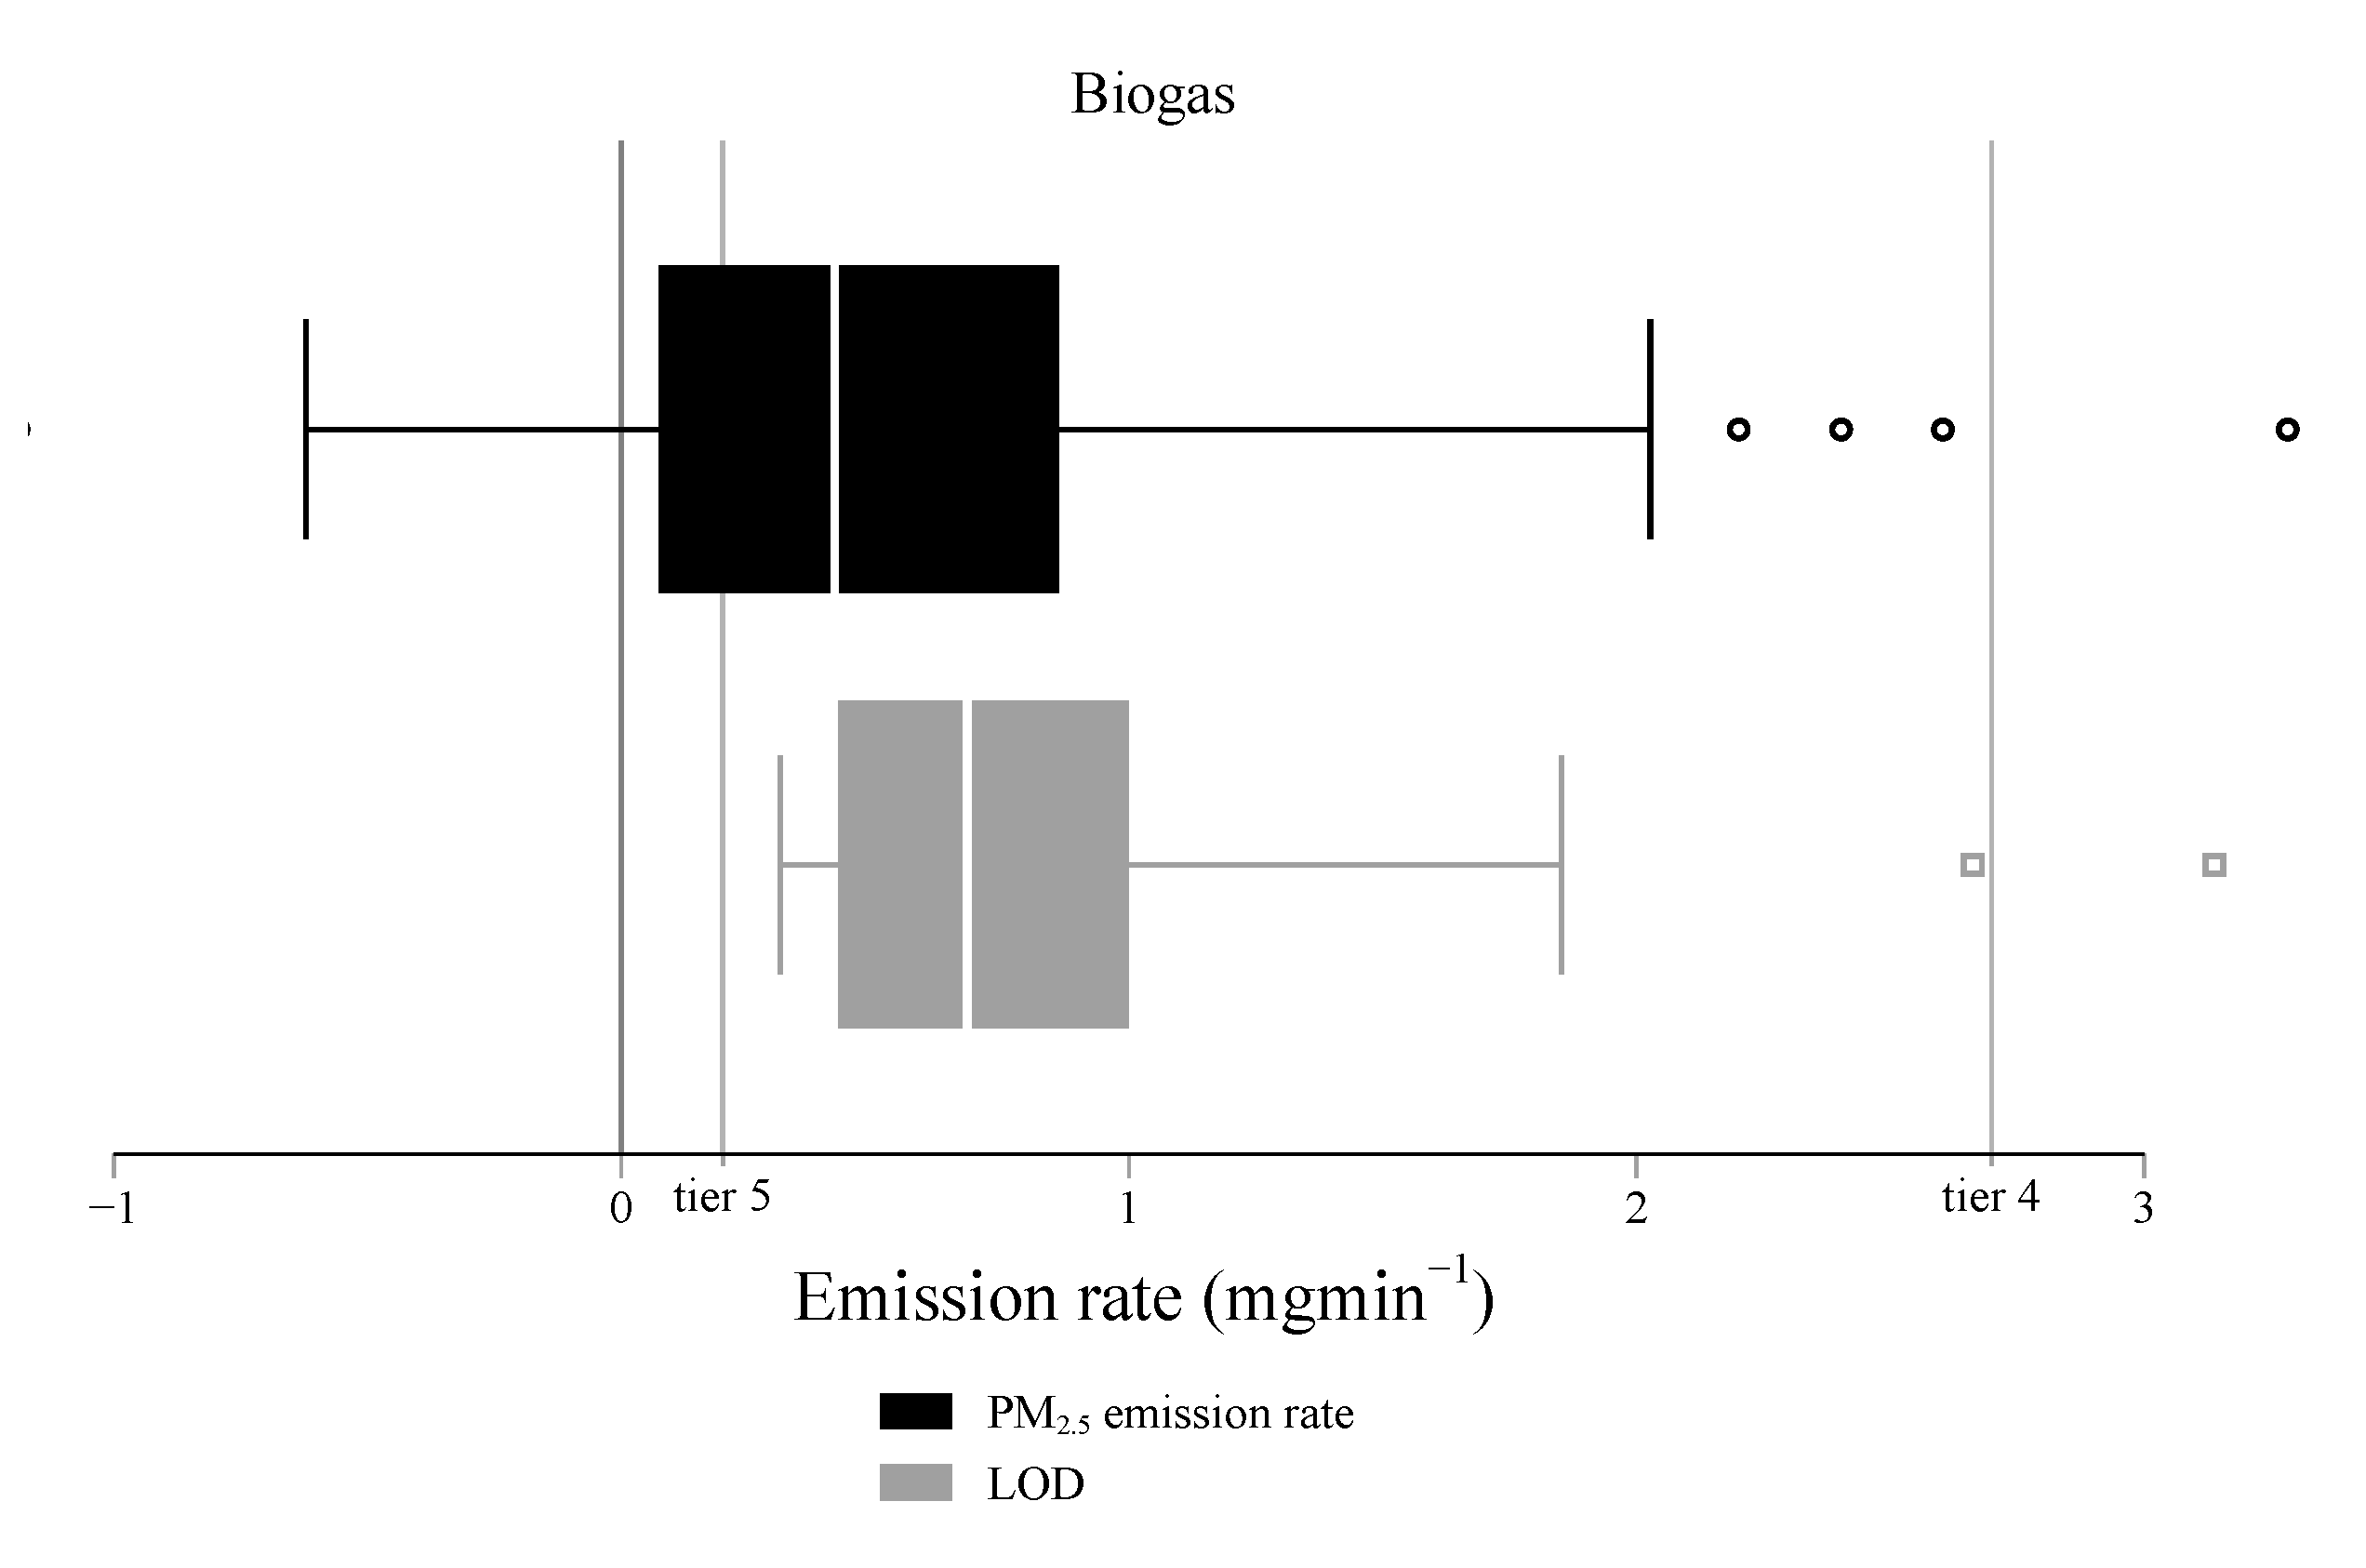
3.3. Biogas and LPG: Particulate Matter

The PM 2.5 emission factor for biogas (0.16 ± 0.23 g kg 1 ) was lower, but not statistically different from LPG (p > 0.05). The average biogas emission factor was near those found by Zhang et al. (2000) for coal gas of 0.2 ± 0.06 g kg 1 , and natural gas of 0.16 ± 0.07 g kg 1 . The PM 2.5 emission factor for biogas was three times lower than a measurement by Smith et al. (2000) of 0.57 g kg 1 [22], yet was within one standard deviation of that study. Only three events out of 57 had an average PM 2.5 emission factor greater than that found by Smith et al. (2000), which is surprising given that those measurements were of water boiling, while those here include food cooking emissions.
The PM 2.5 emission factor for LPG (0.44 ± 0.31 g kg 1 ) was within the range of most previous LPG emission measurements. It was slightly lower than found by Smith et al. (2000) and Zhang et al. (2000) of 0.51 ± 0.09 g kg 1 and 0.52 ± 0.92 g kg 1 , respectively [22,25]. It was two times higher than found by Habib et al. (2008) of 0.2 g kg 1 [30] and ten times higher than a recent laboratory study of 0.05 ± 0.04 gkg 1 [24]. The higher value found here is likely due to the inclusion of food frying, as discussed in a later section.
As seen with CO, PM 2.5 emission factors from biogas and LPG stoves (7.4 and 9.5 mg MJ 1 , respectively) were substantially lower than emissions from traditional biofuel (130–1250 mg MJ 1 ) [18] or coal (630 ± 450 mg MJ 1 ) [19]. Emissions from biogas and LPG were lower than from improved biomass stoves measured in the field, such as the Philips stove (280 ± 40 mg MJ 1 ) [27], and were lower than the lowest emitting biomass stove measured in the laboratory by Jetter et al. (2012), which was the StoveTec TLUD, emitting about 50 mg MJ 1 [28].

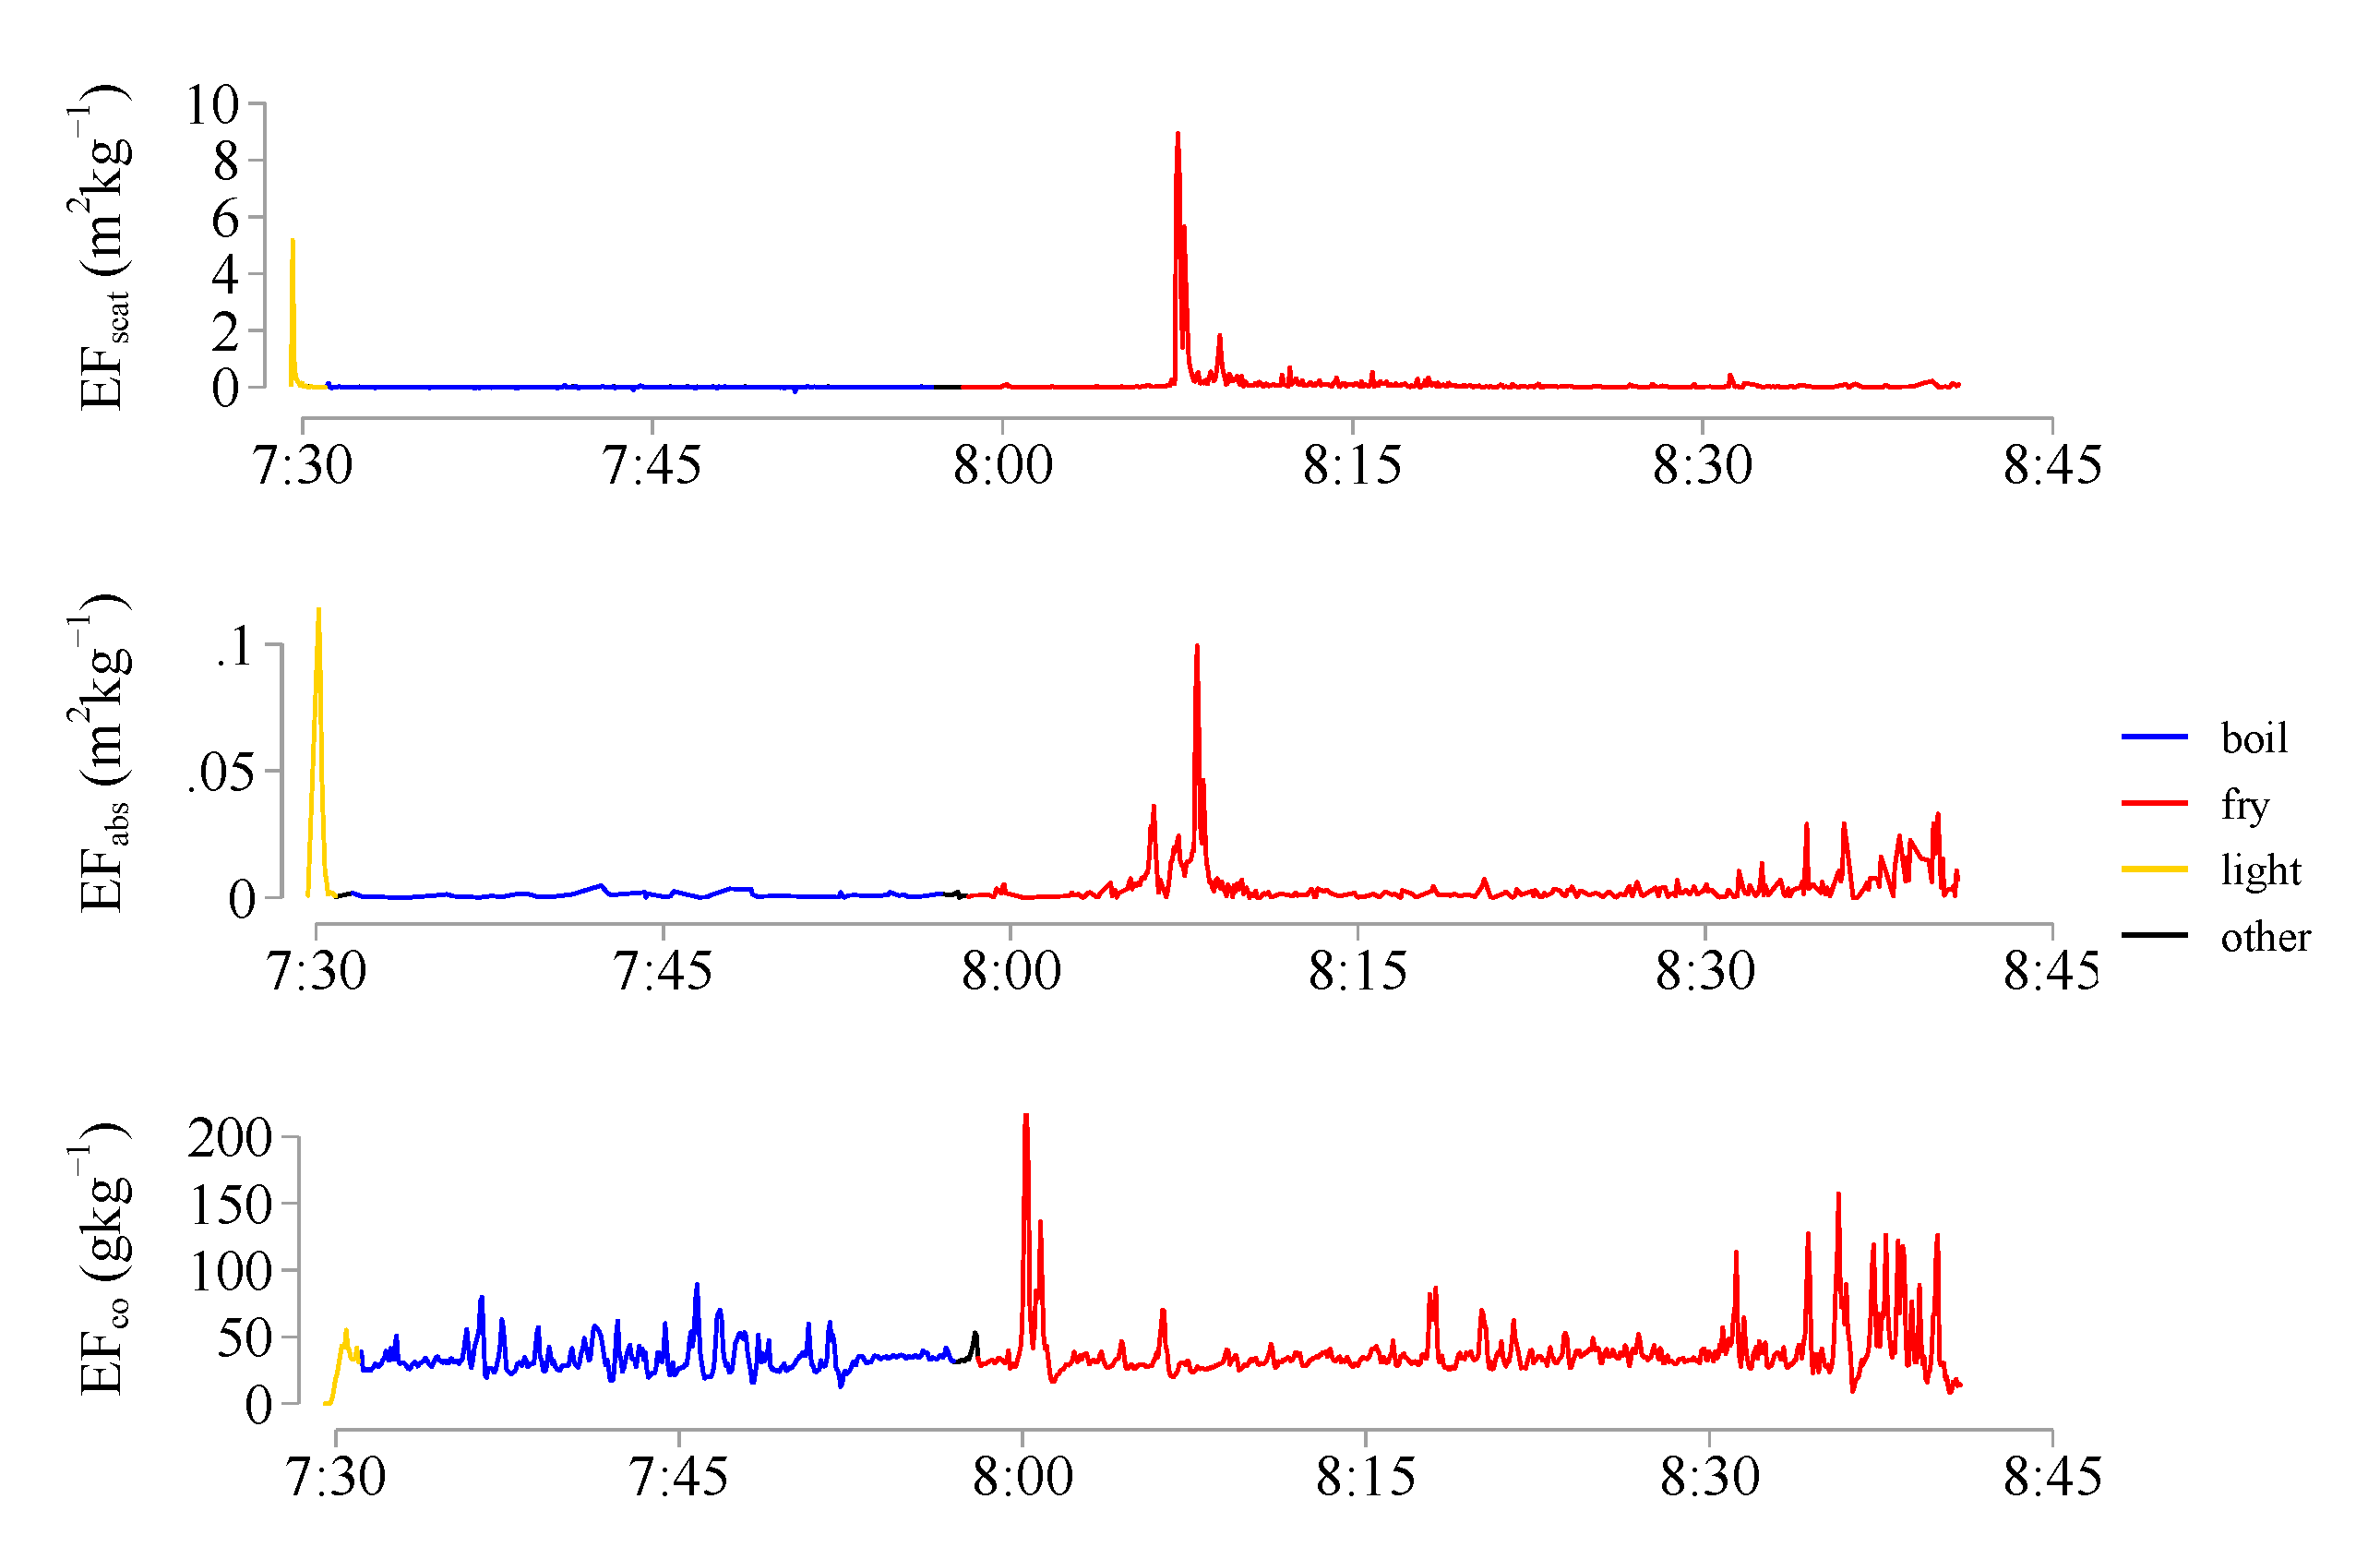
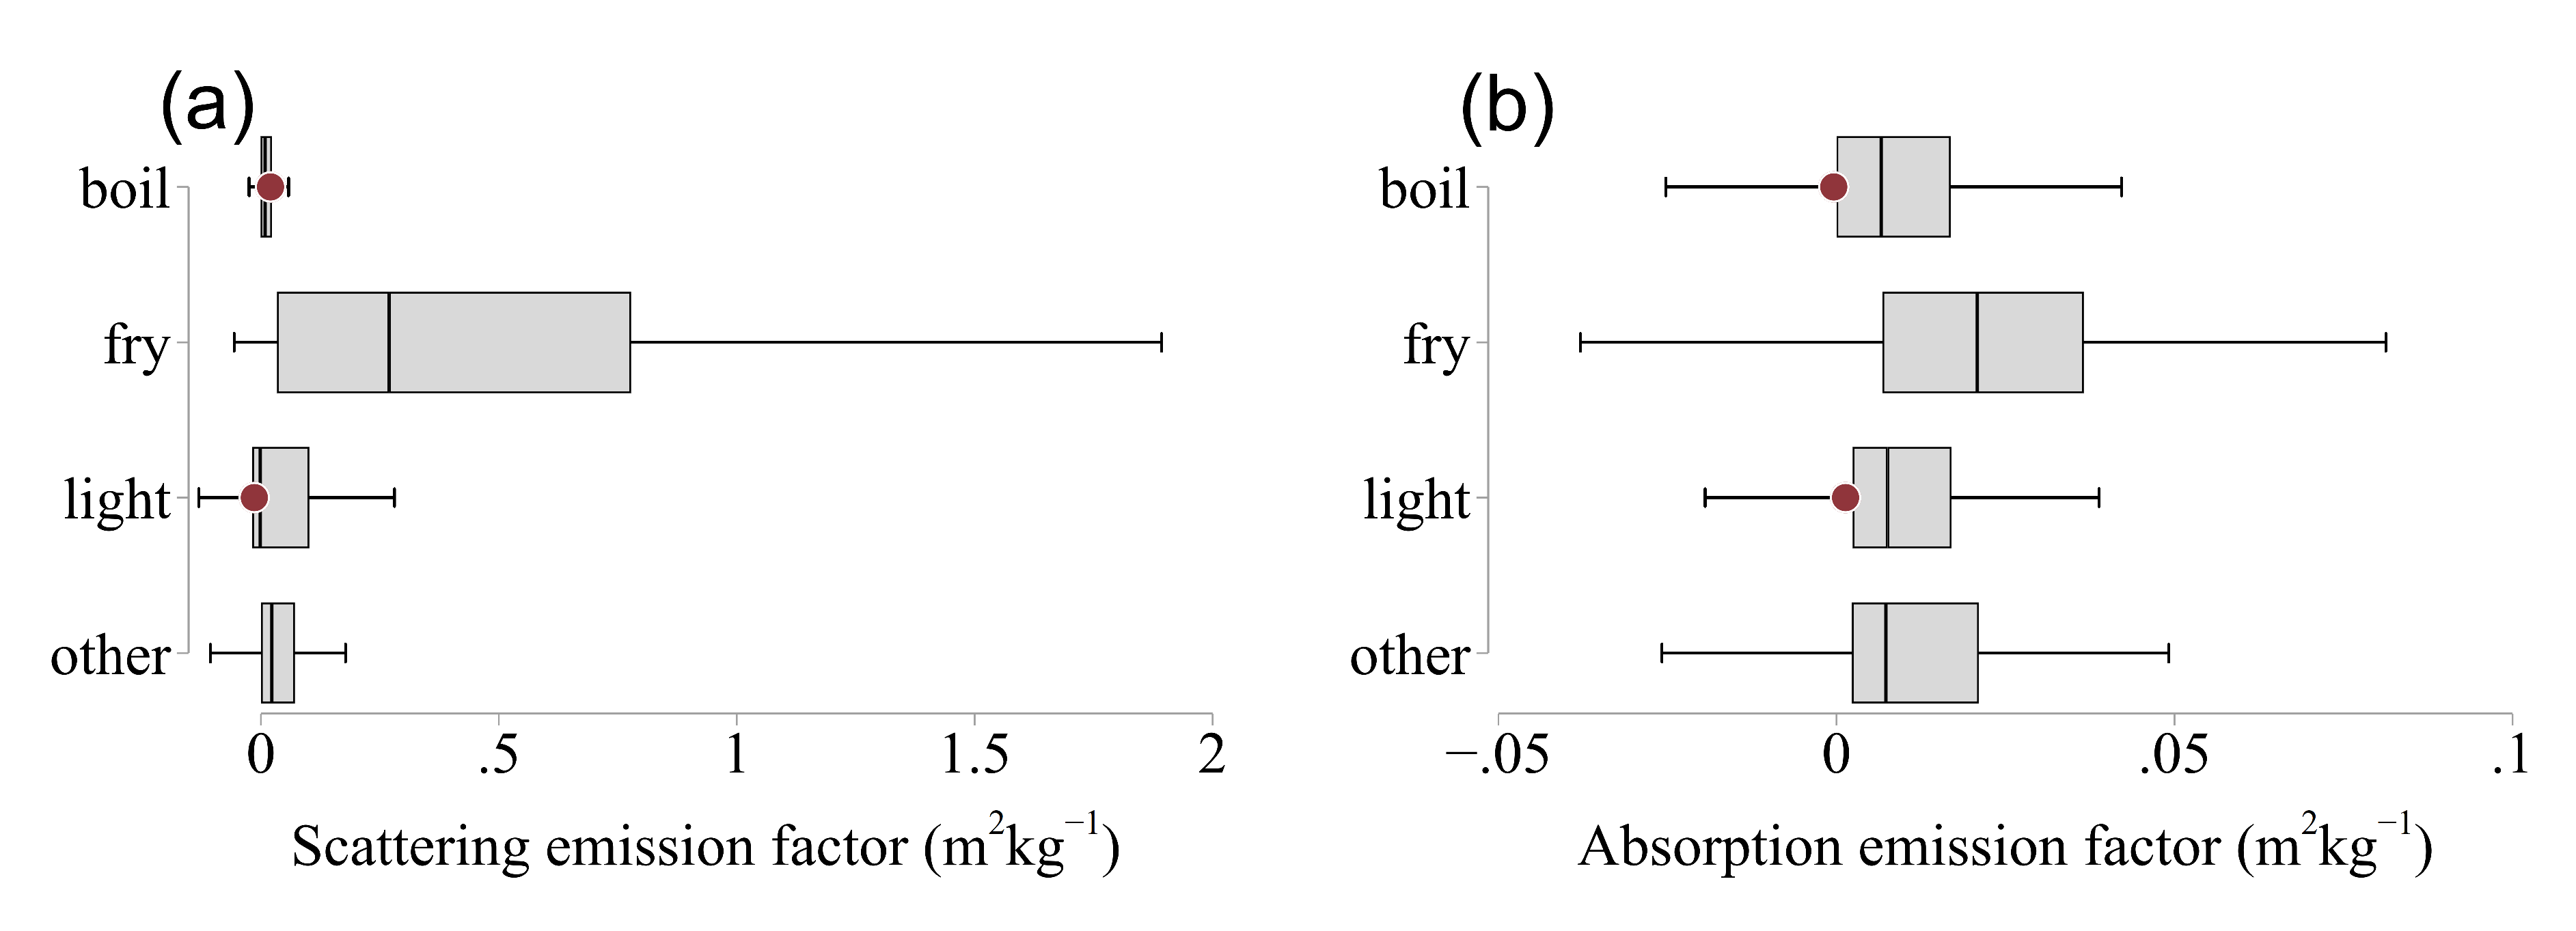
3.4. Biogas and LPG: Elemental and Organic Carbon

The EC emission factor was 0.2 ± 0.3 mg MJ 1 (0.004 ± 0.006 g kg 1 ) in biogas stoves and was lower than LPG (p = 0.002) on an energy basis, but not different on a mass basis (p> 0.05). On average, 3% (range: 0–5%) of the particulate matter from biogas stoves was EC. The majority of the PM 2.5 was composed of OC (approximately 70%), which is higher than wood stoves (50%). Similar to emissions from some other combustion sources [18], the EC and PM 2.5 emission factors were not correlated within biogas stoves (r = 0.2).
No EC or BC emission factors were found in the literature for biogas, but three laboratory tests were available for EC from LPG stoves measured in the laboratory. Habib et al. (2008) found an emission factor of 0.008 g kg 1 , Venkataraman (2005) found 0.01 g kg 1 , and Shen et al. (2018) found 0.009 ± 0.005 g kg 1 [24,30,31]. The EC emission factor for LPG here (0.014 ± 0.012 g kg 1 ) was approximately the same as these three studies. The EC may be similar to that of Shen et al. (2018) even while the PM 2.5 was 10 times higher because much of the PM 2.5 here is likely from frying emissions, but the EC emissions are mostly attributed to the fuel combustion (discussed in a later section).
Measurements of the OC emission factor in LPG stoves (0.24 ± 0.16 g kg 1 ) were 3–5 times higher than previous measurements of OC in LPG stoves in Habib el al. (2008) of 0.052 g kg 1 and in Venkataraman et al. (2005) of 0.07 g kg 1 [30,31]. The OC emission factor is likely elevated due to frying emissions.

3.5. Cooking System Emissions

Most tests conducted from gas fuels are laboratory tests that do not capture all the emissions associated with a wholistic view of the cooking system, which includes fuel combustion, emissions from lighting the stove, volatilization and combustion of food, and sometimes burning residues from the outside of cookware. For gas fuels, the emissions from the primary gas fuel can be low compared to these other emission sources. However, the inclusion of all cooking system emissions provides an emission factor with real-world relevance. Our measurements include real-time optical detection of particles that was used to discern the dominant sources of cooking system emissions.
Figure 4 shows an example of real-time CO and optical emission factors during various cooking activities during one fairly representative biogas cooking event. During the lighting phase, a spike occurred in particle light scattering and absorption emissions, but not in CO. At about 8:00, the beginning of the frying phase, a spike in CO was observed when a cold pot was placed on the stove, but was not observed in scattering and absorption. At about 8:05, when food was being pan-fried in oil, a spike was observed in scattering and absorption, but not in CO.
In Figure 5, boiling, frying, and lighting activities were averaged over all biogas events. The average absorption emission factor for all boiling events using a biogas stove was 0.011 ± 0.024 m 2 kg 1 (median: 0.007 m 2 kg 1 ), about 35% less than the overall average (0.016 ± 0.017 m 2 kg 1 , median: 0.015 m 2 kg 1 ). The average absorption emission factors during frying events (0.03 ± 0.05 m 2 kg 1 , median 0.02 m 2 kg 1 ) and lighting (0.05 ± 0.2 m 2 kg 1 , median 0.007 m 2 kg 1 ) were higher, but the differences were not significant (p > 0.05) due to high variability. Assuming a similar MAC E C for biogas and food emissions, and that boiling period emissions were exclusively from fuel combustion, the EC emission factor from biogas fuel combustion was approximately 0.10 mg MJ 1 (0.002 g kg 1 ), excluding cooking and lighting emissions.
The scattering emission factor for boiling tasks on biogas was 0.02 ± 0.09 m 2 kg 1 (median: 0.009 m 2 kg 1 ), about one tenth of the overall average of 0.2 ± 0.3 m 2 kg 1 (median: 0.05 m 2 kg 1 ), suggesting that the majority of PM 2.5 emissions from biogas cooking are not due to the fuel, but are from food frying and stove lighting. Emissions during frying were 0.6 ± 0.8 m 2 kg 1 (median: 0.3 m 2 kg 1 ), and lighting periods were 0.08 ± 0.2 m 2 kg 1 (median: −0.003) and the differences were significant (p < 0.001). If the MSC is similar for biogas and food emissions, the PM 2.5 emission factor would be 0.94 mg MJ 1 (0.02 g kg 1 ) for boiling. This estimate is similar to a water-boiling laboratory test for LPG of 0.05 ± 0.04 g kg 1 [24].
CO emission factors, on the other hand, did not appear to be similarly influenced by cooking and lighting. The emission factor during boiling was 23.6 g kg 1 , frying was 19.2 g kg 1 , and lighting was 18.2 g kg 1 (p > 0.05).
Emission factors used in global emission inventories do not include emissions from food, as this is difficult to measure separate from the fuel. The method here provides a combined emission factor that does not require separation in order to be used in inventories. One caveat is that the PM 2.5 emissions from gas stoves likely vary by regional cooking practices.

3.6. Sources of Variability

Seasons, households, and meals were explored as possible explanatory variables for emission factor variability. For biogas stoves, there were no seasonal differences in emission factors when analyzed at the event level (p > 0.05, Figure S20). However, when considering seasonality at the household level, the EC emission factor was significantly higher in spring and lowest in the monsoon (p = 0.03) and the difference was also observed in absorption (p = 0.001) (Figure S21). Greater variability was observed in the EC emission factor in the spring compared to either the monsoon or winter seasons and this variability was greater within households than between them. This high within-household variability suggests that stove-use activities have a large effect on the emissions and that the effect of seasonality is relatively small. Household activity emissions are discussed below.
No other seasonal differences in emissions were observed (p > 0.05) at either the event or household level and no seasonality was observed in wood stoves. The lack of a seasonal effect in the emissions does not rule out the possibility that some differences would exist at more extreme weather variability; the temperature difference between monsoon and winter was only 10 C. Seasonality has been observed in previous studies for wood stove emission factors in India [32].
For absorption and EC emission factors, more variability was observed within households than between seasons and the possibility that this is due to differences in emissions between meals was explored. The absorption emission factor was higher for lunch (0.02 ± 0.02 m 2 kg 1 ), compared to dinner (0.01 ± 0.01 m 2 kg 1 , p = 0.02) and the general trend was also observed in EC (p > 0.05). Differences were also observed in cooking habits between meals. Less time was spent frying during dinner compared to lunch, 14% compared to 27%, while more time was spent boiling dinner events compared to lunch, 40% compared to 34%. However, differences in PM 2.5 emission factors were not observed between meals, as would be expected given the differences in boiling and frying scattering emission factors.

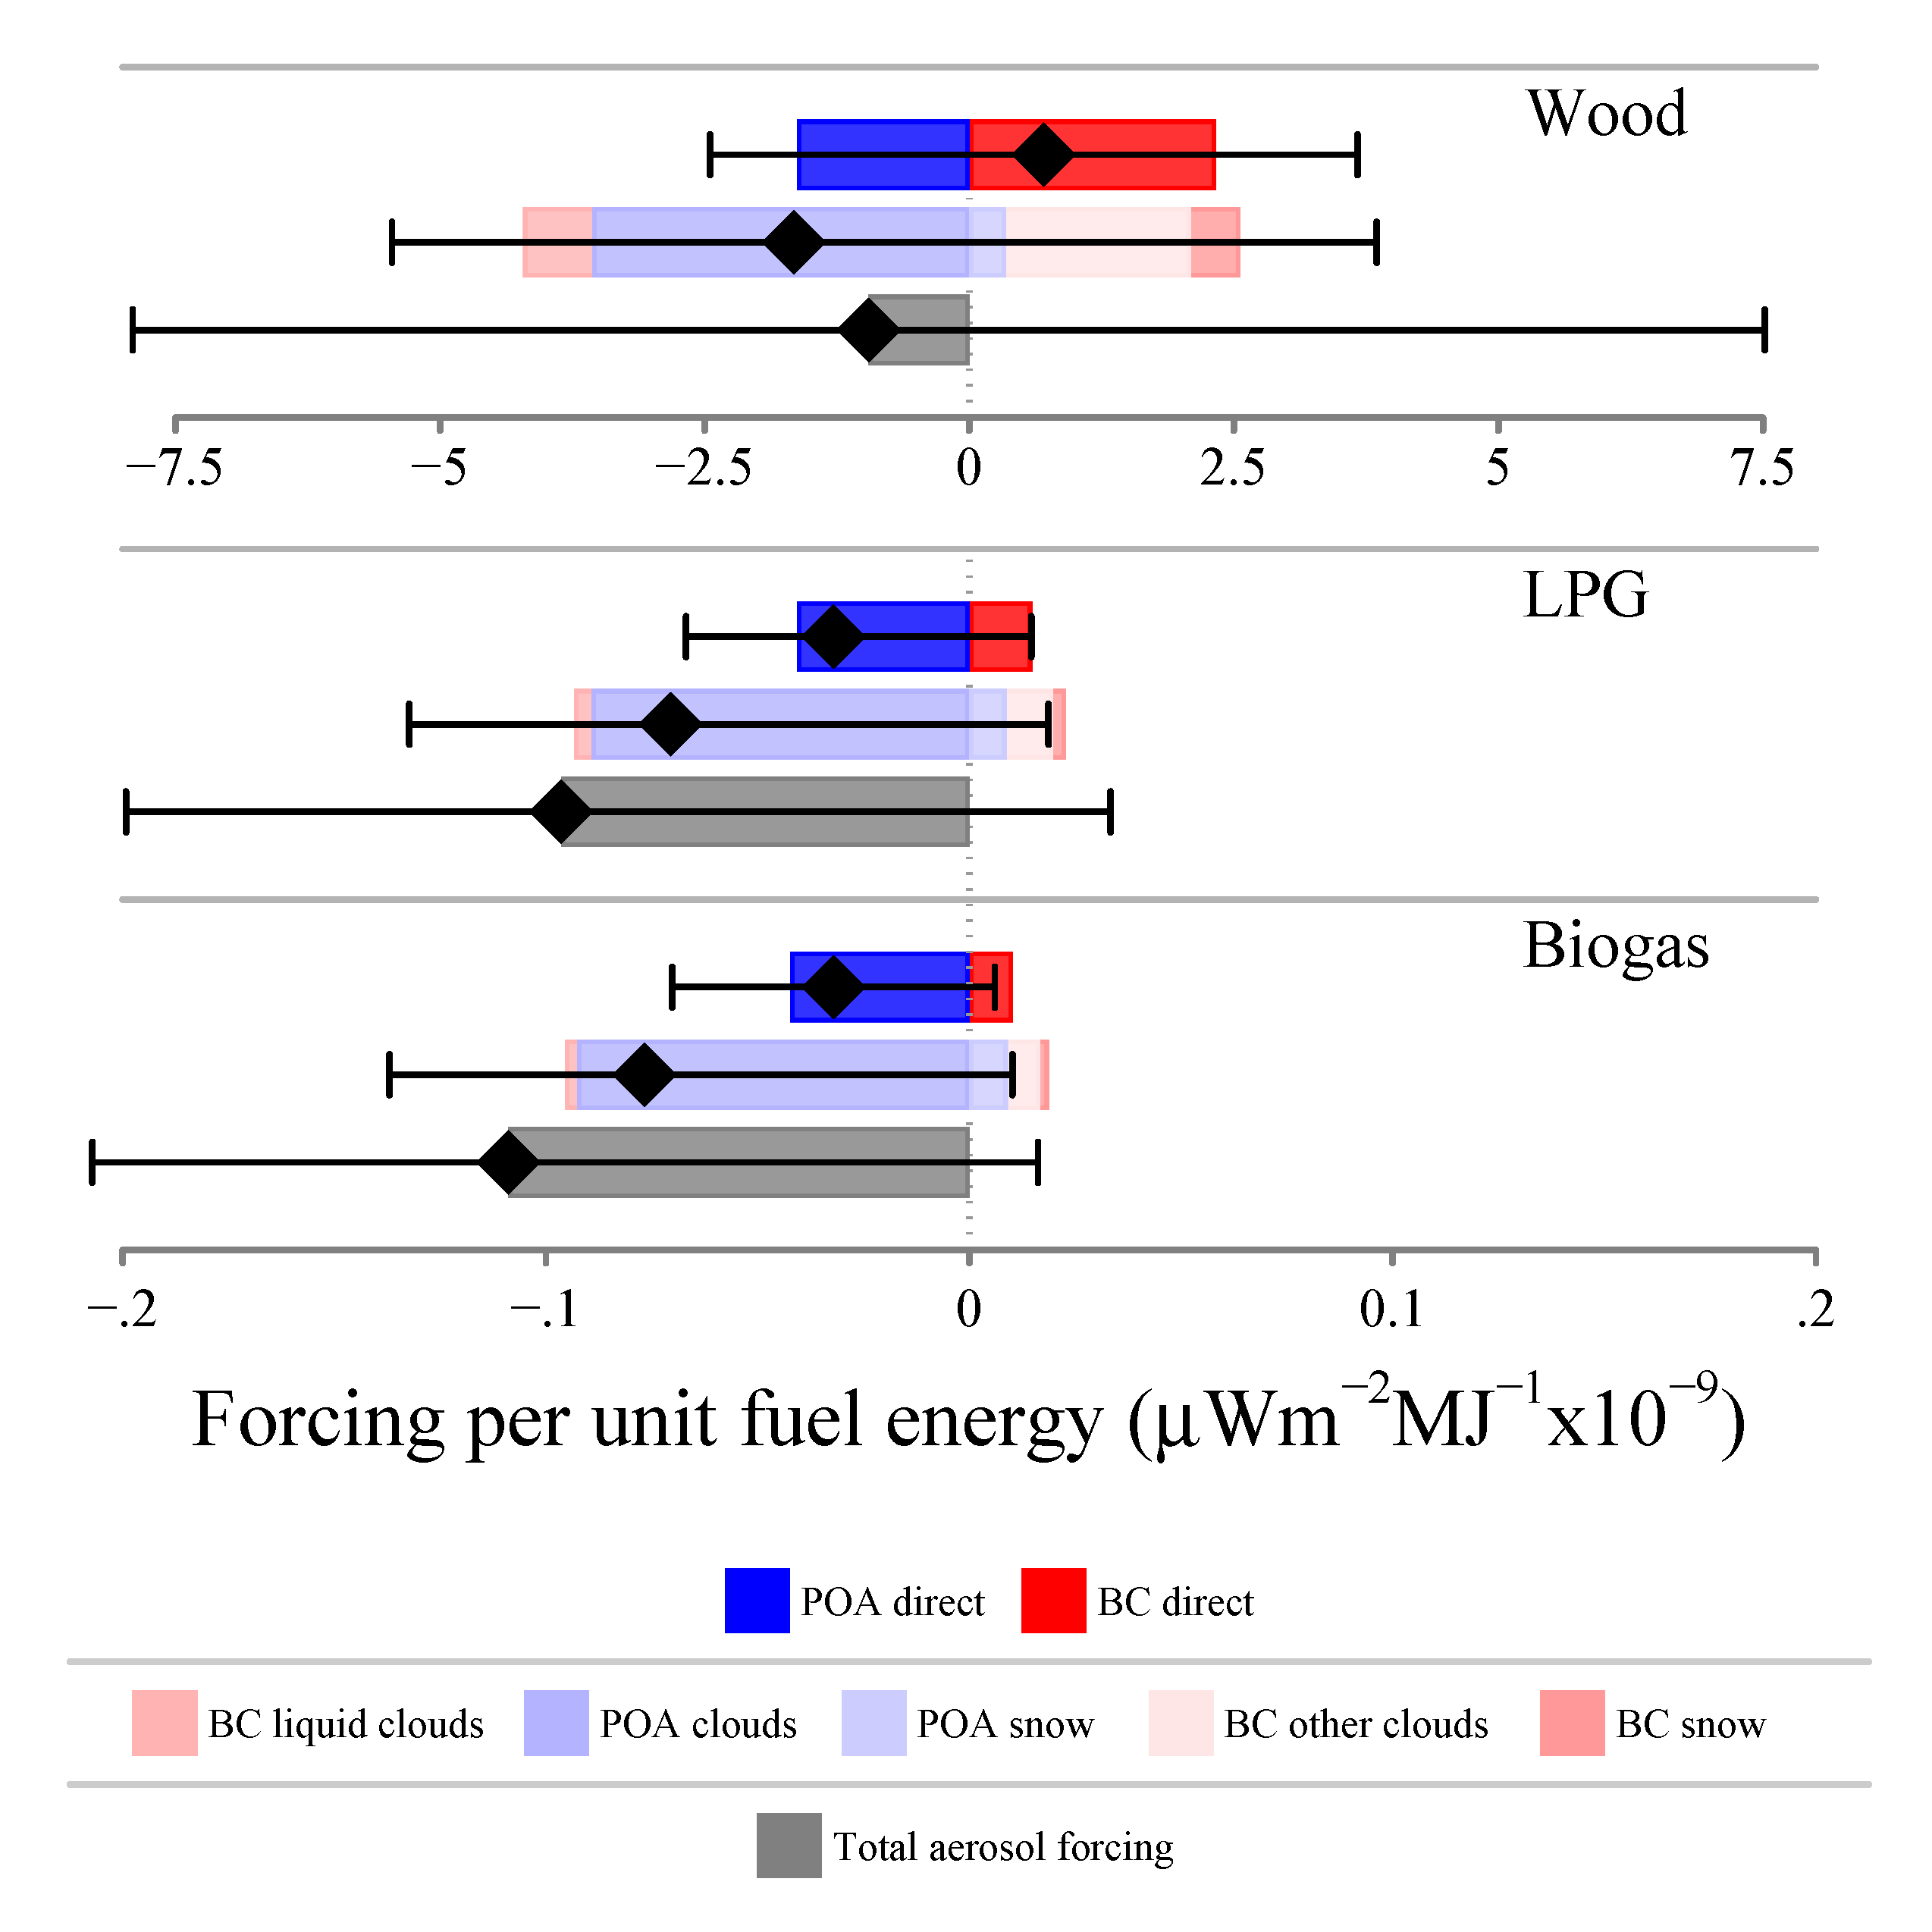
3.7. Climate Forcing by Aerosols from Cooking Fuels

The climate forcing due to biogas and LPG stove aerosol emissions, excluding forcing due to gas emissions, was approximated using the EC and OC measurements, is shown in Figure 6. The direct aerosol forcing, excluding sulfate, was positive for wood stoves, and negative for LPG and biogas. The overall aerosol effect for all three fuels was negative, largely driven by POA effects on clouds. The forcing per unit fuel energy for wood was −1.4 μ Wm 2 MJ 1 × 10 9 , 15 times higher than for gas fuels (−0.1 μ Wm 2 MJ 1 × 10 9 ). The difference between wood and gas fuels is largely driven by the difference in the particle emission magnitude, but the gas fuels have a lower fraction of EC compared to OC so they are more cooling than wood for the same mass of particle emissions.
A full accounting of climate impacts from biogas requires an assessment of the digester, as well as the stove. Methane produced in the digester is 34 times more warming than CO 2 , and even a few substantial leaks can potentially impact the global warming impact of these systems relative to other cooking technologies. A full-system assessment is required to assess climate impacts.

3.8. Comparison with ISO Performance Tiers

Cookstove emission tiers of performance have been defined in ISO TR 19867-3 [3], where Tier 5 is the cleanest level and Tier 0 is near-average for traditional solid fuel cooking. These performance tiers are intended for results of the laboratory test specified in ISO-19867-1 [33], but comparisons with field data can provide context. The tiers are defined in terms of emission factors in grams per megajoule delivered, but they can be mapped to emission rates following the methodology provided in ISO TR 19867-3 for comparison with our field measurements (Figure 7) [3]. Biogas stove average PM 2.5 emission rates, including food emissions, would be considered Tier 4, not as clean as the cleanest laboratory tested stoves without food cooking emissions. The detection limit was also Tier 4, implying that common measurement practices cannot distinguish between Tiers 4 and 5 in the field, largely due to background contamination and filter weighing uncertainties (Sections S12, S13, and S15). Neither increasing the flow rate nor a clean background in laboratory tests was sufficient to reduce the uncertainty to Tier 5. In addition, food frying emissions (about 90% of the PM 2.5 emission factor) were also Tier 4, suggesting that Tier 5 emissions performance is not achievable when frying. These observations do not negate the value of low emissions laboratory performance tiers, but highlight the need for appropriate field-based metrics.

4. Conclusions

In-field emission measurements were conducted from 6 LPG, 16 wood, and 57 biogas stove cooking events over three seasons in Nepal. Unlike previous LPG and biogas stove measurements, these new measurements provide emission factors that include user choices of burn rate and cookware while cooking full meals.
LPG and biogas PM 2.5 emission factors are very low compared to biomass fuels, but are about 10 times higher than a recent large-sample laboratory study of LPG emissions [24]. The difference is shown to be largely explained by the inclusion of emissions from the food (predominately from frying), which is an unavoidable part of real-world cooking. There may, thus, be a limit to the expected emission rate from cooking that is more dependent on the food than the fuel. The PM 2.5 emissions from LPG and biogas cooking events are also higher than the lowest-level emission tier from ISO TR 19867-3, suggesting that the tier may not be achievable in the field, depending on local cooking customs.
The lowest-level emission tier was also lower than the limit of detection due to background concentration and the uncertainties inherent in measuring filter mass with low PM 2.5 loading. The detection limits and uncertainty methods discussed here are applicable to gas cooking measurements as well as low concentration particle measurements from any source.
The overall emissions from LPG and biogas were much lower than from wood cooking, and full replacement of wood stoves with either biogas or LPG would reduce indoor emissions considerably.

Supplementary Materials

The following are available online at https://www.mdpi.com/2073-4433/10/12/729/s1: (1) Biogas systems: additional images; (2) Wood stove images; (3) LPG stove image; (4) Table of seasonal characteristics; (5) Stove distribution within households; (6) Biogas air inlet valve images; (7) Emission equipment and sampling details; (8) MACEC and AAE methods; (9) Emission factor calculation method; (10) Particle mass corrections: blank filter correction; (11) Particle mass corrections: background concentrations; (12) PM 2.5 limit of detection (LODblank); (13) PM 2.5 limit of detection (LODbackground); (14) Gas detection limits LODbackground; (15) PM 2.5 LOD summary; (16) PM 2.5 uncertainty; (17) Organic and elemental carbon mass corrections: blank filter correction; (18) Organic and elemental carbon mass corrections: background concentrations; (19) OCEC limit of detection (LODblank); (20) EC limit of detection (LODbackground); (21) OCEC limit of detection summary; (22) OCEC uncertainty; (23) OCEC analysis for low particle loading; (24) MSC determination for under LOD measurements; (25) Biogas properties; (26) Seasonal emission variability including all events; (27) Seasonal emission variability including all households; (28) Comparison with previous wood stove emissions from South Asian clay stoves; (29) Previous literature on gas stove emission factors; (30) MAC EC and optical properties of particles; and (31) Comparison with biogas laboratory test.

Author Contributions

Conceptualization, C.L.W., R.T., and N.L.L.; methodology, C.L.W., R.T., and N.L.L.; software, C.L.W., R.T., and M.C.F.; validation, C.L.W., and R.T.; formal analysis, C.L.W.; investigation, R.T., B.U., K.R., and C.A.; resources, R.T., and A.K.P.; writing—original draft preparation, C.L.W.; writing—review and editing, C.L.W., R.T., and N.L.L.; visualization, C.L.W.; supervision, R.T., B.U., and S.M.; and funding acquisition, C.L.W., R.T., N.L.L., P.S. and B.U.

Funding

Funding was provided by the Clean Cooking Alliance and Climate and Clean Air Coalition (CCAC), UNOPS grant RFP_93002_2017_01_BOC.

Conflicts of Interest

The authors declare no conflict of interest. The funders had no role in the design of the study; in the collection, analyses, or interpretation of data; in the writing of the manuscript, or in the decision to publish the results.

Abbreviations

The following abbreviations are used in this manuscript:
LPGLiquified petroleum gas
ECElemental carbon
OCOrganic carbon
PM 2.5 Particulate matter with aerodynamic diameter smaller than 2.5  μ m
COCarbon monoxide
CO 2 Carbon dioxide
BCBlack carbon
LODLimit of detection
EFEmission factor
ISOInternational standards organization

References

  1. Legros, G.; Havet, I.; Bruce, N.; Bonjour, S.; Rijal, K.; Takada, M. The Energy Access Situation in Developing Countries: A Review Focusing on the Least Developed Countries and Sub-Saharan Africa; World Health Organization and UNDP: Geneva, Switzerland, 2009. [Google Scholar]
  2. Gakidou, E.; Afshin, A.; Abajobir, A.A.; Abate, K.H.; Abbafati, C.; Abbas, K.M.; Abd-Allah, F.; Abdulle, A.M.; Abera, S.F.; Aboyans, V. Global, regional, and national comparative risk assessment of 84 behavioural, environmental and occupational, and metabolic risks or clusters of risks, 1990–2016: A systematic analysis for the Global Burden of Disease Study 2016. Lancet 2017, 390, 1345–1422. [Google Scholar] [CrossRef]
  3. International Standards Organization. Clean Cookstoves and Clean Cooking Solutions—Harmonized Laboratory Test Protocols —Part 3: Voluntary Performance Targets for Cookstoves Based on Laboratory Testing; International Standards Organization: Geneva, Switzerland, 2018. [Google Scholar]
  4. Burnett, R.T.; Pope, C.A., III; Ezzati, M.; Olives, C.; Lim, S.S.; Mehta, S.; Shin, H.H.; Singh, G.; Hubbell, B.; Brauer, M. An integrated risk function for estimating the global burden of disease attributable to ambient fine particulate matter exposure. Environ. Health Perspect. 2014, 122, 397. [Google Scholar] [CrossRef] [PubMed]
  5. Smith, K.R.; Peel, J.L. Mind the gap. Environ. Health Perspect. 2010, 118, 1643. [Google Scholar] [CrossRef] [PubMed]
  6. Aung, T.W.; Baumgartner, J.; Jain, G.; Sethuraman, K.; Reynolds, C.; Marshall, J.D.; Brauer, M. Effect on blood pressure and eye health symptoms in a climate-financed randomized cookstove intervention study in rural India. Environ. Res. 2018, 166, 658–667. [Google Scholar] [CrossRef] [PubMed]
  7. Nightingale, R.; Lesosky, M.; Flitz, G.; Rylance, S.J.; Meghji, J.; Burney, P.; Balmes, J.; Mortimer, K. Noncommunicable Respiratory Disease and Air Pollution Exposure in Malawi (CAPS). A Cross-Sectional Study. Am. J. Respir. Crit. Care Med. 2019, 199, 613–621. [Google Scholar] [CrossRef]
  8. Mortimer, K.; Ndamala, C.B.; Naunje, A.W.; Malava, J.; Katundu, C.; Weston, W.; Havens, D.; Pope, D.; Bruce, N.G.; Nyirenda, M. A cleaner burning biomass-fuelled cookstove intervention to prevent pneumonia in children under 5 years old in rural Malawi (the Cooking and Pneumonia Study): A cluster randomised controlled trial. Lancet 2017, 389, 167–175. [Google Scholar] [CrossRef]
  9. Smith, K.R.; Sagar, A. Making the clean available: Escaping India’s Chulha Trap. Energy Policy 2014, 75, 410–414. [Google Scholar] [CrossRef]
  10. Gould, C.F.; Urpelainen, J. LPG as a clean cooking fuel: Adoption, use, and impact in rural India. Energy Policy 2018, 122, 395–408. [Google Scholar] [CrossRef]
  11. Office of the Registrar General and Census Commissioner, India Ministry of Home Affairs, Government of India. India National Census. 2011. Available online: http://censusindia.gov.in/2011-Common/CensusData2011.html (accessed on 20 November 2019).
  12. Khandelwal, M.; Hill, M.E., Jr.; Greenough, P.; Anthony, J.; Quill, M.; Linderman, M.; Udaykumar, H. Why have improved cook-stove initiatives in India failed? World Dev. 2017, 92, 13–27. [Google Scholar] [CrossRef]
  13. Smith, K.; Uma, R.; Kishore, V.; Zhang, J.; Joshi, V.; Khalil, M. Greenhouse implications of household stoves: An analysis for India. Annu. Rev. Energy Environ. 2000, 25, 741–763. [Google Scholar] [CrossRef]
  14. Zhang, J.; Smith, K.; Uma, R.; Ma, Y.; Kishore, V.; Lata, K.; Khalil, M.; Rasmussen, R.; Thorneloe, S. Carbon monoxide from cookstoves in developing countries: 1. Emission factors. Chemosp.-Glob. Chang. Sci. 1999, 1, 353–366. [Google Scholar] [CrossRef]
  15. Smith, K.; Khalil, M.; Rasmussen, R.; Thorneloe, S.; Manegdeg, F.; Apte, M. Greenhouse gases from biomass and fossil fuel stoves in developing countries: A Manila pilot study. Chemosphere 1993, 26, 479–505. [Google Scholar] [CrossRef]
  16. Global Alliance for Clean Cookstove Partners. The Water Boiling Test Version 4.2.3 Cookstove Emissions and Efficiency in a Controlled Laboratory Setting. 2014. Available online: https://www.cleancookingalliance.org/binary-data/DOCUMENT/file/000/000/399-1.pdf (accessed on 20 November 2019).
  17. Roden, C.A.; Bond, T.C.; Conway, S.; Pinel, A.B.O. Emission factors and real-time optical properties of particles emitted from traditional wood burning cookstoves. Environ. Sci. Technol. 2006, 40, 6750–6757. [Google Scholar] [CrossRef] [PubMed]
  18. Weyant, C.L.; Chen, P.; Vaidya, A.; Li, C.; Zhang, Q.; Thompson, R.; Ellis, J.; Chen, Y.; Kang, S.; Shrestha, G.R.; et al. Emission measurements from traditional biomass cookstoves in South Asia and Tibet. Environ. Sci. Technol. 2019, 56, 3306–3314. [Google Scholar] [CrossRef] [PubMed]
  19. Thompson, R.; Li, J.; Weyant, C.; Edwards, R.; Lan, Q.; Rothman, N.; Hu, W.; Dang, J.; Dang, A.; Smith, K.R.; et al. Field Emission Measurements of Solid Fuel Stoves in Yunnan, China Demonstrate Dominant Causes of Uncertainty in Household Emission Inventories. Environ. Sci. Technol. 2019, 56, 3323–3330. [Google Scholar] [CrossRef] [PubMed]
  20. Bond, T.; Doherty, S.; Fahey, D.; Forster, P.; Berntsen, T.; Deangelo, B.; Flanner, M.; Ghan, S.; Kärcher, B.; Koch, D.; et al. Bounding the role of black carbon in the climate system: A scientific assessment. J. Geophys. Res. D Atmos. 2013, 118, 5380–5552. [Google Scholar] [CrossRef]
  21. Bond, T.C.; Zarzycki, C.; Flanner, M.; Koch, D. Quantifying immediate radiative forcing by black carbon and organic matter with the Specific Forcing Pulse. Atmos. Chem. Phys. 2011, 11, 1505–1525. [Google Scholar] [CrossRef]
  22. Smith, K.; Uma, R.; Kishore, V.; Lata, K.; Zhang, J.; Joshi, V.; Rasumussen, R.; Khalil, M. Greenhouse Gases from Small-Scale Combustion Devices in Developing Countries Phase IIa: Household Stoves in India. EPA-600/R-00-052. 2000. Available online: https://pdfs.semanticscholar.org/2b25/79be3535c4b984d1f6c0858726eb09360eab.pdf?_ga=2.108327111.431936412.1574241126-292403031.1574241126 (accessed on 20 November 2019).
  23. Ko, Y.C.; Lin, T.H. Emissions and efficiency of a domestic gas stove burning natural gases with various compositions. Energy Convers. Manag. 2003, 44, 3001–3014. [Google Scholar] [CrossRef]
  24. Shen, G.; Hays, M.D.; Smith, K.R.; Williams, C.; Faircloth, J.W.; Jetter, J.J. Evaluating the performance of household liquefied petroleum gas cookstoves. Environ. Sci. Technol. 2018, 52, 904–915. [Google Scholar] [CrossRef]
  25. Zhang, J.; Smith, K.; Ma, Y.; Ye, S.; Jiang, F.; Qi, W.; Liu, P.; Khalil, M.; Rasmussen, R.; Thorneloe, S. Greenhouse gases and other airborne pollutants from household stoves in China: a database for emission factors. Atmos. Environ. 2000, 34, 4537–4549. [Google Scholar] [CrossRef]
  26. Shen, G.; Chen, Y.; Xue, C.; Lin, N.; Huang, Y.; Shen, H.; Wang, Y.; Li, T.; Zhang, Y.; Su, S. Pollutant emissions from improved coal-and wood-fuelled cookstoves in rural households. Environ. Sci. Technol. 2015, 49, 6590–6598. [Google Scholar] [CrossRef] [PubMed]
  27. Wathore, R.; Mortimer, K.; Grieshop, A.P. In-use emissions and estimated impacts of traditional, natural-and forced-draft cookstoves in rural Malawi. Environ. Sci. Technol. 2017, 51, 1929–1938. [Google Scholar] [CrossRef] [PubMed]
  28. Jetter, J.; Zhao, Y.; Smith, K.R.; Khan, B.; Yelverton, T.; DeCarlo, P.; Hays, M.D. Pollutant emissions and energy efficiency under controlled conditions for household biomass cookstoves and implications for metrics useful in setting international test standards. Environ. Sci. Technol. 2012, 46, 10827–10834. [Google Scholar] [CrossRef] [PubMed]
  29. Johnson, M.A.; Garland, C.R.; Jagoe, K.; Edwards, R.; Ndemere, J.; Weyant, C.; Patel, A.; Kithinji, J.; Wasirwa, E.; Nguyen, T. In-Home Emissions Performance of Cookstoves in Asia and Africa. Atmosphere 2019, 10, 290. [Google Scholar] [CrossRef]
  30. Habib, G.; Venkataraman, C.; Bond, T.C.; Schauer, J.J. Chemical, microphysical and optical properties of primary particles from the combustion of biomass fuels. Environ. Sci. Technol. 2008, 42, 8829–8834. [Google Scholar] [CrossRef]
  31. Venkataraman, C.; Habib, G.; Eiguren-Fernandez, A.; Miguel, A.; Friedlander, S. Residential biofuels in South Asia: Carbonaceous aerosol emissions and climate impacts. Science 2005, 307, 1454–1456. [Google Scholar] [CrossRef] [PubMed]
  32. Grieshop, A.P.; Jain, G.; Sethuraman, K.; Marshall, J.D. Emission factors of health-and climate-relevant pollutants measured in home during a carbon-finance-approved cookstove intervention in rural India. GeoHealth 2017, 1, 222–236. [Google Scholar] [CrossRef]
  33. International Standards Organization. Clean Cookstoves and Clean Cooking Solutions—Harmonized Laboratory Test Protocols—Part 1: Standard Test Sequence for Emissions and Performance, Safety and Durability; International Standards Organization: Geneva, Switzerland, 2018. [Google Scholar]
Figure 1. Biogas system components. (a) The cement ring is the mixing chamber (with a hand-crank steel mixer) for adding fuel to the digester. The latrine, behind the mixing chamber feeds directly into the digester. (b) A typical biogas stove burner.
Atmosphere 10 00729 g001
Figure 2. Box plots of PM 2.5 (a) and EC (b) emission factors. Boxes range from 25th to the 75th percentile and the middle bar is the median. Points show values for individual cooking events and are jittered vertically to reduce overlap between points. Large circles represent cooking events above both detection limits, LOD blank and LOD background , yellow diamonds are events below both detection limits, and the green diamonds are events under only one detection limit.
Atmosphere 10 00729 g002
Figure 3. Previous measurements of gas stove emission factors for carbon monoxide (a) and fine particulate matter (b) on a fuel mass basis [14,15,22,24,25,30]. The points represent the mean and the bars extend plus/minus one standard deviation.
Atmosphere 10 00729 g003
Figure 4. Real-time emission factors during a biogas cooking event (monsoon season), which includes lighting, boiling, and frying: (top) scattering emission factor; (middle) absorption emission factor; and (bottom) CO emission factor.
Atmosphere 10 00729 g004
Figure 5. Biogas cooking missions of scattering particles (a) and absorbing particles (b). The red dot indicates the laboratory measurements of biogas emissions.
Atmosphere 10 00729 g005
Figure 6. Forcing per unit fuel energy for wood, biogas, and LPG stoves due to EC and OC aerosols. For each fuel, direct forcing due to BC (EC), and POA (OC*1.9) are the bold, top bars. The middle stacked bars shown the forcing due to indirect effects and the bottom, grey bar shows the total forcing due to BC and POA aerosols. Note that wood is on a different scale compared to LPG and biogas.
Atmosphere 10 00729 g006
Figure 7. Box plots showing the biogas PM 2.5 emission rates and the limit of detection (LOD blank ) expressed in the same units. ISO performance tiers are shown as vertical lines [3]. The boundary between Tiers 5 and 4 is at 0.2 mg min 1 and the boundary between Tiers 4 and 3 is at 2.7 mg min 1 . Most PM 2.5 cooking emission factors were Tier 4. The limit of detection was also in Tier 4.
Atmosphere 10 00729 g007
Table 1. Average and standard deviation of emission factors and emission metrics separated by fuel and season, analyzed at the event level.
GroupNEF CO EF PM EF EC EF OC MSC a
g MJ 1 mg MJ 1 mg MJ 1 mg MJ 1 m 2 g 1
Wood stove
Monsoon74.6 (1.4)390 (176)36.8 (15.8)189.0 (109.6)1.3 (0.3)
Winter55.1 (1.5)461 (206)37.6 (3.2)234.5 (114.6)1.1 (0.3)
Spring45.4 (0.7)372 (49)71.0 (36.6)190.5 (19.9)0.9 (0.1)
Average wood165.1 (1.3)408 (160)45.6 (24.5)203.6 (94.1)1.2 (0.3)
Biogas stove
Monsoon191.1 (0.6)9.9 (8.6)0.06 (0.20)4.4 (5.4)1.3 (0.8)
Winter191.1 (0.5)4.5 (9.4)0.20 (0.27)1.9 (4.9)1.9 (1.4)
Spring191.0 (0.5)7.9 (13.8)0.31 (0.36)9.2 (11.7)1.2 (0.6)
Average biogas571.1 (0.5)7.4 (10.9)0.20 (0.30)5.3 (8.6)1.5 (1.0)
LPG stove
Monsoon20.4 (0.1)11.0 (3.6)0.05 (0.08)6.7 (4.0)1.3 (–)
Winter10.1 (–)17.3 (–)0.44 (–)8.5 (–)0.5 (–)
Spring30.5 (0.2)4.1 (6.7)0.40 (0.26)3.0 (2.8)– (–)
Average LPG60.4 (0.2)9.5 (6.8)0.29 (0.25)5.1 (3.5)0.9 (0.6)
a Mass scattering cross-section was calculated using only events where PM 2.5 and scattering were above the LOD blank and LOD background , N = 18 for biogas, N = 2 for LPG (Section S24).

