Article

Parameterization of The Single-Scattering Properties of Dust Aerosols in Radiative Flux Calculations

College of Atmospheric Sciences, Lanzhou University, Lanzhou 73000, China
*
Author to whom correspondence should be addressed.
Atmosphere 2019, 10(12), 728; https://doi.org/10.3390/atmos10120728
Submission received: 21 October 2019 / Revised: 14 November 2019 / Accepted: 19 November 2019 / Published: 21 November 2019
(This article belongs to the Section Aerosols)

Abstract

:
In this study, we present parameterization schemes of dust single-scattering properties (SSPs) in order to establish a fast and accurate way to obtain the SSPs for dust shortwave radiative flux calculation. Based on the assumption that dust particles are spheroids, we represent a single nonspherical particle with a collection of monodisperse spheres that contain the same total surface area and volume as the original particle to convert the spheroid to a sphere. The SSPs of dust particles were parameterized in terms of the effective radius ( R e ) and imaginary part of the refractive index ( M i ). The averaged relative errors of the parameterized to the “exact” single-scattering properties, which refer to the results from the Mie theory program, are below 1.5%. To further quantify the impact of parametrization on the radiative flux simulation, we computed the radiative fluxes at both the top of the atmosphere (TOA) and the surface by using SSPs from the parameterization and the “exact”, respectively. The maximum relative errors were below 1% at both the TOA and the surface, proving that the SSPs of dust calculated by our parameterization schemes are well suited for radiative flux calculations. This parameterization differs from previous works by being formulated not only with R e but also with M i . We also investigated the sensitivity of dust-aerosol forcing to R e , M i , optical depth (τ), and solar zenith angle (SZA). The results show that the value of shortwave (SW) radiative forcing (RF) at the TOA changes from negative to positive as the M i is increasing, which means that, as the absorption of dust particles becomes stronger, more energy is kept in the atmosphere to heat the earth–atmosphere system. The SW RF gradually becomes less negative at the TOA and more negative at the surface with increasing R e , due to the decreases of reflection and transmission along with the single-scattering albedo decreasing. As the optical depth increases, the values of the SW RF decrease because of the strong attenuation for heavy loading. When SZA increases, the SW RF becomes more negative at both the TOA and the surface due to the long optical path at a large SZA. The errors induced from the parameterized SSPs of dust in the SW RF calculation are very small, which are less than 2.1%, demonstrating the accuracy of the parameterization and its reliability for climate model applications.

1. Introduction

Dust is one of the main species of atmospheric aerosol and plays an important role in the climate system. It has been estimated that as much as 10 to 20 billion tons of dust aerosols enter the atmosphere each year globally, accounting for almost half the total aerosols in the troposphere [1,2,3]. Dust aerosols can reduce the amount of incoming energy that reaches the lower atmosphere and ground by scattering and absorbing solar radiation and can heat the atmosphere by absorbing infrared radiation, which is called the “direct effect” [4,5,6,7]. The direct radiative effects of dust aerosols significantly alter the energy balance at the top of atmosphere (TOA) and the surface, which has been an important factor for modeling climate and climate change. Therefore, understanding and quantifying the direct radiation effect of dust is critically important in climate research.
Many studies of dust direct radiative forcing (DRF) have been derived based on observations, remote sensing retrievals, and radiative transfer model simulations [8,9,10,11,12,13]. However, there are still large uncertainties in dust aerosol DRF due to the great spatial and temporal variabilities of optical properties, and large differences in the composition and size distribution of dust aerosols. IPCC (The Intergovernmental Panel on Climate Change) reported that the global mean of dust direct radiative forcing ranges from −0.3 to 1.0 Wm−2, which shows a large uncertainty (IPCC, 2013). Single scattering properties (SSPs), such as the extinction efficiency ( Q e ), single-scattering albedo ( ω ˜ ), and asymmetry factor ( g ), which present the extinction, absorption, and forward scattering abilities of particle, respectively, are the key parameters for determining DRF. Dubovik et al. [14] showed that an uncertainty of ±0.03 in the single-scattering albedo can lead to a 12% uncertainty in the SW TOA forcing. However, effectively and accurately representing the SSPs of dust particles in climate models is still a problem. It is well known that the shapes of dust aerosols are exclusively nonspherical [15,16,17]. Many in situ and laboratory measurements [18,19], as well as remote sensing results [20,21], showed that the scattering properties, especially the phase function, were quite different for dust particles compared to those of homogeneous spheres [22]. Numerous efforts have been made to account for particle nonsphericity in aerosol retrieval algorithms and radiative forcing calculations [21,23,24,25,26,27]. However, limited work has been done to calculate the SSPs for nonspherical particles. The development of such a model appears to be difficult both methodologically and technically.
It is a common practice to use the Lorenz–Mie theory to compute the SSPs of dust aerosols in radiative flux calculations [28,29,30,31]. Mishchenko et al. [32] showed that the differences of the dust aerosol extinction coefficient, single scattering albedo, and asymmetry factor values between nonspherical and projected-area-equivalent spherical particles are relatively small (less than 10%). The size parameter and refractive index are the main parameters for calculating the SSPs using Mie’s theory. However, due to the complexity and high time consumption requirements of the Mie calculation, it is time-consuming to repeat the Mie calculation in a climate model to calculate SSPs of dust aerosols for different particle size distributions and wavelength-dependent refractive indexes. In climate models, the wavelength-dependent aerosol single scattering properties are typically listed in tables, which are calculated as a function of the particle size at certain intervals [33,34,35]. Therefore, it is worthwhile to develop a parameterization to obtain the SSPs for different dust aerosols in radiative transfer models.
In this study, firstly, we represented a single nonspherical particle with a collection of monodisperse spheres that contain the same total surface area and volume as the original one [36]. The SSPs of these particles were calculated by using the Mie theory code for a wide range of particle sizes and refractive index values in the shortwave. Then, based on the bulk SSPs of dust particle collections under different particle distributions, the SSPs of dust aerosols were parameterized in terms of the effective radius ( R e ) and the imaginary part of the refractive index ( M i ). The proposed parameterization was also tested relative to Mie calculations. In order to further evaluate the impact of the parameterization of dust single scattering properties, we input the SSPs calculated by Mie’s theory and the parameterized result into a radiative transfer model to compute the radiative flux and its errors associated with the parameterization. The sensitivity of dust-aerosol forcing to various dust properties were also provided to further understand how the changes in dust properties modulate the solar radiation in climate system.
The remainder of this paper is organized as follows. In Section 2, we introduce the method. The parameterization of properties based on physical principles and the parameterization assessment are provided in Section 3. Section 4 presents the dependence of dust aerosol radiative forcing on the particle size and refractive index. Finally, a summary and conclusions are given in Section 5.

2. Methods

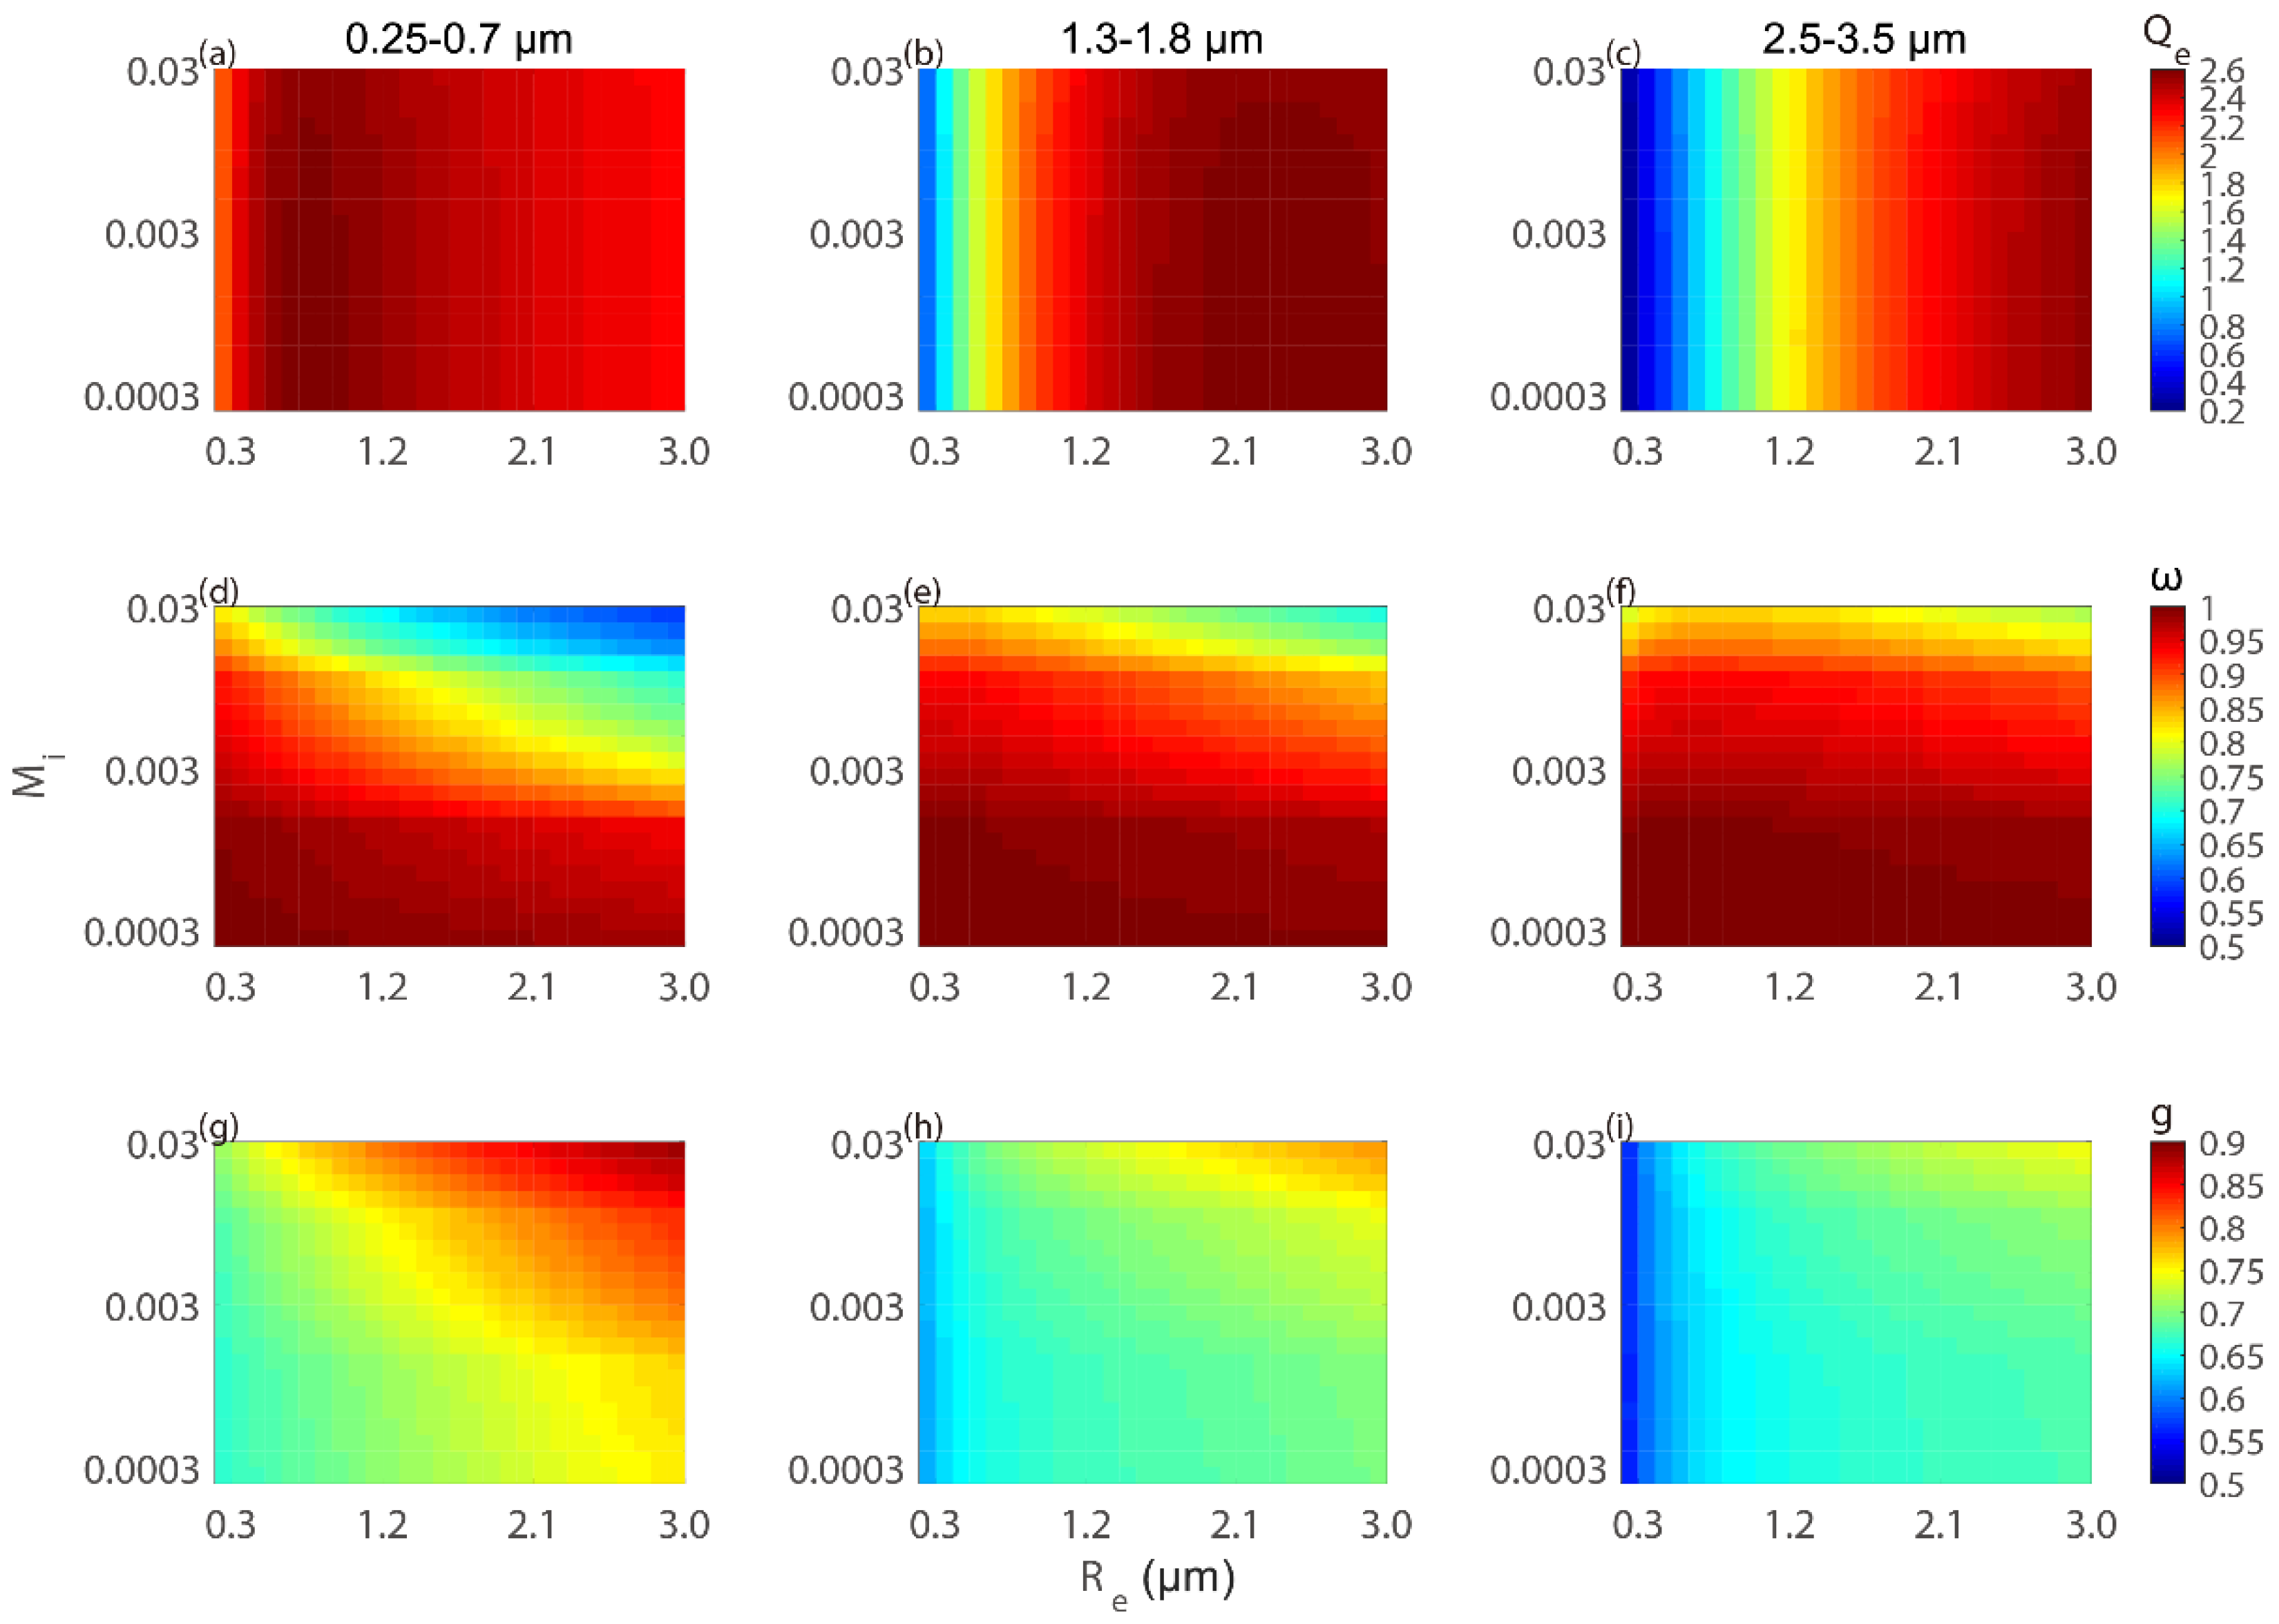
2.1. Single Scattering Properties

Previous studies showed that although dust particles are highly non-spherical, their single scattering properties can be adequately modeled by using the distributions of prolate and oblate spheroidal grains with wide aspect ratios [32,34]. Thus, we firstly assume that dust particles are spheroids. Mishchenko and Travis [37] showed that a ‘broad’ shape distribution of prolate and oblate spheroids with an aspect ratio ranging from 1.1 to 2.2 was reasonably well represented by the results for spheroids with the aspect ratio set at the single value of 1.7. Nakajima et al. [38] also found that employing morphological analysis of scanning electron microscope images of dust particle from yellow sand events showed a distribution of particle aspect ratios about a mode of ~1.7. Therefore, in our study, we assumed that the dust particles are spheroids with an aspect ratio (i.e., a / b , where a and b are the rotational symmetry and equatorial semiaxes, respectively) of 1.7 [39,40]. One thousand size bins were selected, with a ( b ) ranging from 0.071 (0.042) to 21.37 (12.57) μm with a resolution, Δ ln a , of 0.0057. Then, we converted the spheroid particles into volume and projected area-equivalent spheres (equal -V/P spheres), which preserve both the projected area (P) and volume (V) of nonspherical particles. The area-equivalent or volume-equivalent spheres were used to approximate the non-sphere dust aerosol particles for which scattering and absorption properties have been shown to be inadequate [41,42]. If using a sphere with only an area-equivalent radius, the extinction cross section of a non-spherical particle will be accurate, but the absorption cross section will be overestimated. If using a sphere with only a volume-equivalent radius, the extinction cross section will be underestimated. Both extinction and absorption cross sections of a nonspherical particle are well represented by the use of spheres with area- and volume-equivalent radii ( r v p ). The volume of one spheroid is given by V = 4 / 3 π a b 2 . The surface area (S) of a prolate spheroid (i.e., a / b 1.0 ) is given by S = 2 π b 2 + 2 π a b sin 1 ε / ε , where ε is the eccentricity of the spheroid and ε = a 2 b 2 / a . The projected area (P) of a randomly oriented convex particle is S/4 [43]. We obtained r v p = 3 V / 4 P by letting P = π r 2 n and V = ( 4 / 3 ) π r 3 n , where n is an adjusted number of spheres that preserves both P and V for a nonspherical particle (note that n is not necessarily an integer). The size parameter was defined as 2 π r v p / λ . In this study, the wavelength, λ , ranged from 0.25 to 4 μm with an interval of 0.025 μm. The V/P- equivalent radius, r v p , ranged from 0.02 to 7.16 μm, with a Δ ln r v p interval of 0.0057 μm. Fu et al. [40] simulated the SSPs of dust aerosols with both spheroidal (with an aspect ratio of 1.7) and spherical shapes defined by equal-V/P spheres at 0.55 μm and showed that the relative errors of the spheres in approximating the spheroids were less than 1% for the extinction efficiency and single scattering albedo and less than 2% for the asymmetry factor. Neshyba et al. [44] showed that the use of V/P-equivalent spheres works quite well to capture the effects of nonsphericity on scattering and absorption cross sections, but the performance of this method for the asymmetry parameter is dependent on the particle shape. So, it should be noticed that the relative error of the asymmetry factor (g) might change when the particle shape has a different aspect ratio [45,46,47]. The real part of the refractive index ( M r ) of the dust particles was fixed to 1.53 according to previous work results [30,48,49,50], while the imaginary part ( M i ) ranged widely from 0.0003 to 0.03 due to the significant spectral dependence of M i of dust particles in the shortwave [45,51,52,53]. The single scattering properties were calculated by Mie theory code (Mie calculation), which were also considered as the “exact” result.
Then, based on the pre-defined distribution, we calculated the bulk SSPs of the collection of dust particles for different particle distributions. Here, we represented the dust aerosol size distribution in terms of the radius of the volume-equivalent spheres ( r v = ( 3 V / 4 π ) 1 / 3 ), which is consistent with ground-based remote sensing algorithms that retrieve particle volume distributions [34,54]. The lognormal distribution following Levoni et al. [30] was employed in this study:
d N ( r v ) d r v = N 0 r v ln ( 10 ) σ 2 π exp { [ log ( r v / r v m ) ] 2 2 σ 2 } ,
where r v m and σ are the mode radius and standard deviation, respectively; N 0 is the number concentration of dust aerosols; and σ was set to 0.4. This lognormal distribution is the same as the accumulation mode of dust aerosol adopted in the multiangle imaging spectro radiometer (MISR) aerosol retrieval algorithm [39]. The value of r v ranged from 0.05 to 15 μm, corresponding to a (b) ranging from 0.071 (0.042) to 21.37 (12.57) μm, with a resolution Δ ln r v of 0.0057 [39,40]. In total, 28 lognormal size distributions for different mode radii were employed in this study.
The radiative impact of the size distribution of spherical particles can be largely represented by an effective radius, as defined by Hansen and Travis [55]. For nonspherical dust aerosols, we can define the effective radius using V/P-equivalent spheres in the form:
R e = r v , min r v , max r v p 3 n N ( r v ) d r v r v , min r v , max r v p 2 n N ( r v ) d r v = 3 4 r v , min r v , max V N ( r v ) d r v r v , min r v , max P N ( r v ) d r v ,
where, for a given r v , n is the number of spheres with a radius, r v p , corresponding to a spheroid that has a volume, V, and a projected area, P. The values of R e ranged from 0.3 to 3.0 μm, with a resolution Δ R e of 0.1 μm, corresponding to r v m values through Equations (1) and (2).
For a given size distribution, the bulk SSPs of the dust aerosols, including the extinction efficiency ( Q e ), single scattering albedo ( ω ˜ ), and asymmetry factor ( g ), can be written as follows:
Q e = r v , min r v , max Q e P N ( r v ) d r v r v , min r v , max P N ( r v ) d r v ,
ω ˜ = r v . min r v . max Q s P N ( r v ) d r v r v , min r v , max Q e P N ( r v ) d r v ,
g = r v , min r v , max g Q s P N ( r v ) d r v r v , min r v , max Q s P N ( r v ) d r v ,
where Q e , Q s , and g are the extinction efficiency, scattering efficiency, and asymmetry factor for an individual particle, respectively, which were computed from Mie’s theory for the V/P-equivalent sphere.

2.2. Radiative Transfer Model

The Santa Barbara DISORT Atmospheric Radiative Transfer model (SBDART, version 2.4, Institute for Computational Earth System Science (ICESS), University of California, Santa Barbara, USA) model with a 4-stream method was used for calculations of the plane-parallel radiative transfer in our study. This model is widely used for cloud and aerosol retrievals from satellite remote sensing and atmospheric energy budget research [56]. In this study, we input the extinction efficiency, single scattering albedo, and asymmetry factor of dust aerosols into the model to simulate the dust radiative fluxes and calculate the radiative forcing.

3. Parameterization of the Single Scattering Properties of Dust Aerosols

3.1. Description of Parameterization

According to anomalous diffraction theory, for a given dust aerosol distribution, the extinction efficiency was derived by [57]:
Q e = σ e π r 2 = 2 4 ρ sin ρ + 4 ρ 2 ( 1 cos ρ ) , ρ = 2 x ( m 1 ) ,
where σ e is the extinction cross section for a single dust particle, x is a size parameter ( x = 2 π r / λ ), ρ is the phase shift parameter, r is the particle radius, and m is the refractive index. From this equation, it is reasonable to estimate the extinction efficiency by using the effective radius and the refractive index.
The scattering efficiency can be written using Equation (7) according to the Lorenz Mie theory:
Q s = σ s π r 2 = c 1 x 4 ( 1 + c 2 x 2 + c 3 x 4 + ) ,
where σ s is the scattering cross section, and c is a function of the refractive index (m). From Equations (4), (6), and (7), we know that the single scattering albedo depends on the effective radius and refractive index.
Figure 1 shows the band-averaged values of Q e , ω ˜ , and g from the Mie calculation versus the effective radius and imaginary part of the refractive index in the spectral intervals 0.25–0.70 μm (left panel), 1.30–1.80 μm (middle panel), and 2.50–3.50 μm (right panel). These three intervals correspond to the visible band, the near-IR moderate absorption band, and the near-IR strong absorption band, respectively. The SSPs in Figure 1 were calculated by Mie code, and integrated by the size distribution based on Equations (3)–(5). From Figure 1, we can see that the SSPs are highly dependent on the effective radius and the imaginary part of the refractive index. The extinction efficiency, Q e , fluctuates with R e ; however, Q e has a weak relationship with M i . The ω ˜ decreases and g increases rapidly as the value of M i increases, especially for large particles. As R e increases, ω ˜ gradually decreases and g increases, which indicates that there is more forward-scattering for large particles.
Based on the above analysis, we see that the SSPs not only depend on the effective radius but also on the imaginary part of the refractive index. Thus, the extinction efficiency, single scattering albedo, and asymmetry factor for each shortwave band were parameterized as follows:
Q e = n = 0 N A n / R e n , A n = m = 0 M a n m M i m ( n = 0 , 1 , , N ) ,
ω ˜ = n = 0 N B n ( R e 3 / 4 ) n , B n = m = 0 M b n m ( M i 3 / 4 ) m ( n = 0 , 1 , , N ) ,
g = n = 0 N C n ( R e 1 / 3 ) n , C n = m = 0 M c n m ( M i 1 / 3 ) m ( n = 0 , 1 , , N ) ,
where An, anm, Bn, bnm, Cn, and cnm are coefficients determined by numerical fitting to exact Mie calculation results; and N and M represent the numbers of terms required to achieve the given accuracy. When N = 4 and M = 1, the average relative error of the extinction efficiency is less than 1.5%. At the same time, N = 2 and M = 2 are sufficient for the single scattering albedo and asymmetry factor expression to achieve an accuracy within 1.5%.
The coefficients in Equations (8)–(10) determined by numerical fitting using the “exact” results are listed in Table 1, Table 2 and Table 3. Aerosol optical properties as functions of the wavelength are much smoother than gaseous optical properties. Therefore, even in a correlated k-distribution model, the aerosol optical properties are treated based on the band-averaged results. The solar spectrum was divided into 24 and 6 bands in this parameterization, which are also shown in Table 1, Table 2 and Table 3. For the SW radiation, the band average was obtained by weighting the results for each wavelength by the incoming SW spectrum at the TOA.
The average values of the single scattering parameters in each spectral band were determined in the following ways [58]:
Q ¯ = Δ λ i Q λ S λ d λ Δ λ i S λ d λ ,
ω ˜ ¯ = Δ λ i ω λ β λ S λ d λ Δ λ i β λ S λ d λ ,
g ¯ = Δ λ i g λ ω λ β λ S λ d λ Δ λ i ω λ β λ S λ d λ ,
where S λ is the solar irradiance, and the values were integrated over each spectral band, and β λ is the extinction coefficient ( β = r v , min r v , max Q e π r v 2 N ( r v ) d r v ). The fraction of the solar irradiance at the TOA in each spectral band is given in Table 1.

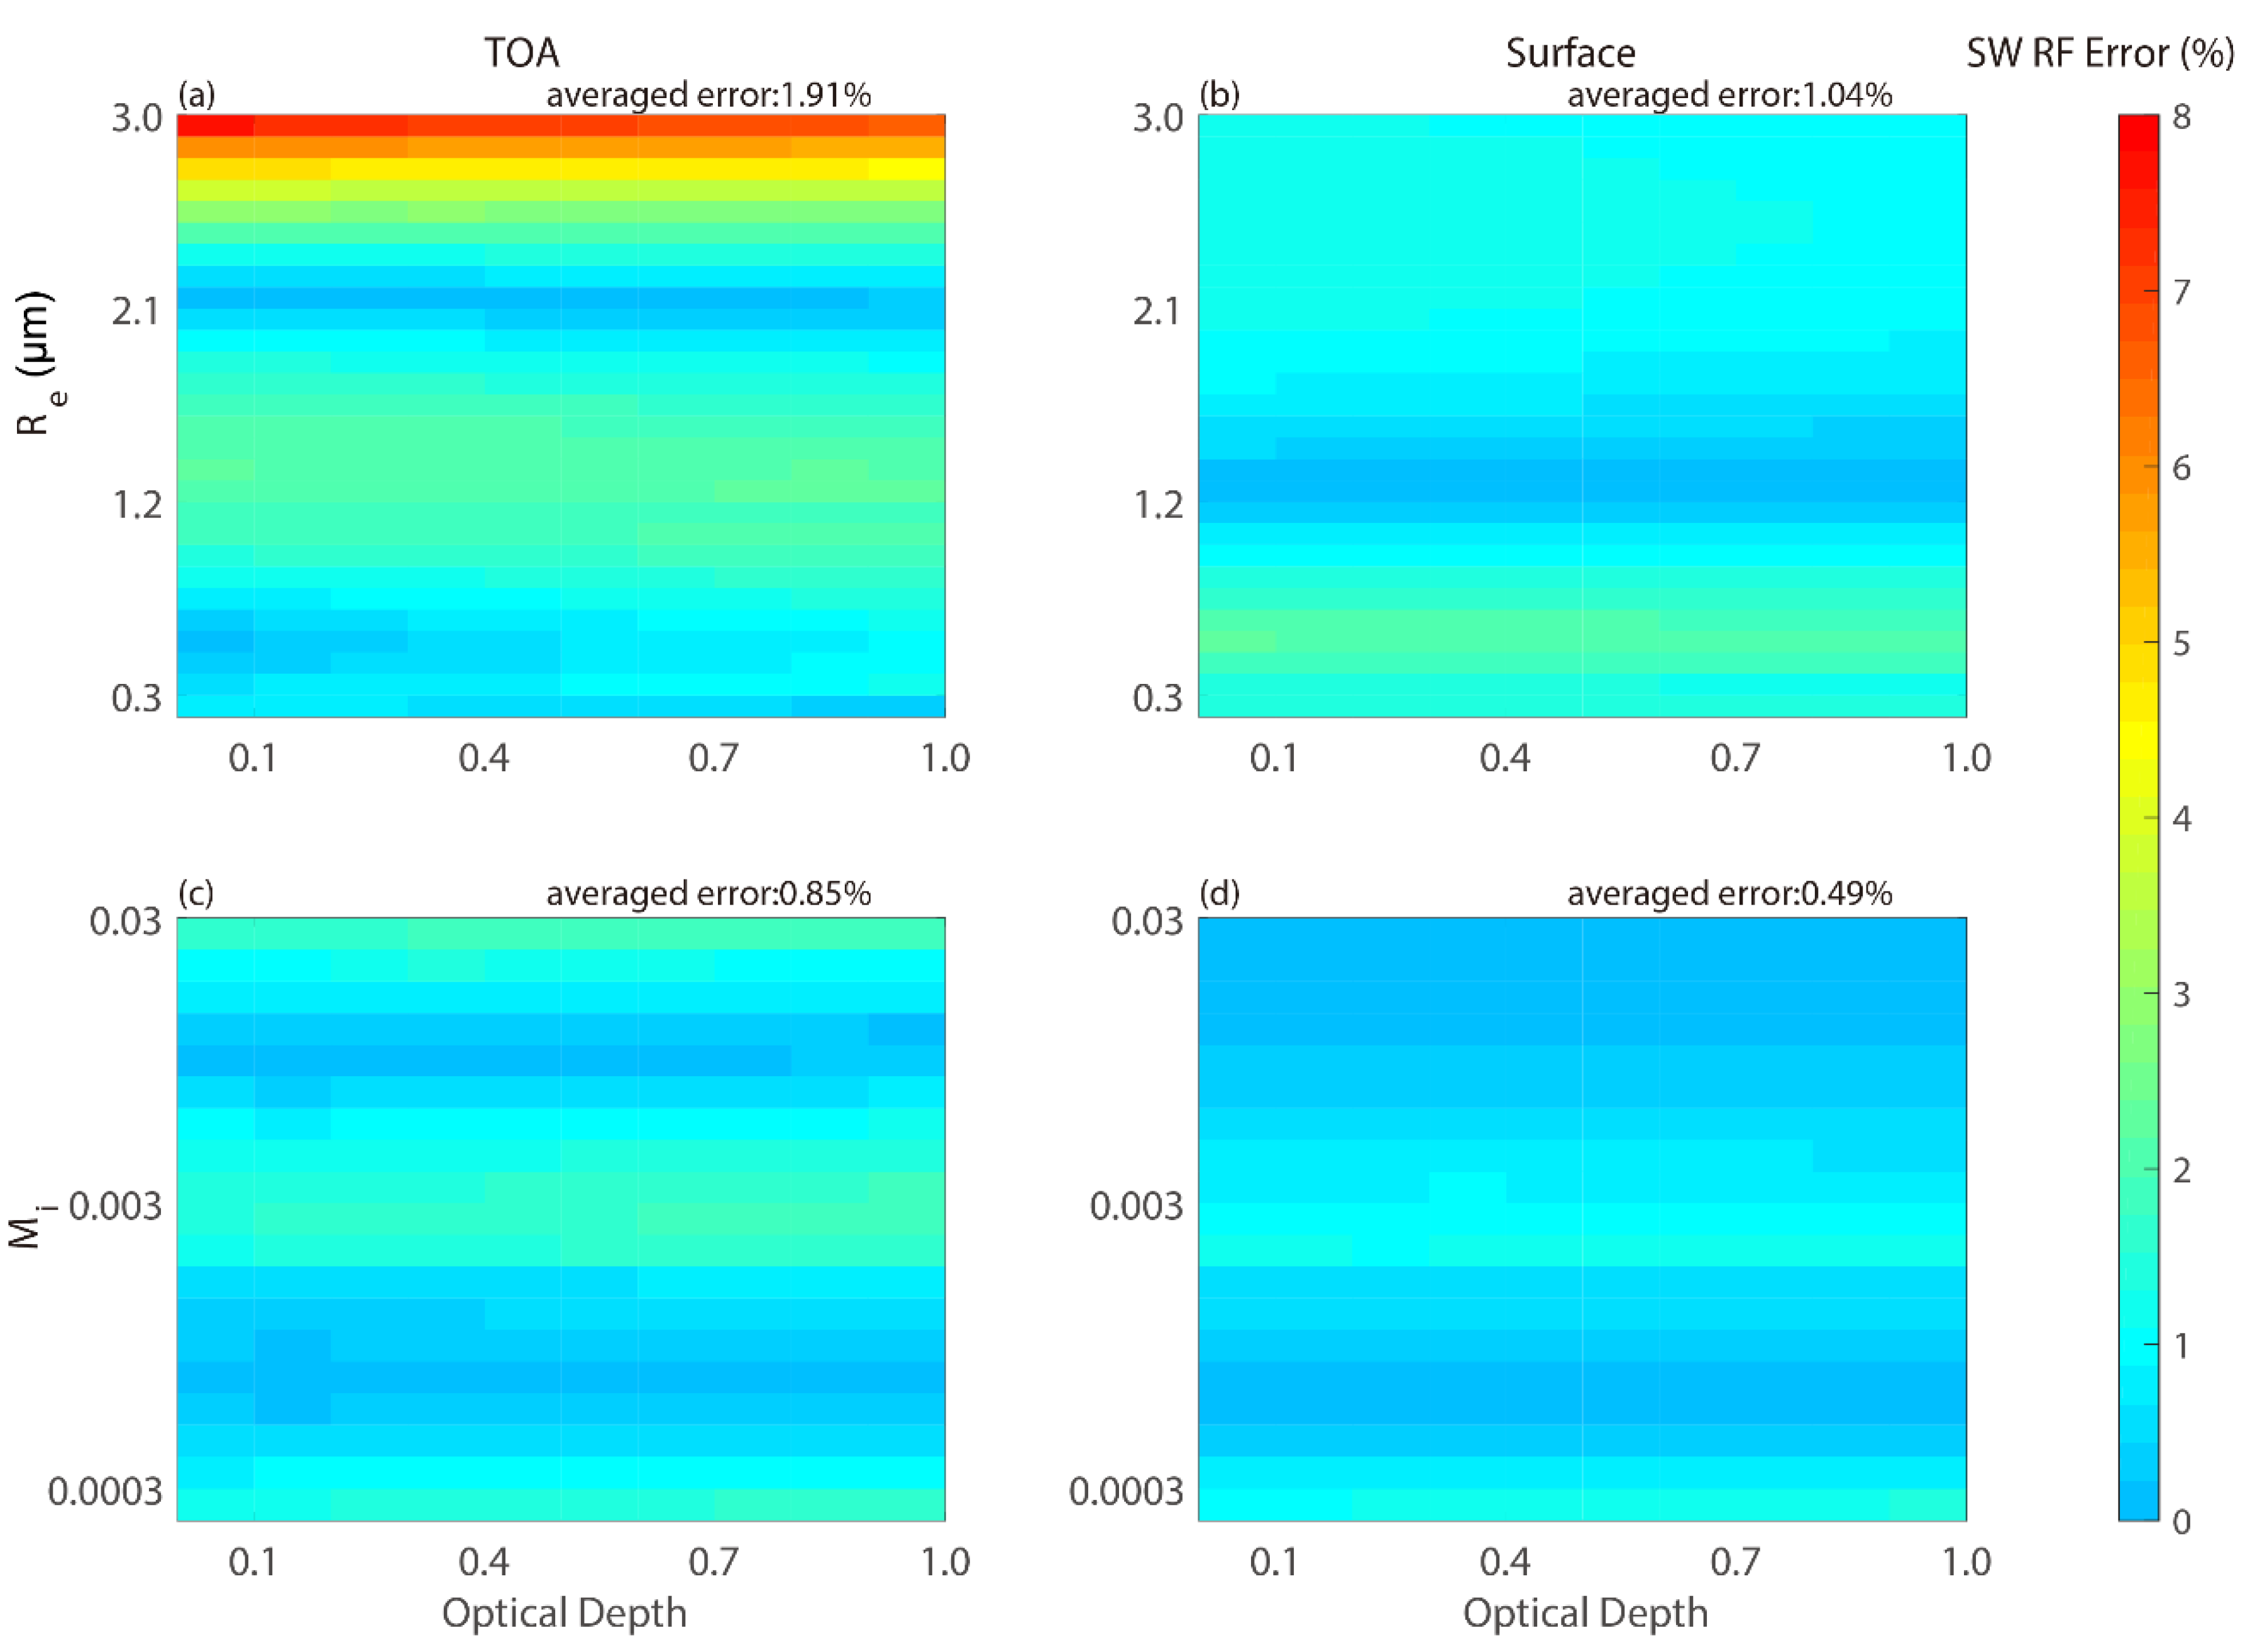
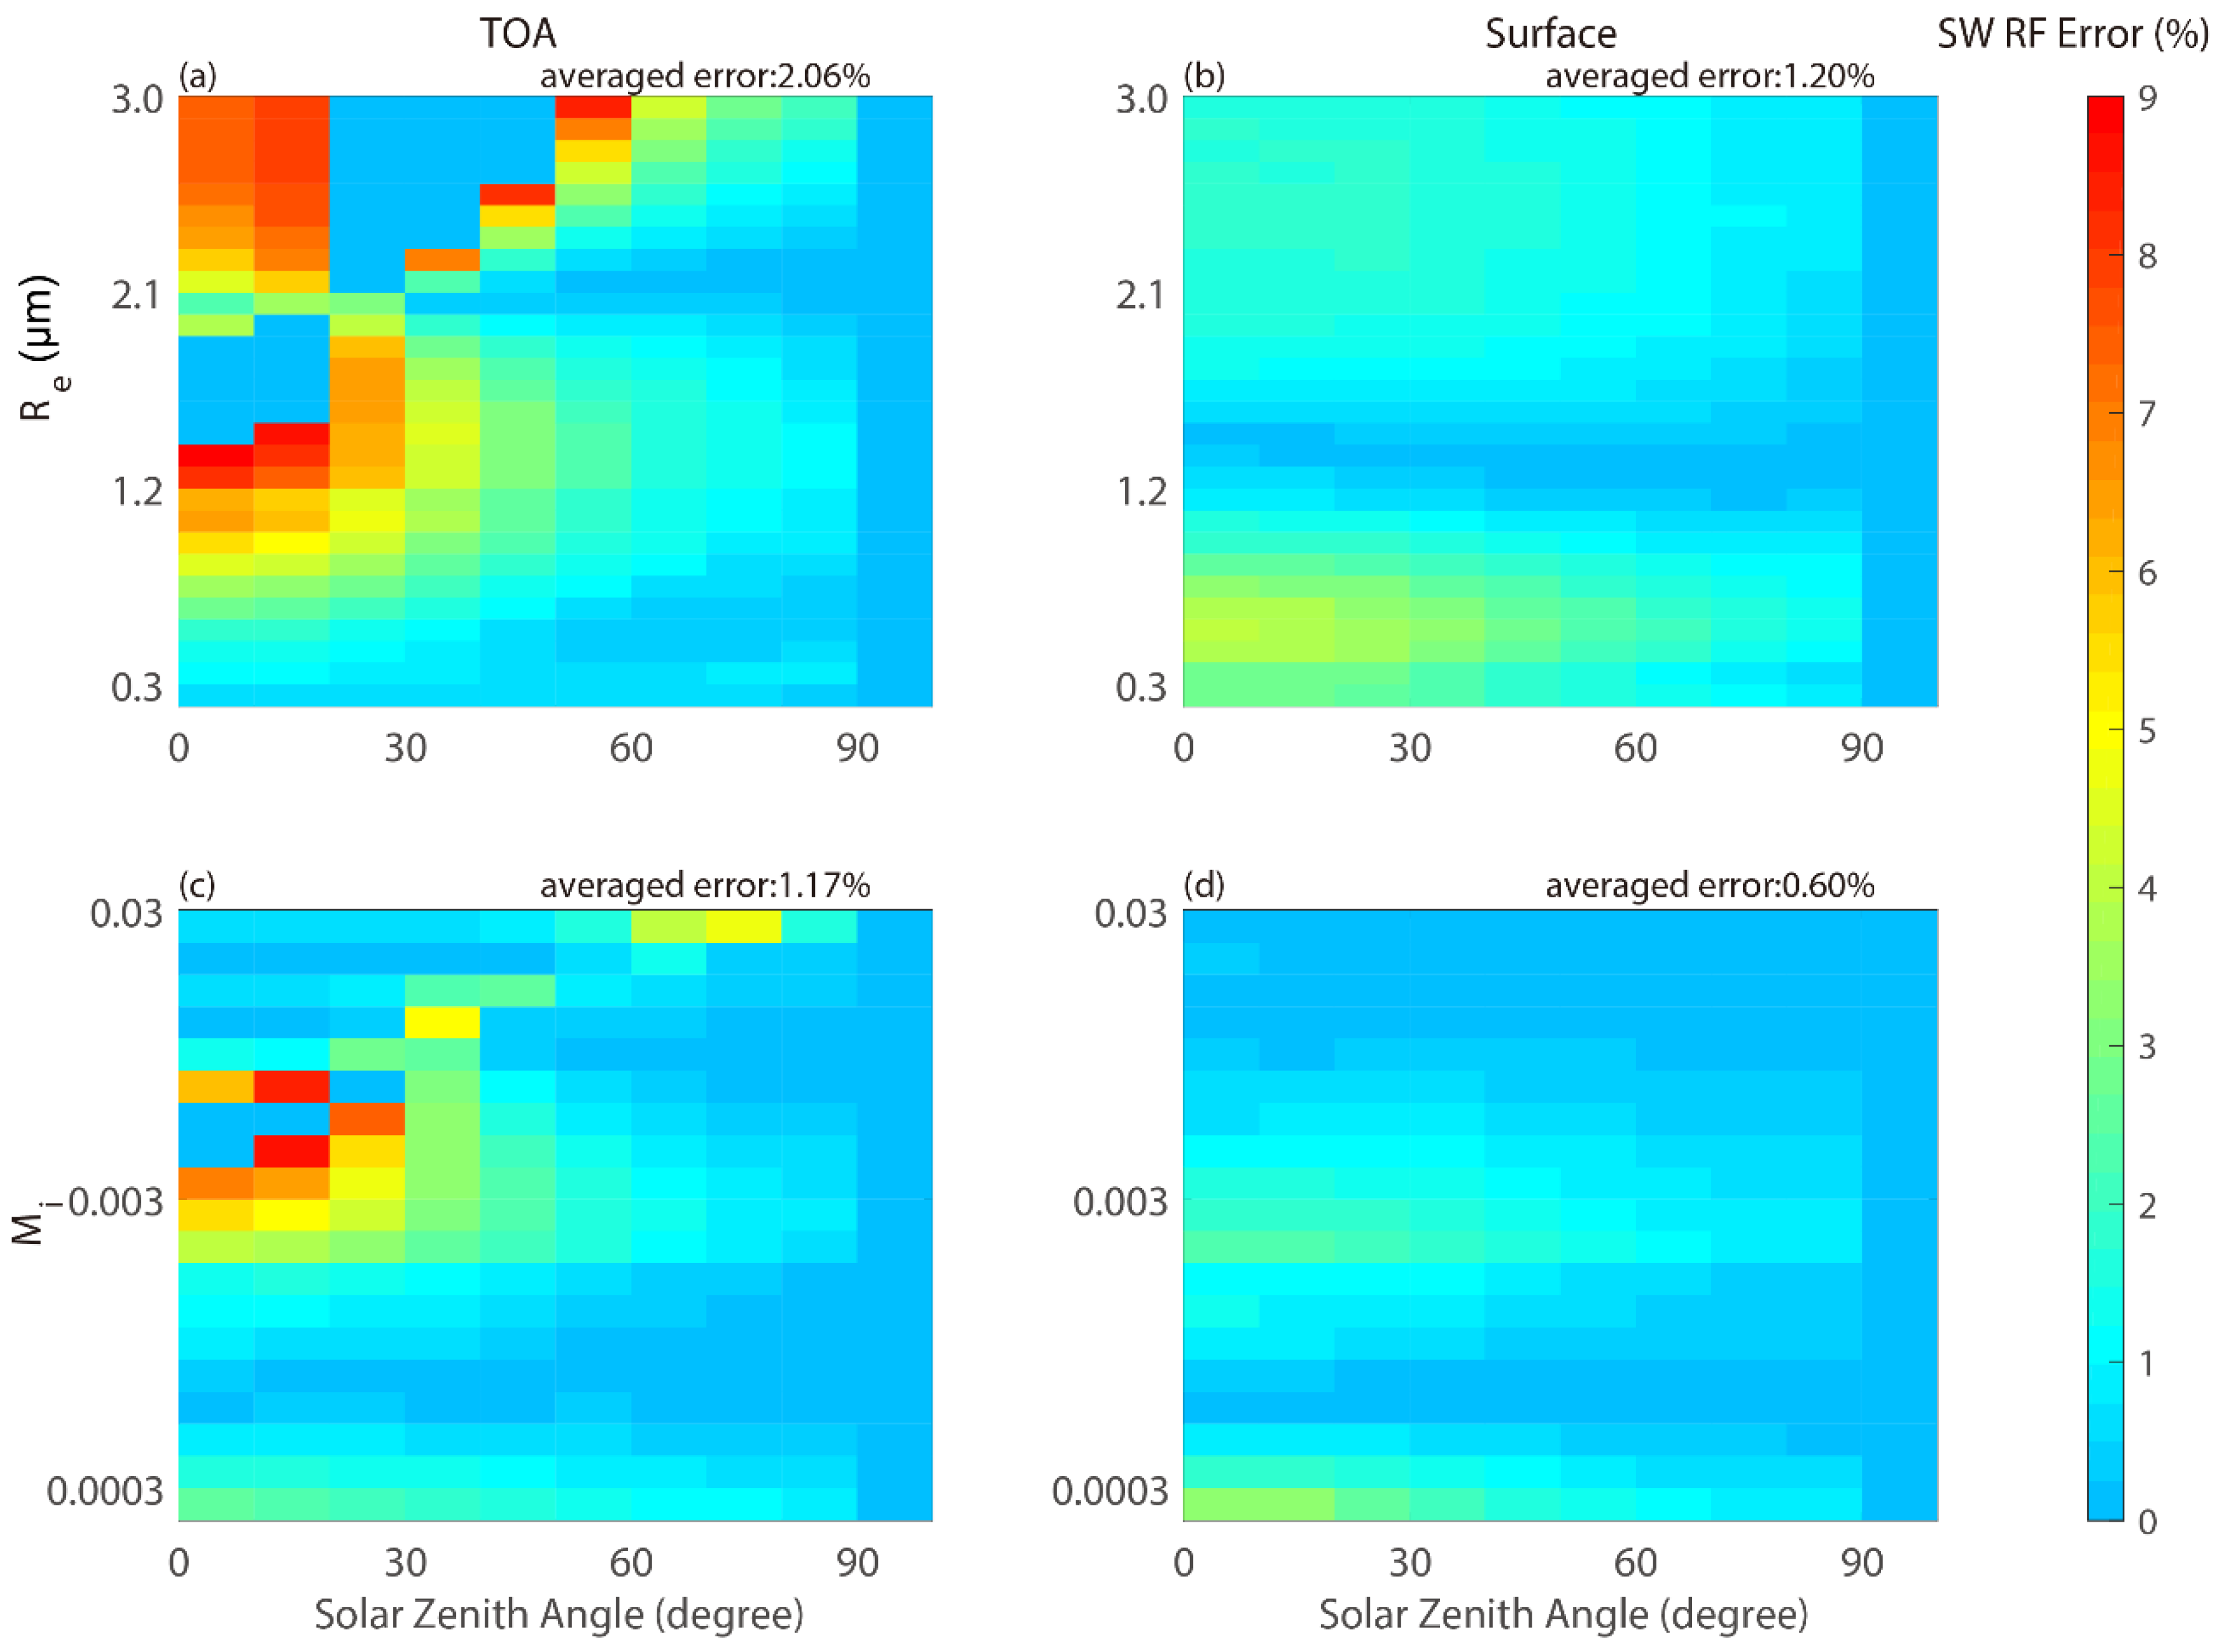
3.2. Evaluation of the Present Parameterization

The parameterization of the bulk SSPs of dust aerosols was evaluated by examining the relative error between the parameterization and the “exact” calculation results.
We found that the parameterized bulk SSPs derived from the functions of the effective radius and imaginary part of the refractive index match well with the results from the “exact” calculations. The averaged relative error between the parameterization and the “exact” calculation for the extinction efficiency is below 1.5%. For the asymmetry factor, the averaged errors and maximum errors in the parameterization are within 0.75% and 2%, respectively. The linear relationship between ω ˜ and R e and M i based on geometric optics is a good approximation. The maximum differences in SSPs between the parameterized and “exact” calculations are less than 6%.
Figure 2 shows the absolute values of the relative errors of the parameterized and “exact” calculations for Q e , ω ˜ , and g in the spectral intervals 0.25–0.70 μm (left panel), 1.30–1.80 μm (middle panel), and 2.50–3.50 μm (right panel). The figure shows that the averaged relative errors of parameterization in Q e , ω ˜ , and g are less than 1.34%, 0.25%, and 0.70%, respectively. It should be noticed that the errors are not only due to the numerical fitting but also include errors produced by the band divisions along with the averaging technique for single scattering properties.

4. Physics of Dust Aerosol Radiative Forcing

To quantify the impact of SSPs parameterization on radiative fluxes, we calculated the total upward fluxes (TUFs) at the TOA and total downward fluxes (TDFs) at the surface by inputting the parameterized and “exact” SSPs into the SBDART radiative transfer model. The solar zenith angle was set to 53°, which represents the global mean daily average value [59]. So, the TUF and TDF calculated at the SZA of 53° is approximately equal to the daily mean value of radiative flux at the TOA and surface. The surface albedo was set to 0.15. Figure 3 shows the relative error of the TUF at the TOA and TDF at the surface for 6 bands, 24 bands, and 151 bands for computations using the parameterized and “exact” SSPs results, with an effective radius varying from 0.3 to 3.0 μm and the imaginary part of the refractive index was fixed s 0.003. The maximum relative error is below 1% for TUF at the TOA and 0.5% for TDF at the surface for different band divisions. These small errors in radiative fluxes indicate that the parameterization schemes, in terms of the effective radius and imaginary part of the refractive index, can be reasonably applied to the dust aerosol radiative forcing calculation.
To study the radiative impact of dust aerosols, we calculated the SW RF of dust at the TOA and surface. Forcing was defined as the difference in the net radiative fluxes (downward fluxes minusupward fluxes) from two simulations: One simulation with aerosols and the other simulation without aerosols. We used the SBDART transfer model to investigate the responses of radiative forcing to the variation of R e , M i , optical depth, and solar zenith angle. Figure 4 shows the dust-aerosol SW RF versus the optical depth, effective radius, and imaginary part of the refractive index at the TOA and the surface, respectively. The values of R e and M i vary widely from 0.3 to 3.0 μm and 0.0003 to 0.03, respectively, which is the same as the range of parameterization. The optical depth varies from 0.1 to 1.0 [60] in Figure 4. In the upper panel of Figure 4, the values of dust SW RF are negative and vary with the effective radius and optical depth at both the TOA and the surface, when the M i was fixed at 0.003. For a given optical depth, the SW RF becomes gradually less negative at the TOA and more negative at the surface with an increasing effective radius because of the decreased single scattering albedo, which resulted in increased absorption and decreased transmission. As the optical depth increases, the values of the SW RF become more negative at both the TOA and the surface under dust heavy loading. The largest negative SW RF values are −91.95 and −177.642 Wm−2 at the TOA and at the surface, respectively. The lower panel of Figure 4 shows the response of the SW RF to variations of the imaginary part of the refractive index. We can see that the variation in M i has a strong impact on SW RF. For a given optical depth, with an increasing of M i , the value of SW RF at the TOA can change from negative to positive. The positive SW RF at the TOA for a large value of M i indicates that more energy is maintained in the earth–atmosphere system to heat the atmosphere for dust particles with strong absorption. At the surface, the values of SW RF are negative for all ranges of optical depth and M i . As the M i and optical depth increase, the SW RF becomes more negative because strong absorption and heavy dust loading reduce the energy reaching the surface.
Similarly, the upper and lower two panels of Figure 5 show the dust aerosol SW RF versus SZA, R e , and M i at both the TOA and the surface for τ = 0.3, respectively. The SZA varies from 0 to 90° in Figure 5. For a given SZA, the variation of SW RF with the Re and Mi is similar with Figure 4. As the SZA increases, the SW RF becomes more negative at both the TOA and the surface. This is because the optical path will significantly increase when the solar beam arrives the dust layer at a large SZA, which would consequently lead to more sunlight being reflected back to space and thus cause a larger negative forcing. When SZA approaches about 90°, the SW RF value is close to zero since little solar flux can get into the dust layer.
To further evaluate the impact of SSPs parameterization on SW RF calculations, we obtained the relative errors of SW RF resulting from the use of “exact” and parameterized SSPs. As Figure 6 and Figure 7 show, the relative errors are very small for all ranges of Re, Mi, optical depth, and SZA at both the TOA and the surface. The averaged relative errors of SW RF are almost all below 2.1% for different variables, except when the Re increases to 3.0 μm. In this case, the maximum relative error of SW RF reaches 8.86% at the TOA. When the value of SZA is small and Re is large, the relative errors are largest because of the strong scattering for strong solar flux and large particles. However, the radius of most particles is not beyond the range that we used in this study [61,62]. Therefore, we can see that the error caused by using the parameterized SSPs of dust in the SW RF calculation is very small. It is feasible to use the parameterized values of dust SSPs instead of the “exact” Mie results in the radiative transfer model to compute the SW RF. We should also note that, although the error in SW RF caused by using the SSPs parameterization is small, there are other factors that could cause error, such as the approximation of scattering by nonspherical dust by V/P-equivalent spheres, and the waveband division, as discussed in Section 2.

5. Summary and Conclusions

In this paper, we presented a parameterization of the single scattering properties for dust in order to establish a fast and accurate scheme to calculate dust shortwave (SW) radiative forcing (RF). Due to the difficulty of obtaining the SSPs of nonspherical dust, assuming that dust particles are spheroids with an aspect ratio of 1.7, we converted the spheroid particle to sphere particles that contained the same total surface area and total volume as the original particle and calculated the SSPs of dust particles using Mie’s theory for a wide range of particle sizes and refractive indices in the shortwave. Based on the bulk SSPs of dust particle collections under different particle distributions, the SSPs of dust aerosols were parameterized in terms of the effective radius and the imaginary part of the refractive index. The result showed that the parameterized SSPs presented as a function of the Re and Mi matched the results of the “exact” calculations well. The averaged relative error of the parameterization and the “exact” calculation for the extinction efficiency, single scattering albedo, and asymmetry factor were within 1.5%, 0.76%, and 0.75%, respectively, which proved the accuracy of the parameterization.
To further quantify the impact of parametrization on the radiative flux of dust aerosols, we computed the radiative flux at the TOA and the surface by using the parameterization and the “exact” SSPs in the radiative transfer model. The maximum relative errors were below 1% for TUF at the TOA and 0.5% for TDF at the surface. Therefore, the SSPs of dust calculated by the parameterization in terms of Re and Mi are well suited for radiative flux calculations. We also calculated the SW RF of dust aerosols at the TOA and surface to examine the response of dust radiative forcing to the particle size, absorption capacity, aerosol loading of dust, and solar zenith angle. The results showed that the imaginary part of the refractive index, which represents the dust absorption ability, has a strong impact on SW RF. The value of SW RF at the TOA changed from negative to positive with an increasing of Mi, which means that, with increasing dust absorption strength, more energy will be kept in the atmosphere to heat the earth–atmosphere system. Because of the decrease of the single scattering albedo, the SW RF became gradually less negative at the TOA and more negative at the surface with increasing effective radius. As the optical depth increased, the values of the SW RF decreased both at the TOA and the surface because of the strong attenuation for heavy loading. When the SZA increased, the SW RF became more negative at both the TOA and the surface due to the long optical path that reflects more sunlight back to space, and thus causes a larger negative forcing. We further evaluated the impact of SSP parameterization on SW RF calculations by calculating the relative error of SW RF between inputs of the “exact” and the parameterized SSPs. The error caused by using the parameterized SSPs of dust in the SW RF calculation was very small at less than 2.1%. Although the parameterization did a good job in reproducing the results obtained from Mie’s theory, we should note that there are other factors that could cause error, such as the approximation of scattering by nonspherical dust by V/P-equivalent spheres, and the waveband division.
This work offers an efficient approach for the parameterization of dust aerosols in shortwave bands. The accuracy of this parameterization guarantees its reliability in climate model applications. Note that the parameterization presented in this paper could be modified for other band structures. The parameterization coefficients in Equations (8)–(10) for the 151 bands between 0.25 and 4.0 μm are available from the authors.

Author Contributions

J.S. conceived and designed the study; M.W. performed the calculations and the parameterization. X.L. and C.W. prepared the investigation. M.W. wrote the manuscript drafting. J.S. and J.G. reviewed and modified the paper

Funding

This work was supported by the National Natural Science Foundation of China (41430425, 41922032, 41105108) and the Fundamental Research Funds for the Central University (lzujbky-2017-72).

Conflicts of Interest

The authors declare no conflict of interest.

References

  1. Charlson, R.J.; Heintzenberg, J. Aerosol Forcing of Climate; Wiley Chichester: New York, NY, USA, 1995. [Google Scholar]
  2. Houghton, J.T.; Meiro Filho, L.G.; Callander, B.A.; Harris, N.; Kattenburg, A.; Maske, K. Climate change 1995: The science of climate change. Clim. Chang. 1996, 584, 163–168. [Google Scholar]
  3. Ge, J.M.; Huang, J.P.; Xu, C.P.; Qi, Y.L.; Liu, H.Y. Characteristics of Taklimakan dust emission and distribution: A satellite and reanalysis field perspective. J. Geophys. Res. Atmos. 2014, 119, 11772–11783. [Google Scholar] [CrossRef]
  4. Tegen, I. Modeling the mineral dust aerosol cycle in the climate system. Sci. Rev. 2003, 22, 1821–1834. [Google Scholar] [CrossRef]
  5. Slingo, A.; Ackerman, T.P.; Allan, R.P.; Kassianov, E.I.; McFarlane, S.A. Observations of the impact of a major Saharan dust storm on the atmospheric radiation balance. Geophys. Res. Lett. 2006, 33, L24817. [Google Scholar] [CrossRef]
  6. Wu, L.; Su, H.; Jiang, J.H. Regional simulation of aerosol impacts on precipitation during the East Asian summer monsoon. J. Geophys. Res. Atmos. 2013, 118, 6454–6467. [Google Scholar] [CrossRef]
  7. Xu, X.; Wang, J. Retrieval of aerosol microphysical properties from AERONET photopolarimetric measurements: 1. Information content analysis. J. Geophys. Res. Atmos. 2015, 120, 7059–7078. [Google Scholar] [CrossRef]
  8. Sokolik, I.N.; Toon, O.B. Direct radiative forcing by anthropogenic airborne mineral aerosols. Nature 1996, 381, 681–683. [Google Scholar] [CrossRef]
  9. Tegen, I.; Hollrig, P.; Chin, M.; Fung, I.; Jacob, D.; Penner, J. Contribution of different aerosol species to the global aerosol extinction optical thickness: Estimates from model results. J. Geophys. Res. Atmos. 1997, 102, 23895–23915. [Google Scholar] [CrossRef]
  10. Miller, R.L.; Tegen, I. Climate response to soil dust aerosols. J. Climat. 1998, 11, 3247–3267. [Google Scholar] [CrossRef]
  11. Hansen, J.; Sato, M.; Ruedy, R. Radiative forcing and climate response. J. Geophys. Res. Atmos. 1997, 102, 6831–6864. [Google Scholar] [CrossRef]
  12. Jacobson, M.Z. Global direct radiative forcing due to multicomponent anthropogenic and natural aerosols. J. Geophys. Res. Atmos. 2001, 106, 1551–1568. [Google Scholar] [CrossRef]
  13. Zhang, L.; Li, Q.B.; Gu, Y.; Liou, K.N.; Meland, B. Dust vertical profile impact on global radiative forcing estimation using a coupled chemical-transport-radiative-transfer model. Atmos. Chem. Phys. 2013, 13, 7097–7114. [Google Scholar] [CrossRef]
  14. Dubovik, O.; Holben, B.N.; Lapyonok, T.; Sinyuk, A.; Mishchenko, M.I.; Yang, P.; Slutsker, I. Non-spherical aerosol retrieval method employing light scattering by spheroids. Geophys. Res. Lett. 2002, 29, 1415. [Google Scholar] [CrossRef]
  15. Okada, K.; Heintzenberg, J.; Kai, K.J.; Qin, Y. Shape of atmospheric mineral particles collected in three Chinese arid-regions. Geophys. Res. Lett. 2001, 28, 3123–3126. [Google Scholar] [CrossRef]
  16. Munoz, O.; Volten, H.; de Haan, J.F.; Vassen, W.; Hovenier, J.W. Experimental determination of scattering matrices of randomly oriented fly ash and clay particles at 442 and 633 nm. J. Geophys. Res. Atmos. 2001, 106, 22833–22844. [Google Scholar] [CrossRef]
  17. Kalashnikova, O.V.; Sokolik, I.N. Modeling the radiative properties of nonspherical soil-derived mineral aerosols. J. Quant. Spectrosc. Radiat. 2004, 87, 137–166. [Google Scholar] [CrossRef]
  18. Heintzenberg, J. Particle size distributions from scattering measurements of nonspherical particles via Mie-theory. Beitr. Phys. Atmos. 1998, 51, 91–99. [Google Scholar]
  19. Volten, H.; Munoz, O.; Rol, E.; de Haan, J.F.; Vassen, W. Scattering matrices of mineral aerosol particles at 441.6 nm and 632.8 nm. J. Geophys. Res. Atmos. 2001, 106, 17375–17401. [Google Scholar] [CrossRef]
  20. Herman, M.; Deuze, J.L.; Marchand, A.; Roger, B.; Lallart, P. Aerosol remote sensing from POLDER/ADEOS over the ocean: Improved retrieval using a nonspherical particle model. J. Geophys. Res. Atmos. 2005, 110, D10S02. [Google Scholar] [CrossRef]
  21. Kalashnikova, O.V.; Kahn, R.; Sokolik, I.N.; Li, W.H. Ability of multiangle remote sensing observations to identify and distinguish mineral dust types: Optical models and retrievals of optically thick plumes. J. Geophys. Res. Atmos. 2005, 110, D18S14. [Google Scholar] [CrossRef]
  22. Mishchenko, M.I.; Hovenier, J.W.; Travis, L.D. Light Scattering by Nonspherical Particles; Elsevier: New York, NY, USA, 2000. [Google Scholar]
  23. Kahn, R.; West, R.; McDonald, D.; Rheingans, B.; Mishchenko, M.I. Sensitivity of multiangle remote sensing observations to aerosol sphericity. J. Geophys. Res. Atmos. 1997, 102, 16861–16870. [Google Scholar] [CrossRef]
  24. Krotkov, N.A.; Flittner, D.E.; Krueger, A.J.; Kostinski, A.; Riley, C.; Rose, W.; Torres, O. Effect of particle non-sphericity on satellite monitoring of drifting volcanic ash clouds. J. Quant. Spectrosc. Radiat. 1999, 63, 613–630. [Google Scholar] [CrossRef]
  25. Liu, Y.G.; Arnott, W.P.; Hallett, J. Particle size distribution retrieval from multispectral optical depth: Influences of particle nonsphericity and refractive index. J. Geophys. Res. Atmos. 1999, 104, 31753–31762. [Google Scholar] [CrossRef]
  26. Dubovik, O.; Holben, B.; Eck, T.F.; Smirnov, A.; Kaufman, Y.J.; King, M.D.; Tanré, D.; Slutsker, I. Variability of absorption and optical properties of key aerosol types observed in worldwide locations. J. Atmos. Sci. 2002, 59, 590–608. [Google Scholar] [CrossRef]
  27. Mishchenko, M.I.; Geogdzhayev, I.V.; Liu, L.; Ogren, J.A.; Lacis, A.A.; Rossow, W.B.; Hovenier, J.W.; Volten, H.; Muñoz, O. Aerosol retrievals from AVHRR radiances: Effects of particle nonsphericity and absorption and an updated long-term global climatology of aerosol properties. J. Quant. Spectrosc. Radiat. 2003, 79, 953–972. [Google Scholar] [CrossRef]
  28. D’Almeida, G.A.; Koepke, P.; Shettle, E.P. Atmospheric Aerosols: Global Climatology and Radiative Characteristics; A Deepak Publishing: Hampton, VA, USA, 1991. [Google Scholar]
  29. Tegen, I.; Lacis, A.A. Modeling of particle size distribution and its influence on the radiative properties of mineral dust aerosol. J. Geophys. Res. Atmos. 1996, 101, 19237–19244. [Google Scholar] [CrossRef]
  30. Levoni, C.; Cervino, M.; Guzzi, R.; Torricella, F. Atmospheric aerosol optical properties: A database of radiative characteristics for different components and classes. Appl. Opt. 1997, 36, 8031–8041. [Google Scholar] [CrossRef] [PubMed]
  31. Collins, W.D.; Rasch, P.J.; Eaton, B.E.; Fillmore, D.W.; Kiehl, J.T.; Beck, C.T.; Zender, C.S. Simulation of aerosol distributions and radiative forcing for INDOEX: Regional climate impacts. J. Geophys. Res. Atmos. 2002, 107, 8028. [Google Scholar] [CrossRef]
  32. Mishchenko, M.I.; Travis, L.D.; Kahn, R.A.; West, R.A. Modeling phase functions for dustlike tropospheric aerosols using a shape mixture of randomly oriented polydisperse spheroids. J. Geophys. Res. Atmos. 1997, 102, 16831–16847. [Google Scholar] [CrossRef]
  33. Dubovik, O.; King, M.D. A flexible inversion algorithm for retrieval of aerosol optical properties from sun and sky radiance measurements. J. Geophys. Res. 2000, 105, 673–696. [Google Scholar] [CrossRef]
  34. Dubovik, O.; Sinyuk, A.; Lapyonok, T.; Holben, B.N.; Mishchenko, M. Application of spheroid models to account for aerosol particle nonsphericity in remote sensing of desert dust. J. Geophys. Res. Atmos. 2006, 111, D11208. [Google Scholar] [CrossRef]
  35. Feng, Q.; Yang, P.; Kattawar, G.W.; Hsu, C.N.; Tsay, S.-C.; Laszlo, I. Effects of particle nonsphericity and radiation polarization on retrieving dust properties from MODIS observations. J. Aerosol Sci. 2009, 40, 776–789. [Google Scholar] [CrossRef]
  36. Kanaya, Y.; Kajii, Y.; Akimoto, H. Solar actinic flux and photolysis frequency determinations by radiometers and a radiative transfer model at Rishiri Island: Comparisons, cloud effects, and detection of an aerosol plume from Russian forest fires. Atmos. Environ. 2003, 37, 2463–2475. [Google Scholar] [CrossRef]
  37. Mishchenko, M.I.; Travis, L.D. Light scattering by polydispersions of randomly oriented spheroids with sizes comparable to wavelengths of observatio. Appl. Opt. 1994, 33, 7206–7225. [Google Scholar] [CrossRef] [PubMed]
  38. Nakajima, T.; Tanaka, M.; Yamano, M.; Shiobara, M.; Arao, K.; Nakanishi, Y. Aerosol optical characteristics in the yellow sand events observed in May, 1982 at Nagasaki-Part II Models. J. Meteorol. Soc. Jpn. Ser. 1989, 67, 279–291. [Google Scholar] [CrossRef] [Green Version]
  39. Yang, P.; Feng, Q.; Hong, G.; Kattawar, G.W.; Wiscombe, W.J. Modeling of the scattering and radiative properties of nonspherical dust-like aerosols. J. Aerosol Sci. 2007, 38, 995–1014. [Google Scholar] [CrossRef]
  40. Fu, Q.; Thorsen, T.J.; Su, J.; Ge, J.M.; Huang, J.P. Test of Mie-based single-scattering properties of non-spherical dust aerosols in radiative flux calculations. J. Quant. Spectrosc. Radiat. 2009, 110, 1640–1653. [Google Scholar] [CrossRef]
  41. Fu, Q.; Liou, K.N. Parameterization of the radiative properties of cirrus clouds. J. Atmos. Sci. 1993, 50, 2008–2025. [Google Scholar] [CrossRef] [Green Version]
  42. Fu, Q.A. An accurate parameterization of the solar radiative properties of cirrus clouds for climate models. J. Climat. 1996, 9, 2058–2082. [Google Scholar] [CrossRef] [Green Version]
  43. Vouk, V. Projected area of convex bodies. Nature 1948, 162, 330–331. [Google Scholar] [CrossRef]
  44. Neshyba, S.P.; Grenfell, T.C.; Warren, S.G. Representation of a nonspherical ice particle by a collection of independent spheres for scattering and absorption of radiation: 2. Hexagonal columns and plates. J. Geophys. Res. Atmos. 2003, 108, 4448. [Google Scholar] [CrossRef]
  45. Yi, B.; Hsu, C.N.; Yang, P.; Tsay, S.-C. Radiative transfer simulation of dust-like aerosols: Uncertainties from particle shape and refractive index. J. Aerosol Sci. 2011, 42, 631–644. [Google Scholar] [CrossRef]
  46. Haapanala, P.; Raisanen, P.; Kahnert, M.; Nousiainen, T. Sensitivity of the shortwave radiative effect of dust on particle shape: Comparison of spheres and spheroids. J. Geophys. Res. Atmos. 2012, 117, D08201. [Google Scholar] [CrossRef] [Green Version]
  47. Raisanen, P.; Haapanala, P.; Chung, C.E.; Kahnert, M.; Makkonen, R.; Tonttila, J.; Nousiainen, T. Impact of dust particle non-sphericity on climate simulations. Q. J. R. Meteorol. Soc. 2013, 139, 2222–2232. [Google Scholar] [CrossRef]
  48. Shettle, E.P.; Fenn, R.W. Models of aerosols of lower troposphere and the effect of humidity variations on their optical properties. AFCRL Tech. Rep. 1979, 79, 0214. [Google Scholar]
  49. WMO. Radiation commission of IAMAP meeting of experts on aerosol and their climatic effects. World Meteorol. Organ. Rep. 1983, WCP55, 28–30. [Google Scholar]
  50. Koepke, P.; Hess, M.; Schult, I.; Shettle, E.P. Global aerosol data set. MPI Meteorol. Hambg. Rep. 1997, 243, 44. [Google Scholar]
  51. Carlson, T.N.; Benjamin, S.G. Rradiative heating rates for saharan dust. J. Atmos. Sci. 1980, 37, 193–213. [Google Scholar] [CrossRef] [Green Version]
  52. Mogo, S.; Cachorro, V.E.; de Frutos, A.M. In situ UV-VIS-NIR absorbing properties of atmospheric aerosol particles: Estimates of the imaginary refractive index and comparison with columnar values. J. Environ. Manag. 2012, 111, 267–271. [Google Scholar] [CrossRef]
  53. Di Biagio, C.; Boucher, H.; Caquineau, S.; Chevaillier, S.; Cuesta, J.; Formenti, P. Variability of the infrared complex refractive index of African mineral dust: Experimental estimation and implications for radiative transfer and satellite remote sensing. Atmos. Chem. Phys. 2014, 14, 11093–11116. [Google Scholar] [CrossRef] [Green Version]
  54. Nakajima, T.; Tonna, G.; Rao, R.Z.; Boi, P.; Kaufman, Y.; Holben, B. Use of sky brightness measurements from ground for remote sensing of particulate polydispersions. Appl. Opt. 1996, 35, 2672–2686. [Google Scholar] [CrossRef] [PubMed]
  55. Hansen, J.E.; Travis, L.D. Light scattering in planetary atmospheres. Space Sci. Rev. 1974, 16, 527–610. [Google Scholar] [CrossRef]
  56. Ricchiazzi, P.; Yang, S.R.; Gautier, C.; Sowle, D. SBDART: A research and teaching software tool for plane-parallell radiative transfer in the Earth’s atmosphere. Bull. Am. Meteorol. Soc. 1998, 79, 2101–2114. [Google Scholar] [CrossRef] [Green Version]
  57. Liou, K.N. An Introduction to Atmospheric Radiation, 2nd ed.; China Meteorological Press: Beijing, China, 2004; Volume 10, p. 104. [Google Scholar]
  58. Slingo, A.; Schrecker, H.M. On the shortwave radiative properties of stratiform water clouds. Q. J. R. Meteorol. Soc. 1982, 108, 407–426. [Google Scholar] [CrossRef]
  59. Li, J.; Ma, X.; von Salzen, K.; Dobbie, S. Parameterization of sea-salt optical properties and physics of the associated radiative forcing. Atmos. Chem. Phys. 2008, 8, 4787–4798. [Google Scholar] [CrossRef] [Green Version]
  60. Alizadeh-Choobari, O.; Sturman, A.; Zawar-Reza, P. A global satellite view of the seasonal distribution of mineral dust and its correlation with atmospheric circulation. Dyn. Atmos. Ocean. 2014, 68, 20–34. [Google Scholar] [CrossRef]
  61. Shao, J.; Mao, J. Dust Particle Size Distributions during Spring in Yinchuan, China. Adv. Meteorol. 2016, 2016, 6940502. [Google Scholar] [CrossRef] [Green Version]
  62. Jeffrey, S.R.; Halflidi, H.J.; Hal, B.M.; Alexander, S. Comparison of size and morphological measurements of coarse mode dust particles from Africa. J. Geophys. Res. Atmos. 2003, 108, 8593. [Google Scholar]
Figure 1. The extinction efficiency (ac), the single scattering albedo (df), and the asymmetry factor (gi) values versus the effective radius and the imaginary part of the refractive index in the spectral intervals 0.25–0.70 μm, 1.30–1.80 μm, and 2.50–3.50 μm.
Atmosphere 10 00728 g001
Figure 2. Relative errors between parameterized and “exact” calculations for Q e , ω ˜ , and g in the spectral intervals 0.25–0.70 μm, 1.30–1.80 μm, and 2.50–3.50 μm.
Atmosphere 10 00728 g002
Figure 3. Relative errors of the total upward fluxes (TUF) at the top of the atmosphere (TOA) and the total downward fluxes (TDF) at the surface for 6 bands, 24 bands, and 151 bands between computations using the “exact” and the parameterized single-scattering properties (SSPs).
Atmosphere 10 00728 g003
Figure 4. Dust-aerosol shortwave radiative forcing versus τ, Re, and Mi at the TOA and the surface for SZA = 53°, respectively. For (a,b), Mi = 0.003; for (c,d), Re = 1.0 μm.
Atmosphere 10 00728 g004
Figure 5. Dust-aerosol shortwave radiative forcing versus SZA, Re, and Mi at the TOA and the surface for τ = 0.3, respectively. For (a,b), Mi = 0.003; for (c,d), Re = 1.0 μm.
Atmosphere 10 00728 g005
Figure 6. Relative errors of SW RF between the calculation by using SSPs from parameterization and Mie theory versus optical depth for SZA = 53°. For (a,b), Mi = 0.003; for (c,d), Re = 1.0 μm.
Atmosphere 10 00728 g006
Figure 7. Relative errors of SW RF between the calculation by using SSPs from parameterization and Mie theory versus SZA for τ = 0.3. For (a,b), Mi = 0.003; for (c,d), Re = 1.0 μm.
Atmosphere 10 00728 g007
Table 1. Values of the coefficients in Equation (8) for the parameterization of the extinction efficiency (the unit for R e is μm).
Band
Limit (um)
A0A1A2A3A4Fraction of Sλ
a00(×100)a01(×10−2)a10(×10−2)a11(×10−1)a20(×10−1)a21(×10−3)a30(×10−2)a31(×10−3)a40(×10−4)a41(×10−3)
0.25–0.32.0015.60554.63−2.060−1.405−495.01.150184.5−1.652−17.700.0034
0.3–0.351.99317.4269.94−5.724−2.468−352.43.204180.1−15.73−19.060.0215
0.35–0.3751.98324.3179.84−8.669−3.251−183.54.925152.0−28.83−17.550.0216
0.375–0.41.97631.8487.36−11.48−3.892−1.0876.435113.9−40.87−14.820.0188
0.4–0.4251.97035.5194.65−14.19−4.553195.98.05769.16−54.19−11.380.0301
0.425–0.4751.96344.66105.2−17.76−5.576458.610.698.730−76.39−6.7180.0701
0.475–0.51.95852.84114.5−22.62−6.552851.313.30−93.00−99.031.9840.0375
0.5–0.5751.95860.90125.2−26.79−7.801121416.81−188.6−130.310.150.1059
0.575–0.6251.96568.42136.2−32.08−9.256171121.10−327.4−169.422.520.0662
0.625–0.71.98073.83143.7−37.06−10.51221725.04−476.2−206.436.240.0868
0.7–0.752.00374.50148.2−40.70−11.58264128.58−607.5−240.748.660.0506
0.75–0.82.02774.86149.5−42.93−12.26292631.01−698.9−264.857.480.0451
0.8–0.8752.06272.46148.4−44.80−12.91321533.51−796.6−290.567.120.0587
0.875–12.12864.34141.7−46.50−13.52358636.42−931.4−322.280.890.0778
1–1.12.21748.19127.6−45.93−13.68381338.34−1032−346.191.940.0505
1.1–1.22.30129.66110.6−43.73−13.39386838.78−1081−355.798.020.0413
1.2–1.32.38911.8990.34−40.69−12.76382738.23−1099−356.3101.20.0347
1.3–1.552.538−24.4951.53−33.04−11.12351835.43−1058−339.199.800.0646
1.55–1.652.697−66.615.358−23.00−8.814299930.74−955.5−304.492.600.0187
1.65–2.152.901−121.8−62.08−7.506−4.899203321.68−726.2−230.473.730.0548
2.15–2.4253.177−196.9−165.216.291.661395.55.481−307.1−92.1137.390.0136
2.425–2.9253.347−244.2−242.933.467.082−911.0−8.69149.7633.215.1160.0146
2.925–3.4253.498−289.0−330.653.5613.61−2541−26.36511.2192.8−37.530.0077
3.425–43.567−308.9−399.267.1419.10−3763−41.78874.5334.8−72.000.0054
0.25–0.71.97055.45119.2−25.15−7.424114216.12−182.1−125.910.320.4879
0.7–1.32.16354.27131.8−44.15−13.02346935.46−910.0−315.579.560.3408
1.3–1.82.643−52.3020.39−26.21−9.520315232.10−982.7−313.994.280.1010
1.8–2.53.066−166.8−122.76.446−1.085108512.33−485.4−150.952.960.0465
2.5–3.53.432−269.1−291.844.6210.71−1814−18.52305.1121.8−18.460.0195
3.5–4.03.571−310.7−405.668.4519.63−3885−43.29911.1348.8−75.500.0043
Table 2. Values of the coefficients in Equation (9) for the parameterization of the single scattering albedo (the unit for R e is μm).
Band
Limit (um)
B0B1B2
b00(×10−1)b01(×10−2)b02(×100)b10(×10−4)b11(×10−1)b12(×10−2)b20(×10−5)b21(×10−2)b22(×10−1)
0.25–0.310.0191.27−35.22181.7−120.010200−1127204.4−103.7
0.3–0.3510.0078.23−30.72177.4−103.18069−932.8146.9−41.53
0.35–0.3759.99866.86−28.14170.1−93.766977−824.9117.2−12.29
0.375–0.49.99757.32−26.34163.1−87.306259−748.497.565.807
0.4–0.4259.99747.63−24.69155.9−81.405628−682.280.3520.67
0.425–0.4759.99732.74−22.44145.8−73.264798−591.857.4238.97
0.475–0.59.99819.31−20.59134.4−66.384130−510.738.8852.51
0.5–0.57510.001.886−18.48121.9−58.373404−425.618.7465.06
0.575–0.62510.00−17.56−16.36107.8−49.882687−337.5−1.25375.23
0.625–0.710.01−35.09−14.7293.92−42.852146−262.5−16.4680.77
0.7–0.7510.01−50.73−13.4482.08−36.881726−202.9−28.2983.15
0.75–0.810.01−61.90−12.6473.91−32.831466−164.3−35.6183.37
0.8–0.87510.01−74.20−11.8865.86−28.571220−126.5−42.6582.14
0.875–110.02−91.49−11.0053.78−22.92932.8−75.40−50.9578.54
1–1.110.02−108.9−10.3642.36−17.59710.4−31.99−57.5972.78
1.1–1.210.02−122.4−10.0233.79−13.78585.0−2.662−61.5967.19
1.2–1.310.02−134.6−9.84627.19−10.59506.720.05−64.5061.54
1.3–1.5510.03−152.7−9.73817.58−6.260435.347.68−67.7352.59
1.55–1.6510.03−172.0−9.5758.219−2.074393.871.92−71.0843.88
1.65–2.1510.04−196.2−9.910−1.7502.486388.595.07−74.4033.79
2.15–2.42510.05−238.5−10.09−16.989.642376.1130.8−83.2222.47
2.425–2.92510.05−275.8−10.03−28.8615.27347.4157.5−92.1416.78
2.925–3.42510.07−333.6−9.417−45.7023.50232.8198.7−108.814.30
3.425–410.08−402.0−7.957−64.5732.87−4.109247.7−131.017.72
0.25–0.710.003.893−19.54127.2−62.923937−485.832.8551.78
0.7–1.310.02−90.53−11.2055.66−24.161043−89.09−46.7575.92
1.3–1.810.03−161.8−9.75413.20−4.347422.958.42−68.5547.80
1.8–2.510.04−216.3−10.03−9.2215.944389.5111.9−77.7927.26
2.5–3.510.06−300.1−9.862−36.0118.71314.6173.9−98.2414.67
3.5–4.010.08−408.4−7.783−66.2933.75−31.61252.4−133.218.31
Table 3. Values of the coefficients in Equation (10) for the parameterization of the asymmetry factor (the unit for R e is μm).
Band
Limit (um)
C0C1C2
c00(×10−2)c01(×10−1)c02(×10−1)c10(×10−1)c11(×10−1)c12(×100)c20(×10−2)c21(×10−2)c22(×10−2)
0.25–0.348.27−2.478−13.473.234−3.5806.749−11.5693.71−476.6
0.3–0.3558.355.591−27.101.597−18.268.272−4.240136.3−462.8
0.35–0.37558.835.872−27.041.432−18.388.026−3.345131.9−436.2
0.375–0.459.135.948−26.651.323−18.197.782−2.760127.6−414.5
0.4–0.42559.465.873−25.941.214−17.717.487−2.212122.3−391.9
0.425–0.47559.585.875−25.111.140−17.287.116−1.818116.0−362.5
0.475–0.559.805.573−23.761.047−16.246.661−1.364107.6−331.6
0.5–0.57559.515.412−22.521.057−15.466.210−1.40799.85−299.6
0.575–0.62558.955.081−20.871.116−14.295.661−1.70790.14−263.0
0.625–0.758.154.696−19.261.227−13.075.154−2.25380.99−230.8
0.7–0.7557.094.368−17.901.396−12.044.727−3.08073.35−204.1
0.75–0.856.094.164−17.021.561−11.374.444−3.86768.21−186.3
0.8–0.87554.783.929−16.041.784−10.624.134−4.91962.61−167.3
0.875–152.623.564−14.662.151−9.5103.704−6.63954.77−141.8
1–1.149.933.245−13.432.613−8.5153.316−8.76647.71−119.0
1.1–1.247.583.004−12.553.013−7.7783.036−10.5842.63−103.1
1.2–1.345.252.814−11.843.406−7.1762.806−12.3338.39−90.01
1.3–1.5541.662.552−10.894.005−6.3622.500−14.9632.85−73.35
1.55–1.6537.692.338−10.114.657−5.6762.239−17.7628.20−59.40
1.65–2.1533.122.098−9.2675.383−4.9271.965−20.7723.28−45.59
2.15–2.42525.791.829−8.3286.512−4.0511.638−25.3117.54−29.51
2.425–2.92520.731.627−7.6777.254−3.4651.431−28.1514.02−20.30
2.925–3.42514.351.480−7.1148.155−2.9431.230−31.4710.76−11.64
3.425–48.6681.328−6.5768.917−2.4771.057−34.158.070−4.767
0.25–0.759.655.260−21.991.071−15.326.217−1.513101.1−306.5
0.7–1.353.283.461−14.282.039−9.3313.667−6.13954.29−141.9
1.3–1.839.972.421−10.424.281−5.9692.358−16.1430.29−66.06
1.8–2.529.611.944−8.7335.923−4.4401.787−22.9520.12−36.96
2.5–3.518.131.529−7.3517.612−3.1691.329−29.4512.26−16.08
3.5–4.08.1801.316−6.5358.983−2.4421.043−34.387.867−4.240

