Article

Dust Heterogeneous Reactions during Long-Range Transport of a Severe Dust Storm in May 2017 over East Asia

1
Research Institute for Applied Mechanics (RIAM), Kyushu University, Fukuoka 816-8580, Japan
2
State Key Laboratory of Atmospheric Boundary Layer Physics and Atmospheric Chemistry (LAPC), Institute of Atmospheric Physics (IAP), Chinese Academy of Sciences (CAS), Beijing 100029, China
3
National Institute for Environmental Studies (NIES), Tsukuba, Ibaraki 305-8506, Japan
*
Author to whom correspondence should be addressed.
Atmosphere 2019, 10(11), 680; https://doi.org/10.3390/atmos10110680
Submission received: 14 September 2019 / Revised: 18 October 2019 / Accepted: 1 November 2019 / Published: 6 November 2019
(This article belongs to the Special Issue Soil/Mineral Dust Aerosols in the Earth System)

Abstract

:
Dust aerosol has important climate and environmental effects, which could be changed by internally mixing with anthropogenic aerosol as a result of heterogeneous reactions; however, the importance of these reactions is not fully understood yet. In this study, synergetic observations and an air quality model were used to analyze the transport of a severe dust storm and its impacts on nitrate and sulfate levels over East Asia between 3 and 11 May 2017. The model successfully reproduced the occurrence and transport of the dust storm compared to dust RGB imageries of the Himawari-8 satellite and dust extinction coefficients observed by LIDAR. The model also reasonably simulated the variations of observed nitrate and sulfate concentrations, and the results indicated that the dust heterogeneous reactions were dominant pathways for nitrate formation, but they had limited contribution for sulfate in both fine and coarse mode in Fukuoka, Japan. Dust nitrate formed rapidly after leaving China, and the highest period-averaged concentration of dust nitrate (>5 μg m−3) was shown over the Yellow Sea. Based on model results; we found that the mass ratio of dust nitrate to dust aerosol could reach 10% over the Pacific Ocean. Our results confirmed the importance of heterogeneous reactions on compositions of dust particles.

1. Introduction

Mineral dust is an important aerosol component due to its impacts on climate, ecosystems, and human health [1,2,3,4]. The dust particles could internally mix with the water-soluble aerosols with high hygroscopicity (e.g., Ca(NO3)2), through heterogeneous reactions with acid gases (e.g., HNO3), and become coated dust particles. As a result, the size and morphology of dust particles will be changed, and, consequently, the optical properties and direct climate effects will be different [5,6]. The hygroscopicity of coated dust particles is higher than pure dust particles and can become more efficient cloud condensation nuclei (CCN) compared to pure dust particles, altering the indirect climate effects of dust aerosols [7]. The formation of nitrate on dust could change the deposition of nitrate to ecosystems, especially over ocean area, where the nitrate from atmospheric deposition is important [8]. These processes may be more important over East Asia, where both the emissions of dust and anthropogenic pollutants are very high, and the dust will pass through the highly polluted area during long-range transport [9].
The numerical models based on atmospheric physics and chemistry theory are useful tools to understand the importance of dust heterogeneous reactions, since it is difficult to know the contributions of different chemical pathways on the production of water-soluble aerosols based on observations. As early as in 1990s, box-model studies suggested that 0.9–2.1 μg m−3 of nitrate and 0.3–10 μg m−3 of sulfate could be formed on dust particles [10,11]. Earlier global model studies showed the importance of heterogeneous reactions in the atmosphere, but a rigorous evaluation is difficult due to a lack of measurements [12]. In recent years, global and regional chemical transport models (e.g., GEOS-Chem) were widely used to study dust heterogeneous reactions and suggested that they were neglectable in the troposphere [13,14,15].
Although there have already been some studies about dust heterogeneous reactions, as mentioned above, they are not fully understood yet. The reasons include large uncertainty in reactive uptake coefficient values [12,13] and a difficulty of accurate nitrate observation [14]. Recently, based on synergetic observations and air-quality model, it was found that the dust heterogeneous reactions had significant impacts on the composition and morphology of dust particles in Beijing, China [9,16,17]. Therefore, more studies are necessary to improve our understanding about the importance of the dust heterogeneous reactions over East Asia during the long-range transport of severe dust storms.
During 3 and 11 May 2017, a severe dust storm occurred and affected most of East Asia. In this study, we analyzed the impacts of dust heterogeneous reactions on fine (particle diameter (Dp) ≤ 2.5 μm) and coarse (2.5 μm < Dp ≤ 10 μm) mode nitrate ions (NO3) and sulfate ions (SO42−) during the long-range transport of this dust storm, based on synergetic observations and an air-quality model that included heterogeneous processes.

2. Data and Methods

2.1. Satellite Data

To trace the transport of dust plume, we used dust RGB imageries based on the observation data of Himawari-8, which is a third-generation Japanese geostationary meteorological satellite. Dust RGB imageries were created from Bands 11 (8.6 μm), 13 (10.4 μm), and 15 (12.4 μm) of the Advanced Himawari Imagers, which are based on different characteristics of absorption and scattering in the infrared wavelengths between dust, cloud, and land surfaces. Dust RGB imageries are available during both day and night, with horizontal and temporal resolutions of 0.02° (about 2 km) and 10 min, respectively. Dust RGB imageries were previously used to analyze the occurrence and transport of large-scale dust storms in the Gobi Desert [18] and Taklimakan Desert [19].

2.2. On-Site Observation Data

A continuous dichotomous aerosol chemical speciation analyzer (ACSA, version 12, Kimoto Electric Co., Ltd 3-1 Funahashi-cho Tennoji-ku Osaka 543-0024 JAPAN) was used to measure the hourly mass concentrations of particulate matter (PM), sulfate, and nitrate in both the fine and coarse mode on the rooftop (6th floor) of the Chikushi Campus of Fukuoka University (longitude: 130.5° E, latitude: 33.5° N), Fukuoka, Japan [20]. The location of Fukuoka can be found in Figure 1. ACSA also measured the fine and coarse mode aerosol acidity (ΔH+), which refers to the difference in the solution after the extraction of aerosol-soluble components relative to the pure extracting solution and is determined using a pH indicator absorption photometric method. The ΔH+ is calculated based on the following equation:
pHas = −log [ΔH+ × 10−6 + 10−4.6],
where pHas is the pH value of the solution after the extraction of aerosol-soluble components, and the pure extracting liquid had a pH of 4.6. The ΔH+ is a good qualitative indicator of dust aerosol due to its alkalinity [21]. In addition, ΔH+ is also very important for dust heterogeneous reactions since dust will stop if the dust alkalinity is titrated when ΔH+ becomes positive.
To validate the air-quality-model results, we also used the hourly PM2.5 (PM with Dp ≤ 2.5 μm) and PM10 (PM with Dp ≤ 10 μm) mass concentrations in Beijing, China, and Seoul, Korea, measured by the Ministry of Ecology and Environment of the People’s Republic of China and Korean Ministry of Environment, respectively. As shown in Figure 1, Beijing and Seoul were on the path of backward trajectory, starting from Fukuoka, on May 6, 2017, at 20:00 (JST, Japan Standard Time), when the dust concentration reached a maximum. The backward trajectory was calculated using the Hybrid Single Particle Lagrangian Integrated Trajectory (HYSPLIT) model [22].
To evaluate the model-simulated dust transport, we also used the dust extinction coefficients based on LIDAR measurements in Beijing, Seoul, and Fukuoka, which were operated by Asian Dust and aerosol LIDAR observation Networks (AD-Net) [23]. The LIDARs measured the vertical profiles of aerosol backscattering at 532 and 1064 nm, as well as the depolarization ratio at 532 nm, with high spatial and temporal resolution. The contributions of dust and anthropogenic aerosols to the total retrieved extinction coefficient were estimated based on the depolarization ratio (DR), supposing dust (DR = 0.35) and anthropogenic (DR = 0.02) aerosols were externally mixed [24].
Dust weather reported by the surface synoptic observations (SYNOP) over East Asia were also used to reveal the transport of dust by comparison with the Himawari-8 dust RGB imagery and the model-simulated dust concentration distributions.

2.3. Chemical Transport Model

We used the Nested Air Quality Prediction Modeling System (NAQPMS) [25,26] to simulate the transport of dust and its interaction with anthropogenic pollutants over the eastern part of Asia, as shown in Figure 1, with a horizontal resolution of 45 km, and 20 vertical layers in a sigma coordinate. The Weather Research and Forecasting model (WRF version 3.9.1.1) was used to simulate the meteorological fields which were necessary for NAQPMS. The anthropogenic emissions (e.g., SO2, NOx, NH3, CO, BC, OC, and VOCs) were taken from MEIC inventory [27] for China, with the base year of 2017, and the MIX inventory [28], with the base year of 2010 for other areas. The emissions of dust were calculated online as follows [26]:
F = C 1 · ρ a g · E · u 3 ( 1 + u 0 u ) · ( 1 u 0 2 u 2 ) · ( 1 RH RH 0 ) ,
where F is the dust flux (kg m−2 s−1), C1 is a constant and set to 1.0 × 10⁻⁵, and ρ a (kg m−3) and g (m2 s−2) are the air density and acceleration due to gravity, respectively. E is the dust source function which reflects the impact of land-use categories (Figure 1), and u and u 0 are the friction and threshold friction velocities, respectively. RH and RH0 represent relative humidity and its threshold value, respectively. Sea salt emissions were also calculated online based on the work of Athanasopoulou et al [29]. Both dust and sea salt were separated into four bins that were, 0.1–1, 1–2.5, 2.5–5, and 5–10 μm. The emissions of the four dust bins accounted for 3.5%, 7.0%, 31.5%, and 58.0% of total dust flux, respectively.
NAQPMS used the Carbon-Bond Mechanism Z (CBM-Z) [30] as the gas-phase chemistry module, the ISORROPIA version 1.7 [31] as the aerosol thermodynamic module, the RADM mechanism [32] as the aqueous chemistry and wet deposition module, the Wesley scheme [33] as the dry deposition module, and a heterogeneous chemistry module with 28 heterogeneous reactions [26].
In addition to the long-range transport of the East Asia dust episode, this study mainly focused on the impacts of dust on the nitrate formation through the heterogeneous reaction between dust alkalinity (typically as CaCO3) and HNO3, as follows:
CaCO3 + 2HNO3 →Ca(NO3)2 + H2O + CO2.
The nitrate produced by the above reaction was limited by dust alkalinity and is denoted as D-NO3 hereafter. The nitrate ions can also be produced by heterogeneous reaction between NaCl and HNO3 on sea-salt particles, denoted as S-NO3. The nitrate formed through thermal equilibrium between HNO3 and NH3 was denoted as A-NO3:
NH3 + HNO3 ⇌ NH4NO3.
Similar to NO3, dust heterogeneous reactions can also produce SO42− by the uptake of SO2, and the produced SO42− was denoted as D-SO42−. While A-SO42− represented SO42− produced through gas-phase chemistry, aqueous-phase chemistry, and thermal-equilibrium processes, and S-SO42− included both primary sea-salt SO42− and sea-salt, heterogenous reactions produced SO42−.
A first-order reactive uptake parameterization with rate constant, k i , is used to calculate the heterogeneous reactions of acidic gas species s (e.g., SO2 and HNO3) on different aerosol particles, i , (e.g., dust and sea salt):
k i = A i   ×   ( r i D g + 4 ν · γ i s ) 1 ,
where A i and r i are the surface area density and the radius of aerosol particles, respectively, D g is the molecular diffusion coefficient, ν is the mean molecular speed of the gas, and γ i s is the reactive uptake coefficient of acidic gas species s (e.g., SO2 and HNO3) on aerosol species, i . The values of γ i s for dust are based on the previous study [13] and significantly increase with the increase of relative humidity. The NAQPMS was successfully used for dust and anthropogenic-pollution analysis over East Asia [34,35,36,37,38].

3. Results

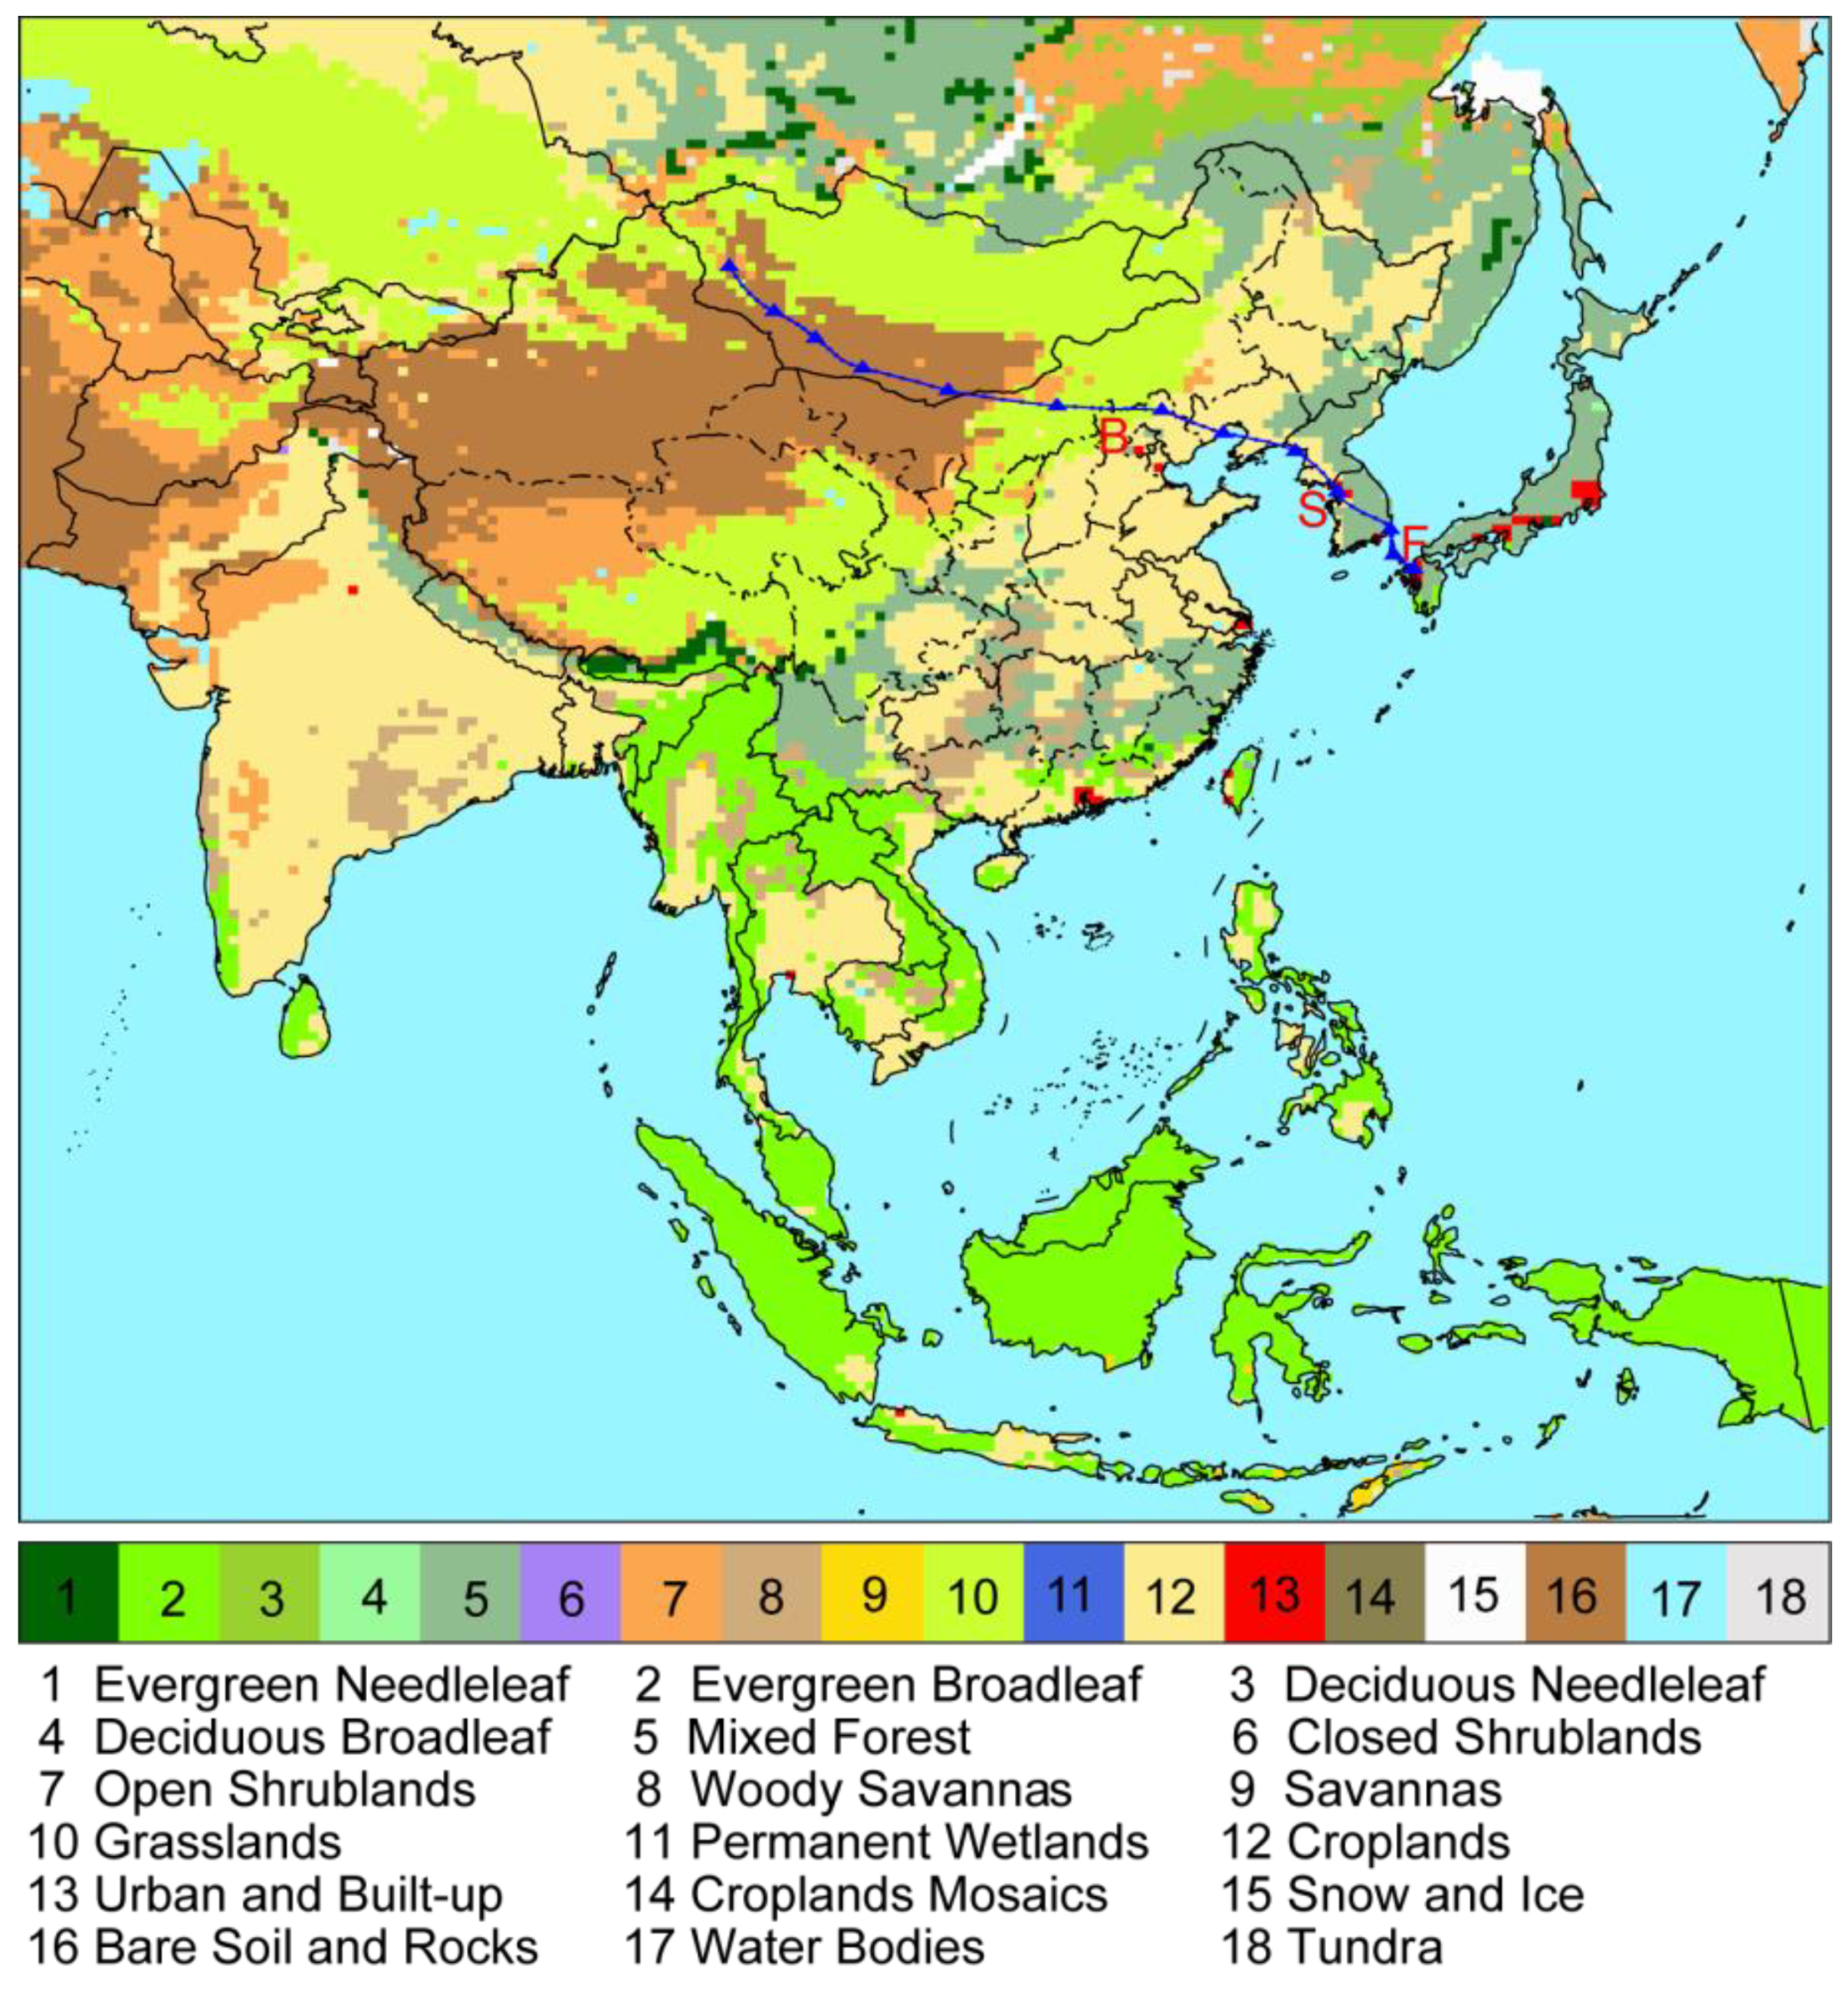
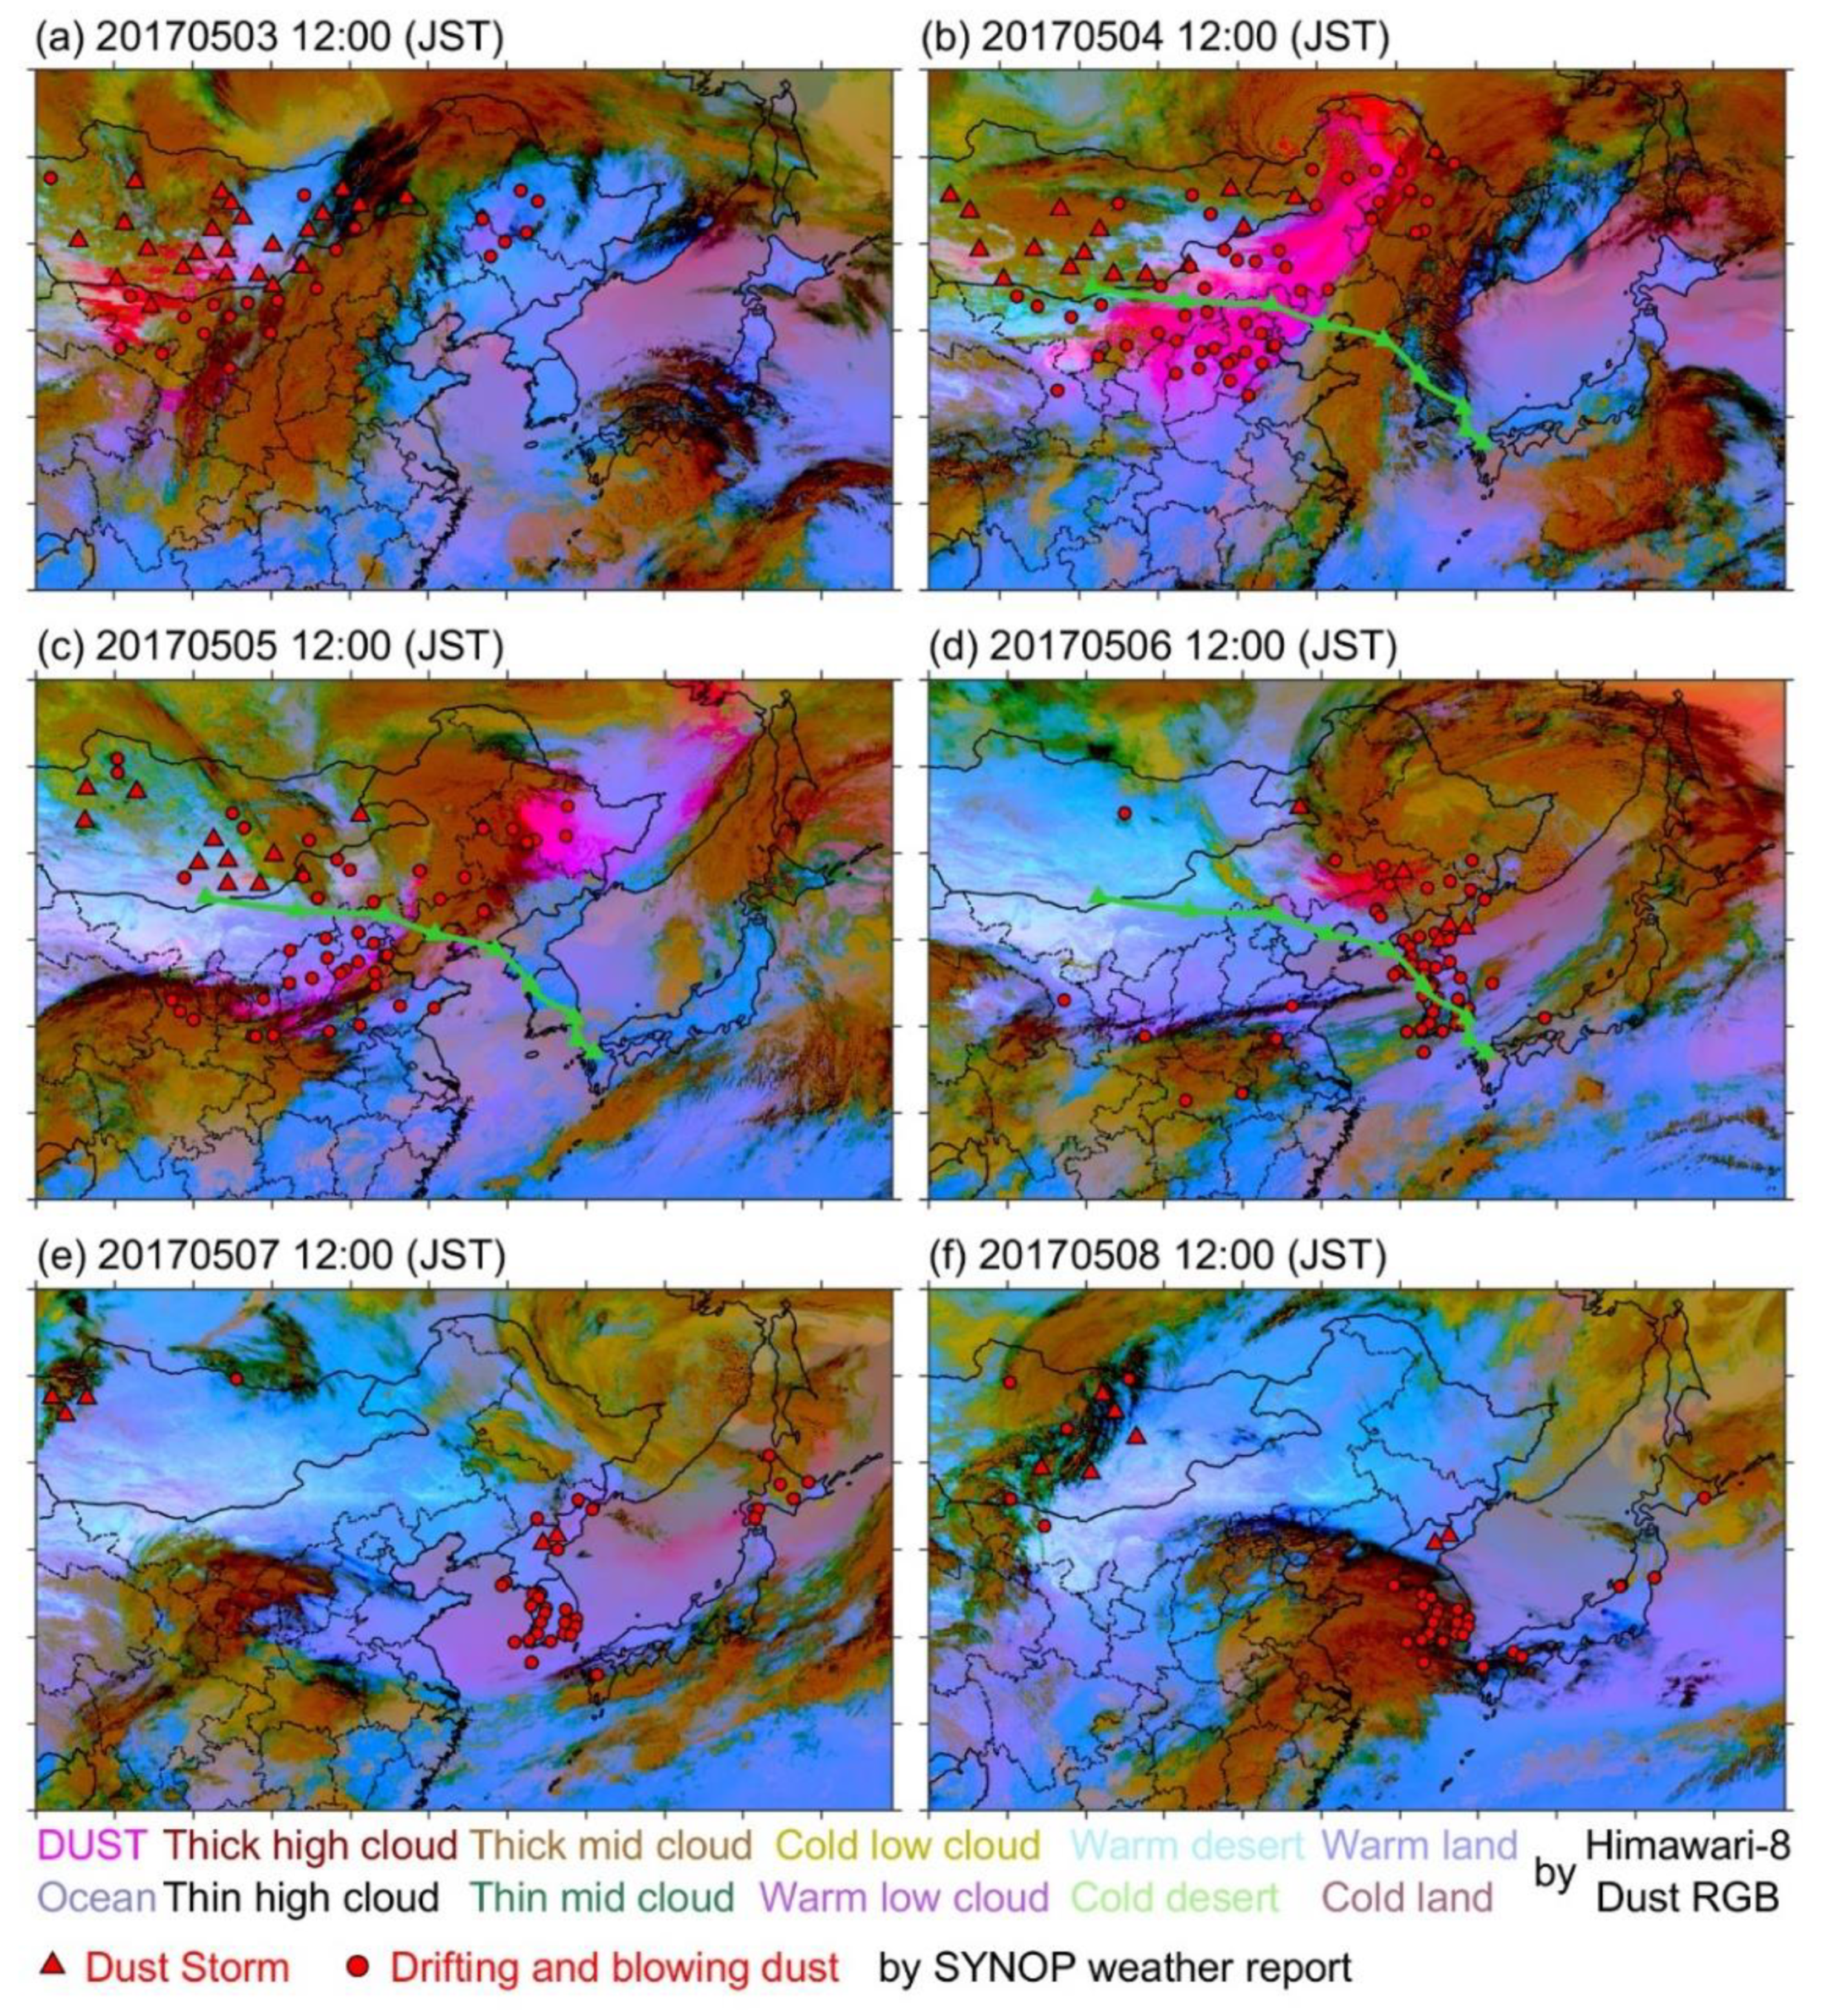
3.1. Dust Transport over East Asia

Figure 2 shows dust RGB imageries and SYNOP sites at which dust weather episodes were occurring for each day during 3–8 May 2017. The pink-shaded areas represent the range of the dust plume. The dust storm began over South Mongolia and West Inner Mongolia of China, on 3 May, and moved to North China on 4 May. Then, the dust plume slowly moved eastward and stayed over North China until 5 May. After that, the dust was continuously moving eastward, covered Korea Peninsula, and reached Japan on 6 May. The dust RGB imagery clearly showed the long-range transport of dust, which was consistent with SYNOP observations during 3 May and 6 May, as well as the backward trajectory from Fukuoka, at 20:00, on 6 May. After 6 May, the dust RGB imageries had difficulty showing the dust plume due to the dilution of dust, while the SYNOP observations indicated that the dust plume stayed over Korea and Japan on 7 May and 8 May.
The simulated daily horizontal distribution of dust concentration between 3 and 10 May 2017 at the first vertical level (z = 50 m) of the model is shown in Figure 3. A dust storm began to occur over South Mongolia and West Inner Mongolia of China, under strong wind (>10 m s−1) condition, on 3 May, and arrived in North China on 4 May, with the maximum dust concentration larger than 1000 μg m−3. The dust plume slowly moved eastward under a sustained northeast wind and stayed over North China until 5 May; meanwhile, the dust concentration decreased significantly to less than 750 μg m−3 due to strong diffusion and deposition. The dust was transported to East China, Korea Peninsula, and Japan on May 6 and stayed there until 9 May; meanwhile, the dust concentration gradually decreased to less than 200 μg m−3. The movement of the dust plume was consistent with the backward trajectory from Fukuoka, on May 6, at 20:00, as shown in Figure 3b–d. On 10 May, the dust only existed over East China, with concentrations of 50–100 μg m−3. The model-simulated occurrence and transport of the dust storm showed good consistency with the dust process revealed by Himawari-8 and SYNOP observations in Figure 2.

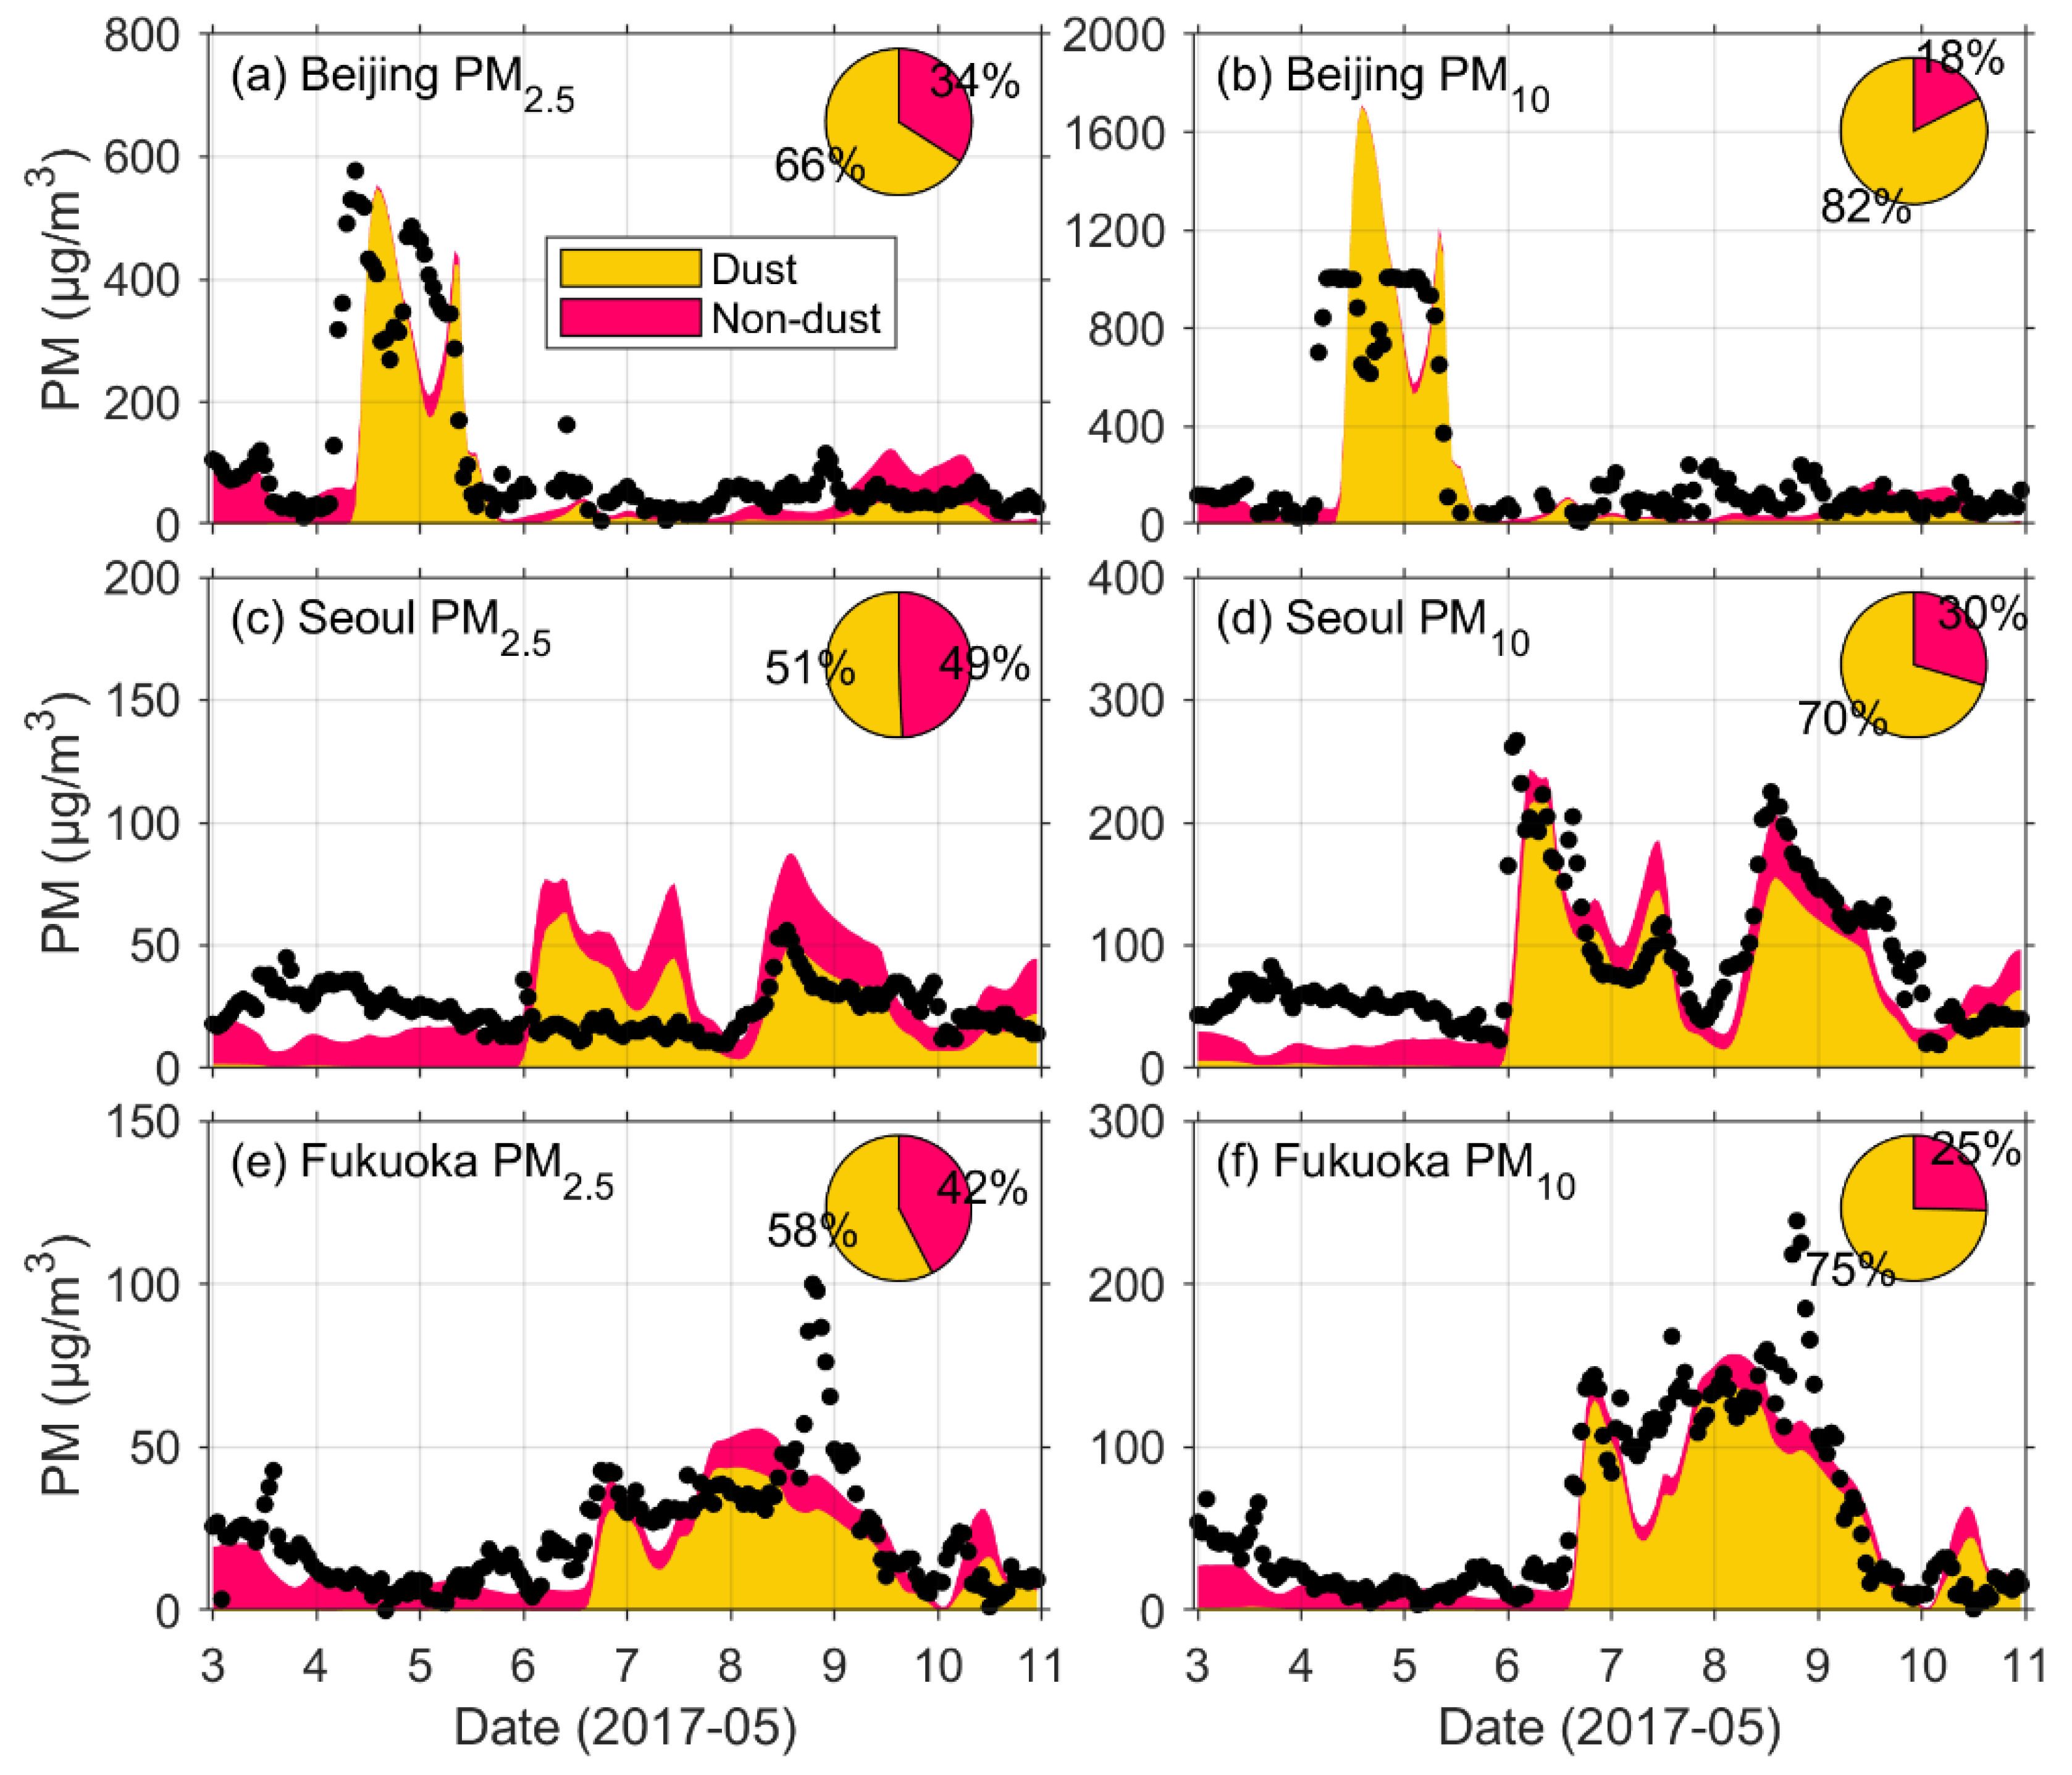
3.2. Time Series of PM Concentration and Dust Extinction

Figure 4 shows the time series of the observed and simulated PM10 and PM2.5 concentrations in Beijing, Seoul, and Fukuoka, while Table 1 shows the model performance statistics. The dark yellow and magenta shades represent simulated dust and non-dust PM, respectively. Dust PM is defined as primary mineral dust particles, as well as nitrate and sulfate formed on the surface of dust particles through heterogeneous reactions. Non-dust PM includes BC, OA, secondary inorganic aerosol, and sea salt. The fractions of dust and non-dust PM are also shown as pie charts in Figure 4. The simulated PM10 and PM2.5 showed reasonably agreement with observations in all the three cities, since the mean fractional bias (MFB) and mean fractional error (MFE) both satisfied the model performance criteria (MFB ≤ ±60% and MFE ≤ +75%) proposed by [39]. The model reproduced the high concentrations of PM in Beijing during 4 May and 5 May well and showed peak PM2.5 concentration of 554 μg m−3, which was similar to the observed value (577 μg m−3). The observed PM10 failed to capture the peak value, since the instrument can only measure concentrations less than 1000 μg m−3, but we were still able to see that the model successfully simulated the high PM10 episode, with the peak concentration of 1711 μg m−3.
The simulated PM10 in Seoul was in good agreement with our observations during the dust period, especially for the PM10 variations during 6 May and 9 May. However, the observed PM2.5 concentration was too low to be accurate between 6 May to 7 May, since it was unreasonably low (only 21 μg m−3) when the observed PM10 reached a maximum of 267 μg m−3. The large difference (NMB = 39.9%) and low correlation (R = 0.09) between simulated and observed PM2.5 probably resulted from the inaccurate PM2.5 observation during this period.
A high concentration of PM reached Fukuoka on the afternoon of 6 May and persisted for more than three days. The model generally reproduced the level and variation of this high PM pollution episode well. The only exception was on the evening of 8 May, when the observed PM2.5 and PM10 suddenly increased for only five hours, and the model failed to capture this short-term event. The rapid increase and decrease in the PM concentration was possibly due to some local emission sources that were not included and resolved in the model [21].
As shown in the pie charts in Figure 4, it can also be seen that the dust was a dominant component in all three cities, not only for PM10, but also for PM2.5. The dust fractions in PM were highest in Beijing, with 82% for PM10 and 66% for PM2.5. The fractions of dust in both PM2.5 and PM10 were lower in Seoul (51% and 70%) than in Fukuoka (58% and 75%), although the distance from Seoul to the dust-source area was shorter than for Fukuoka, indicating the importance of local anthropogenic pollutants over the Seoul area.
Figure 5 shows ACSA observed ΔH+ of fine (fΔH+) and coarse (cΔH+) aerosol. When the PM2.5 and PM10 were dominated by non-dust aerosol before 6 May 2017, at 18:00, both fΔH+ and cΔH+ were positive. After that, both became negative, since dust came to Fukuoka, according to the model results, as shown in Figure 4, which indicated that the dust aerosol had a high alkalinity and was a major component of both PM2.5 and PM10.
Figure 6 shows LIDAR-observed and model-simulated vertical distributions of dust extinction coefficients in Beijing, Seoul, and Fukuoka. The model successfully captured the major dust episodes in all three cities. Both the LIDAR observation and model result showed high dust extinction coefficients (>1 km−1) in Beijing, from the early morning of 4 May until noon on 5 May. The model successfully simulated the dust episode over Seoul, especially the deep and strong dust plume that came to Seoul at 00:00, on 6 May (JST). However, LIDAR measurements indicated daily noontime boundary layer high dust-extinction coefficients that were not observed in Beijing and Fukuoka. This may be an indication of a local emission source near the observation site. This local emission source may explain the discrepancy between the simulated dust extinction coefficients and the LIDAR measurements. The model reproduced the variation and magnitude of dust extinction coefficients in Fukuoka compared with LIDAR data well. The dust arrived at Fukuoka on the afternoon of 6 May and stayed until 9 May, with dust-extinction coefficients of about 0.1 km−1. The NAQPMS model reproduced the observed vertical distributions of dust in Seoul and Fukuoka well and indicated that the dust-plume heights were generally less than 2 km. The dust-plume height was not observed by LIDAR in Beijing because the dust extinction coefficient was too large, and, therefore, the laser could not pass through the thick dust layer.

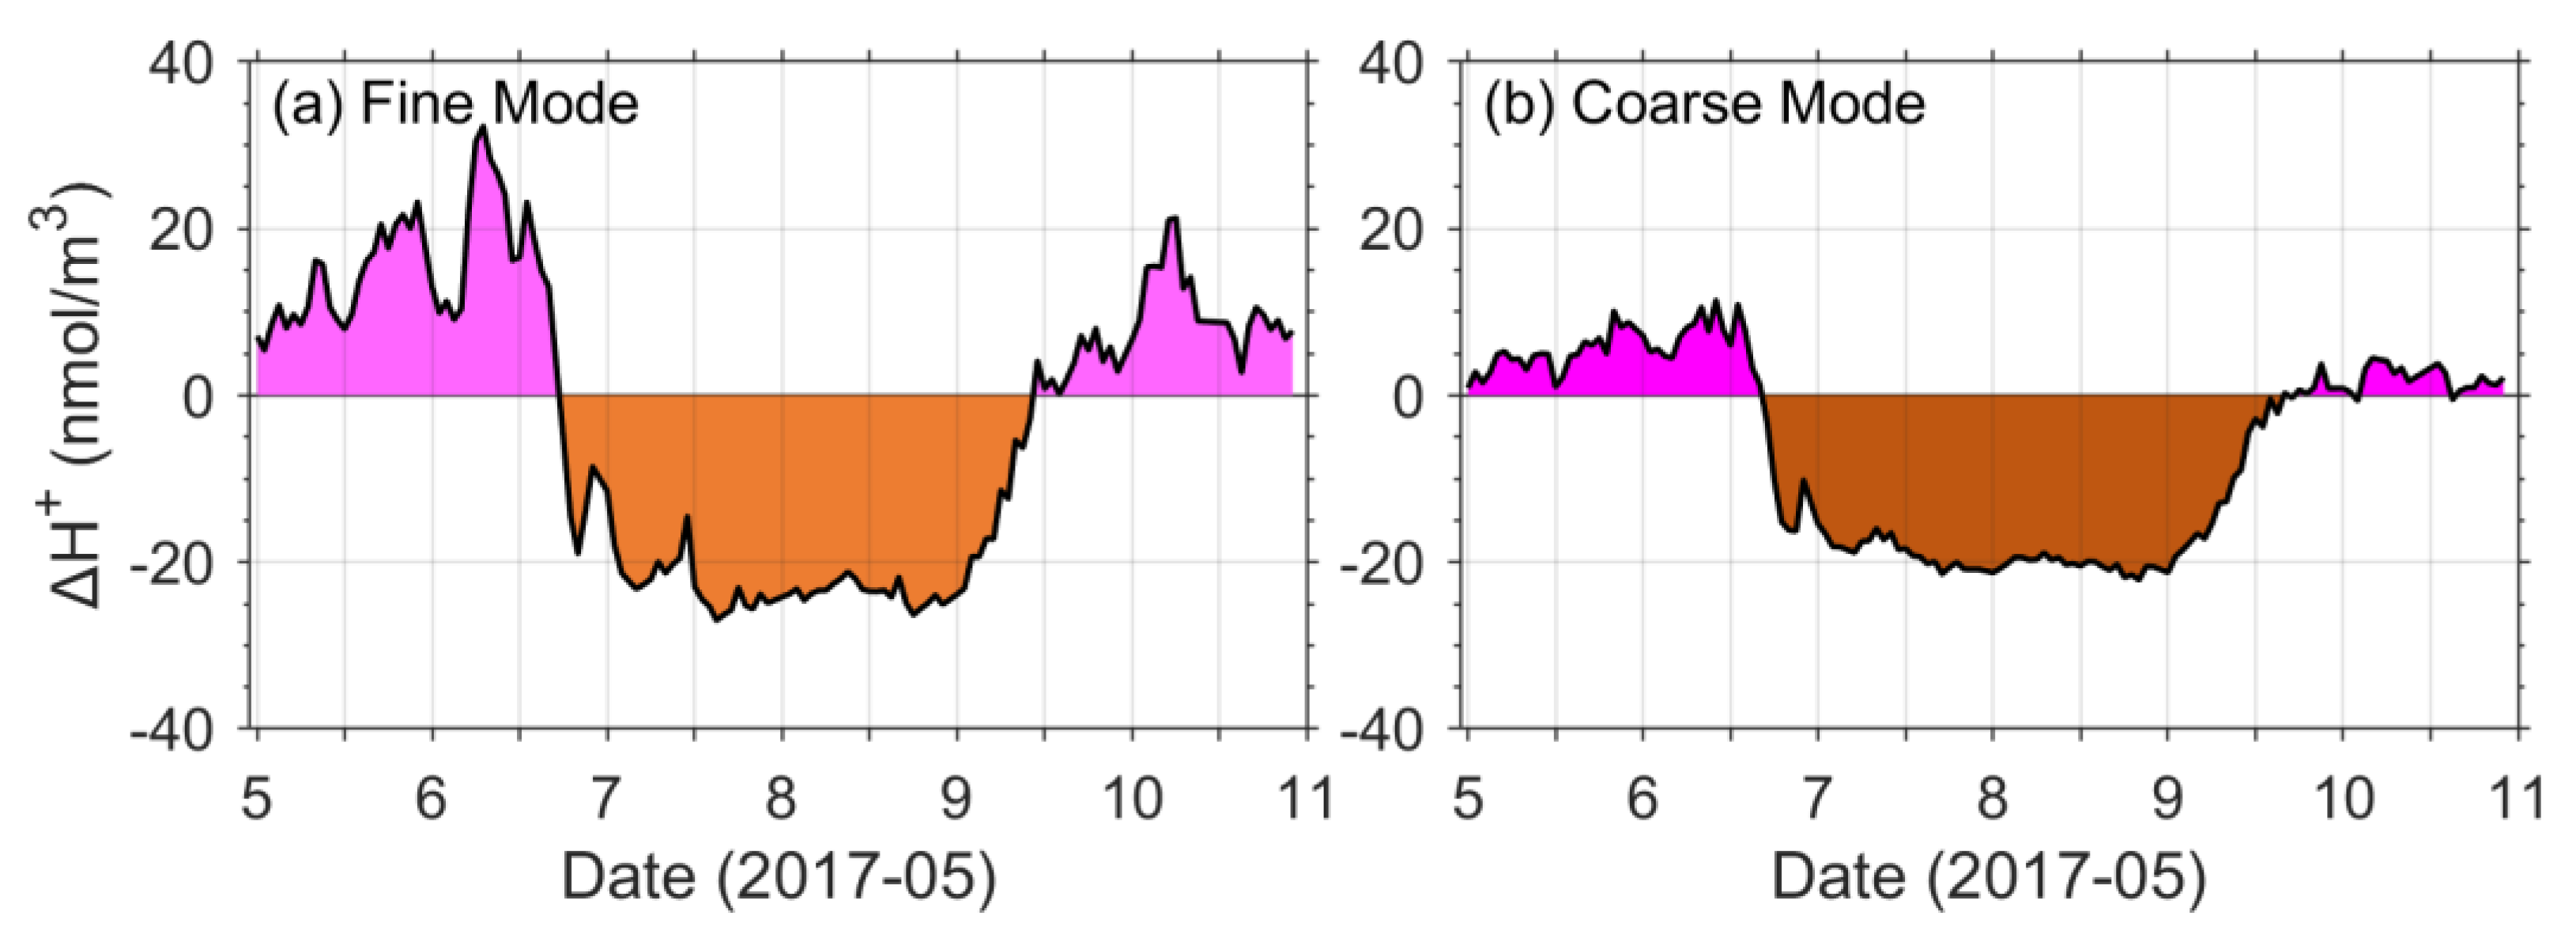
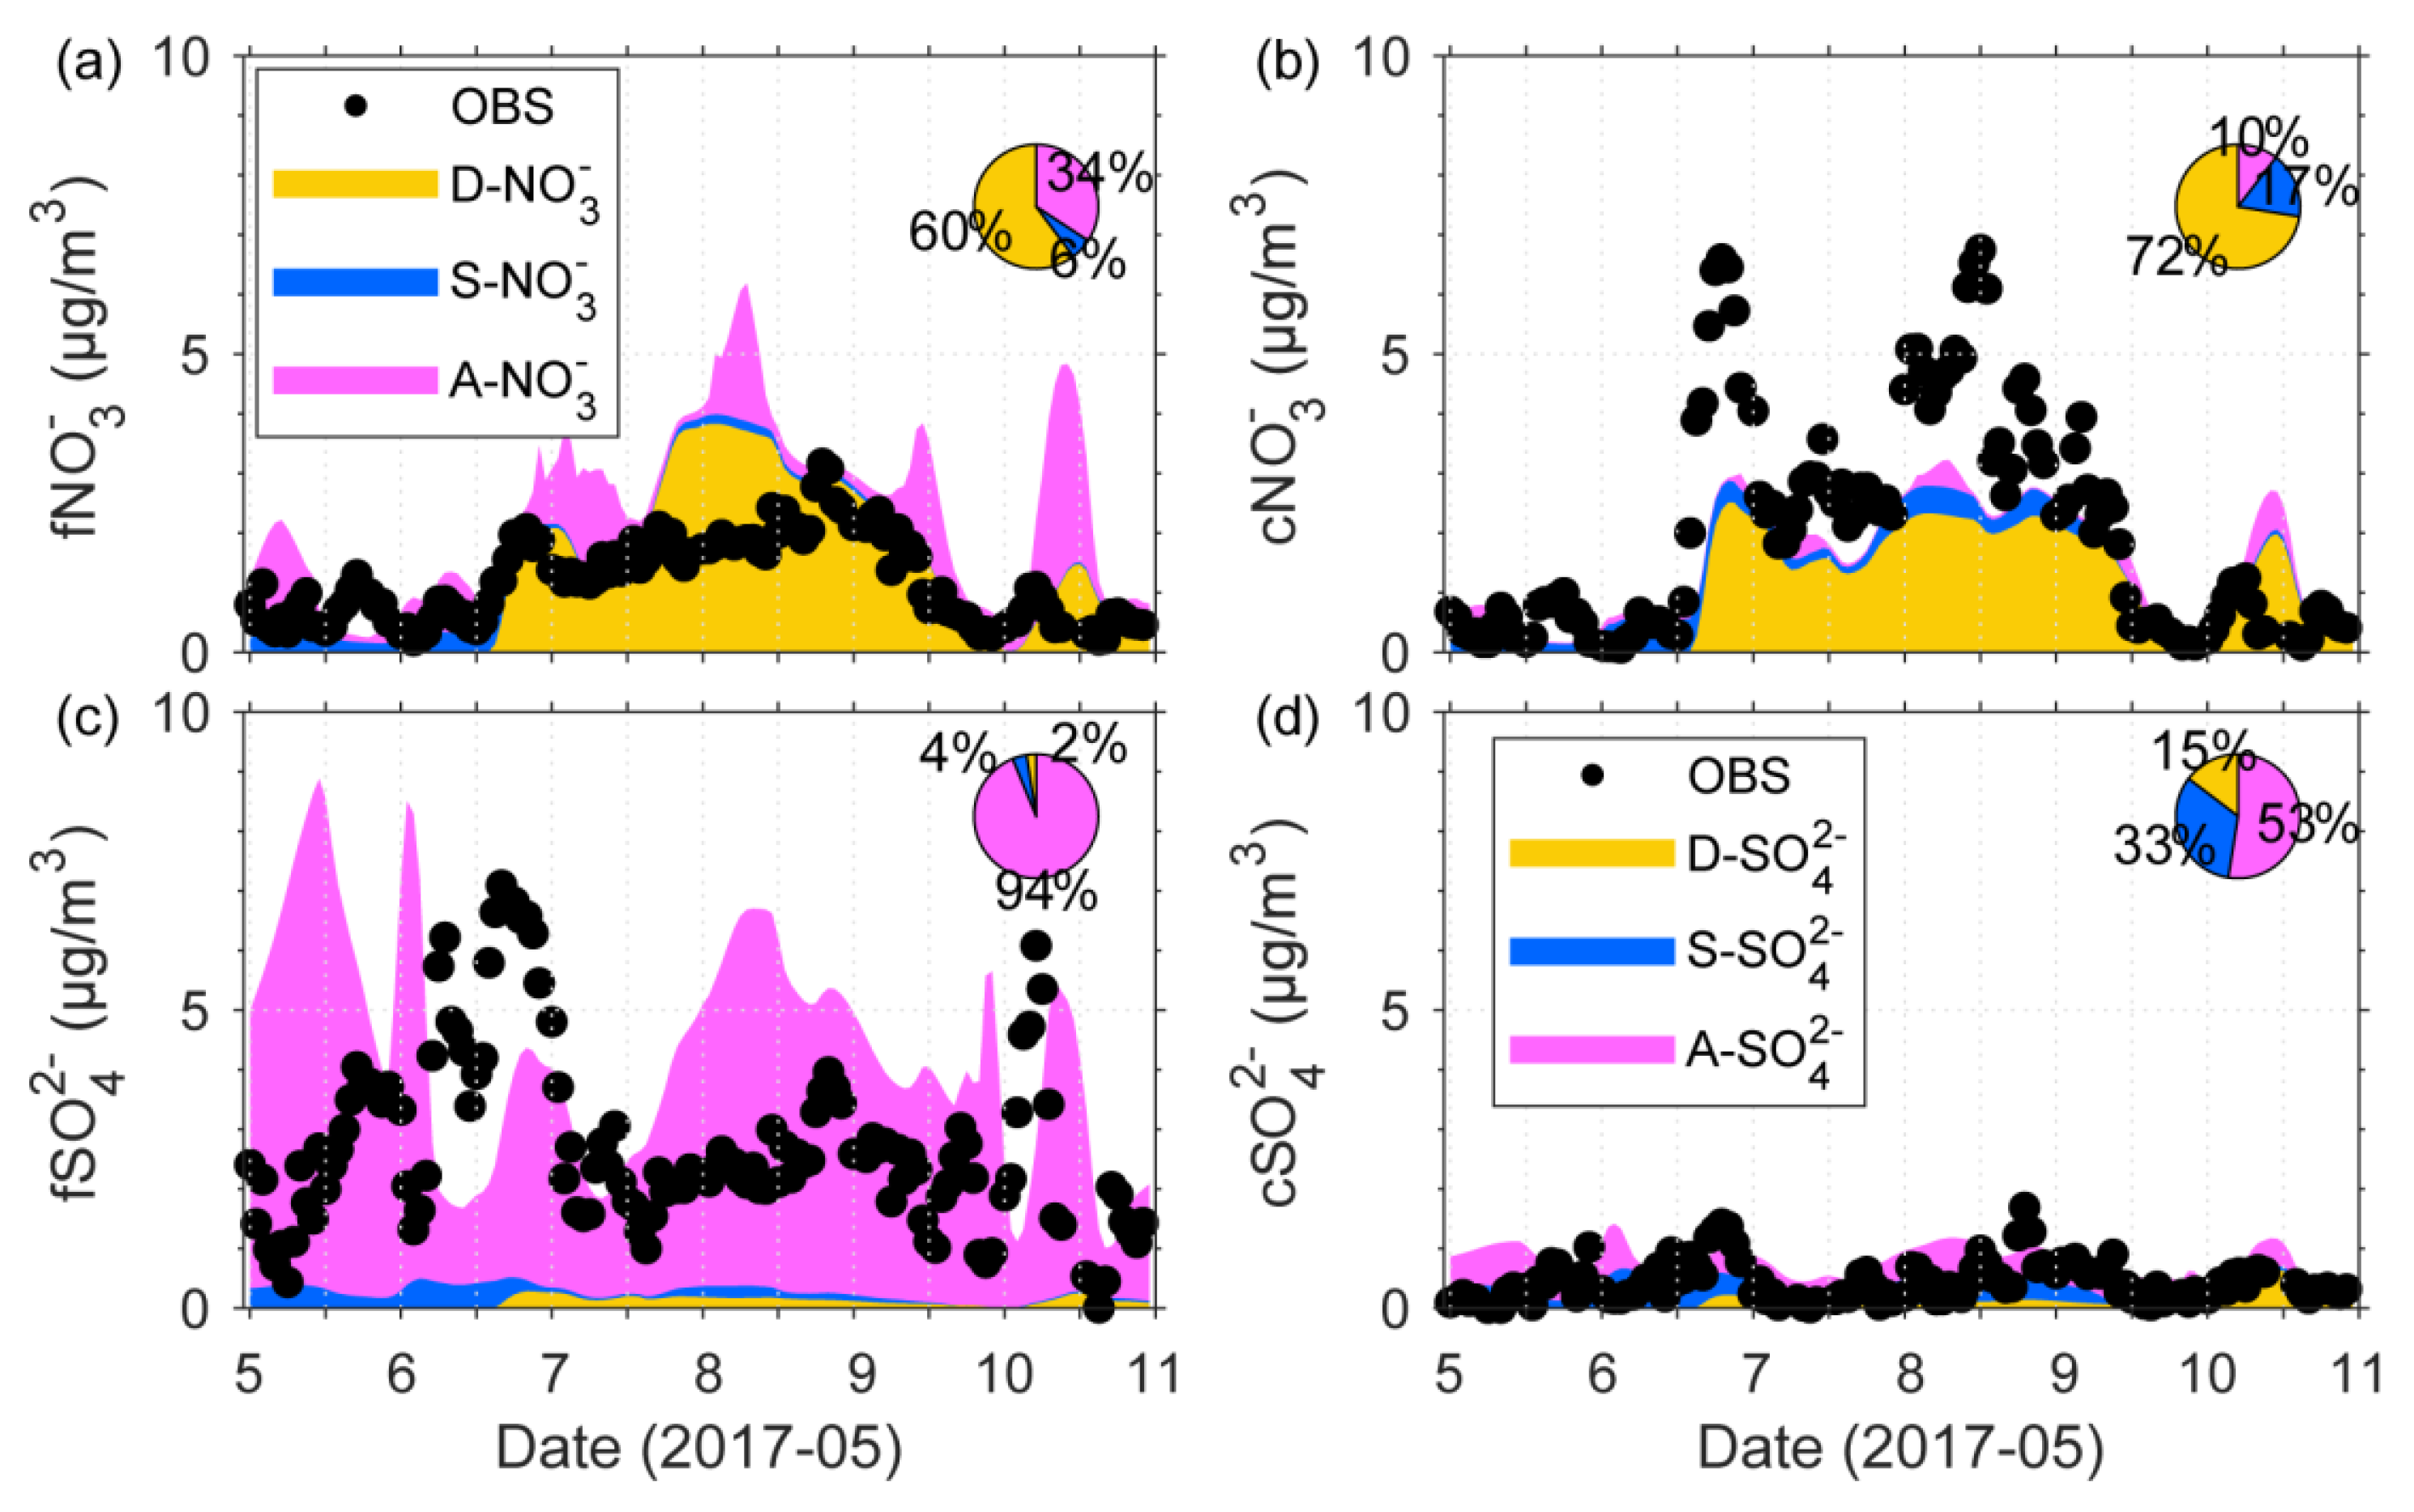
3.3. Nitrate and Sulfate in Fukuoka

Observed and simulated time variations of NO3 and SO42− in fine and coarse mode over Fukuoka are shown in Figure 7. The statistics for model performance are shown in Table 2. The NAQPMS results all satisfied the performance criteria (MFB ≤ ±60% and MFE ≤ +75%) of air-quality models [39].
Both simulated fine and coarse nitrate showed good correlation with observations (R = 0.63 for fNO3 and 0.82 for cNO3) and significantly increased during the dust period, which was consistent with the observations. The observed mean cNO3 concentration (2.0 μg m−3) was 68% higher than fNO3 (1.2 μg m−3), indicating the importance of coarse nitrate, which has not received enough attention.
The contributions of different chemical pathways on NO3 and SO42− formation were also shown as pie charts in Figure 7. The results indicated that the heterogeneous reaction on dust particles is the major mechanism for NO3 production in both fine and coarse mode, since the fraction of D-NO3 to total nitrate was 60% and 72% in fine and coarse mode, respectively. The contribution of A-NO3 (34%) was more important than S-NO3 (6%) in fine mode, while it (10%) was smaller than S-NO3 (17%) in coarse mode.
Although the model reproduced the increase of NO3 during dust period, it overestimated the fNO3 by a mean bias of 1.1 μg m−3 and underestimated the cNO3 by a mean bias of −0.5 μg m−3. The model overestimated the D-NO3 because only the simulated D-NO3 was already higher (NMB = 15.3%) than the observations. The dust heterogenous reactions were not limited by dust alkalinity, since the ΔH+ was negative during the whole dust period (Figure 5); therefore, a reasonable explanation is that the reactive uptake rate of HNO3 of fine dust particles was overestimated. A possible reason for the cNO3 underestimation by the model may be that there was an underestimation of the reactive uptake rate of HNO3 of coarse dust particles. This means that the reactive uptake rate of HNO3 of fine dust particles may be smaller than that of coarse dust particles. The reason why fine and coarse dust had different reactive uptake rates was not clear, and a potential reason is that large dust particles are more irregular and have a larger surface area. More studies are necessary in order to understand this problem.
Simulated SO42− concentrations had similar magnitudes to observed results, but the detailed time variation was not well reproduced, implying the difficulty of sulfate simulation, which was also shown in other models (e.g., CMAQ [34]). The coarse SO42− concentration observation (0.4 μg m−3) was only 15% of fine SO42− (2.7 μg m−3), which was different from NO3, and the model also showed a similar ratio (16%), which indicated D-SO42− may not be very important for total SO42−. This was further confirmed by the model results, since the simulated period-averaged D-SO42− was only 0.1 μg m−3 in both fine and coarse mode. The A-SO42− was most important for fine and coarse SO42−, with contributions of 94% and 53%, while contributions of S-SO42− were 4% and 33% of SO42−, and D-SO42− only contributed for 2% and 15%.

4. Discussion

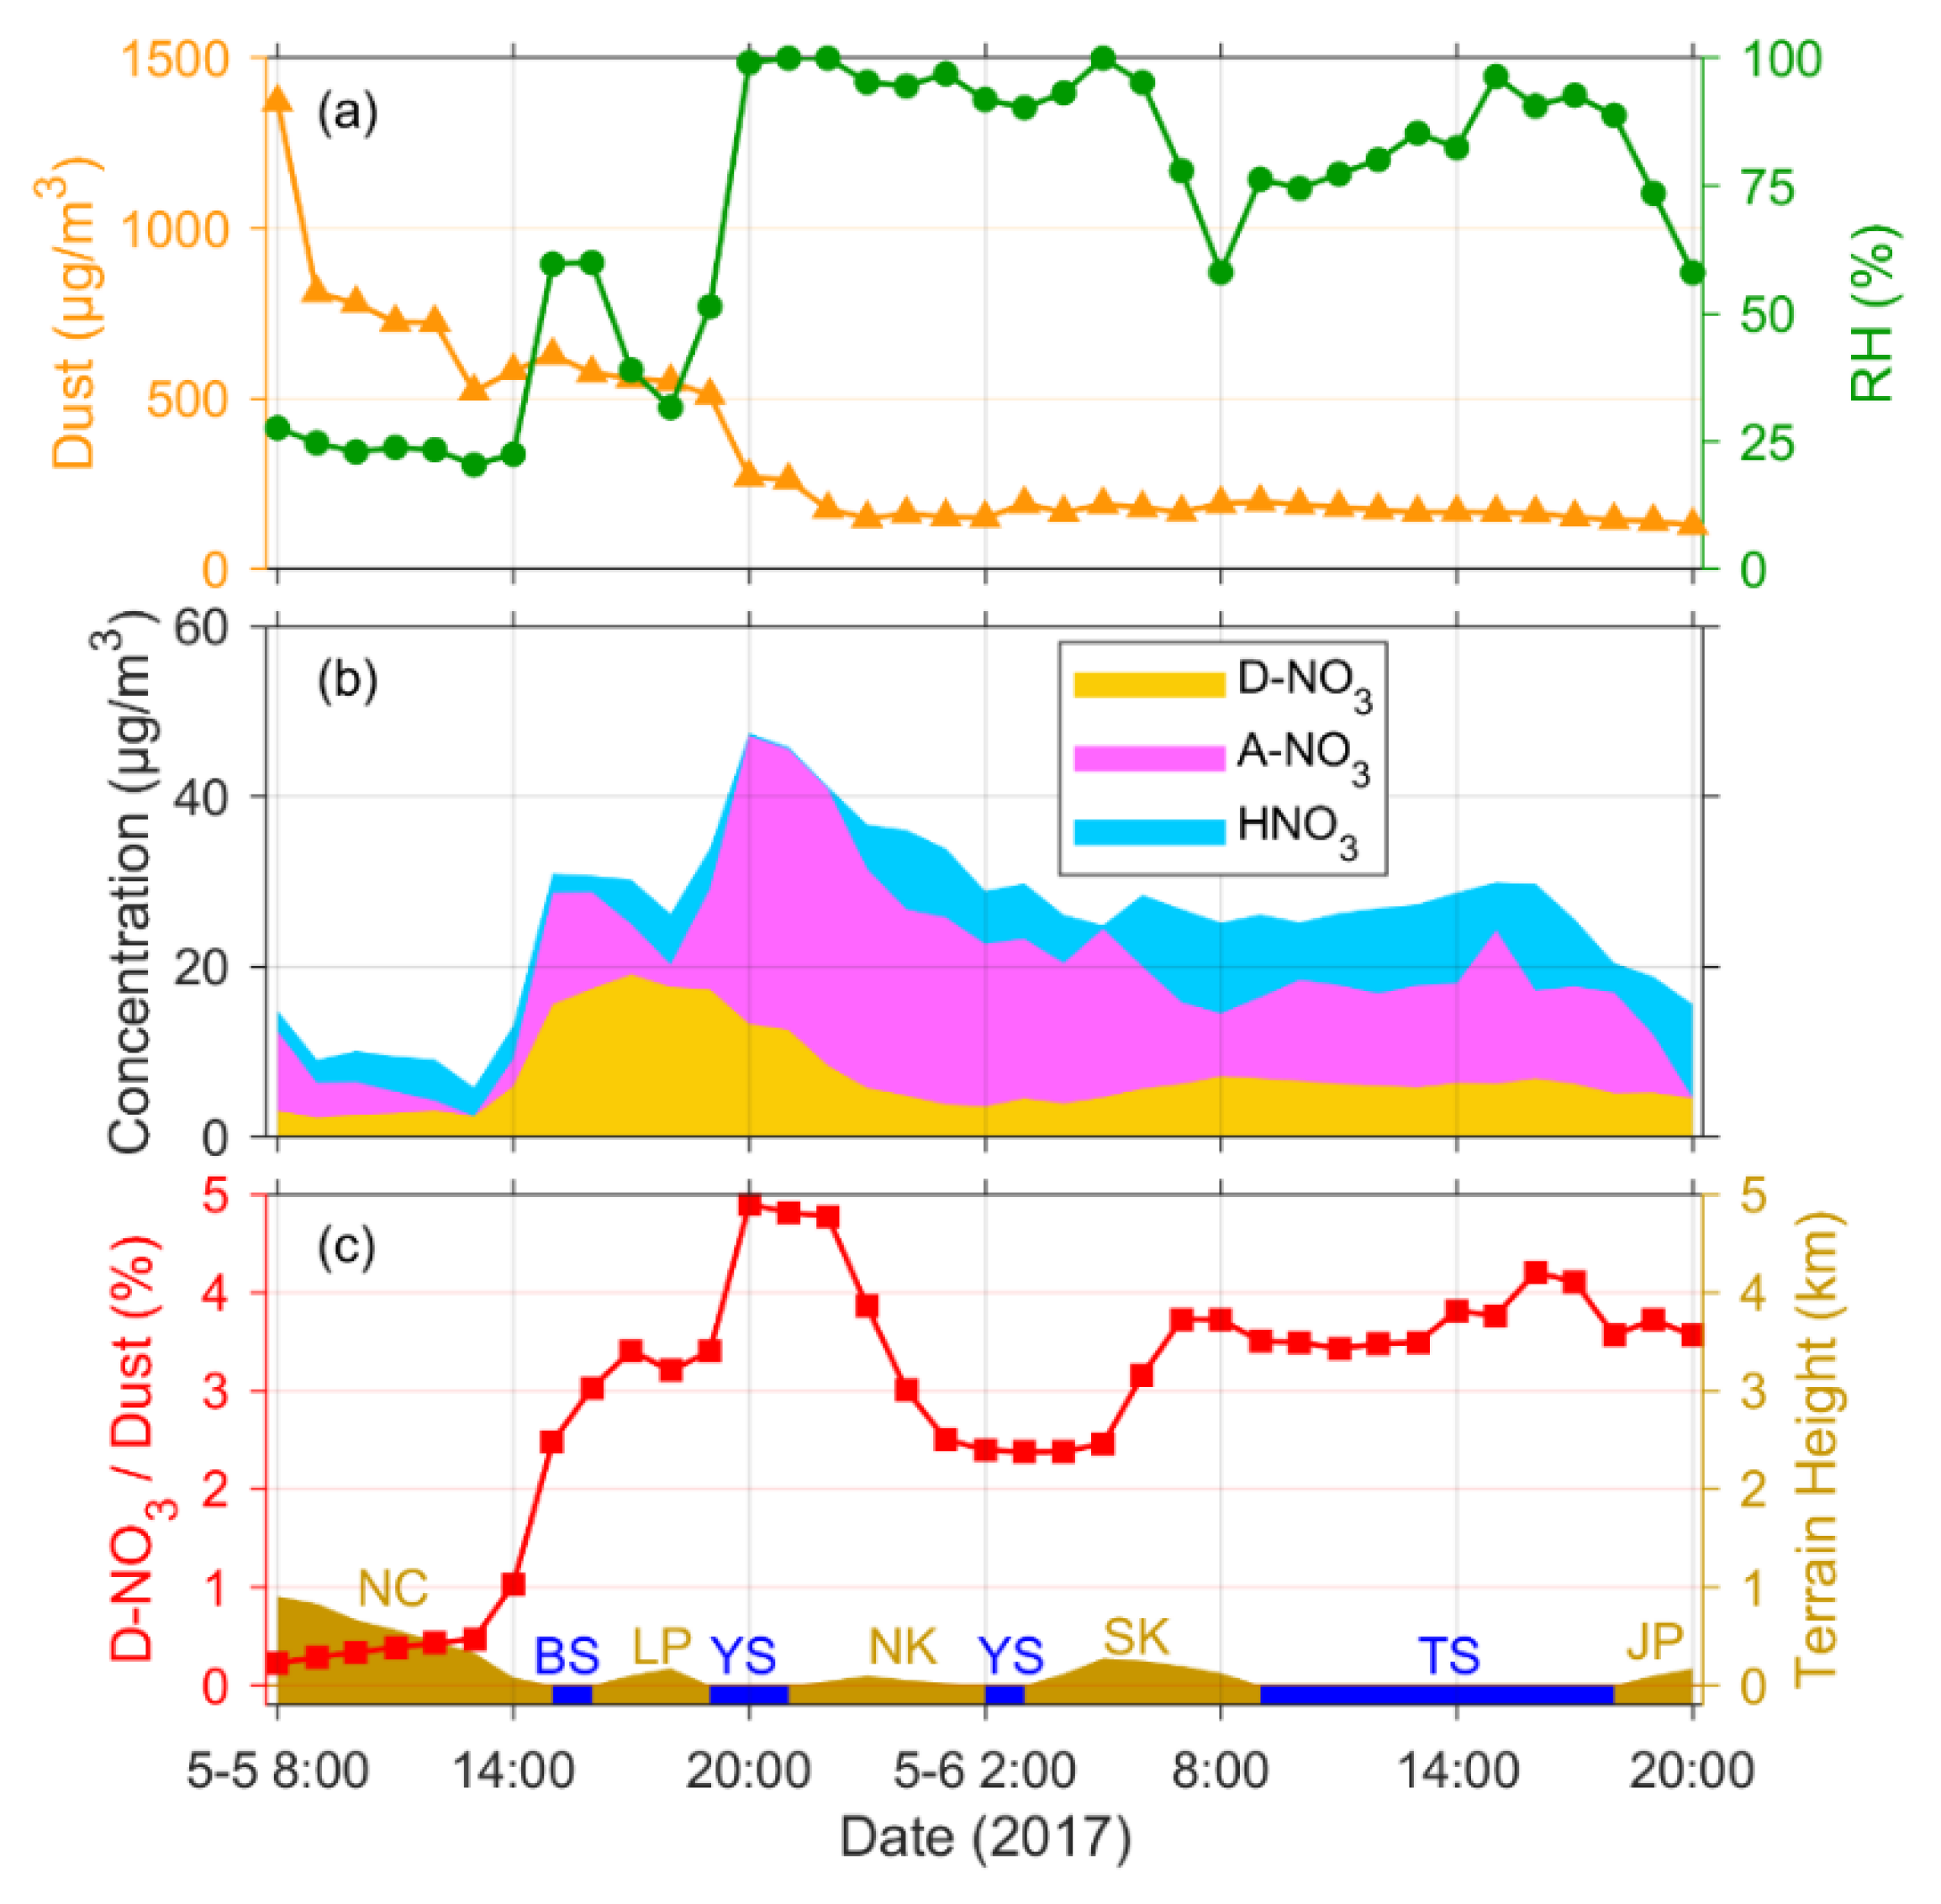
4.1. Formation of Dust–Nitrate along the Air-Mass Trajectory
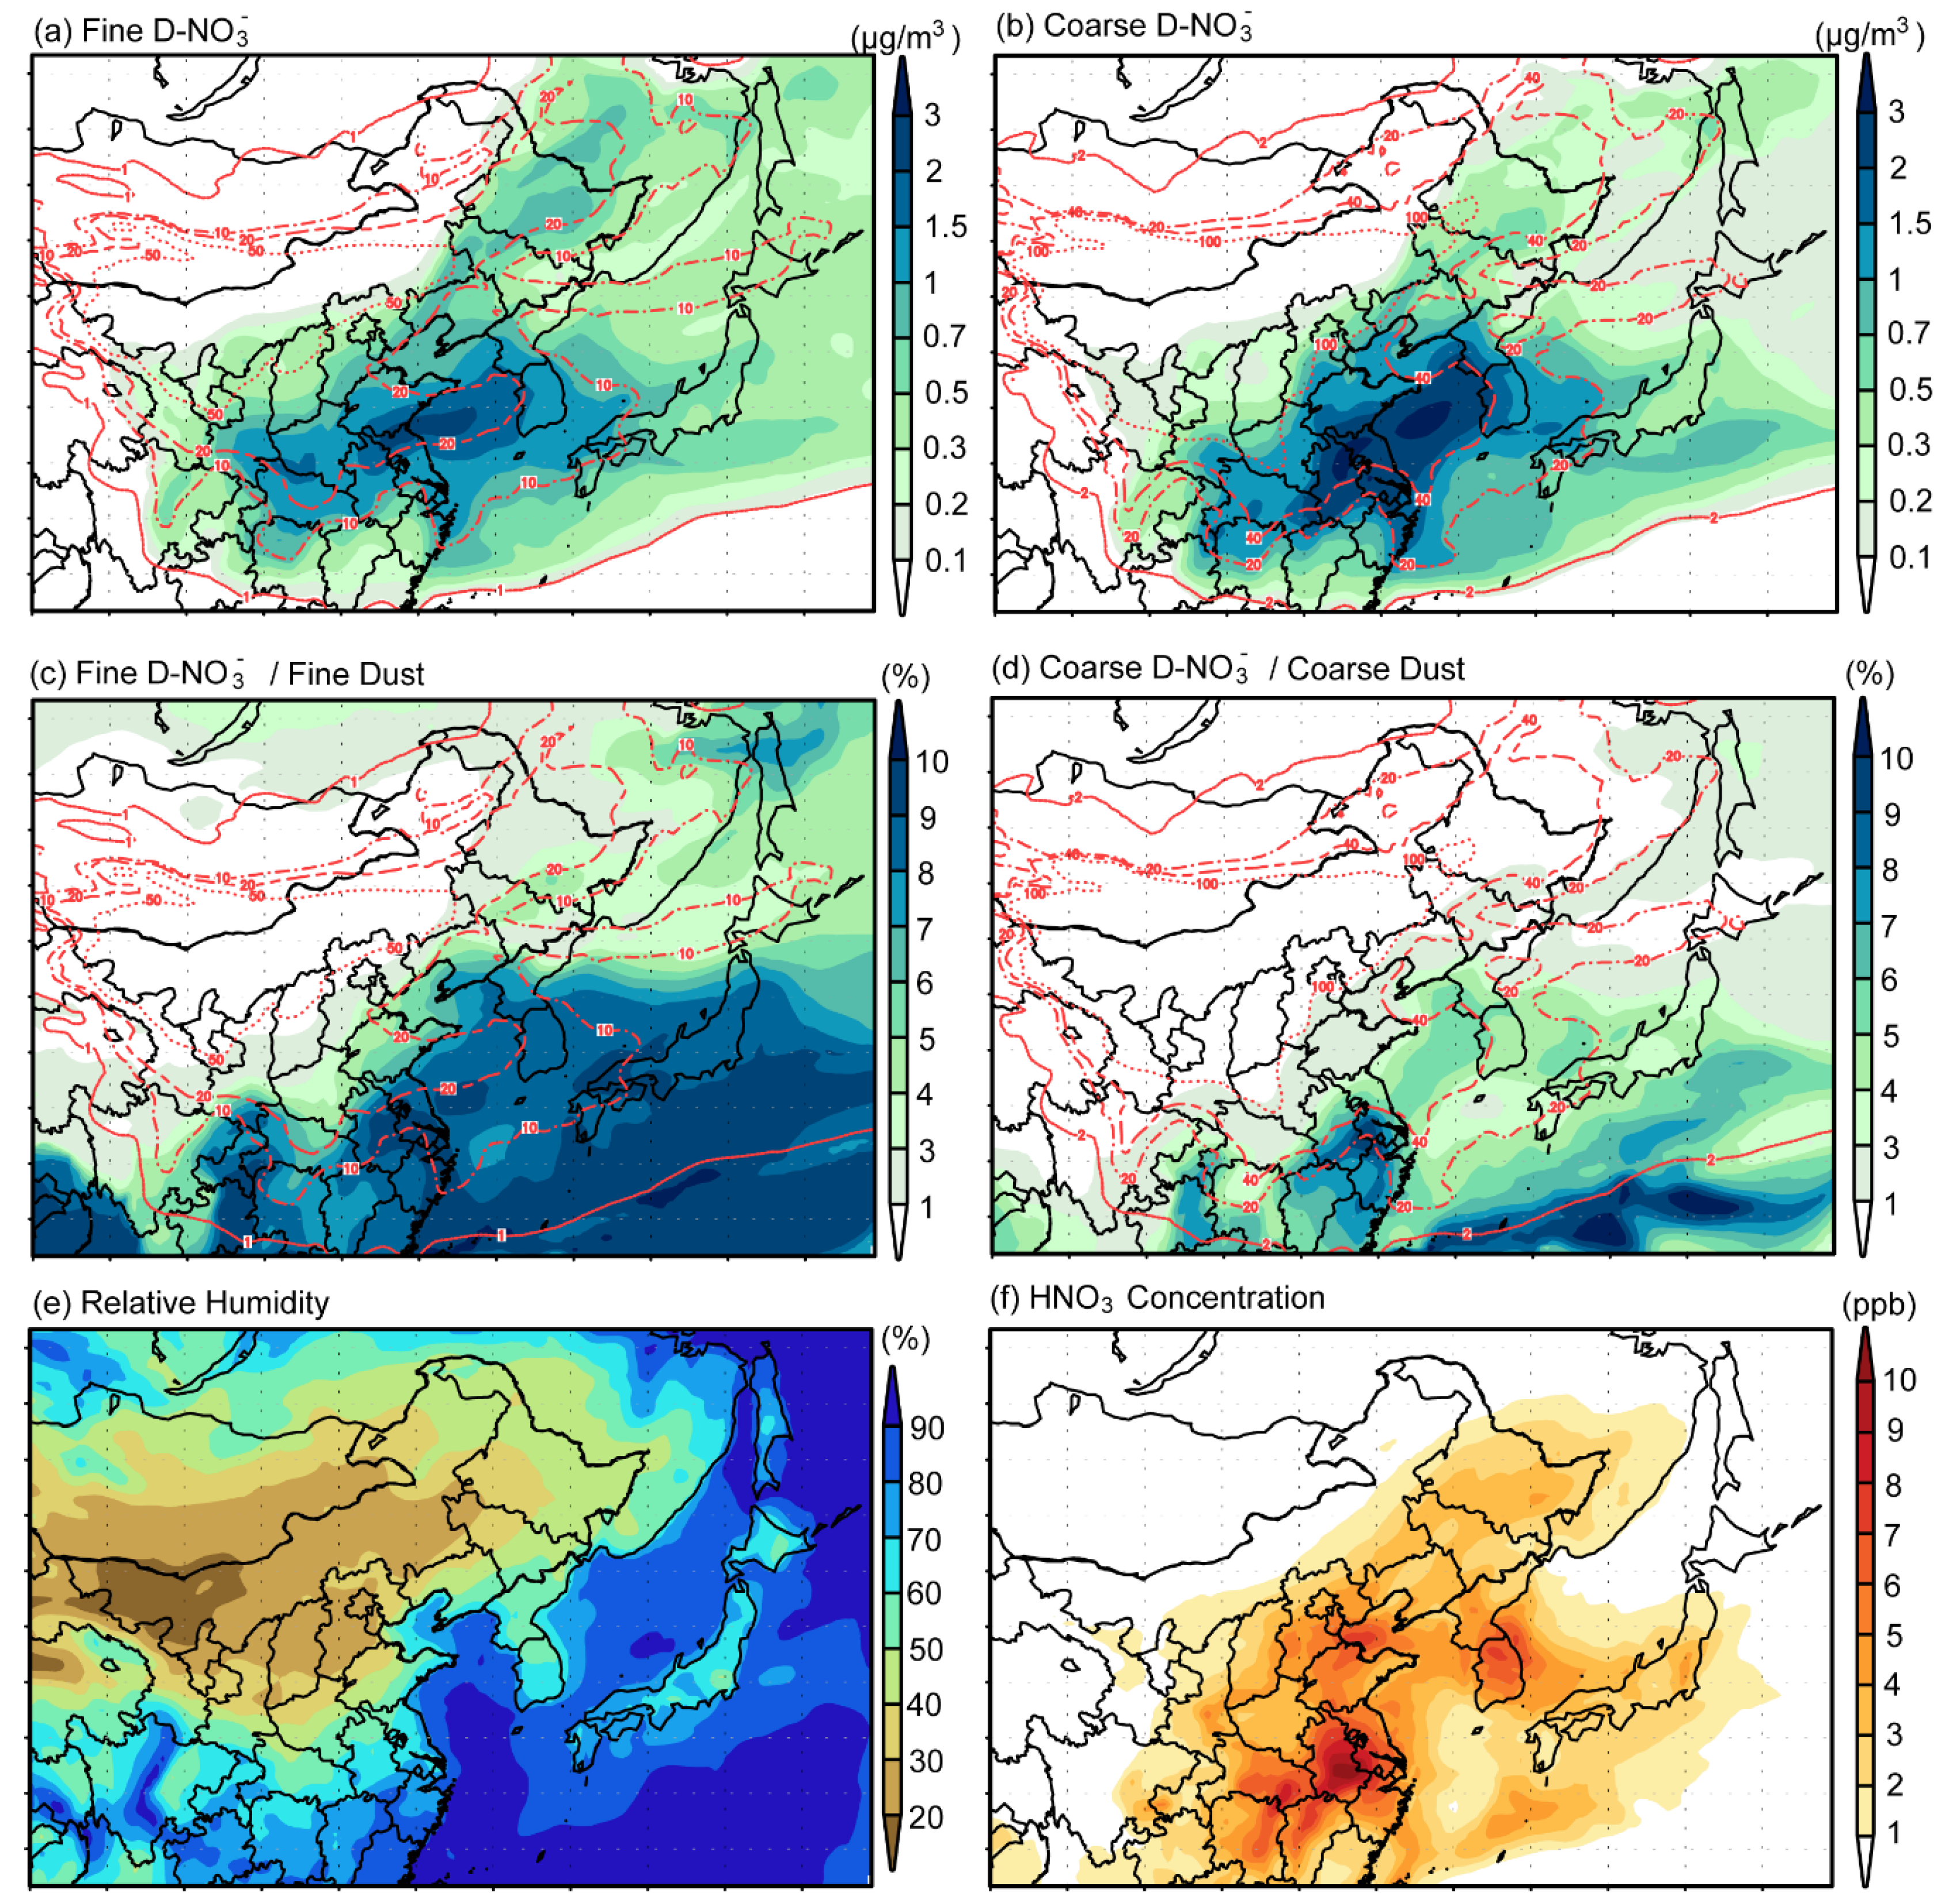
Figure 8 shows the variations of dust concentration, RH, D-NO3, A-NO3, and HNO3, as well as the ratio of D-NO3 to dust concentration along the 36 h backward trajectory from Fukuoka, at 20:00, on 6 May 2017 (JST), as shown in Figure 3. We can see that the air mass containing dust located over North China (NC), on the morning of 5 May, was transported through the Bohai Sea (BS) and Liaoning Peninsula (LP) in the afternoon, the Yellow Sea (YS) in the evening, and then reached North Korea at 22:00. From the early morning of 6 May, the air mass passed through the Yellow Sea (YS) again, as well as South Korea (SK), and it reached the Tsushima Strait (TS) at 9:00. After slowly moving for 10 h over the TS, the air mass reached Fukuoka, Japan (JP).
The dust concentration decreased rapidly over NC, along the trajectory, due to strong diffusion and deposition. The D-NO3 concentration was less than 3 μg m−3, and the D-NO3/dust ratio was less than 0.5%, due to low RH (<30%) during this period. When the air mass reached the Bohai Sea, where RH was greater than 50%, the D-NO3 quickly increased from 5 to 19 μg m−3, faster than the increase of A-NO3. Meanwhile, the ratio of D-NO3 to dust also increased from 0.5% to 3%. After that, all the dust, D-NO3 and D-NO3/dust ratio decreased due to the impacts of the Liaoning Peninsula, including low RH and strong deposition. After the air mass was transported to the Yellow Sea, the dust and D-NO3 continuously decreased, while the A-NO3 and the D-NO3/dust ratio increased significantly due to the high RH of nearly 100%. When the air mass reached North Korea, all the dust, D-NO3, A-NO3 concentration, and the D-NO3/dust ratio decreased, probably due to the stronger dilution of A-NO3 and coated dust over land area. From South Korea to Japan, the dust and A-NO3 concentration decreased, while D-NO3 and the D-NO3/dust ratio gradually increased under higher HNO3 concentration. After reaching Japan, the A-NO3 decreased rapidly due to strong diffusion and deposition, and D-NO3 became dominant in nitrate. These results indicated that the sea area with high RH plays a key role in the rapid formation of dust nitrate.

4.2. Horizontal Distribution of D-NO3 and Its Influencing Factors

Figure 9 shows the horizontal distribution of average fine (Figure 9a,c) and coarse-mode (Figure 9b,d) D-NO3 concentrations and the ratio of D-NO3 to dust concentrations by shades, and dust concentrations by lines, as well as the RH and HNO3 concentration during 3–11 May 2017.
The region with the highest fine D-NO3 concentration (>2 μg m−3) was located over the Yellow Sea and East China, while the region with the highest coarse D-NO3 concentration (>3 μg m−3) was located in a very similar area with fine D-NO3, but with a concentration level that was about 50% higher than that of the fine D-NO3. The fine D-NO3 was higher than the coarse D-NO3 over downwind regions, e.g., North Japan and its surrounding area, due to a smaller dry deposition velocity of fine dust. As a result, the area affected by the fine D-NO3 was wider than by the coarse D-NO3.
Figure 9c,d shows that the ratios of D-NO3/dust was less than 1% in both fine and coarse mode over most areas of North China where fine dust was less than 50 μg m−3 and coarse dust was less than 100 μg m−3, due to low RH (<40%), as shown in Figure 9e, and the consequent low uptake rate of HNO3 on dust; it rapidly grew larger than 8% and 6% in fine and coarse mode over the Yellow Sea region due to high RH (>80%), which is favorable for dust to uptake the HNO3. The ratios of D-NO3/dust also showed high value over South China due to relative high RH of about 60% and high HNO3 concentration, with a maximum of more than 10 ppb. The ratios of both fine and coarse D-NO3/dust increased to about 10% over downwind areas with low dust concentrations. These results highlight the importance of D-NO3 and its potential effects on ocean ecosystems.

5. Conclusions

Synergetic observations and the Nested Air Quality Prediction Modeling System (NAQPMS) were used to analyze the transport of a severe dust storm and its impacts on NO3 and SO42− over East Asia, between 3 May and 11 May 2017.
The model successfully reproduced the occurrence and transport of the dust storm by comparison with dust RGB images of the Himawari-8 satellite, the SYNOP dust weather report, on-site particulate matter (PM) observations, and LIDAR-observed dust extinction coefficients.
The NAQPMS model also generally reproduced the concentration levels of observed nitrate and sulfate over Fukuoka, Japan. The model results indicated that the dust heterogeneous reaction was the dominant pathway for nitrate formation, since the fraction of D-NO3 to total nitrate was 60% and 72% in fine and coarse mode, respectively. However, the dust heterogeneous reaction had a limited contribution to sulfate, since the simulated period-averaged D-SO42− was only 0.1 μg m−3 in both fine and coarse mode.
Dust nitrate formed rapidly after leaving China, and the mass ratio of dust nitrate to dust aerosol increased to greater than 8% and 6% in fine and coarse mode, respectively, over the Yellow Sea region, due to high RH (>80%), which is favorable for dust to uptake the HNO3. The highest period-averaged concentration of dust nitrate (>5 μg m−3) was shown over the Yellow Sea and East China. The mass ratio of dust nitrate to dust aerosol finally reached 10% downwind over Pacific Ocean. Our results confirmed the importance of dust heterogeneous reactions and implied their important impacts on the ocean ecosystem. Our results also indicated that the NAQPMS model can be used to quantify the potential effects of nitrate transport and deposition in the ocean.
In addition, our analysis suggested that the γ dust HNO 3 of coarse dust particles may be greater than that of fine dust particles due to the underestimation of coarse nitrate and overestimation of fine nitrate by the model. The reason was not clear yet, and more studies are necessary.

Author Contributions

Conceptualization, Z.W. (Zhe Wang) and I.U.; data curation, K.Y., X.P., A.S., and N.S.; software, Z.W. (Zifa Wang), X.C., J.L., and Z.W. (Zhe Wang); writing—original draft, Z.W. (Zhe Wang); writing—review and editing, I.U.

Funding

This research was funded by the Japan Society for the Promotion of Science (JSPS, Grant-in-Aid for Scientific Research, 18H03359) and the National Natural Science Foundation of China (NNSF, 41505115).

Acknowledgments

This research was funded by the Japan Society for the Promotion of Science (JSPS, Grant-in-Aid for Scientific Research, 18H03359) and the National Natural Science Foundation of China (NNSF, 41505115).

Conflicts of Interest

The authors declare no conflict of interest.

References

  1. Shao, Y.; Wyrwoll, K.-H.; Chappell, A.; Huang, J.; Lin, Z.; McTainsh, G.H.; Mikami, M.; Tanaka, T.Y.; Wang, X.; Yoon, S. Dust cycle: An emerging core theme in earth system science. Aeolian Res. 2011, 2, 181–204. [Google Scholar] [CrossRef]
  2. Huang, J.; Lin, B.; Minnis, P.; Wang, T.; Wang, X.; Hu, Y.; Yi, Y.; Ayers, J.K. Satellite-based assessment of possible dust aerosols semi-direct effect on cloud water path over East Asia. Geophys. Res. Lett. 2006, 33. [Google Scholar] [CrossRef] [Green Version]
  3. Jickells, T.D.; An, Z.S.; Andersen, K.K.; Baker, A.R.; Bergametti, G.; Brooks, N.; Cao, J.J.; Boyd, P.W.; Duce, R.A.; Hunter, K.A.; et al. Global iron connections between desert dust, ocean biogeochemistry, and climate. Science 2005, 308, 67–71. [Google Scholar] [CrossRef]
  4. Kanatani, K.T.; Ito, I.; Al-Delaimy, W.K.; Adachi, Y.; Mathews, W.C.; Ramsdell, J.W. Desert dust exposure is associated with increased risk of asthma hospitalization in children. Am. J. Respir. Crit. Care Med. 2010, 182, 1475–1481. [Google Scholar] [CrossRef]
  5. Bauer, S.E.; Mishchenko, M.I.; Lacis, A.A.; Zhang, S.; Perlwitz, J.; Metzger, S.M. Do sulfate and nitrate coatings on mineral dust have important effects on radiative properties and climate modeling? J. Geophys. Res. Atmos. 2007, 112. [Google Scholar] [CrossRef] [Green Version]
  6. Wang, Z.; Zhang, H.; Jing, X.; Wei, X. Effect of non-spherical dust aerosol on its direct radiative forcing. Atmos. Res. 2013, 120–121, 112–126. [Google Scholar] [CrossRef]
  7. Kelly, J.T.; Chuang, C.C.; Wexler, A.S. Influence of dust composition on cloud droplet formation. Atmos. Environ. 2007, 41, 2904–2916. [Google Scholar] [CrossRef] [Green Version]
  8. Uno, I.; Uematsu, M.; Hara, Y.; He, Y.J.; Ohara, T.; Mori, A.; Kamaya, T.; Murano, K.; Sadanaga, Y.; Bandow, H. Numerical study of the atmospheric input of anthropogenic total nitrate to the marginal seas in the western North Pacific region. Geophys. Res. Lett. 2007, 34. [Google Scholar] [CrossRef]
  9. Wang, Z.; Pan, X.; Uno, I.; Li, J.; Wang, Z.; Chen, X.; Fu, P.; Yang, T.; Kobayashi, H.; Shimizu, A.; et al. Significant impacts of heterogeneous reactions on the chemical composition and mixing state of dust particles: A case study during dust events over northern China. Atmos. Environ. 2017, 159, 83–91. [Google Scholar] [CrossRef]
  10. Zhang, Y.; Sunwoo, Y.; Kotamarthi, V.; Carmichael, G.R. Photochemical oxidant processes in the presence of dust: An evaluation of the impact of dust on particulate nitrate and ozone formation. J. Appl. Meteorol. 1994, 33, 813–824. [Google Scholar] [CrossRef]
  11. Zhang, Y.; Carmichael, G.R. The role of mineral aerosol in tropospheric chemistry in East Asia—A model study. J. Appl. Meteorol. 1999, 38, 353–366. [Google Scholar] [CrossRef]
  12. Dentener, F.J.; Carmichael, G.R.; Zhang, Y.; Lelieveld, J.; Crutzen, P.J. Role of mineral aerosol as a reactive surface in the global troposphere. J. Geophys. Res. Atmos. 1996, 101, 22869–22889. [Google Scholar] [CrossRef]
  13. Fairlie, T.D.; Jacob, D.J.; Dibb, J.E.; Alexander, B.; Avery, M.A.; van Donkelaar, A.; Zhang, L. Impact of mineral dust on nitrate, sulfate, and ozone in transpacific Asian pollution plumes. Atmos. Chem. Phys. 2010, 10, 3999–4012. [Google Scholar] [CrossRef] [Green Version]
  14. Uno, I.; Osada, K.; Yumimoto, K.; Wang, Z.; Itahashi, S.; Pan, X.; Hara, Y.; Yamamoto, S.; Nishizawa, T. Importance of long-range nitrate transport based on long-term observation and modeling of dust and pollutants over East Asia. Aerosol. Air Qual. Res. 2017, 17, 3052–3064. [Google Scholar] [CrossRef]
  15. Uno, I.; Osada, K.; Yumimoto, K.; Wang, Z.; Itahashi, S.; Pan, X.; Hara, Y.; Kanaya, Y.; Yamamoto, S.; Fairlie, T.D. Seasonal variation of fine-and coarse-mode nitrates and related aerosols over East Asia: Synergetic observations and chemical transport model analysis. Atmos. Chem. Phys. 2017, 17, 14181–14197. [Google Scholar] [CrossRef]
  16. Pan, X.; Uno, I.; Wang, Z.; Nishizawa, T.; Sugimoto, N.; Yamamoto, S.; Kobayashi, H.; Sun, Y.; Fu, P.; Tang, X.; et al. Real-time observational evidence of changing Asian dust morphology with the mixing of heavy anthropogenic pollution. Sci. Rep. 2017, 7, 335. [Google Scholar] [CrossRef]
  17. Pan, X.; Ge, B.; Wang, Z.; Tian, Y.; Liu, H.; Wei, L.; Yue, S.; Uno, I.; Kobayashi, H.; Nishizawa, T.; et al. Synergistic effect of water-soluble species and relative humidity on morphological changes in aerosol particles in the Beijing megacity during severe pollution episodes. Atmos. Chem. Phys. 2019, 19, 219–232. [Google Scholar] [CrossRef] [Green Version]
  18. Minamoto, Y.; Nakamura, K.; Wang, M.; Kawai, K.; Ohara, K.; Noda, J.; Davaanyam, E.; Sugimoto, N.; Kai, K. Large-scale dust event in East Asia in May 2017: Dust emission and transport from multiple source regions. SOLA 2018, 14, 33–38. [Google Scholar] [CrossRef]
  19. Yumimoto, K.; Kajino, M.; Tanaka, T.Y.; Uno, I. Dust vortex in the Taklimakan Desert by himawari-8 high frequency and resolution observation. Sci. Rep. 2019, 9, 1209. [Google Scholar] [CrossRef]
  20. Pan, X.; Uno, I.; Wang, Z.; Yamamoto, S.; Hara, Y.; Wang, Z. Seasonal variabilities in chemical compounds and acidity of aerosol particles at urban site in the west Pacific. Environ. Pollut. 2018, 237, 868–877. [Google Scholar] [CrossRef]
  21. Uno, I.; Yumimoto, K.; Osada, K.; Wang, Z.; Pan, X.; Itahashi, S.; Yamamoto, S. Dust acid uptake analysis during long-lasting dust and pollution episodes over East Asia based on synergetic observation and chemical transport model. SOLA 2017, 13, 109–113. [Google Scholar] [CrossRef]
  22. Stein, A.F.; Draxler, R.R.; Rolph, G.D.; Stunder, B.J.B.; Cohen, M.D.; Ngan, F. NOAA’s HYSPLIT atmospheric transport and dispersion modeling system. Bull. Am. Meteorol. Soc. 2015, 96, 2059–2077. [Google Scholar] [CrossRef]
  23. Sugimoto, N.; Matsui, I.; Shimizu, A.; Nishizawa, T.; Hara, Y.; Xie, C.; Uno, I.; Yumimoto, K.; Wang, Z.; Yoon, S.C. Lidar network observations of tropospheric aerosols. In Lidar Remote Sensing for Environmental Monitoring IX; International Society for Optics and Photonics: Bellingham, WA, USA, 2008; Volume 7153. [Google Scholar]
  24. Sugimoto, N.; Uno, I.; Nishikawa, M.; Shimizu, A.; Matsui, I.; Dong, X.; Chen, Y.; Quan, H. Record heavy Asian dust in Beijing in 2002: Observations and model analysis of recent events. Geophys. Res. Lett. 2003, 30. [Google Scholar] [CrossRef]
  25. Wang, Z.; Maeda, T.; Hayashi, M.; Hsiao, L.-F.; Liu, K.-Y. A nested air quality prediction modeling system for urban and regional scales: Application for high-ozone episode in Taiwan. Water Air Soil Pollut. 2001, 130, 391–396. [Google Scholar] [CrossRef]
  26. Li, J.; Wang, Z.; Zhuang, G.; Luo, G.; Sun, Y.; Wang, Q. Mixing of Asian mineral dust with anthropogenic pollutants over East Asia: A model case study of a super-duststorm in March 2010. Atmos. Chem. Phys. 2012, 12, 7591–7607. [Google Scholar] [CrossRef]
  27. Zheng, B.; Tong, D.; Li, M.; Liu, F.; Hong, C.; Geng, G.; Li, H.; Li, X.; Peng, L.; Qi, J.; et al. Trends in China’s anthropogenic emissions since 2010 as the consequence of clean air actions. Atmos. Chem. Phys. 2018, 18, 14095–14111. [Google Scholar] [CrossRef]
  28. Li, M.; Zhang, Q.; Kurokawa, J.-I.; Woo, J.-H.; He, K.; Lu, Z.; Ohara, T.; Song, Y.; Streets, D.G.; Carmichael, G.R.; et al. MIX: A mosaic Asian anthropogenic emission inventory under the international collaboration framework of the MICS-Asia and HTAP. Atmos. Chem. Phys. 2017, 17, 935–963. [Google Scholar] [CrossRef]
  29. Athanasopoulou, E.; Tombrou, M.; Pandis, S.N.; Russell, A.G. The role of sea-salt emissions and heterogeneous chemistry in the air quality of polluted coastal areas. Atmos. Chem. Phys. 2008, 8, 5755–5769. [Google Scholar] [CrossRef] [Green Version]
  30. Zaveri, R.A.; Peters, L.K. A new lumped structure photochemical mechanism for large-scale applications. J. Geophys. Res. Atmos. 1999, 104, 30387–30415. [Google Scholar] [CrossRef]
  31. Nenes, A.; Pandis, S.N.; Pilinis, C. ISORROPIA: A new thermodynamic equilibrium model for multiphase multicomponent inorganic aerosols. Aquat. Geochem. 1998, 4, 123–152. [Google Scholar] [CrossRef]
  32. Chang, J.S.; Brost, R.A.; Isaksen, I.S.A.; Madronich, S.; Middleton, P.; Stockwell, W.R.; Walcek, C.J. A three-dimensional Eulerian acid deposition model: Physical concepts and formulation. J. Geophys. Res. Atmos. 1987, 92, 14681–14700. [Google Scholar] [CrossRef]
  33. Wesely, M.L. Parameterization of surface resistances to gaseous dry deposition in regional-scale numerical models. Atmos. Environ. (1967) 1989, 23, 1293–1304. [Google Scholar] [CrossRef]
  34. Wang, Z.; Itahashi, S.; Uno, I.; Pan, X.; Osada, K.; Yamamoto, S.; Nishizawa, T.; Tamura, K.; Wang, Z. Modeling the long-range transport of particulate matters for January in East Asia using NAQPMS and CMAQ. Aerosol. Air Qual. Res. 2017, 17, 3065–3078. [Google Scholar] [CrossRef]
  35. Wang, Z.; Pan, X.; Uno, I.; Chen, X.; Yamamoto, S.; Zheng, H.; Li, J.; Wang, Z. Importance of mineral dust and anthropogenic pollutants mixing during a long-lasting high PM event over East Asia. Environ. Pollut. 2018, 234, 368–378. [Google Scholar] [CrossRef]
  36. Chen, X.; Wang, Z.; Li, J.; Chen, H.; Hu, M.; Yang, W.; Wang, Z.; Ge, B.; Wang, D. Explaining the spatiotemporal variation of fine particle number concentrations over Beijing and surrounding areas in an air quality model with aerosol microphysics. Environ. Pollut. 2017, 231, 1302–1313. [Google Scholar] [CrossRef]
  37. Chen, X.; Wang, Z.; Li, J.; Yang, W.; Chen, H.; Wang, Z.; Hao, J.; Ge, B.; Wang, D.; Huang, H. Simulation on different response characteristics of aerosol particle number concentration and mass concentration to emission changes over mainland China. Sci. Total Environ. 2018, 643, 692–703. [Google Scholar] [CrossRef]
  38. Chen, X.; Yang, W.; Wang, Z.; Li, J.; Hu, M.; An, J.; Wu, Q.; Wang, Z.; Chen, H.; Wei, Y.; et al. Improving new particle formation simulation by coupling a volatility-basis set (VBS) organic aerosol module in NAQPMS + APM. Atmos. Environ. 2019, 204, 1–11. [Google Scholar] [CrossRef]
  39. Boylan, J.W.; Russell, A.G. PM and light extinction model performance metrics, goals, and criteria for three-dimensional air quality models. Atmos. Environ. 2006, 40, 4946–4959. [Google Scholar] [CrossRef]
Figure 1. Model domain and land use categories by Moderate Resolution Imaging Spectrometer (MODIS) data. B, S, and F indicate Beijing, Seoul, and Fukuoka. The blue line with triangle markers (every 6 hours) is the 72-h backward trajectory from Fukuoka at 20:00, on 6 May 2017 (JST).
Atmosphere 10 00680 g001
Figure 2. Dust RGB imageries with the surface synoptic observations (SYNOP) sites where dust weather occurred (red triangle for dust storm and circle for drifting and blowing dust) on each day (af) between 3 May and 8 May 2017 (JST). The green lines with triangle markers (every 6 h) in (c) and (d) show the 48-h backward trajectory from Fukuoka at 20:00, on 6 May 2017 (JST).
Atmosphere 10 00680 g002
Figure 3. Simulated daily horizontal distributions of dust concentrations (shades) and wind vectors (blue vectors) at the first vertical level (z = 50 m) of the model on each day (ah) between 3 May and 10 May 2017 (JST). The red lines with triangle markers (every 6 h) in (c) and (d) show the 48 h backward trajectory from Fukuoka, at 20:00, on 6 May 2017 (JST).
Atmosphere 10 00680 g003
Figure 4. Time series of observed and simulated PM2.5 (particulate matter (PM) with diameter ≤2.5 μm) (a,c,e) and PM10 (PM with diameter ≤ 10 μm) (b,d,f) in Beijing (a,b), Seoul (c,d), and Fukuoka (e,f) between 3 May and 11 May 2017 (JST). The black dots are observed PM. The dark yellow and magenta shades represent simulated dust and non-dust PM concentrations, respectively, and the pie charts show the fraction of dust and non-dust PM.
Atmosphere 10 00680 g004
Figure 5. Aerosol chemical speciation analyzer (ACSA)-observed ΔH+ of (a) fine and (b) coarse aerosol.
Atmosphere 10 00680 g005
Figure 6. LIDAR-observed (a,c,e) and model-simulated (b,d,f) vertical distributions of dust-extinction coefficients in Beijing (a,b), Seoul (c,d), and Fukuoka (e,f). Black represents cloud, and gray represents no data in the LIDAR observation figures.
Atmosphere 10 00680 g006
Figure 7. Time series of observed (black dots) and simulated (color-shaded) NO3 (a,b) and SO42 (c,d) in fine (a,c) and coarse (b,d) mode at Fukuoka. The dark yellow, blue, and magenta shades represent the simulated D-, S-, and A-NO3 and SO42, respectively. The pie charts show the fraction from each chemical pathway of NO3 formation.
Atmosphere 10 00680 g007
Figure 8. Variations of (a) dust concentration and RH; (b) D-NO3, A-NO3, and HNO3; (c) the ratio of D-NO3 to dust concentration, the surface type (land and water), and terrain height along the 36-hour backward trajectory from Fukuoka, on May 6 2017, at 20:00 (JST), as shown if Figure 1. NC: North China, LP: Liaoning Peninsula, NK: North Korea, SK: South Korea, BS: the Bohai Sea, YS: Yellow Sea, TS: Tsushima Strait.
Atmosphere 10 00680 g008
Figure 9. Horizontal distribution of average fine- (a,c) and coarse-mode (b,d) D-NO3 concentrations and the ratio of D-NO3/dust concentrations by shades and dust concentrations by lines, as well as the RH and HNO3 concentrations during 3–11 May 2017.
Atmosphere 10 00680 g009
Table 1. Statistics for the observed and simulated PM10 and PM2.5 in the three cities.
SpeciesSiteNMO (μg m−3)MM (μg m−3)MB (μg m−3)NMB (%)RMSE (μg m−3)MFB (%)MFE (%)R
Beijing153250.6227.5−23.1−9.2287.1−39.074.60.71
PM10Seoul19186.276.6−9.7−11.238.7−28.852.20.81
Fukuoka19257.150.9−6.2−10.927.1−12.845.30.87
Beijing182104.689.6−14.9−14.399.6−24.665.80.70
PM2.5Seoul19124.033.59.639.925.515.763.80.09
Fukuoka19122.820.7−2.1−9.412.9−11.946.00.70
N: number of data pairs; MO: mean observed concentration; MM: mean modeled concentration; MB: mean bias; NMB: normalized mean bias; MFB: mean fractional bias; MFE: mean fractional error; R: correlation coefficient.
Table 2. Statistics for the observed versus modeled fine and coarse nitrate and sulfate in Fukuoka.
SpeciesNMO (μg m−3)MM (μg m−3)MB (μg m−3)NMB (%)RMSE (μg m−3)MFB (%)MFE (%)R
fNO31351.22.31.1 90.1 1.650.869.20.63
cNO31352.01.5−0.5 −25.9 1.3−5.957.00.82
fSO421352.74.31.5 56.5 3.142.872.00.19
cSO421280.40.70.3 63.7 0.558.470.90.18
N: number of data pairs; MO: mean observed concentration; MM: mean modeled concentration; MB: mean bias; NMB: normalized mean bias; MFB: mean fractional bias; MFE: mean fractional error; R: correlation coefficient.

