Article

Levels, Sources and Health Risk of PM2.5 and PM1-Bound PAHs across the Greater Athens Area: The Role of the Type of Environment and the Meteorology

by
Styliani Pateraki
1,*,
Kyriaki-Maria Fameli
1,
Vasiliki Assimakopoulos
1,
Aikaterini Bougiatioti
1,
Thomas Maggos
2 and
Nikolaos Mihalopoulos
1,3
1
Institute for Environmental Research and Sustainable Development, National Observatory of Athens, 15236 Athens, Greece
2
Environmental Research Laboratory/ INT-RP, National Centre for Scientific Research Demokritos, 15310 Athens, Greece
3
Environmental Chemical Processes Laboratory, Chemistry Department, University of Crete, 71003 Heraklion, Greece
*
Author to whom correspondence should be addressed.
Atmosphere 2019, 10(10), 622; https://doi.org/10.3390/atmos10100622
Submission received: 30 August 2019 / Revised: 25 September 2019 / Accepted: 10 October 2019 / Published: 15 October 2019
(This article belongs to the Special Issue Ambient Aerosol Measurements in Different Environments)

Abstract

:
Fine particulate matter (PM) has significant impacts on public health. Among its various chemical components, Polycyclic Aromatic Hydrocarbons (PAHs) are of particular importance since they contribute to a large extent or even enhance its toxic potency. Despite the verified importance of the fine PM pollution for the Greater Athens Area (GAA), information on its composition with respect to the hydrocarbons is extremely scarce. This study aims to uncover the occurrence of the PM2.5 and PM1-bound PAHs across the GAA investigating the impact of the sources and meteorology on the configuration of their profile and potential health risk. The fieldwork took place at three different locations during two different mesoscale wind regimes. Using the Diagnostic PAHs’ Ratio method, the sources were identified while for the quantification of the emissions from the traffic and central heating sectors, the FEI-GREGAA emission inventory was taken into consideration. The potential health risk was estimated calculating the toxic/mutagenic equivalency factors. The peaks for both the PM mass and the PAHs were attributed to the intensity of the emissions. On the other hand, the carcinogenic/mutagenic risk was mainly influenced by the varying characteristics of traffic and especially for the background atmosphere, from the arriving air masses from longer scale distances.

Graphical Abstract

1. Introduction

During the last years, Polycyclic Aromatic Hydrocarbons (PAHs) has become a worldwide environmental issue of great health concern. They are a class of semi-volatile organic compounds with well-known toxic, carcinogenic and mutagenic properties. Having a strong dependence on their molecular weight, PAHs are partitioned between the particulate and the gaseous phase. The hydrocarbons with low molecular weight are mainly found in the vapor phase while those with high molecular weight are mostly associated with fine airborne particles [1,2,3]. Thus, their exposure risk is increased [4].
There are more than 100 polyaromatic hydrocarbons. Based on the long list of the health effects on humans, 16 PAHs have been considered by the United States (US) Environmental Protection Agency (EPA) as priority pollutants. Nine PAHs have been identified as TA98 mutagens showing mutagenic potency and seven have been classified as probable or class B2 carcinogens [2,5]. With its concentrations being above 1.0 ng/m3, benzo[a]pyrene (B[a]P) is considered to be the most toxic polyaromatic hydrocarbon as well as responsible for a genomic frequency of translocation, micronuclei and DNA fragmentation [6]. The non-carcinogenic effects (intrauterine growth restriction, bronchitis, asthma and asthma-like symptoms, ischaemic heart disease) of the specific compounds cannot be neglected as well [5].
Like the other pollutants, the emission sources and the meteorological conditions are the two key parameters for the configuration of the PAHs’ burden of a given area.
The polyaromatic hydrocarbons are almost dominated by anthropogenic origin and the contribution from natural sources (forest burning, volcanic emissions, etc.) is limited [7]. They are mainly formed during various incomplete combustion processes of organic material (fossil fuel burning, motor vehicle emissions, waste incineration, oil refining, coke/steel industry, coal combustion) [5]. Trains, aircrafts and ships also contribute significantly to the mobile sources of the PAHs while residential heating is another source group for the specific compounds [8]. A broad classification of their sources is the group of the pyrogenic and the petrogenic hydrocarbons. Oil derivatives, coal combustion, natural gas and traffic emissions are some of the most important pyrogenic sources while the direct contamination like the spillage of oil products constitute the petrogenic one [5].
Besides the local characteristics of the environment, PAHs are also meteorologically depended and subject to variable atmospheric processes. The influence of the meteorological parameters like temperature, relative humidity, wind speed/direction, precipitation/sunshine hours and total solar radiation to the recorded levels of the PAHs’ has already been proved [9,10,11]. In the case of the atmospheric circulation, it plays an important role in the status of air quality over an urban area [12,13,14]. Being subject to variable transport processes, the air masses are passing over areas with different characteristics. The prevailing meteorological conditions, the different physicochemical profile of the atmospheric pollutants and the atmospheric chemistry alter the initial characteristics of the transported masses. This is the reason why the receptor region is just as important as the source area.
The Greater Athens Area (GAA) is well known for its frequent pollution events. Hosting 4.2 million habitants, about 36% of the total Greek population, it is greatly influenced by both locally emitted and long range transported aerosols [15,16]. The complex and unfavorable topography for the dispersion of the air pollutants in combination with the increased anthropogenic activities (road traffic, residential heating, industrial and shipping emissions) and the local meteorological conditions aggravate the air quality problem in the area. The environmental relevance of the PAHs in the GAA atmosphere is a well-established issue. Owing to their direct health implications and the density of population their monitoring across the Athens basin is of critical importance. Unfortunately, they are not monitored routinely and there is a lack of information regarding their presence on fine particles [17,18]. Mandalakis et al. [19], Sitaras et al. [20] and Vasilakos et al. [21] focused on the analysis of the gaseous and particulate phase of Total Suspended Particles (TSP)-bound PAHs in different locations across the GAA. The concentration levels of PM10-bound PAHs were recorded by Mantis et al. [22] at four sites within the basin while Valavanidis et al. [23] gave information about the bound PAHs within TSP and finer PM fractions at the Athens’ center (PM10.2 and PM2.1).
Therefore, with the principal aim to uncover the fine-PM bound PAHs’ profile and more specifically the dependence of their potential health risk on the prevailing pollution and meteorological conditions, a four-days field campaign took place across the GAA, during the period of 2008 (20 March 2008, 24 March 2008, 20 July 2008, 21 July 2008). The PM2.5 and PM1 measurements took place simultaneously at three locations with different emission characteristics, covering two different mesoscale air flow patterns. The north and the south. The specific types of atmospheric circulation are of critical importance for the GAA, responsible for the dilution/dispersion and the accumulation of the air pollutants within the basin, respectively. Taking into consideration the fact that public is never exposed to a single polyaromatic hydrocarbon but to a mixture of them, the collected samples were analyzed for twenty PAHs, including the 16 USEPA’s priority. In the case of the source allocation, two different techniques were applied to the results. The diagnostic ratios of the PAHs and the emissions from the most update emission inventory for the GAA, the FEI-GREGAA [24]. The transportation of the air masses from longer scale distances was investigated with the computation of the backward trajectories and the aid of HYSPLIT model. Finally, the carcinogenic/mutagenic potency of the exposure to the PAHs’ mixture was estimated with the use of the toxic/mutagenic equivalency factors.

2. Materials and Methods

2.1. Field Campaign

The monitoring stations were selected and positioned carefully, along the central axis (S–N) of the Athens Basin (Figure 1), representing background (site 1), roadside industrialized (site 2) as well as coastal background (site 3) conditions.
A total of 20 PM samples were simultaneously collected during 2008, in the three different types of environment (PM2.5: 4 samples at each one of the three sites and PM1: 4 samples at site 2, 4 samples at site 3). Five low-volume, controlled flow rate (2.3 m3/h) samplers were used simultaneously collecting PM on Quartz filters with diameter 47 and 50 mm. The sampling periods lasted 24 h and the particle mass concentration was determined gravimetrically using an electronic microbalance with a resolution of 1 μg according to EN 14907. Twenty Polyaromatic Hydrocarbons (PAHs) with a molecular mass from 142 to 278 g/mol were quantified in collected aerosols: Acenaphthene (Ace), acenaphthylene (Acy), anthracene (Ant), benzo[a]anthracene (B[a]A), benzo[a]pyrene (B[a]P), benzo[e]pyrene (B[e]P), benzo[b]fluoranthene (B[b]F), benzo[k]fluoranthene (B[k]F), benzo[g,h,i]perylene (B[ghi]Per), chrysene (Chry), dibenzo[a,h]anthracene (dBaAnt), fluoranthene (Fla), fluorene (Fl), perylene (Per), indeno (1,2,3-c,d) pyrene (IndP), phenanthrene (Phe), pyrene (Pyr), 3,6-dimethylphenanthrene (3,6-dMePhe), 1-methylphenanthrene (1-MePhe) and 2-methylphenanthrene (2-MePhe). The sampling and the analysis of the polyaromatic hydrocarbons was performed according to ISO 12884 with the use of the certified material NIST Urban Dust (1649b). The values of (i) the limit of detection (LOD), (ii) the limit of quantitation (LOQ) and (iii) the expanded uncertainty at 95% confidence level and k = 2 that has been estimated experimentally (Uexp) for each detected hydrocarbon are summarized on Table S1.

2.2. Data Analysis

2.2.1. Meteorology

In order to investigate the role of the prevailing meteorology to the configuration of the obtained PM burden across the GAA, the daily wind flow patterns were defined [14]. To be more specific, for each sampling day and for each sampling station they were analyzed the hourly wind (speed, direction) data. Then, following the classification of Helmis et al., 1997 and Pateraki et al., 2008 it was found that the experimental period was characterized by the prevalence of two opposite prevailing surface wind flow patterns: (i) The strong northerly component synoptic wind and the strong southerly one. The strong northerly flow, the so-called Etesians, is the typical and prevalent characteristic feature of the warm period in the Aegean Sea which favors the transportation of the air masses from the northern suburbs to the city center and then to the areas just opposite the basin [25,26]. On the contrary, the strong southerly flow is regarded as the main transport channel for particles from the ‘polluted’ industrial zones of Piraeus, Votanikos and the Saronicos Gulf to the northern sector [26,27,28]. Quite often it favors the appearance of inversions, due to the transfer of warm air masses from the southern part of the Mediterranean [29,30]. In general, the northerly prevailing wind regime is associated with the export of the particles from the GAA while the southerly one with their accumulation within the basin [13,27,30]. The hourly variation of the wind speed is illustrated on Figure S1 while the differentiation of the wind flow during each sampling day at the three sampling stations is depicted on Figures S2 and S3.
Besides the classification of the daily wind flow patterns, the vertical profile of the temperature during each sampling day was taken into consideration as well (Figures S4 and S5). As it is well-known, the temperature inversions can be a likely factor for enhanced ground–level concentrations of the pollutants. During such an episode, the temperature profile is inverted and the pollutants are trapped close to the ground. The data were obtained from the open database of the University of Wyoming (The vertical profile of the temperature during the sampling days. Available on line: http://weather.uwyo.edu/upperair/sounding.html). According to the results, a temperature inversion occurred on 24 March 2008 (15LT), at around 140 m from the ground.
Finally, it should be noted that there was no rainfall in any sampling day.

2.2.2. Air Mass Backward Trajectories

In an attempt to identify the origins and pathways of the PM pollution across the GAA, the backward trajectory modeling procedure was employed. More specifically, four-day kinematic back trajectories arriving at three heights, 750, 1500 and 3000 m AMSL, were computed with the aid of the Hybrid Single-Particle Lagrangian Integrated Trajectory model (HYSPLIT) [30].

2.2.3. Source Apportionment

A widely used method for determining the potential sources of the PAHs, especially for vehicle emissions [8], is the use of Diagnostic Ratios (DRs). Based on the specific method, the ratios of the concentrations of specific polyaromatic hydrocarbons are utilized as diagnostic tools in order to identify the corresponding emission sources of the PAHs. The most significant advantage of this method is that it is less complicated and easier to be interpreted than other methods [5,8,10]. However, the specific approximation needs to be used with caution. PAHs’ profiles in receptor sites can be different from those in the sources’ sites, since they can be altered during the transportation process. The different physicochemical properties of the paired hydrocarbons can have different effects on PAHs. The degradation that may occur during the sampling can also modify their levels and as a result the ratios should be used with caution [10]. Moreover, the discrimination between some of the sources such as fuel differentiation for vehicle sources or coal and other biomass fuels, is often difficult since these ratios show intra-source variability but inter-source similarity [8]. Besides the above limitations, the DRs method cannot quantify the contribution of the identified sources. Therefore, it was used another source apportionment technique. The emissions data by the most update emission inventory for the Athens Basin, the FEI-GREGAA. To be more specific, they were used the quantified emissions for the PM2.5 mass and 4 PAHs (B[b]F, B[k]F, B[a]P, IndP) from the traffic and central heating sector for the Athens Basin. The methodology for the calculation of the annual values, the spatial disaggregation in a 2 × 2 km2 grid and in 1 h temporal scale is mentioned thoroughly in Fameli and Assimakopoulos [15,24]. For the comparison with the measurements, the daily gridded emissions were supposed to represent a 1 m cell height.

2.2.4. Health Risk Assessment

A usual method for the estimation of the risk assessment owing to the inhalation exposure to the mixture of the PAHs, is the calculation of the B[a]P equivalent concentrations (B[a]Peq; [5,8,10,18,31,32]). Despite the fact that B[a]P is considered as the most carcinogenic polyaromatic hydrocarbon and is often used as an indicator of human exposure to PAHs, virtually all the compounds have carcinogenic and mutagenic potencies. Using the methods of the toxic and the mutagenic equivalent factor (TEF and MEF, respectively) for the PAHs’ mixture, it is assessed the sum of the carcinogenic and mutagenic potency of each one of the congeners on the basis of their B[a]P carcinogenic and mutagenic equivalent concentration (B[a]PTEQ, B[a]PMEQ, respectively). The toxic equivalency (TEQ) of a PAHs mixture is computed applying the formula T E Q = i n = 1 B [ a ] P T E Q = i n = 1 ( C i × T E F i ) where Ci is the concentration and TEFi is the TEF value of the ith identified hydrocarbon [18]. Of the various established TEFs, those suggested by Nisbet and LaGoy [33] are considered to accurately reflect the current knowledge on the relative potency of individual PAHs. It should be noted that for dBaAnt it was used a TEF of 1 as proposed by Malcolm and Dobson [34]. Similarly, in the case of the total mutagenicity of the PAHs’ mixture, it was estimated based on the formula M E Q = i n = 1 B [ a ] P M E Q = i n = 1 ( C i × M E F i ) where Ci is the concentration and MEFi is the MEF value of the ith identified hydrocarbon [18]. Among the various established TEFs and MEFs were used those proposed by Durant et al. [35].

3. Results and Discussion

3.1. Influence of the Type of the Environment

3.1.1. PM Mass and PAHs

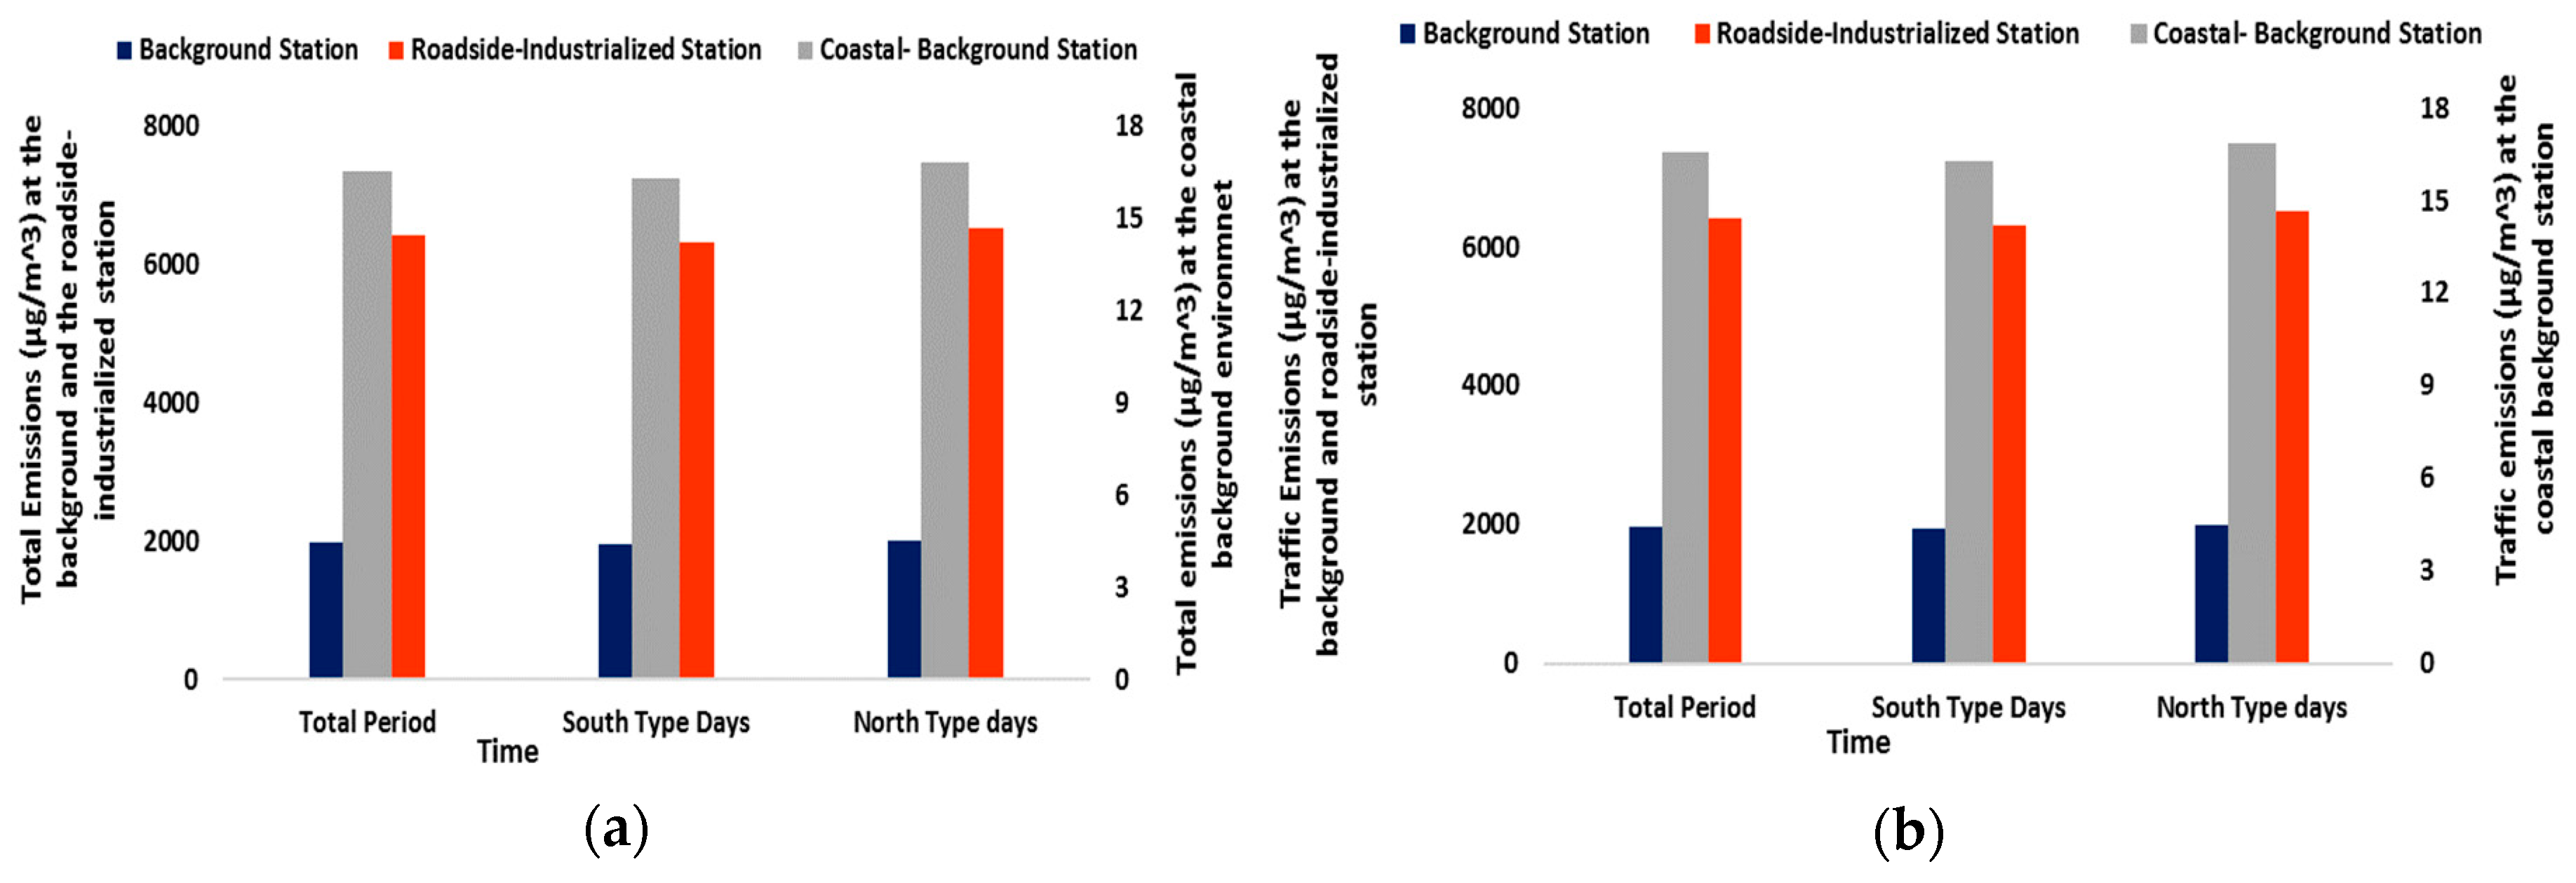
Table 1 summarizes the average values of both the PM mass and the PAHs’ concentration levels at the different types of environment during the four-days experimental period. With the maximum PM load being recorded within the ‘polluted’ basin (sites 1, 2), the importance of the emissions’ intensity is clearly denoted [28]. The increasing trend of the average PM1/PM2.5 ratios when moving from the coastal environment (66%; site 3) to the roadside-industrialized one (75%; site 2) strengthens the previous hypothesis. Of great importance is the compliance of the measurement data with the corresponding total quantified emissions (the sum of the traffic central heating sector) produced for the PM2.5 mass by the FEI-GREGAA emission inventory ([24]; Figure 2a).
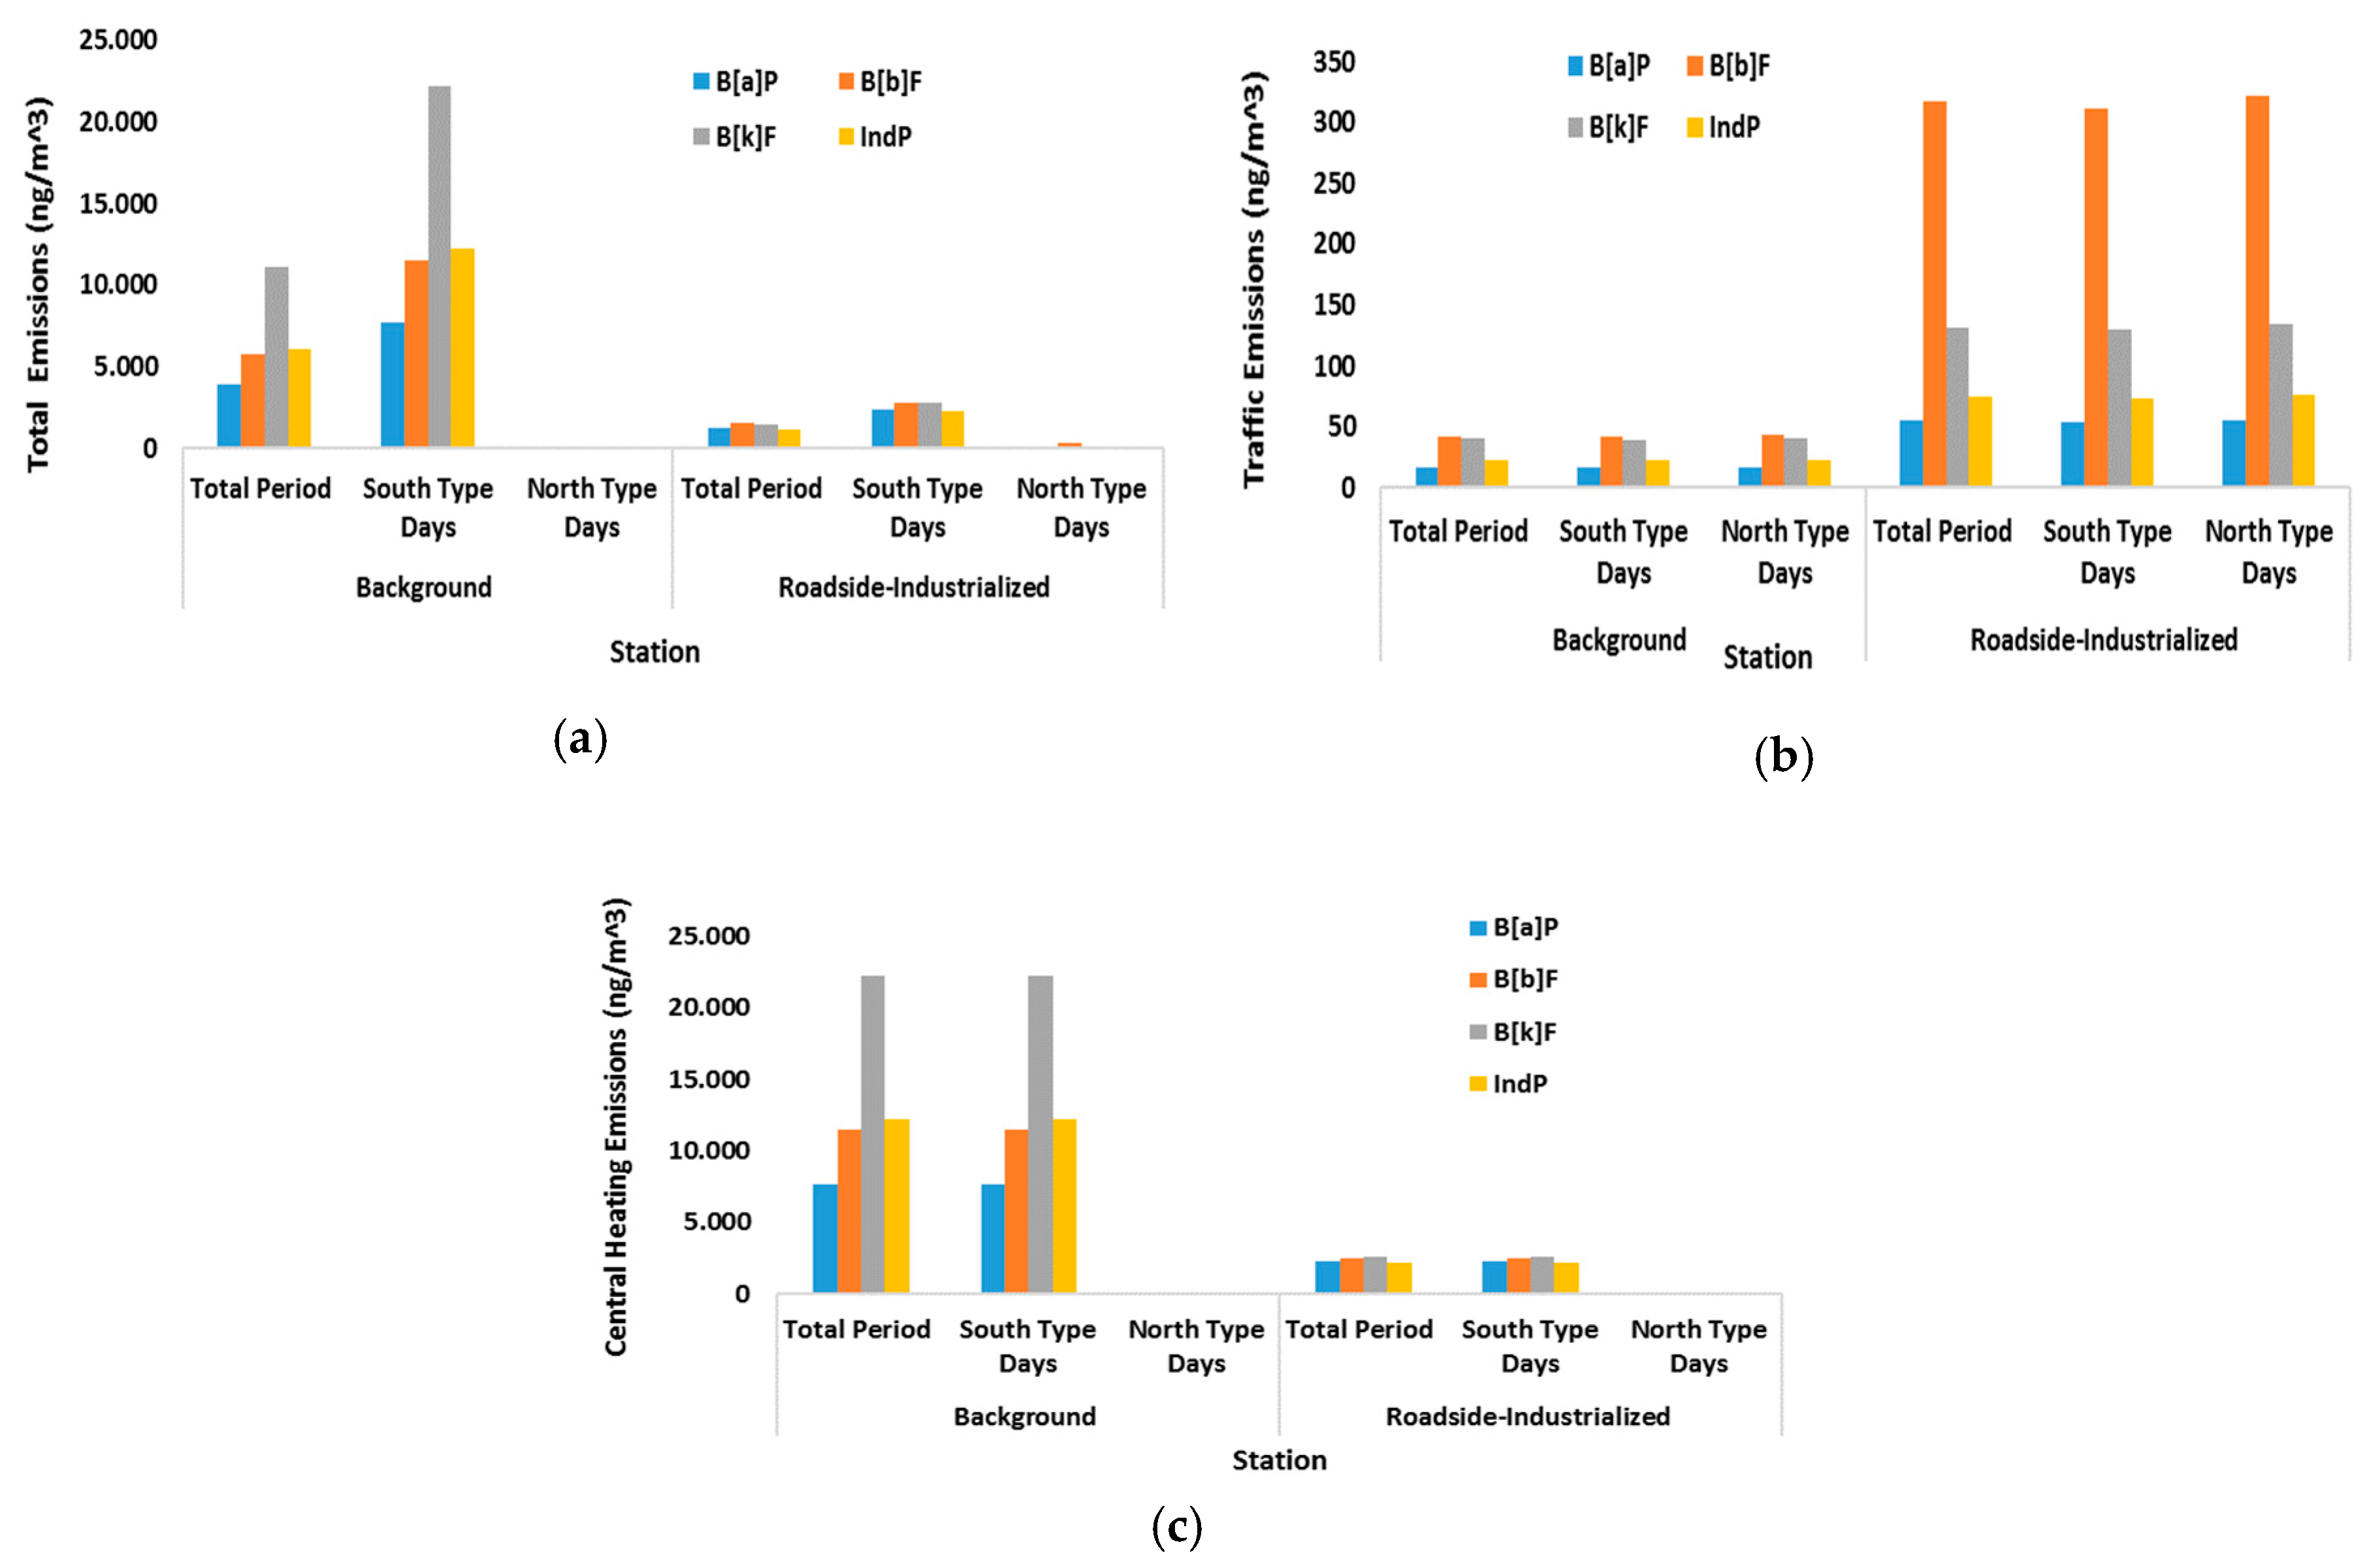
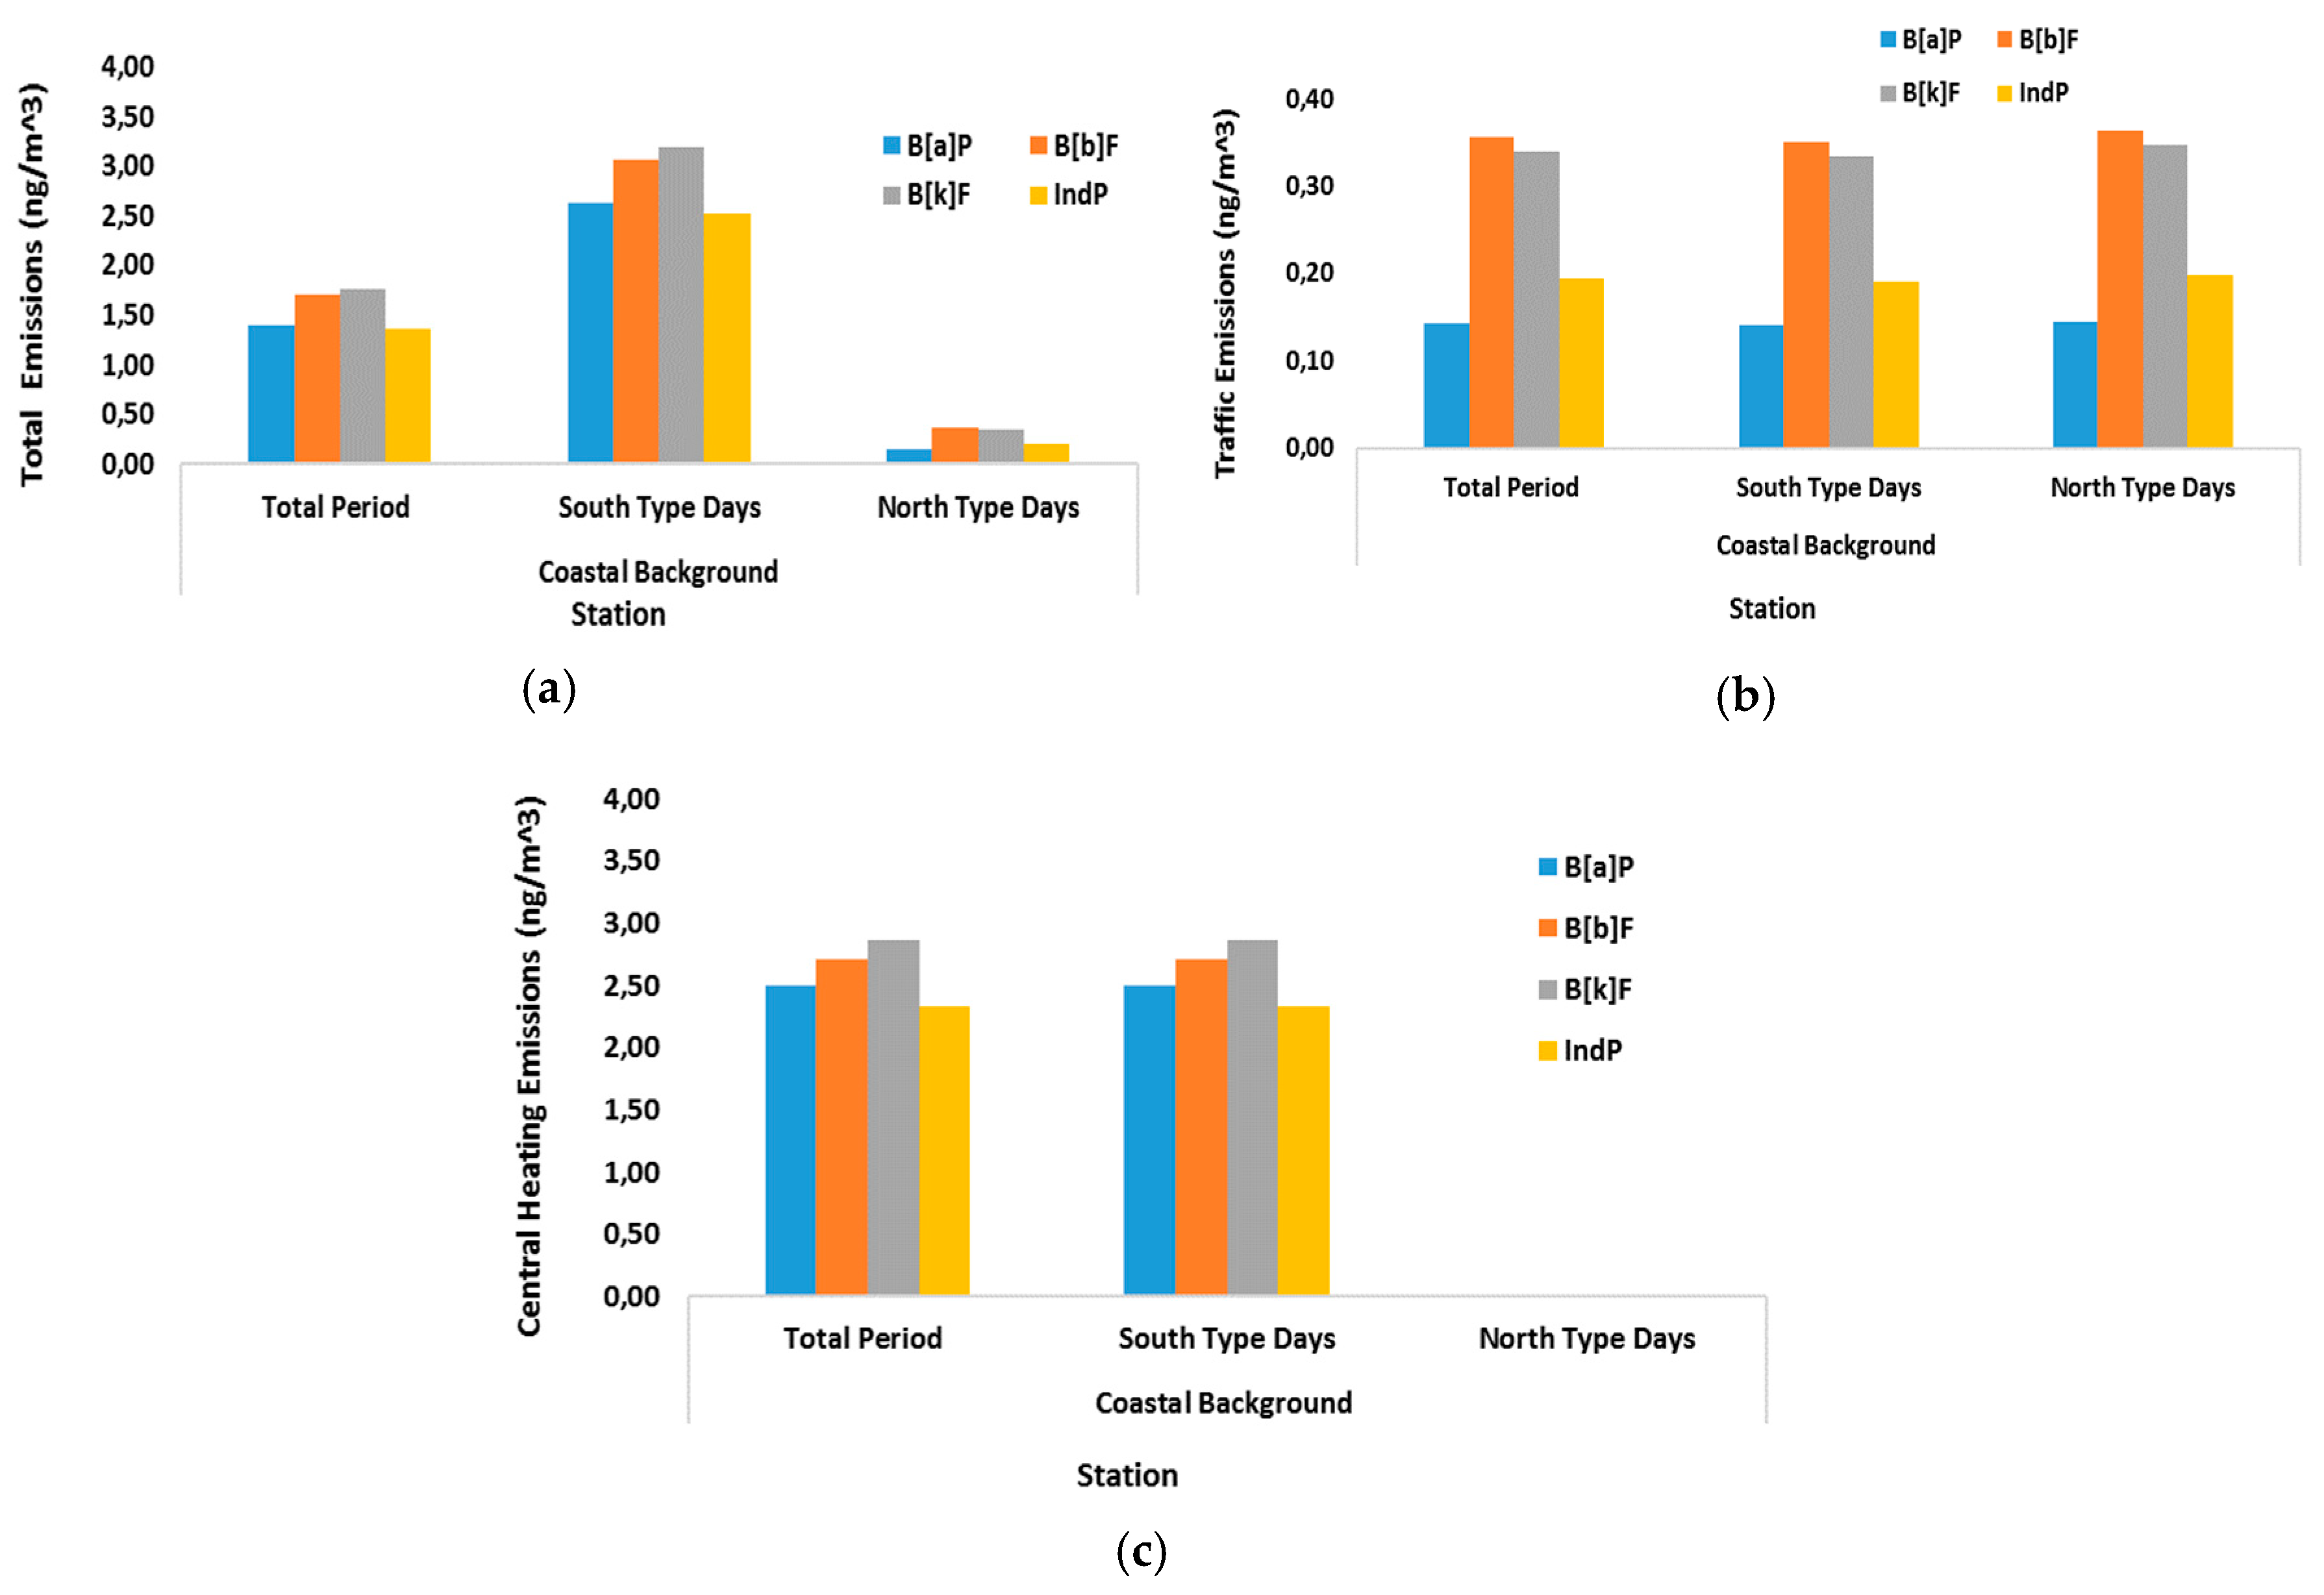
In agreement with the obtained scheme for the PM mass, the higher values of the polyaromatic hydrocarbons were recorded within the basin (sites 1, 2; Table 1). The strong anthropogenic identity of the specific compounds can fully justify the result [18]. According to the field campaign, even with the prevalence of different hydrocarbons, traffic and central heating seemed to be responsible for the configuration of the PAHs’ burden across the GAA. More specifically, B[b]F and B[ghi]Per were the most abundant hydrocarbons at the roadside-industrialized (site 2) and coastal environment (site 3), respectively, while IndP prevailed at the background atmosphere of the basin (site 1; Table 1). All the three congeners are well-known traffic indicators [36,37,38,39] and partly components (only in winter) of residential oil burning for heating [23]. As far as the FEI-GREGAA is concerned, among the quantified congeners, the simultaneous indicators of traffic and central heating B[b]F and B[k]F were the prevalent (Figure 3a and Figure 4a). The highest input at the roadside-industrialized environment (site 2) was attributed to B[b]F while B[k]F was the dominant hydrocarbon in the background atmosphere (sites 1, 3). Without any differentiation, the High Molecular Weight (HMW)-PAHs was the most prominent group of the hydrocarbons (up to 70% and 67% for PM2.5 and PM1, respectively) within PM2.5 and PM1 at the three different types of environment. HMW-PAHs include all the probable and possible carcinogenic components while they are generated mainly through high-temperature combustion, involving coal and petroleum, such as combustion processes in power plants, factories, automotive engines, and gas-fired cooking appliances [18]. In accordance with the number of their aromatic rings, the dominant group was the one with the 5 rings (up to 40% for both PM2.5 and PM1 fractions). The exceptions were the background particles and the coastal PM1 (PAHs with 3 rings up to 27% and 28%, respectively). The absence of a specific trend can be attributed to the simultaneous contribution of various local sources that affecting each station [28].

3.1.2. Source Identification

Traffic and residential heating are well defined sources of the particulate pollution across the GAA [15,18,23].
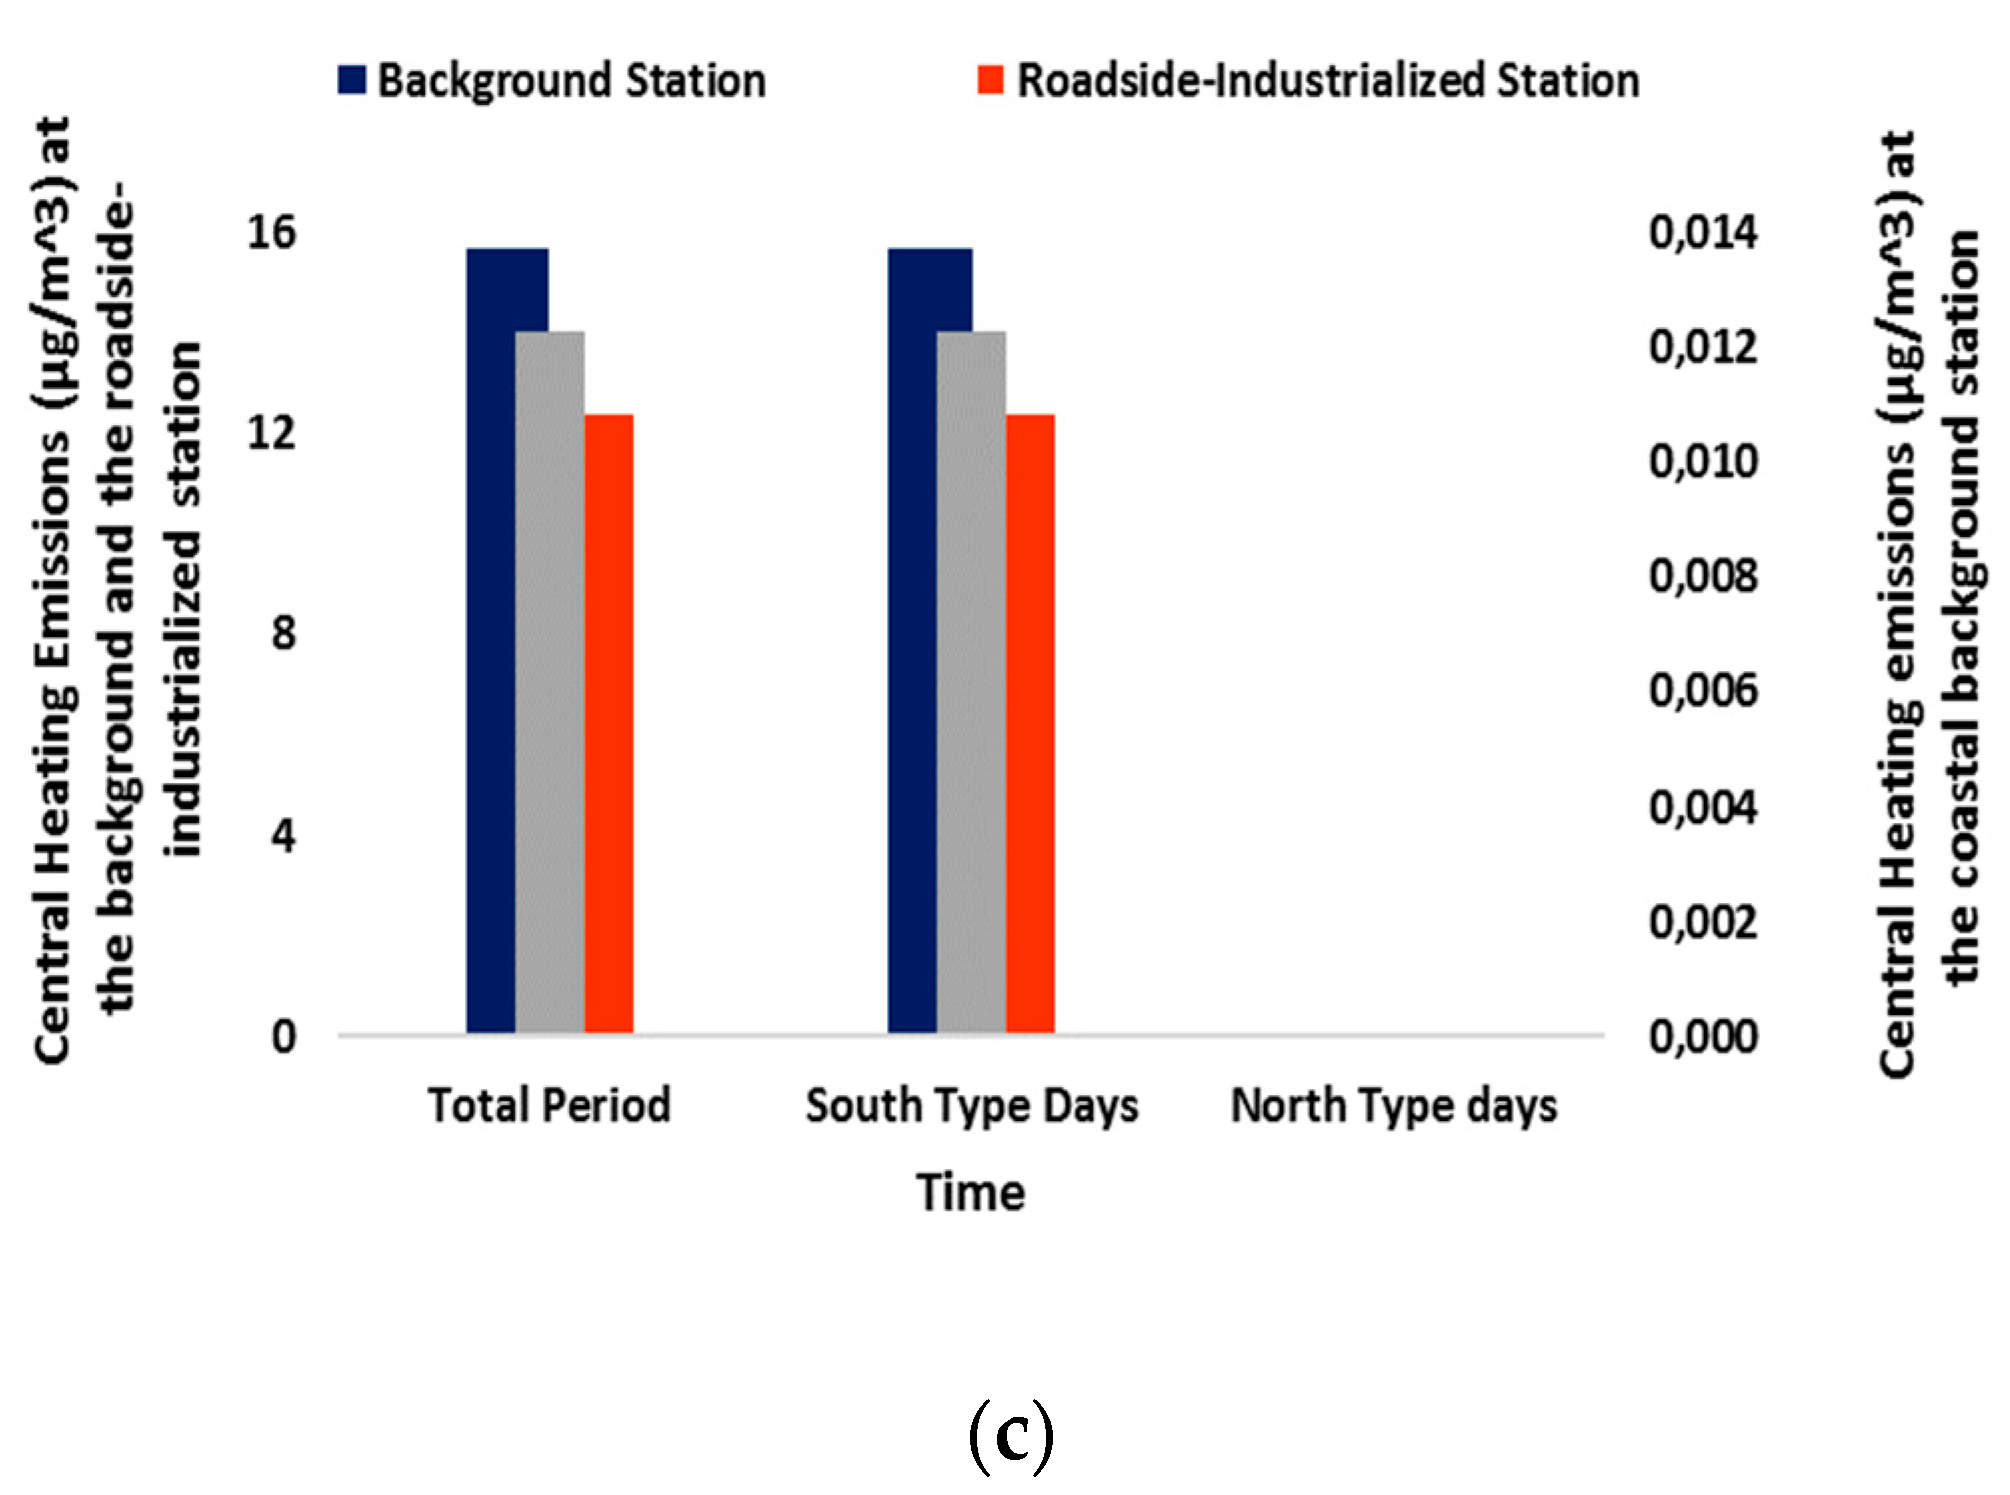
Based on the FEI-GREGAA [24], the recorded PM2.5 load can be mainly attributed to the emissions from the traffic sector with the highest values being registered within the ‘polluted’ roadside-industrialized atmosphere (site 2) and the minimum at the ‘clean’ coastal station (site 3; Figure 2b). In the case of the emissions from the residential heating sector, the peak is also recorded within the basin, but at the background environment (site 1; Figure 2c). The area around the specific sampling point is more densely populated being compared with the other two locations and this could be the explanation. Once again, the minimum for both investigated sectors was recorded at the coastal atmosphere (for the PM2.5 emissions from the traffic sector: site 1/site 3 = 119, site 2/site 3 = 387 and for the PM2.5 emissions from the residential heating sector: site 1/site 3 = 1280, site 2/site 3 = 1010). The absence of stationary sources across the island being combined with the less population and traffic intensity can justify the result.
According to the method of the Diagnostic PAHs’ Ratios (Table 2), the configured profile of the hydrocarbons, without any influence by the type of the environment and/or the size of the particles, was a mixed result of pyrogenic (diesel/gasoline vehicles, petroleum liquid fossil fuel combustion, grass/wood/coal combustion) and petrogenic sources (unburned petroleum). As it is well known, this method is not capable of quantifying the contribution of identified sources. Therefore, it was used the FEI-GREGAA emission inventory. The most significant contribution came from the seasonal source of the residential heating (Figure 3b,c and Figure 4b,c). Among the four quantified congeners, the maximum input was calculated for B[b]F and B[k]F (for traffic and residential heating, respectively) while the minimum was attributed, for both sectors, to B[a]P. The only exception was the residential heating within the roadside-industrialized environment (site 2; IndP).

3.1.3. PM Toxicity

In general, the carcinogenic/ mutagenic potency of both PM2.5 and PM1 fractions was lower than the one presented in other published works [5,18]. Highlighting the importance of the emission sources the roadside-industrialized particles (site 2) were the most carcinogenic and mutagenic (Table 1) being compared with those of the other two locations (sites 1, 3). Of great importance are the lower calculated values of the carcinogenic and mutagenic potential of the background PM2.5 within the basin (site 1) being compared with the one of the coastal atmosphere (site 3). The transportation of the air masses from the ‘polluted’ urban center and longer scale distances being combined with the enhanced emissions owing to the increase of the number of visitors at the island during the summer period, could be the explanation.
Analyzing the individual contribution of the detected hydrocarbons to the total carcinogenicity of the PAHs’ mixture, without any influence by the type of the environment and/or the size of the particles, the maximum contribution has been associated with B[a]P. In the case of the mutagenicity, the obtained picture was more complicated. IndP and B[b]F were the congeners with the highest mutagenic risk within the basin (sites 1 and 2, respectively). At the coastal environment (site 3), the mutagenic potential of PM2.5 and PM1 particles was attributable at B[a]P and B[ghi]P, respectively. As a result, when estimating the potential health risk of the exposure to a mixture of PM-bound PAHs the incorporation of as many hydrocarbons as possible besides B[a]P, is a prerequisite.

3.2. Influence of the Meteorology

3.2.1. PM Mass and PAHs

The average characteristics of the PM mass and the profile of the PAHs during the two different mesoscale wind regimes are listed in Table 3.
Without any dependence on the type of the environment, the concentration levels of PM2.5 and PM1 were obviously elevated during the prevalence of the north flow. For the two inland locations of the basin (sites 1, 2), the obtained picture is not consistent with the typical air pollution scheme of the GAA. Winds blowing from the north sector are usually resulting in lower concentrations within the basin since the characteristic of the specific mesoscale wind regime, the increased velocities, prevent the accumulation of the air pollutants and lead to their dilution [10]. Therefore, the higher recorded PM burden during the specific days, might be ascribed to an increase of the local emission spikes owing to a local ‘event’ or to the transportation of ‘polluted’ air masses from longer scale northward distances. As far as the coastal atmosphere is concerned, overseeing the basin, it was subject not only to intrusions of air masses from the ‘polluted’ urban center but also from regional and large scale distances as well [26,30]. Moreover, the investigated north type days belong to the summertime. Being located just opposite the Athens basin, Aegina is a ‘clever’ destination for summer vacations. Despite the absence of stationary sources in the island, the increase of the local input owing to the increase number of visitors during these days being combined with the increased ship emissions in the harbor might be the key for the enhanced PM levels.
In the case of the polyaromatic hydrocarbons, their profile was differentiated from the one of the particles’ mass. Complying well with the literature [14], the higher concentration values of the specific compounds were recorded during the southward flow. However, the different behavior of the PM mass with the one of the PAHs, strengthens the previous hypothesis for the occurrence of transportation events of air masses from longer (regional/large scale) distances and highlights the determinant role of the external input [14]. The only exception was the coastal PM2.5-bound PAHs. Without any differentiation owing to the type of the environment, the prevailing mesoscale pattern and the size of the airborne particles, the HMW- PAHs was the most prominent group of the hydrocarbons.

3.2.2. Source Identification

Calculating separately the DR’s ratios for each mesoscale wind regime, it came obvious the importance of the simultaneous input from various emission sources for all the three types of environment (Tables S2 and S3). Following the general trend, the obtained PAHs’ profile was a mixed result of both pyrogenic and petrogenic sources. Unfortunately, as it was previously mentioned, the quantification of the contribution of each source is not possible with the specific method.
Based on the FEI-GREGAA, the PM2.5 burden, without any influence by the prevailing mesoscale pattern, was mainly determined by the traffic input. Especially for the north type days, the sector of central heating did not contribute at all (Figure 2b,c). In the case of the quantified PAHs’ burden, the intensity of the emissions from central heating was more significant than the one from traffic during the south flow. However, similarly with the PM2.5 mass, the northward flow was not characterized by input from the central heating sector (Figure 3b,c and Figure 4b,c). B[b]F was mainly traffic originated while B[k]F was mostly associated with the central heating. Of great importance is the minimum for the emissions from both sectors from B[a]P.

3.2.3. PM Toxicity

With the only exception being the coastal PM2.5, the maximum carcinogenic/mutagenic risk was obtained during the prevalence of the south wind regime (Table 3). The determinant role of the transportation of the air masses transportation from the ‘polluted’ south sector (it includes the greater area of Piraeus, an important industrial zone and the main port of Greece) to the northern one, has already been verified for the basin [26,28]. During the southward flow the maximum value of the potential health risk was recorded near the urban center (roadside-industrialized station 2) while in the case of the northward flow, the coastal particles were more toxic.
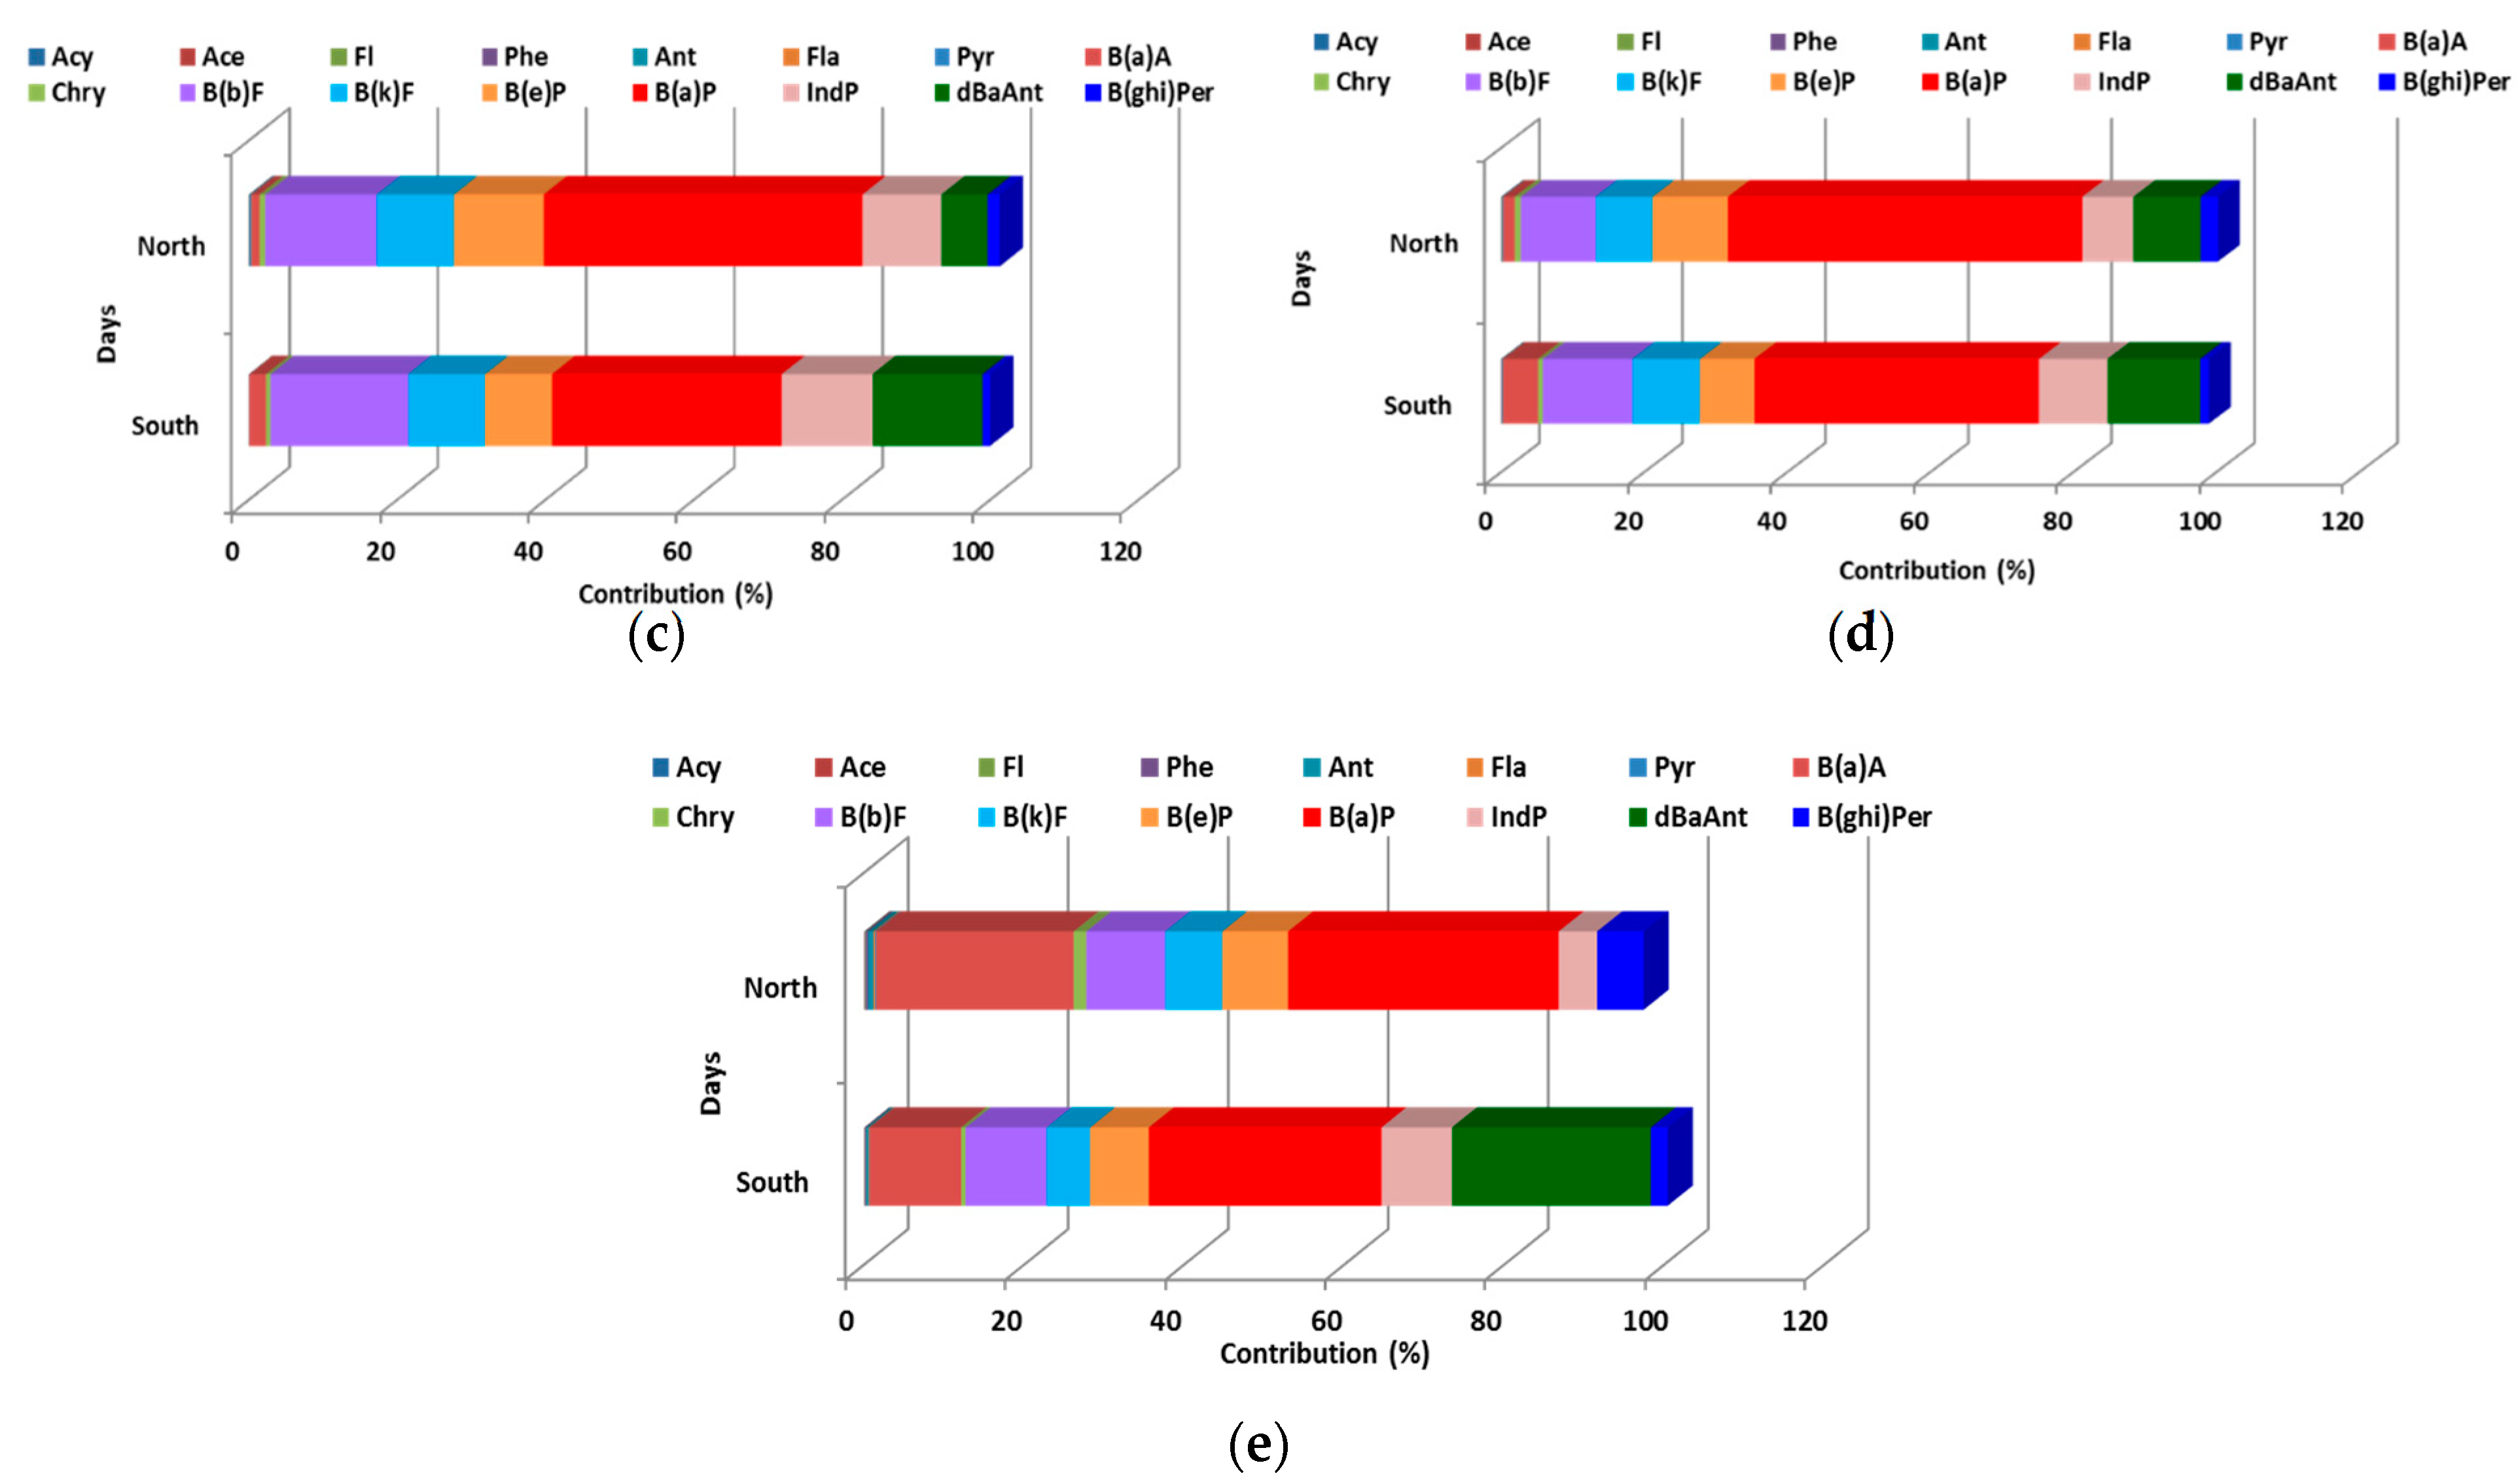
Analyzing the individual contribution of the identified hydrocarbons, without any dependence, B[a]P alone contributed up to 40% and 31% as well as 55% and 42% of the carcinogenicity of the PAHs’ mixture during the south and north type days at PM2.5 and PM1, respectively (Figure 5). The only exception was the background inland station 1 during the northward flow, where B[ghi]P exhibited the highest contribution (40%, Figure 5).
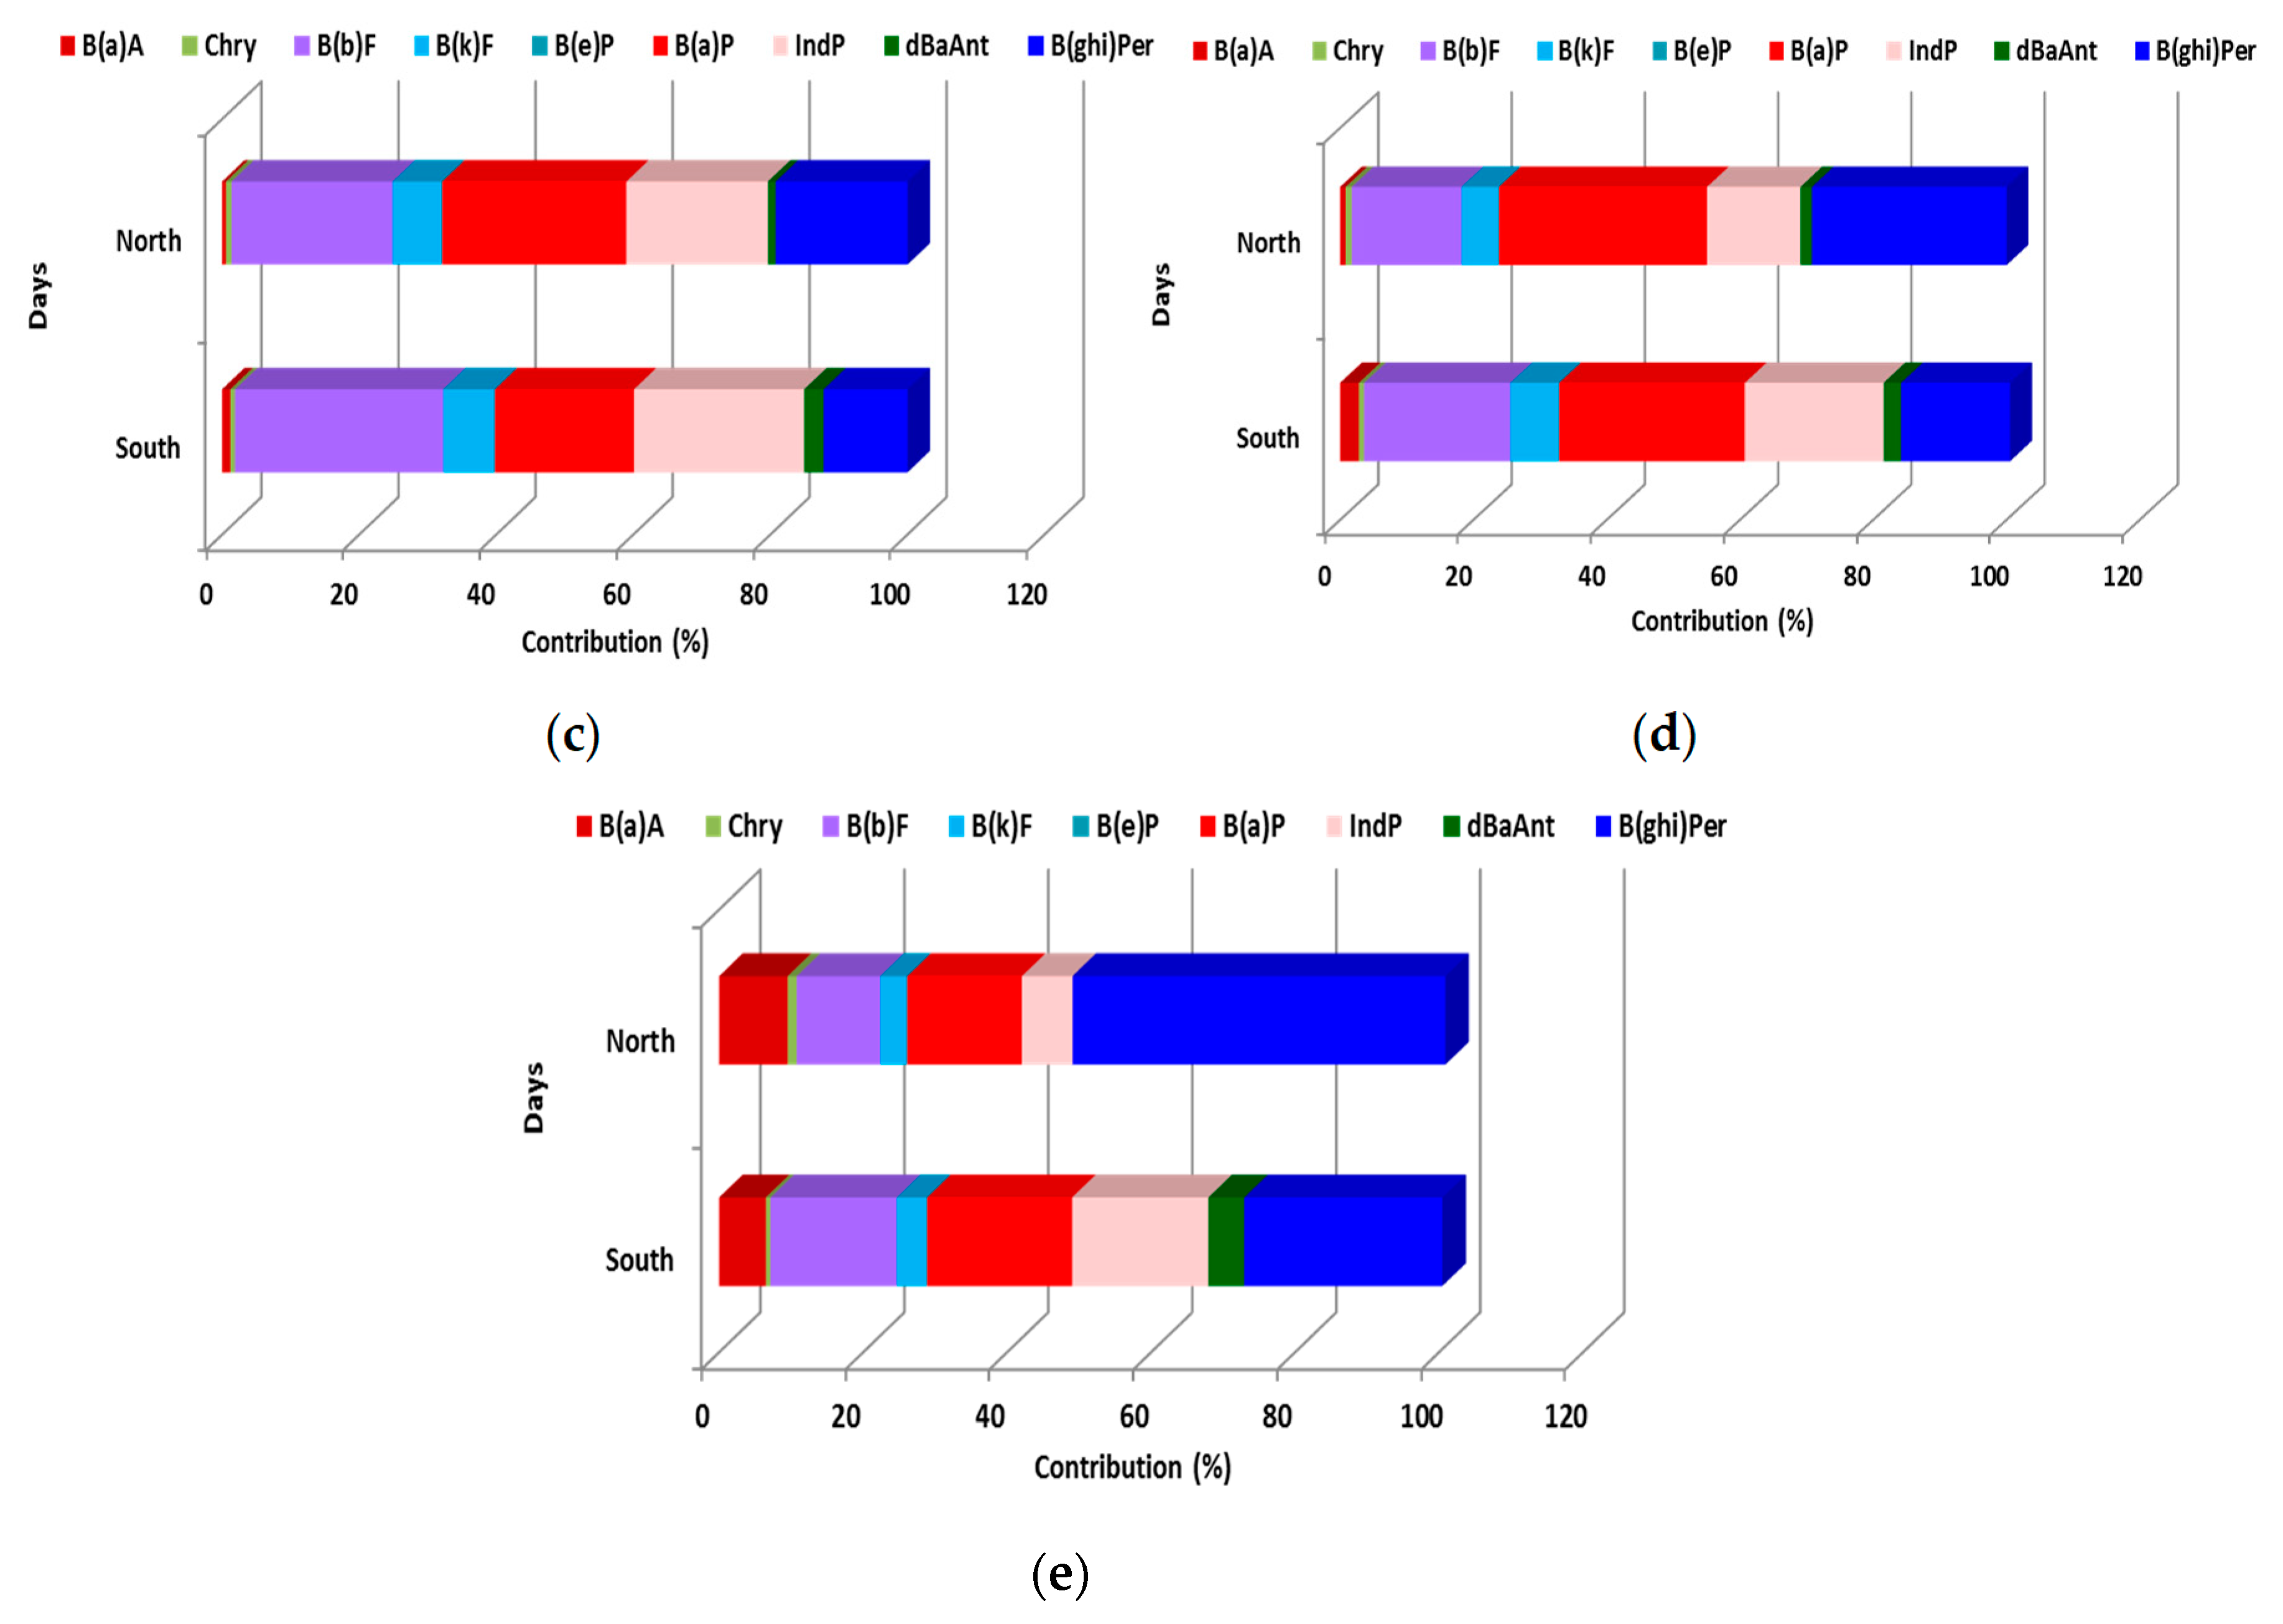
In the case of the possible mutagenic risk, the configured scheme was more complicated (Figure 6). When the wind was blowing from the south, B[a]P occupied the higher rates of the total mutagenic activity at the background atmosphere (sites 1, 3; up to 33% and 28% for PM2.5 and PM1, respectively) while B[b]F was the most significant contributor at the roadside-industrialized environment (site 2; 30% for both fractions). During the north type days, B[ghi]P was the most mutagenic hydrocarbon at PM2.5 of the inland stations (64% and 42% for sites 1 and 2, respectively). B[a]A was determinant for the roadside-industrialized PM1 (site 2; 27%) while in the coastal atmosphere (site 3), B[a]P and B[ghi]P presented the highest mutagenic risk at PM2.5 (44%) and PM1 (51%), respectively.

3.2.4. Special Characteristics of the Selected Days

In an attempt to investigate the existence of a possible relationship/dependence between the configured profile of the fine PM-bound PAHs and the human health risk, each one of the selected days was analyzed separately. Both the meteorological and emissions aspects were taken into consideration.
According to the findings, without any differentiation owing to the type of the environment, the potential toxicity was maximized with the maximization of the PAHs’ budget (intensity of the emissions). The highest value of the carcinogenic/mutagenic risk within the basin (sites 1, 2) was recorded on 20 March 2008 (south type day) and the minimum on 21 July 2008 (north type day). The toxicity of the coastal PM2.5 was maximum on 21 July 2008 while in the case of PM1, on 20 March 2008.
Of great importance is the prevalence of the characteristics of the environment (intensity/variety of the sources) over the prevailing mesoscale wind regime in accordance with the potential health risk. With the only exception being 21 July 2008 when the coastal particles were the most toxic, the highest risk of exposure occurred within the most ‘polluted’ station 2. None a common trend between the dominant hydrocarbon and the compound that contributed more to the toxicity of the PAHs’ mixture was detected. B[a]P presented the highest contribution to the total carcinogenicity of the PAHs’ mixture on 20 March 2008 and 20 July 2008. In the case of the total mutagenicity, a uniform picture was obtained only on 20 July 2008 (B[ghi]P). Interestingly enough, on 21 July 2008 the hydrocarbon with the most significant contribution to the total carcinogenicity was spatially differentiated for both fractions (PM2.5: B[ghi]P, B[b]F, B[a]P for sites 1, 2 and 3, respectively, PM1: B[ghi]P, B[a]A for sites 2 and 3, respectively). According to the FEI-GREGAA, the specific date was characterized by the maximum total emissions for the PM2.5 while the traffic contribution reached its peak for both the particles’ mass and the quantified hydrocarbons. Moreover, it coincides with the minimum potential health risk at all the three types of environment and the minimum PAHs’ budget of the most ‘polluted’ station 2. On 20 March 2008, the total PM2.5 input was minimum while in the case of the quantified hydrocarbons, it was maximized. Additionally, with the only exception being the coastal PM2.5, the toxicity risk reached its peak. It is worthy to note that despite the significant contribution, even only seasonally (winter), of the residential heating to the configured pollution status of the GAA, traffic presented more significant variations (spatial/temporal) and therefore seems to be the key.
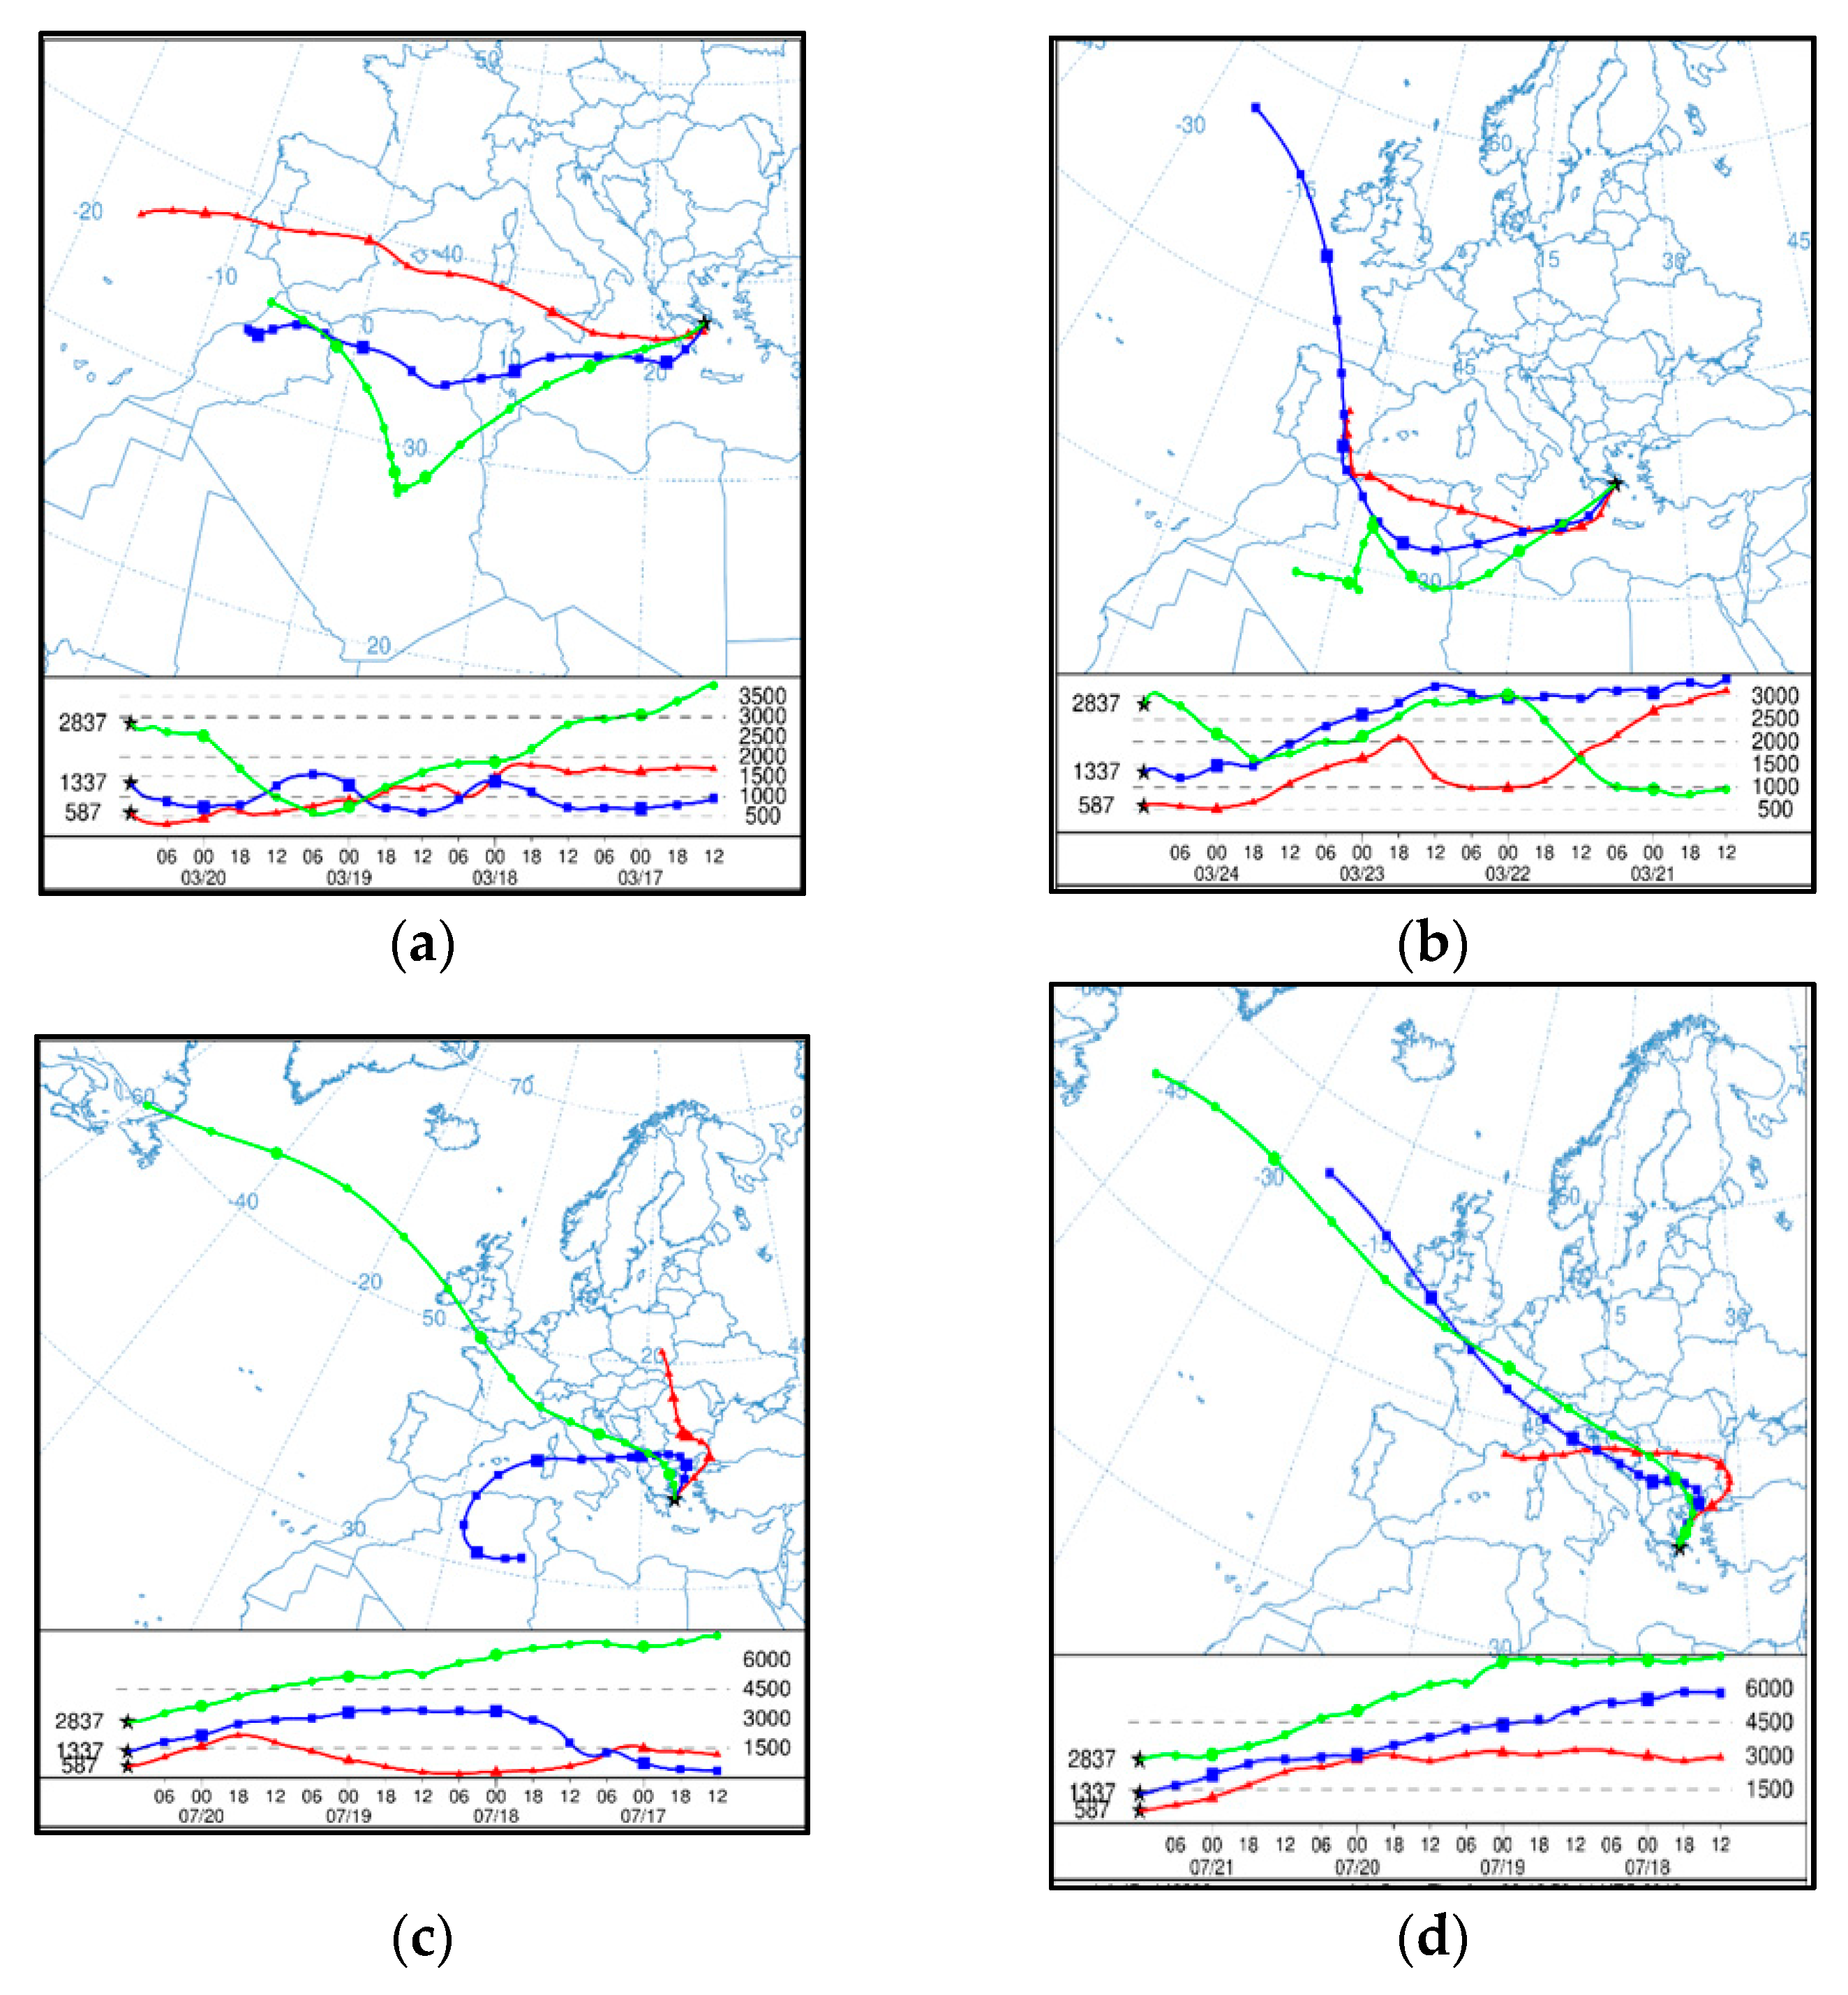
The differentiation of the obtained PM mass’ scheme with the one of the PAHs’ budget illustrates not only the significance of the external input during the transportation of the air masses from longer scale distances but also the importance of the photochemistry for the air pollutants reaching the receptor area. At all the three locations, the PM peaks were recorded on 20 July 2008 while the minimum PM load was obtained on 24 March 2008 (south type day). The existence of the temperature inversion during the specific day did not seem to influence the obtained concentration levels. According to the produced backward trajectories, during the transitional period and the southward flow, on 20 March 2008 (Figure 7a), the main routes through which particulates reach the GAA are the Iberian Peninsula (750 m AMSL) and North Africa (1500, 3000 m AMSL).
A similar picture was observed on 24 March 2008 (Iberian Peninsula and North Africa (750, 1500 m AMSL), North Africa (3000 m AMSL), Figure 7b). It is worthy to note that the atmospheric flows from these areas are a quite common characteristic of this period, giving enhanced PM concentration values [30]. In the case of the prevalence of the north wind regime, on 20 July 2008 (Figure 7c) the airborne particles arrived from the Balkan Peninsula and the Southeast Europe (750 m AMSL) as well as the North Africa and the West-Northwest Europe (1500, 3000 m AMSL). On 21 July 2008 (Figure 7d), the Balkan Peninsula (750, 1500, 3000 m AMSL), the West-Northwest Europe (1500, 3000 m AMSL) as well as the central Europe (3000 m AMSL) contributed to the configured pollution status of the basin. The specific northward pathways are well known for the basin [26].

4. Conclusions

The main objective of the specific work is the investigation of the role of the emission sources and the prevailing mesoscale wind regimes on the configuration of the PM2.5 and PM1-bound PAHs’ profile and their potential health risk. The measurements took place simultaneously within three different types of environment of an urban Mediterranean area, the Athens Basin, during the prevalence of the two characteristic for the region mesoscale wind regimes. The northward and the southward flow.
The main findings can be summarized as follows:
  • The obtained pollution scheme was a mixed result of the simultaneous exposure to a variety of pyrogenic and petrogenic sources;
  • The characteristics of the environment and the intensity of the emissions were the critical points for the enhanced recorded concentration levels;
  • As it is clearly illustrated from the FEI-GREGAA emission inventory, the traffic input was determinant for the quantified PM2.5 mass load while in the case of the PAHS’ budget, the key was the residential heating sector;
  • The group of the HMW-PAHs, mainly originated from combustion processes, was predominant in both PM2.5 and PM1 fractions;
  • In the case of the toxicity of the PAHs’ mixture, the peak was registered, as it was expected, at the most multi-impacted location. However, highlighting the particular importance of the configured characteristics of the air masses arriving to a receptor area from regional/large scale distances, especially for the background locations, the coastal PM2.5 were more carcinogenic/ mutagenic than the one of the background environment within the basin;
  • The obtained carcinogenic schemes were differentiated not only with the mutagenic one but also between the two fractions. More complicated was the configured pattern of the mutagenic potency;
  • None a common trend was detected between the dominant hydrocarbon and the congener that contributed more to the potential risk of the PAHs’ mixture. Therefore, the incorporation of as many hydrocarbons as possible besides B[a]P, is a prerequisite.
Based on the above, future integrated modelling and measurement works considering the PAHS budget within fine particles are of great importance in order to clarify, in various spatial and temporal scales during multiple conditions (pollution, meteorological), the key factors for the relationship between the chemical characteristics of the PM profile and their potential toxicity. A more extensive field campaign in both spatial and temporal scales, a further analysis of the emissions originated from traffic and the quantification of the input from the diesel vehicles versus the one of the gasoline, the inclusion of other sectors, the quantification of the local input versus the external one as well as the investigation of the link between the incidence of different backward trajectories and their impact on health might give a more detailed explanation of the obtained PM scheme.

Supplementary Materials

The following are available online at https://www.mdpi.com/2073-4433/10/10/622/s1, Figure S1: Daily variation of the wind speed (m/sec) at the sampling stations on (a) 20 March 2008, (b) 24 March 2008, (c) 20 July 2008 and (d) 21 July 2008, Figure S2: Hourly differentiation of the wind direction on (a) 20 March 2008 and (b) 24 March 2008 at the three sampling stations, Figure S3: Hourly differentiation of the wind direction on (a) 20 July 2008 and (b) 21 July 2008 at the three sampling stations, Figure S4: The vertical profile of temperature on 3LT on (a) 20 March 2008, (b) 24 March 2008, (c) 20 July 2008 and (d) 21 July 2008, Figure S5: The vertical profile of temperature on 15LT on (a) 20 March 2008 and (b) 24 March 2008, Table S1: Values of the limit of detection (LOD), the limit of quantitation (LOQ) and the expanded uncertainty at 95% confidence level and k = 2 that has been estimated experimentally (Uexp) for each detected polyaromatic hydrocarbon, Table S2: Diagnostic Ratios for the South Type Days, Table S3: Diagnostic Ratios for the South Type Days.

Author Contributions

The study was completed with cooperation between all authors. Conceptualization, S.P.; data curation, S.P., K.-M.F. and A.B.; methodology, S.P., K.-M.F., A.B. and T.M.; software, S.P., K.-M.F. and V.A.; supervision, V.A. and N.M.; writing—original draft, S.P. and K.-M.F.; writing—review and editing, S.P. and K.-M.F.

Funding

The study was supported by the project THESPIA II (MIS 5002517), EU NSRF 2014-2020.

Acknowledgments

The authors would like to thank the National Observatory of Athens and the Hellenic National Meteorological Service for the provision of the meteorological data.

Conflicts of Interest

The authors declare no conflict of interest.

References

  1. Amodio, M.; Caselli, M.; de Gennaro, G.; Tutino, M. Particulate PAHs in two urban areas of Southern Italy: Impact of the sources, meteorological and background conditions on air quality. Environ. Res. 2009, 109, 812–820. [Google Scholar] [CrossRef] [PubMed]
  2. Dubey, J.; Kumari, K.M.; Lakhani, A. Chemical characteristics and mutagenic activity of PM2.5 at a site in the Indo-Gangetic plain, India. Ecotoxicol. Environ. Saf. 2015, 114, 75–83. [Google Scholar] [CrossRef] [PubMed]
  3. Hanedar, A.; Alp, K.; Kaynak, B.; Baek, J.; Avsar, E.; Odman, M.T. Concentrations and sources of PAHs at three stations in Istanbul, Turkey. Atmos. Res. 2011, 99, 391–399. [Google Scholar] [CrossRef]
  4. Anastasopoulos, A.T.; Wheeler, A.J.; Karman, D.; Kulka, R.H. Intraurban concentrations, spatial variability and correlation of ambient polycyclic aromatic hydrocarbons (PAH) and PM2.5. Atmos. Environ. 2012, 59, 272–283. [Google Scholar] [CrossRef]
  5. Khan, M.F.; Latif, M.T.; Lim, C.H.; Amil, N.; Jaafar, S.A.; Dominick, D.; Nadzir, M.S.M.; Sahani, M.; Tahir, N.M. Seasonal effect and source apportionment of polycyclic aromatic hydrocarbons in PM2.5. Atmos. Environ. 2015, 106, 178–190. [Google Scholar] [CrossRef]
  6. Guzman-Torres, D.; Eiguren-Fernández, A.; Cicero-Fernández, P.; Maubert-Franco, M.; Retama-Hernández, A.; Villegas, R.R.; Miguel, A.H. Effects of meteorology on diurnal and nocturnal levels of priority polycyclic aromatic hydrocarbons and elemental and organic carbon in PM10 at a source and a receptor area in Mexico City. Atmos. Environ. 2009, 43, 2693–2699. [Google Scholar] [CrossRef]
  7. Hong, H.S.; Yin, H.L.; Wang, X.H.; Ye, C.X. Seasonal variation of PM10-bound PAHs in the atmosphere of Xiamen, China. Atmos. Res. 2007, 85, 429–441. [Google Scholar] [CrossRef]
  8. Hanedar, A.; Alp, K.; Kaynak, B.; Avşar, E. Toxicity evaluation and source apportionment of Polycyclic Aromatic Hydrocarbons (PAHs) at three stations in Istanbul, Turkey. Sci. Total Environ. 2014, 488, 437–446. [Google Scholar] [CrossRef]
  9. Akyuz, M.; Cabuk, H. Meteorological variations of PM2.5/PM10 concentrations and particle-associated polycyclic aromatic hydrocarbons in the atmospheric environment of Zonguldak, Turkey. J. Hazard. Mater. 2009, 170, 13–21. [Google Scholar] [CrossRef]
  10. Amador-Munoz, O.; Bazán-Torija, S.; Villa-Ferreira, S.A.; Villalobos-Pietrini, R.; Bravo-Cabrera, J.L.; Munive-Colín, Z.; Hernández-Mena, L.; Saldarriaga-Norena, H.; Murillo-Tovar, M.A. Opposing seasonal trends for polycyclic aromatic hydrocarbons and PM10: Health risk and sources in southwest Mexico City. Atmos. Res. 2013, 122, 199–212. [Google Scholar] [CrossRef]
  11. He, J.; Fan, S.; Meng, Q.; Sun, Y.; Zhang, J.; Zu, F. Polycyclic aromatic hydrocarbons (PAHs) associated with fine particulate matters in Nanjing, China: Distributions, sources and meteorological influences. Atmos. Environ. 2014, 89, 207–215. [Google Scholar] [CrossRef]
  12. Kassomenos, P.; Flocas, H.A.; Lykoudis, S.; Petrakis, M. Analysis of Mesoscale Patterns in Relation to Synoptic Conditions over an Urban Mediterranean Basin. Theor. Appl. Climatol. 1998, 59, 215–229. [Google Scholar] [CrossRef]
  13. Pateraki, S.; Maggos, T.; Michopoulos, J.; Flocas, H.A.; Asimakopoulos, D.N.; Vasilakos, C. Ions species size distribution in particulate matter associated with VOCs and meteorological conditions over an urban region. Chemosphere 2008, 72, 496–503. [Google Scholar] [CrossRef] [PubMed]
  14. Pateraki, S.; Asimakopoulos, D.N.; Bougiatioti, A.; Maggos, T.; Vasilakos, C.; Mihalopoulos, N. Assessment of PM2.5 and PM1 chemical profile in a multiple-impacted Mediterranean urban area: Origin, Sources and Meteorological dependence. Sci. Total Environ. 2014, 479, 210–220. [Google Scholar] [CrossRef] [PubMed]
  15. Fameli, K.M.; Assimakopoulos, V.D. Development of a road transport emission inventory for Greece and the Greater Athens Area: Effects of important parameters. Sci. Total Environ. 2015, 505, 770–786. [Google Scholar] [CrossRef] [PubMed] [Green Version]
  16. Mantas, E.; Remoundaki, E.; Halari, I.; Kassomenos, P.; Theodosi, C.; Hatzikioseyian, A.; Mihalopoulos, N. Mass closure and source apportionment of PM2.5 by Positive Matrix Factorization analysis in urban Mediterranean environment. Atmos. Environ. 2014, 94, 154–163. [Google Scholar] [CrossRef]
  17. Andreou, G.; Rapsomanikis, S. Polycyclic aromatic hydrocarbons and their oxygenated derivatives in the urban atmosphere of Athens. J. Hazard. Mater. 2009, 172, 363–373. [Google Scholar] [CrossRef]
  18. Pateraki, S.; Bairachtari, K.; Kantarelou, V.; Manousakas, M.-I.; Eleftheriadis, K.; Vasilakos, C.; Assimakopoulos, V.D.; Maggos, T. The traffic signature on the vertical profile of different sized particles in an urban roadside environment. Sci. Total Environ. 2019, 646, 448–459. [Google Scholar] [CrossRef]
  19. Mandalakis, M.; Τsapakis, M.; Τsoga, A.; Stephanou, E.G. Gas–particle concentrations and distribution of aliphatic hydrocarbons, PAHs, PCBs and PCDD/Fs in the atmosphere of Athens (Greece). Atmos. Environ. 2002, 36, 4023–4403. [Google Scholar] [CrossRef]
  20. Sitaras, I.E.; Bakeas, E.B.; Siskos, P.A. Gas/particle partitioning of seven volatile polycyclic aromatic hydrocarbons in a heavy traffic urban area. Sci. Total Environ. 2004, 327, 249–264. [Google Scholar] [CrossRef]
  21. Vasilakos, C.; Levi, N.; Maggos, T.; Hatzianestis, J.; Michopoulos, J.; Helmis, C. Gas–particle concentration and characterization of sources of PAHs in the atmosphere of a suburban area in Athens, Greece. J. Hazard. Mater. 2007, 140, 45–51. [Google Scholar] [CrossRef] [PubMed]
  22. Mantis, J.; Chaloulakou, A.; Samara, C. PM10-bound polycyclic aromatic hydrocarbons (PAHs) in the Greater Area of Athens, Greece. Chemosphere 2005, 59, 593–604. [Google Scholar] [CrossRef] [PubMed]
  23. Valavanidis, A.; Fiotakis, K.; Vlahogianni, T.; Bakeas, E.B.; Triantafillaki, S.; Paraskevopoulou, V.; Dassenakis, M. Characterization of atmospheric particulates, particle-bound transition metals and polycyclic aromatic hydrocarbons of urban air in the centre of Athens (Greece). Chemosphere 2006, 65, 760–768. [Google Scholar] [CrossRef] [PubMed]
  24. Fameli, K.M.; Assimakopoulos, V.D. The new open Flexible Emission Inventory for Greece and the Greater Athens Area (FEI-GREGAA): Account of pollutant sources and their importance from 2006 to 2012. Atmos. Environ. 2016, 137, 17–37. [Google Scholar] [CrossRef]
  25. Kalabokas, P.D.; Adamopoulos, A.D.; Viras, L.G. Atmospheric PM10 particle concentration measurements at central and peripheral urban sites in Athens and Thessaloniki, Greece. Glob. NEST J. 2010, 12, 71–83. [Google Scholar]
  26. Pateraki, S.; Asimakopoulos, D.N.; Sciare, J.; Maggos, T.; Vlachogiannis, D.; Gounaris, N.; Karozis, S.; Sfetsos, A.; Vasilakos, C. Particles number and concentration patterns in the coastal area of Aegina, Athens. Fresenius Environ. Bull. 2012, 21, 3189–3197. [Google Scholar]
  27. Pateraki, S.; Asimakopoulos, D.N.; Maggos, T.; Vasilakos, C. Particulate Matter Levels in a suburban Mediterranean Area: Analysis of a 53 months long Experimental Campaign. J. Hazard. Mater. 2010, 182, 801–811. [Google Scholar] [CrossRef]
  28. Pateraki, S.; Assimakopoulos, V.D.; Bougiatioti, A.; Kouvarakis, G.; Mihalopoulos, N.; Vasilakos, C. Carbonaceous and ionic compositional patterns of fine particles over an urban Mediterranean area. Sci. Total Environ. 2012, 424, 251–263. [Google Scholar] [CrossRef]
  29. Kassomenos, P.; Kotroni, V.; Kallos, S. Analysis of climatological and air-quality observations from Greater Athens Area. Atmos. Environ. 1995, 29, 3671–3688. [Google Scholar] [CrossRef]
  30. Pateraki, S.; Assimakopoulos, V.D.; Maggos, T.; Fameli, K.-M.; Kotroni, V.; Vasilakos, C. Particulate Matter Pollution over a Mediterranean Urban Area. Sci. Total Environ. 2013, 463, 508–524. [Google Scholar] [CrossRef]
  31. Choi, S.-D.; Ghim, Y.S.; Lee, J.Y.; Kim, J.Y.; Kim, Y.P. Factors affecting the level and pattern of polycyclic aromatic hydrocarbons (PAHs) at Gosan, Korea during a dust period. J. Hazard. Mater. 2012, 227, 79–87. [Google Scholar] [CrossRef] [PubMed]
  32. Vu, V.-T.; Lee, B.-K.; Kim, J.-T.; Lee, C.-H.; Kim, I.-H. Assessment of carcinogenic risk due to inhalation of polycyclic aromatic hydrocarbons in PM10 from an industrial city: A Korean case-study. J. Hazard. Mater. 2011, 189, 349–356. [Google Scholar] [CrossRef] [PubMed]
  33. Nisbet, I.C.T.; Lagoy, P.K. Toxic Equivalency Factors (TEFs) for Polycyclic Aromatic Hydrocarbons (PAHs). Regul. Toxicol. Pharmacol. 1992, 16, 290–300. [Google Scholar] [CrossRef]
  34. Malcolm, H.M.; Dobson, S. The Calculation of an Environmental Assessment Level (EAL) for Atmospheric PAHs Using Relative Potencies; HMIP-Commissioned Research, Department of the Environment: London, UK, 1994. [Google Scholar]
  35. Durant, J.L.; Busby, W.F., Jr.; Lafleur, A.L.; Penman, B.W.; Crespi, C.L. Human cell mutagenicity of oxygenated, nitrated and unsubstituted polycyclic aromatic hydrocarbons associated with urban aerosols. Mutat. Res. 1996, 371, 123–157. [Google Scholar] [CrossRef]
  36. Ravindra, K.; Bencs, L.; Wauters, E.; de Hoog, J.; Deutschd, F.; Roekens, E.; Bleuxd, N.; Berghmans, P.; Van Grieken, R. Seasonal and site-specific variation in vapour and aerosol phase PAHs over Flanders (Belgium) and their relation with anthropogenic activities. Atmos. Environ. 2006, 40, 771–785. [Google Scholar] [CrossRef] [Green Version]
  37. Ravindra, K.; Wautersc, E.; Van Griekenb, R. Variation in particulate PAHs levels and their relation with the transboundary movement of the air masses. Sci. Total Environ. 2008, 396, 100–110. [Google Scholar] [CrossRef] [Green Version]
  38. Esen, F.; Tasdemir, Y.; Vardar, N. Atmospheric concentrations of PAHs, their possible sources and gas-to-particle partitioning at a residential site of Bursa, Turkey. Atmos. Res. 2008, 88, 243–255. [Google Scholar] [CrossRef]
  39. Gupta, S.; Kumar, K.; Srivastava, A.; Srivastava, A.; Jain, V.K. Size distribution and source apportionment of polycyclic aromatic hydrocarbons (PAHs) in aerosol particle samples from the atmospheric environment of Delhi, India. Sci. Total Environ. 2011, 409, 4674–4680. [Google Scholar] [CrossRef]
  40. Jamhari, A.A.; Sahani, M.; Latif, M.T.; Chan, K.M.; Tan, H.S.; Khan, M.F.; Tahir, N.M. Concentration and source identification of polycyclic aromatic hydrocarbons (PAHs) in PM10 of urban, industrial and semi-urban areas in Malaysia. Atmos. Environ. 2014, 86, 16–27. [Google Scholar] [CrossRef]
  41. Duan, J.; Tan, J.; Wang, S.; Chai, F.; He, K.; Hao, J. Roadside, Urban, and Rural comparison of size distribution characteristics of PAHs and carbonaceous components of Beijing, China. J. Atmos. Chem. 2012, 69, 337–349. [Google Scholar] [CrossRef]
  42. Feng, B.; Li, L.; Xu, H.; Wang, T.; Wu, R.; Chen, J.; Zhang, Y.; Liu, S.; Ho, S.S.H.; Cao, J.; et al. PM2.5-bound polycyclic aromatic hydrocarbons (PAHs) in Beijing: Seasonal variations, sources, and risk assessment. J. Environ. Sci. 2019, 77, 11–19. [Google Scholar] [CrossRef] [PubMed]
  43. Ding, X.; Wang, X.-M.; Xie, Z.-Q.; Xiang, C.-H.; Mai, B.-X.; Sun, L.-G.; Zheng, M.; Sheng, G.-Y.; Fu, J.-M.; Poschl, U. Atmospheric polycyclic aromatic hydrocarbons observed over the North Pacific Ocean and the Arctic area: Spatial distribution and source identification. Atmos. Environ. 2007, 41, 2061–2072. [Google Scholar] [CrossRef]
  44. Manoli, E.; Kouras, A.; Samara, C. Profile analysis of ambient and source emitted particle-bound polycyclic aromatic hydrocarbons from three sites in northern Greece. Chemosphere 2004, 56, 867–878. [Google Scholar] [CrossRef] [PubMed]
  45. Chen, H.-Y.; Teng, H.-G.; Wang, J.-S. Source apportionment of polycyclic aromatic hydrocarbons (PAHs) in surface sediments of the Rizhao coastal area (China) using diagnostic ratios and factor analysis with nonnegative constraints. Sci. Total Environ. 2012, 414, 293–300. [Google Scholar] [CrossRef] [PubMed]
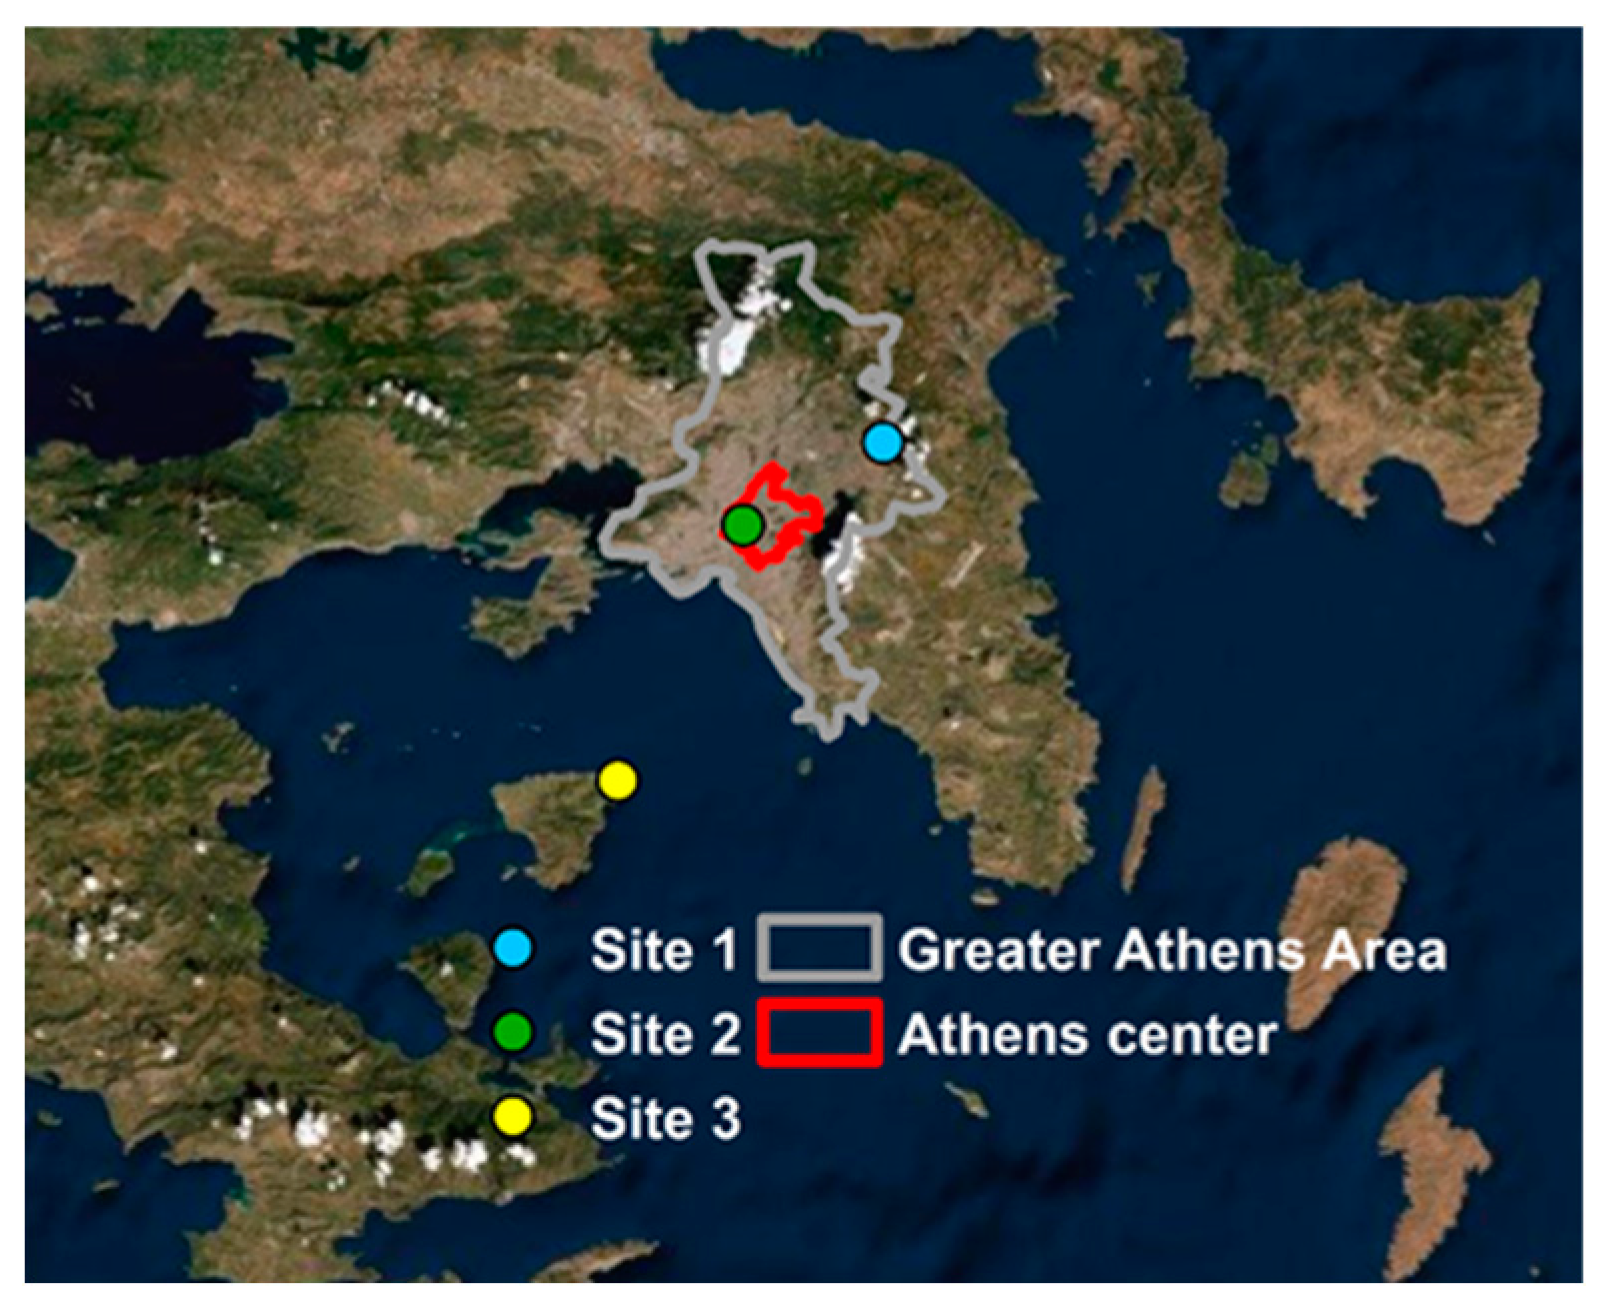
Figure 1. Map of the Greater Athens Area (GAA) and location of the three sampling stations.
Atmosphere 10 00622 g001
Figure 2. Spatial and Temporal differentiation of the average (a) total, (b) traffic and (c) central heating PM2.5 emissions.
Atmosphere 10 00622 g002aAtmosphere 10 00622 g002b
Figure 3. Spatial and Temporal differentiation of the average B[a]P, B[b]F, B[k]F and IndP emissions from the (a) traffic and residential heating sector, (b) traffic sector and (c) central heating sector at the background and the roadside-industrialized station.
Atmosphere 10 00622 g003
Figure 4. Spatial and Temporal differentiation of the average B[a]P, B[b]F, B[k]F and IndP emissions from the (a) traffic and residential heating sector, (b) traffic sector and (c) central heating sector at the coastal background station.
Atmosphere 10 00622 g004
Figure 5. Spatial and temporal differentiation of the average individual contribution of the (a) PM2.5 bound PAHs of the background environment, (b) PM2.5 bound PAHs of the roadside-industrialized environment, (c) PM1 bound PAHs of the roadside industrialized environment, (d) PM2.5 bound PAHs of the coastal background environment, and (e) PM1- bound PAHs of the coastal background environment to the total carcinogenic potency of the PAHs mixture.
Atmosphere 10 00622 g005aAtmosphere 10 00622 g005b
Figure 6. Spatial and temporal differentiation of the average individual contribution of the (a) PM2.5 bound PAHs of the background environment, (b) PM2.5 bound PAHs of the roadside-industrialized environment, (c) PM1 bound PAHs of the roadside industrialized environment, (d) PM2.5 bound PAHs of the coastal background environment, and (e) PM1- bound PAHs of the coastal background environment to the total mutagenic potency of the PAHs mixture.
Atmosphere 10 00622 g006aAtmosphere 10 00622 g006b
Figure 7. Four-day kinematic back trajectories arriving at 750, 1500 and 3000 m at the GAA on (a) 20 March 2008, (b) 24 March 2008, (c) 20 July 2008 and (d) 21 July 2008.
Atmosphere 10 00622 g007
Table 1. Average characteristics of the PM mass and the PM -bound PAHs during the total period.
PM2.5PM1
StationBackgroundRoadside-IndustrializedCoastal BackgroundRoadside-IndustrializedCoastal Background
μg/m3PM Mass28.829.125.721.816.9
ng/m3Acy0.0060.0070.0050.0050.004
Ace0.0080.0050.0060.0030.004
Fl0.0130.0070.0100.0050.007
Phe0.0460.0440.0610.0290.028
2-MePhe0.0100.0120.0180.0080.006
1-MePhe0.0070.0070.0100.0040.004
3,6-dMePhe0.0040.0030.0070.0030.003
Ant0.0040.0060.0080.0040.005
Fla0.0240.0340.0510.0260.015
Pyr0.0220.0340.0540.0250.011
BaA0.0250.0330.0230.0230.020
Chry0.0360.1060.0740.0690.011
B[b]F0.0660.3160.1000.2540.013
B[k]F0.0350.2240.0760.1430.008
B[e]P0.0370.1830.0890.1270.010
B[a]P0.0150.0600.0430.0440.004
Per0.0130.0230.0280.0180.014
IndP0.0880.2890.0710.1680.012
dBaAnt0.0040.0350.0080.0200.004
B[ghi]Per0.0810.2270.1920.1130.042
ΣPAHs0.4301.5590.9280.9010.212
PAHsEPA0.3711.3310.7790.8180.176
3-ring 0.0920.0910.1200.0610.057
4-ring 0.1080.2070.2020.1430.054
5-ring 0.1240.7910.3360.4430.049
6-ring 0.1060.4710.2700.2540.052
LMW 0.0920.0910.1200.0610.057
MMW 0.1080.2070.2020.1430.054
HMW 0.2301.2610.6060.6970.101
PAHsComb0.3221.4180.7730.8080.139
ΣB[a]PTEQ0.0460.2030.0900.1370.015
ΣB[a]PMEQ0.0820.3110.1400.2050.023
Table 2. Diagnostic Ratios of the PAHs for the total period.
PM2.5PM1
DRsIndicator SourcesBackgroundRoadside-IndustrializedCoastal BackgroundRoadside-IndustrializedCoastal Background
Ant/Phe + Ant 1<0.1 petrogenic 1
>0.1 pyrogenic 1
0.070.290.110.130.11
B[a]P/B[ghi]Per 1<0.6 traffic 1
>0.6 non traffic 1
0.170.210.240.270.13
B[a]A/B[a]A + Chry 2<0.2 unburned petreleum (petrogenic) 2
>0.35 pyrogenic 2
0.2–0.35 mixture of both 2
0.350.190.170.190.41
B[a]P/B[a]P + Chry 3<0.5 diesel vehicles 3
>0.5 gasoline vehicles 3
0.170.330.280.310.26
B[b]F/B[k]F 4>0.5 diesel vehicles 41.751.411.311.751.63
Fla/Fla + Pyr 5,6>0.50 grass/wood/coal combustion 5
0.42–0.53 road dust 6
0.500.490.530.510.55
IndP/IndP + B[ghi]Per 3,5<0.2 unburned petroleum (petrogenic) 5
0.2–0.5 petroleum (liquid fossil fuel) combustion 5
>0.5 grass/wood/coal combustion 5
0.2–0.5 petroleum source 3
0.35–0.7 diesel vehicles 3
0.480.440.320.480.20
Fl/Fl + Pyr 7>0.5 diesel vehicles 7
<0.5 gasoline vehicles 7
0.380.200.230.250.35
Phe/Ant &Fla/Pyr 8<10 & >1 pyrogenic 8
>10 & <1 petrogenic 8
10.3 &1.067.67 & 0.969.04 &1.127.13 & 1.049.20 & 1.23
1 Jamhari et al. [40], 2 Duan et al. [41], 3 Feng et al. [42], 4 Ravindra et al. [37], 5 Ding et al. [43], 6 Manoli et al. [44], 7 Ravindra et al. [36], 8 Chen et al. [45].
Table 3. Average spatial and temporal differentiation of the characteristics of the PM mass and the PAHs’ profile.
PM2.5PM1
ConcentrationTypeBackgroundRoadside-IndustrializedCoastal BackgroundRoadside-IndustrializedCoastal Background
μg/m3PM MassSouth24.222.415.016.17.87
North33.435.936.427.626.0
ng/m3ΣPAHsSouth0.5982.7270.4791.6260.240
North0.2620.3911.3770.1760.184
PAHsEPASouth0.5122.3290.3971.4050.193
North0.2300.3331.1600.2300.158
3-ringSouth0.0870.0890.0790.0810.063
4-ring0.1470.3260.0990.2480.056
5-ring0.2241.4940.1870.8320.064
6-ring0.1410.8190.1140.4650.056
3-ringNorth0.0970.0930.1620.0400.051
4-ring0.0680.0880.3050.0380.051
5-ring0.0250.0880.4850.0540.034
6-ring0.0720.1220.4260.0440.048
LMWSouth0.0870.0890.0790.0810.063
MMW0.1470.3260.0990.2480.056
HMW0.3642.3120.3011.2970.120
LMWNorth0.0970.0930.1620.0400.051
MMW0.0680.0880.3050.0380.051
HMW0.0970.2100.9110.0980.082
PAHsCombSouth0.4882.5540.3711.4930.156
North0.1550.2821.1760.1230.122
ΣB[a]PTEQSouth0.0720.3260.0490.1970.018
North0.0170.0270.1330.0200.008
ΣB[a]PMEQSouth0.1090.5010.0700.3010.026
North0.0210.0510.2110.0320.017