Assessment of CMIP5 Models Based on the Interdecadal Relationship between the PDO and Winter Temperature in China

Abstract
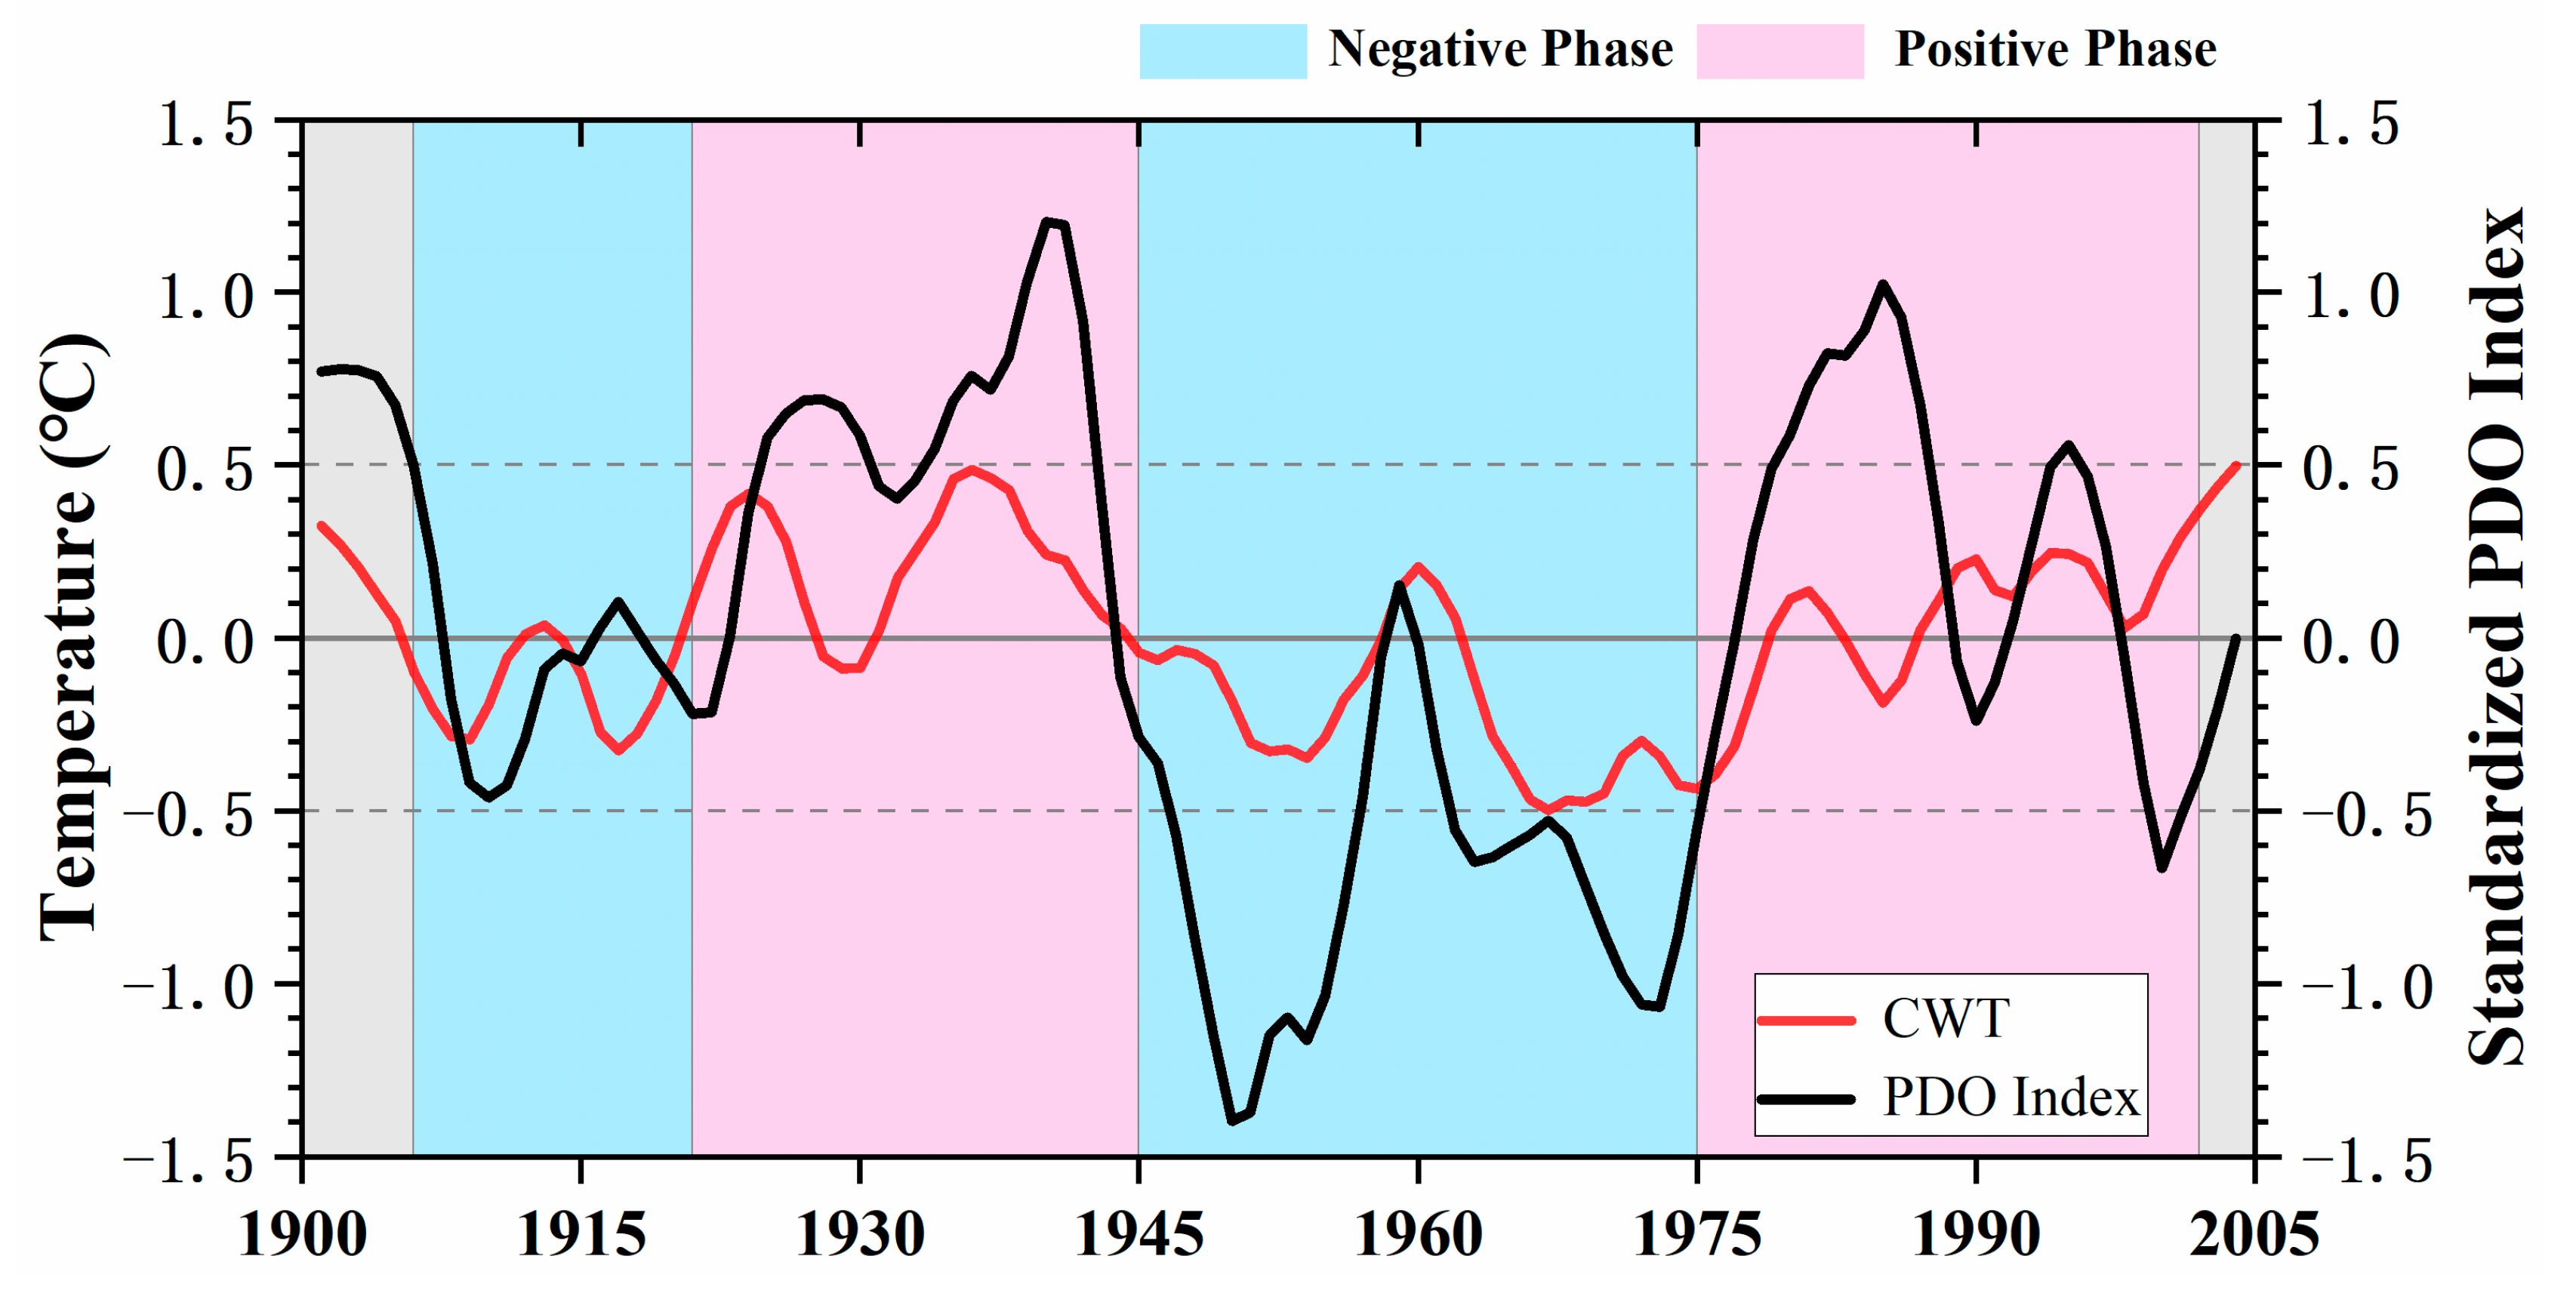
:1. Introduction
2. Data and Methodology
2.1. Data
2.2. Methodology
3. Analysis of the PDO-CWT Simulation
3.1. Simulation of the PDO by the CMIP5 Models
3.2. PDO-CWT Teleconnection
4. Possible Mechanisms Underlying the PDO and CWT
4.1. Relationship between the PDO and Atmospheric Circulation Systems
4.2. Variation of the Atmospheric Circulation Systems in Different Phases of the PDO
5. Conclusions and Discussion
- The HadISST and CMIP5 SST biases show that the wintertime average SST deviation is −4–4°C. Most models overestimate SSTs by 2–4 °C in the region north of 40° N and underestimate SSTs by 1–3 °C in the region of 40° N. Several CMIP5 models have a good effect in simulating the average SST over the northern Pacific region.
- Zhang et al.’s [33] method was adopted to calculate the PDO index. The PDO time series of most models were irregular, but some models could reproduce the observed PDO phase. This indicates that the simulated annual average SST is good; however, the simulation of the SST change trends should be improved.
- The CMIP5 models individually failed to represent the observed positive PDO-CWT relationship. To further study the capacities of the CMIP5 models for simulating the PDO-CWT teleconnection, the MME was considered. The 35 models were divided into two groups by calculating the spatial correlation coefficient. The 13 good models include ACCESS1.3, BCC-CSM1.1, CNRM-CM5, GFDL-ESM2G, GFDL-ESM2M, GISS-E2-H-CC, GISS-E2-H, HadCM3, HadGEM2-AO, INMCM4.0, MPI-ESM-LR, NorESM1-M and NorESM1-ME. The remaining models are defined as poor models. The PDO-CWT correlation spatial pattern for the GOODMME shows a positive correlation over most parts of China, which is consistent with the observational results. This result is better than the results of the individual models and the MME of all models.
- The relationship between the observed PDO and atmospheric circulation shows that the PDO index is negatively correlated with the intensity of the Siberian high and positively correlated with the intensity of the Aleutian high. The correlation coefficient between the 500 hPa geopotential height and the PDO shows that negative correlation centers occurred in the North Pacific and eastern China, while positive correlation centers occurred in North America and the Okhotsk Sea. The PDO and 200 hPa zonal wind speed are positively correlated in southern China and negatively correlated in northern China and Japan. The results of the GOODMME were similar to the observations. The variation of the atmospheric circulation during different phases of the PDO shows that when the PDO is in the positive (negative) phase, the Siberian high weakens (strengthens), the East Asian trough weakens (strengthens), and the upper level zonal winds weaken (strengthen) over northern China and Japan. These changes will lead to a warmer (cooler) winter in China.
Author Contributions
Funding
Acknowledgments
Conflicts of Interest
References
- Trenberth, K.E. Recent observed interdecadal climate changes in the Northern Hemisphere. Bull. Am. Meteorol. Soc. 1990, 71, 988–993. [Google Scholar] [CrossRef]
- Trenberth, K.E.; Hurrell, J.W. Decadal atmosphere-ocean variations in the Pacific. Clim. Dyn. 1994, 9, 303–319. [Google Scholar] [CrossRef]
- Deser, C.; Blackmon, M.L. On the relationship between tropical and North Pacific sea surface temperature variations. J. Clim. 1995, 8, 1677–1680. [Google Scholar] [CrossRef]
- Mantua, N.J.; Hare, S.R.; Zhang, Y.; Wallace, J.M.; Francis, R.C. A Pacific interdecadal climate oscillation with impacts on salmon production. Bull. Am. Meteorol. Soc. 1997, 78, 1069–1079. [Google Scholar] [CrossRef]
- Alexander, M.A.; Bladé, I.; Newman, M.; Lanzante, J.R.; Lau, N.; Scott, J.D. The atmospheric bridge: The influence of ENSO teleconnections on air–sea interaction over the global oceans. J. Clim. 2002, 15, 2205–2231. [Google Scholar] [CrossRef]
- Cai, W.; Van Rensch, P.; Borlace, S.; Cowan, T. Does the Southern Annular Mode contribute to the persistence of the multidecade-long drought over southwest Western Australia? Geophys. Res. Lett. 2011, 38, L144712. [Google Scholar] [CrossRef]
- Zhou, T.; Chen, X.; Dong, L.; Wu, B.; Man, W.; Zhang, L.; Lin, R.; Yao, J.; Song, F.; Zhao, C. Chinese contribution to CMIP5: An overview of five Chinese models’ performances. J. Meteorol. Res. 2014, 28, 481–509. [Google Scholar] [CrossRef]
- Maloney, E.D.; Camargo, S.J.; Chang, E.; Colle, B.; Fu, R.; Geil, K.L.; Hu, Q. North American climate in CMIP5 experiments: Part III: Assessment of twenty-first-century projections. J. Clim. 2014, 27, 2230–2270. [Google Scholar] [CrossRef]
- Yun, J.; Ha, K.J.; Jo, Y.H. Interdecadal changes in winter surface air temperature over East Asia and their possible causes. Clim. Dyn. 2018, 51, 1375–1390. [Google Scholar] [CrossRef]
- Zhao, S.; Deng, Y.; Black, R.X. Observed and Simulated Spring and Summer Dryness in the United States: The Impact of the Pacific Sea Surface Temperature and Beyond. J. Geophys. Res. Atmos. 2017, 122, 712–731. [Google Scholar] [CrossRef]
- Sun, C.; Li, J.; Feng, J.; Xie, F. A decadal-scale teleconnection between the North Atlantic Oscillation and subtropical eastern Australian rainfall. J. Clim. 2015, 28, 1074–1092. [Google Scholar] [CrossRef]
- Kim, J.W.; An, S.I.; Jun, S.Y.; Park, H.J.; Yeh, S.W. ENSO and East Asian winter monsoon relationship modulation associated with the anomalous northwest Pacific anticyclone. Clim. Dyn. 2017, 49, 1157–1179. [Google Scholar] [CrossRef]
- Ye, T.; Shen, Q.; Wang, K.; Zhang, Z.; Zhao, J. Interdecadal change of the northward jump time of the western Pacific subtropical high in association with the Pacific decadal oscillation. J. Meteorol. Res. 2015, 29, 59–71. [Google Scholar] [CrossRef]
- Ding, Y.; Liu, Y.; Liang, S.; Ma, X.; Zhang, Y.; Si, D.; Liang, P.; Song, Y.; Zhang, J. Interdecadal variability of the East Asian winter monsoon and its possible links to global climate change. J. Meteorol. Res. 2014, 28, 693–713. [Google Scholar] [CrossRef]
- Kenyon, J.; Hegerl, G.C. Influence of modes of climate variability on global temperature extremes. J. Clim. 2008, 21, 3872–3889. [Google Scholar] [CrossRef]
- Qin, M.; Li, D.; Dai, A.; Hua, W.; Ma, H. The influence of the Pacific Decadal Oscillation on North Central China precipitation during boreal autumn. Int. J. Climatol. 2018, 38, e821–e831. [Google Scholar] [CrossRef]
- Sperber, K.R.; Annamalai, H.; Kang, I.S.; Kitoh, A.; Moise, A.; Turner, A.; Wang, B.; Zhou, T. The Asian summer monsoon: An intercomparison of CMIP5 vs. CMIP3 simulations of the late 20th century. Clim. Dyn. 2013, 41, 2711–2744. [Google Scholar] [CrossRef]
- Wei, K.; Bao, Q. Projections of the East Asian winter monsoon under the IPCC AR5 scenarios using a coupled model: IAP_FGOALS. Adv. Atmos. Sci. 2012, 29, 1200–1214. [Google Scholar] [CrossRef]
- Roy, I. Indian Summer Monsoon and El Niño Southern Oscillation in CMIP5 Models: A Few Areas of Agreement and Disagreement. Atmosphere 2017, 8, 154. [Google Scholar] [CrossRef]
- Zhang, L.; Wu, P.; Zhou, T. Aerosol forcing of extreme summer drought over North China. Environ. Res. Lett. 2017, 12, 034020. [Google Scholar] [CrossRef]
- Newman, M.; Alexander, A.; Ault, R.; Cobb, K.; Deser, C.; Lorenzo, E.; Mantua, N.; Miller, A.; Minobe, S.; Nakamura, H.; et al. The Pacific Decadal Oscillation, Revisited. J. Clim. 2016, 29, 4399–4427. [Google Scholar] [CrossRef] [Green Version]
- Joshi, M.K.; Kucharski, F. Impact of Interdecadal Pacific Oscillation on Indian summer monsoon rainfall: An assessment from CMIP5 climate models. Clim. Dyn. 2017, 48, 2375–2391. [Google Scholar] [CrossRef]
- Fuentes-Franco, R.; Giorgi, F.; Coppola, E.; Kucharski, F. The role of ENSO and PDO in variability of winter precipitation over North America from twenty first century CMIP5 projections. Clim. Dyn. 2016, 46, 3259–3277. [Google Scholar] [CrossRef]
- Yasunaka, S.; Hanawa, K. Intercomparison of historical sea surface temperature datasets. Int. J. Climatol. 2011, 31, 1056–1073. [Google Scholar] [CrossRef]
- Lawrence Livermore National Laboratory Earth System Grid Federation Web Site. Available online: https://esgf-node.llnl.gov/projects/esgf-llnl/ (accessed on 29 September 2019).
- Taylor, K.E.; Stouffer, R.J.; Meehl, G.A. An overview of CMIP5 and the experiment design. Bull. Am. Meteorol. Soc. 2012, 93, 485–498. [Google Scholar] [CrossRef]
- Hadley Centre Sea Ice and Sea Surface Temperature data set. Available online: https://www.metoffice.gov.uk/hadobs/hadisst/ (accessed on 29 September 2019).
- Rayner, N.A.; Parker, D.E.; Horton, E.B.; Folland, C.K.; Alexander, L.V.; Rowel, D.P.; Kent, E.C.; Kaplan, A. Global analyses of sea surface temperature, sea ice, and night marine air temperature since the late nineteenth century. J. Geophys. Res. Atmos. 2003, 108. [Google Scholar] [CrossRef]
- Harris, I.; Jones, P.D.; Osborn, T.J.; Lister, D.H. Updated high-resolution grids of monthly climatic observations-the CRU TS3.10 Dataset. Int. J. Climatol. 2014, 34, 623–642. [Google Scholar] [CrossRef]
- Kanamitsu, M.; Alpert, J.C.; Campana, K.A.; Caplan, P.M.; Deaven, D.G.; Iredell, M.; Katz, B.; Pan, H.L.; Sela, J.; White, G.H. Recent changes implemented into the global forecast system at NMC. Weather Forecast. 1991, 6, 425–435. [Google Scholar] [CrossRef]
- Saha, S.; Nadiga, S.; Thiaw, C.; Wang, J.; Wang, W.; Zhang, Q.; Van den Dool, H.M.; Pan, H.L.; Moorthi, S.; Behringer, D.; et al. The NCEP climate forecast system. J. Clim. 2006, 19, 3483–3517. [Google Scholar] [CrossRef]
- Twentieth Century Reanalysis (V2) data. Available online: https://www.esrl.noaa.gov/psd/data/gridded/data.20thC_ReanV2.html (accessed on 29 September 2019).
- Zhang, Y.; Wallace, J.M.; Battisti, D.S. ENSO-like interdecadal variability: 1900–93. J. Clim. 1997, 10, 1004–1020. [Google Scholar] [CrossRef]
- Taylor, K.E. Summarizing multiple aspects of model performance in a single diagram. J. Geophys. Res. Atmos. 2001, 106, 7183–7192. [Google Scholar] [CrossRef]
- Rider, P.R. On the distribution of the correlation coefficient in small samples. Biometrika 1932, 24, 382–403. [Google Scholar] [CrossRef]
- Yim, B.Y.; Kwon, M.H.; Min, H.S.; Kug, J.S. Pacific decadal oscillation and its relation to the extratropical atmospheric variation in CMIP5. Clim. Dyn. 2015, 44, 1521–1540. [Google Scholar] [CrossRef]
- Chen, X.; Wallace, M. Orthogonal PDO and ENSO indices. J. Clim. 2016, 29, 3883–3892. [Google Scholar] [CrossRef]
- Wallace, J.M.; Gutzler, D.S. Teleconnections in the geopotential height field during the Northern Hemisphere winter. Mon. Weather Rev. 1981, 109, 784–812. [Google Scholar] [CrossRef]
- Mantua, N.J.; Hare, S.R. The Pacific decadal oscillation. J. Oceanogr. 2002, 58, 35–44. [Google Scholar] [CrossRef]
- Qian, C.; Zhou, T. Multidecadal variability of North China aridity and its relationship to PDO during 1900–2010. J. Clim. 2014, 27, 1210–1222. [Google Scholar] [CrossRef]
- Ding, Y.; Krishnamurti, T.N. Heat budget of the Siberian high and the winter monsoon. Mon. Weather Rev. 1987, 115, 2428–2449. [Google Scholar] [CrossRef]
- Jhun, J.G.; Lee, E.J. A new East Asian winter monsoon index and associated characteristics of the winter monsoon. J. Clim. 2004, 17, 711–726. [Google Scholar] [CrossRef]
- Li, Y.; Yang, S. A dynamical index for the East Asian winter monsoon. J. Clim. 2010, 23, 4255–4262. [Google Scholar] [CrossRef]
- Zhu, Y. An index of East Asian winter monsoon applied to the description of China’s mainland winter temperature changes. J. Meteorol. Res. 2008, 22, 522–529. [Google Scholar]
- Wang, L.; Chen, W. How well do existing indices measure the strength of the East Asian winter monsoon? Adv. Atmos. Sci. 2010, 27, 855–870. [Google Scholar] [CrossRef]
- Chen, H.P. Projected change in extreme rainfall events in China by the end of the 21st century using CMIP5 models. Chin. Sci. Bull. 2013, 58, 1462–1472. [Google Scholar] [CrossRef] [Green Version]
- Yao, Y.; Luo, Y.; Huang, J.; Zhao, Z. Comparison of monthly temperature extremes simulated by CMIP3 and CMIP5 models. J. Clim. 2013, 26, 7692–7707. [Google Scholar] [CrossRef]


| Model | Institution | Resolution |
|---|---|---|
| ACCESS1.0 | Commonwealth Scientific and Industrial Research Organization/Bureau of Meteorology Australia | 300 × 360 |
| ACCESS1.3 | Commonwealth Scientific and Industrial Research Organization/Bureau of Meteorology Australia | 300 × 360 |
| BCC-CSM1.1 | Beijing Climate Center China | 232 × 360 |
| BCC-CSM1.1 (m) | Beijing Climate Center China | 232 × 360 |
| CCSM4 | National Center for Atmospheric Research USA | 320 × 384 |
| CESM1(WACCM) | National Center for Atmospheric Research USA | 320 × 384 |
| CESM1(BGC) | National Center for Atmospheric Research USA | 320 × 384 |
| CESM1(CAM5) | National Center for Atmospheric Research USA | 320 × 384 |
| CMCC-CM | Centro Euro-Mediterraneo sui Cambiamenti Climatici Italy | 149 × 182 |
| CMCC-CMS | Centro Euro-Mediterraneo sui Cambiamenti Climatici Italy | 149 × 182 |
| CNRM-CM5 | Centre National de Recherches Météorologiques, Centre Européen de Recherche et de Formation Avancéeen Calcul Scientifique France | 292 × 362 |
| CSIRO-Mk3.6.0 | Commonwealth Scientific and Industrial Research Organization/Queensland Climate Change Centre of Excellence Australia | 189 × 192 |
| CanESM2 | Canadian Centre for Climate Modelling and Analysis Canada | 192 × 256 |
| EC-EARTH | EC-EARTH consortium published at Irish Centre for High-End Computing Netherlands/Ireland | 292 × 362 |
| FGOALS-g2 | Institute of Atmospheric Physics, Chinese Academy of Sciences China | 196 × 360 |
| FIO-ESM | The First Institute of Oceanography, SOA China | 320 × 384 |
| GFDL-ESM2G | Geophysical Fluid Dynamics Laboratory USA | 210 × 360 |
| GFDL-ESM2M | Geophysical Fluid Dynamics Laboratory USA | 200 × 360 |
| GISS-E2-H | NASA/GISS (Goddard Institute for Space Studies) USA | 90 × 144 |
| GISS-E2-H-CC | NASA/GISS (Goddard Institute for Space Studies) USA | 90 × 144 |
| GISS-E2-R | NASA/GISS (Goddard Institute for Space Studies) USA | 90 × 144 |
| GISS-E2-R-CC | NASA/GISS (Goddard Institute for Space Studies) USA | 90 × 144 |
| HadCM3 | Met Office Hadley Centre UK | 144 × 288 |
| HadGEM2-AO | National Institute of Meteorological Research, Korea Meteorological Administration South Korea | 216 × 360 |
| HadGEM2-ES | Met Office Hadley Centre UK | 216 × 360 |
| INMCM4.0 | Russian Academy of Sciences, Russian Academy of Sciences, Institute of Numerical Mathematics Russia | 340 × 360 |
| IPSL-CM5A-LR | Institut Pierre Simon Laplace France | 149 × 182 |
| IPSL-CM5A-MR | Institut Pierre Simon Laplace France | 149 × 182 |
| IPSL-CM5B-LR | Institut Pierre Simon Laplace France | 149 × 182 |
| MIROC5 | Atmosphere and Ocean Research Institute (The University of Tokyo), National Institute for Environmental Studies, and Japan Agency for Marine-Earth Science and Technology Japan | 220 × 256 |
| MPI-ESM-LR | Max Planck Institute for Meteorology Germany | 220 × 256 |
| MPI-ESM-MR | Max Planck Institute for Meteorology Germany | 404 × 802 |
| MRICGCM3 | Meteorological Research Institute Japan | 368 × 360 |
| NorESM1-M | Bjerknes Centre for Climate Research, Norwegian Meteorological Institute Norway | 320 × 384 |
| NorESM1-ME | Bjerknes Centre for Climate Research, Norwegian Meteorological Institute Norway | 320 × 384 |
© 2019 by the authors. Licensee MDPI, Basel, Switzerland. This article is an open access article distributed under the terms and conditions of the Creative Commons Attribution (CC BY) license (http://creativecommons.org/licenses/by/4.0/).
Share and Cite
Xu, Y.; Li, T.; Shen, S.; Hu, Z. Assessment of CMIP5 Models Based on the Interdecadal Relationship between the PDO and Winter Temperature in China. Atmosphere 2019, 10, 597. https://doi.org/10.3390/atmos10100597
Xu Y, Li T, Shen S, Hu Z. Assessment of CMIP5 Models Based on the Interdecadal Relationship between the PDO and Winter Temperature in China. Atmosphere. 2019; 10(10):597. https://doi.org/10.3390/atmos10100597
Chicago/Turabian StyleXu, Yifei, Te Li, Shuanghe Shen, and Zhenghua Hu. 2019. "Assessment of CMIP5 Models Based on the Interdecadal Relationship between the PDO and Winter Temperature in China" Atmosphere 10, no. 10: 597. https://doi.org/10.3390/atmos10100597
APA StyleXu, Y., Li, T., Shen, S., & Hu, Z. (2019). Assessment of CMIP5 Models Based on the Interdecadal Relationship between the PDO and Winter Temperature in China. Atmosphere, 10(10), 597. https://doi.org/10.3390/atmos10100597