Changes in Extreme Low Temperature Events over Northern China under 1.5 °C and 2.0 °C Warmer Future Scenarios

Abstract
:1. Introduction
2. Data and Methods
2.1. Data
2.1.1. Historical Data
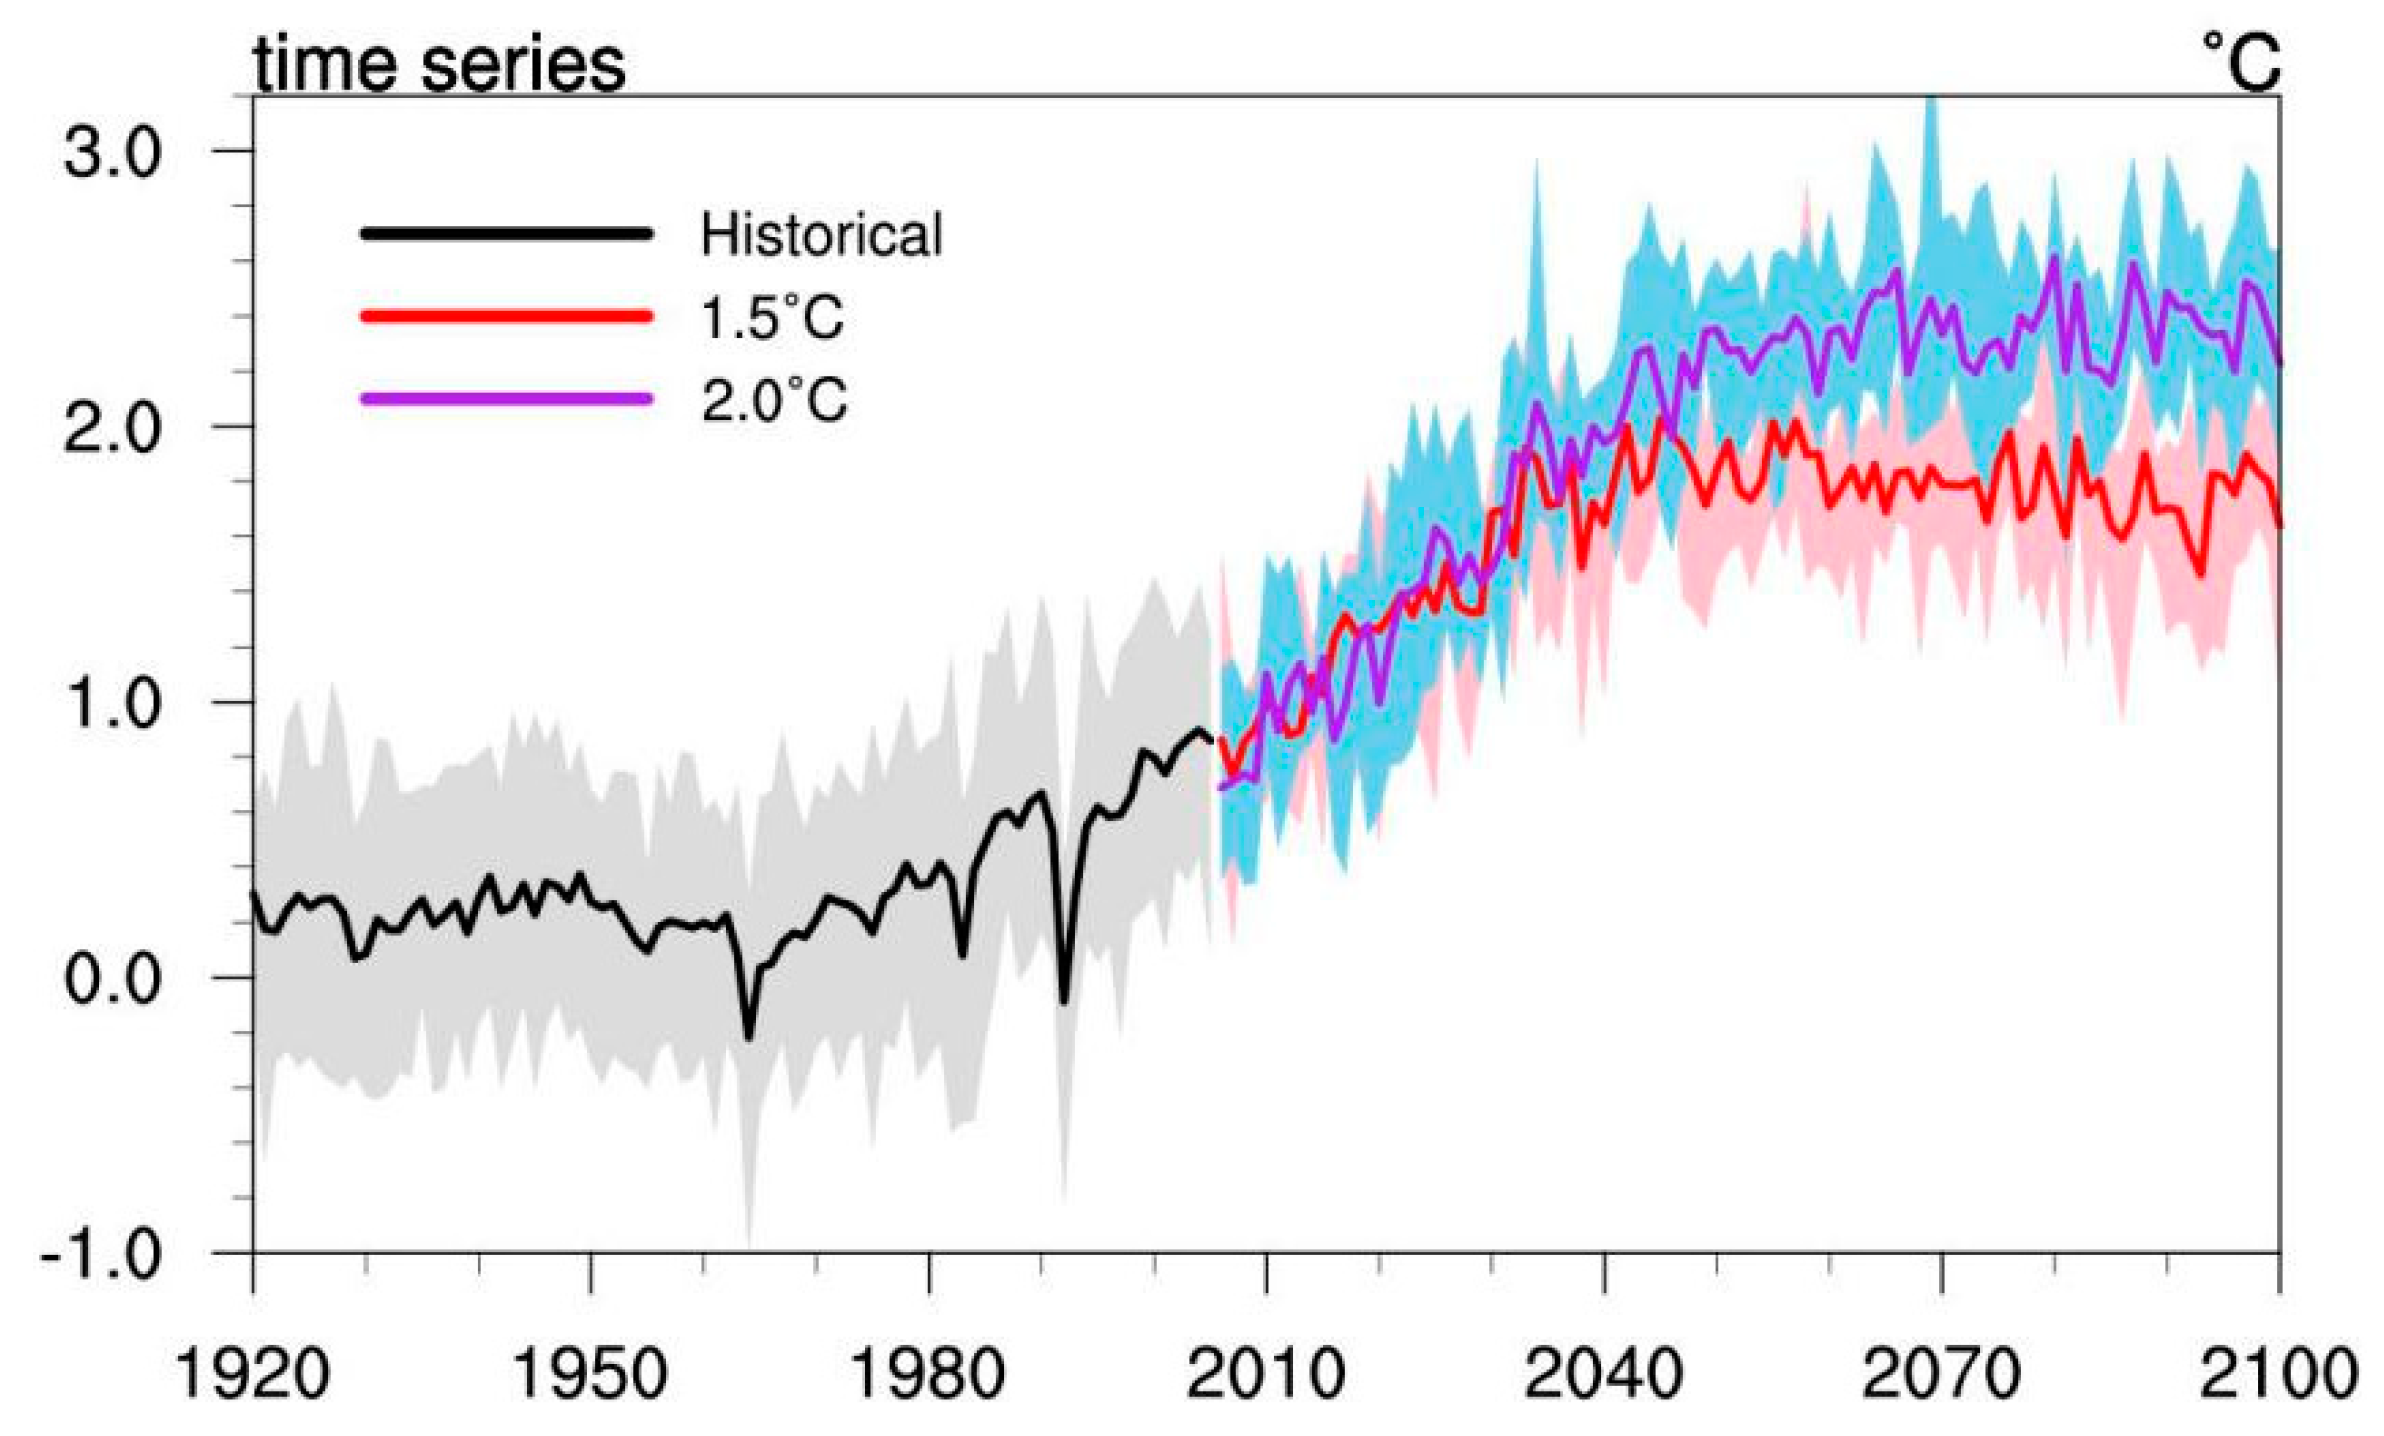
2.1.2. Model Projection Data
2.2. Methods
2.2.1. Extreme Low Temperature Indices
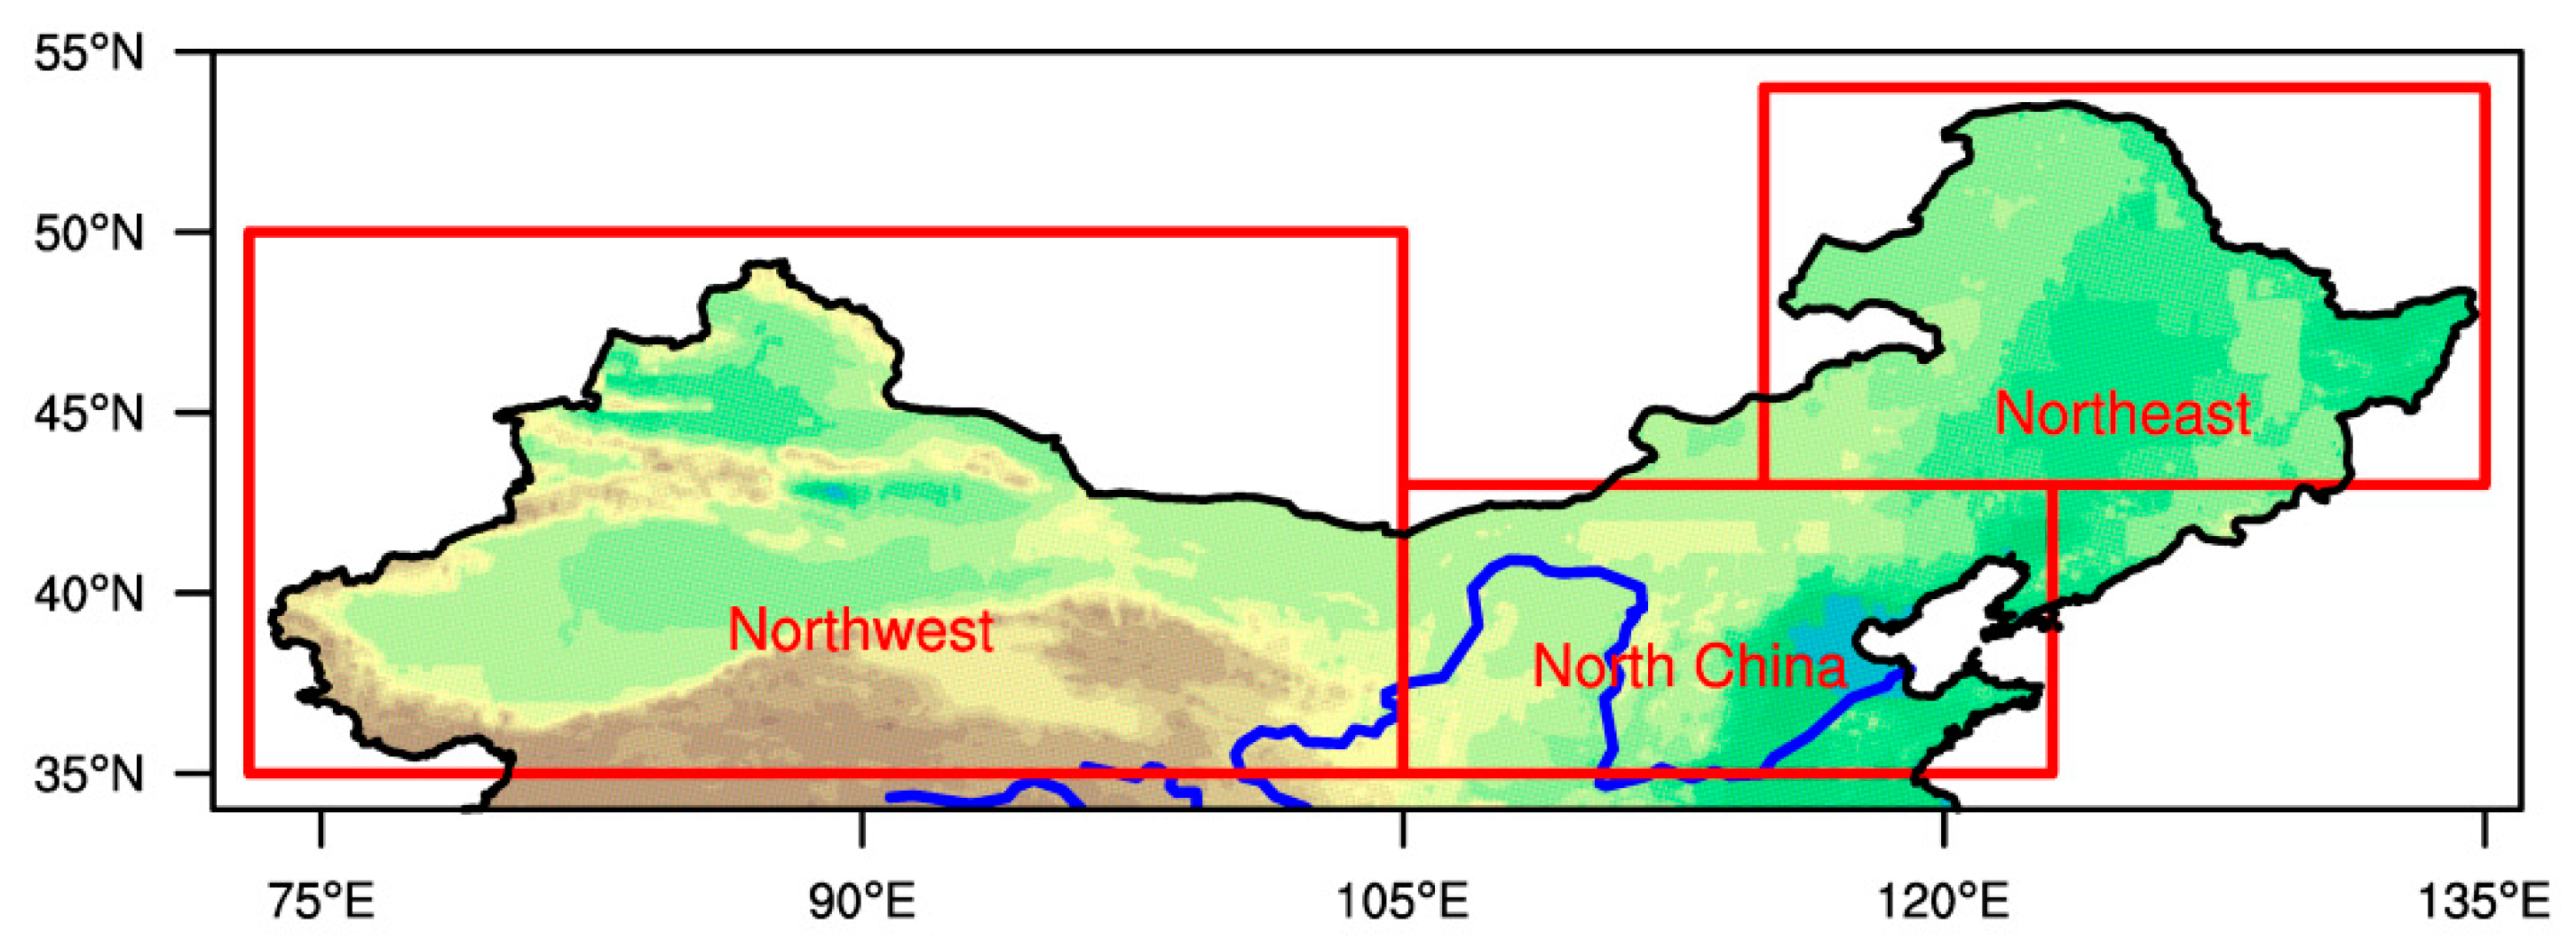
2.2.2. Subregions of Northern China
2.2.3. Bias Correction
2.2.4. Probability Ratio
2.2.5. Avoided Impacts
3. Results
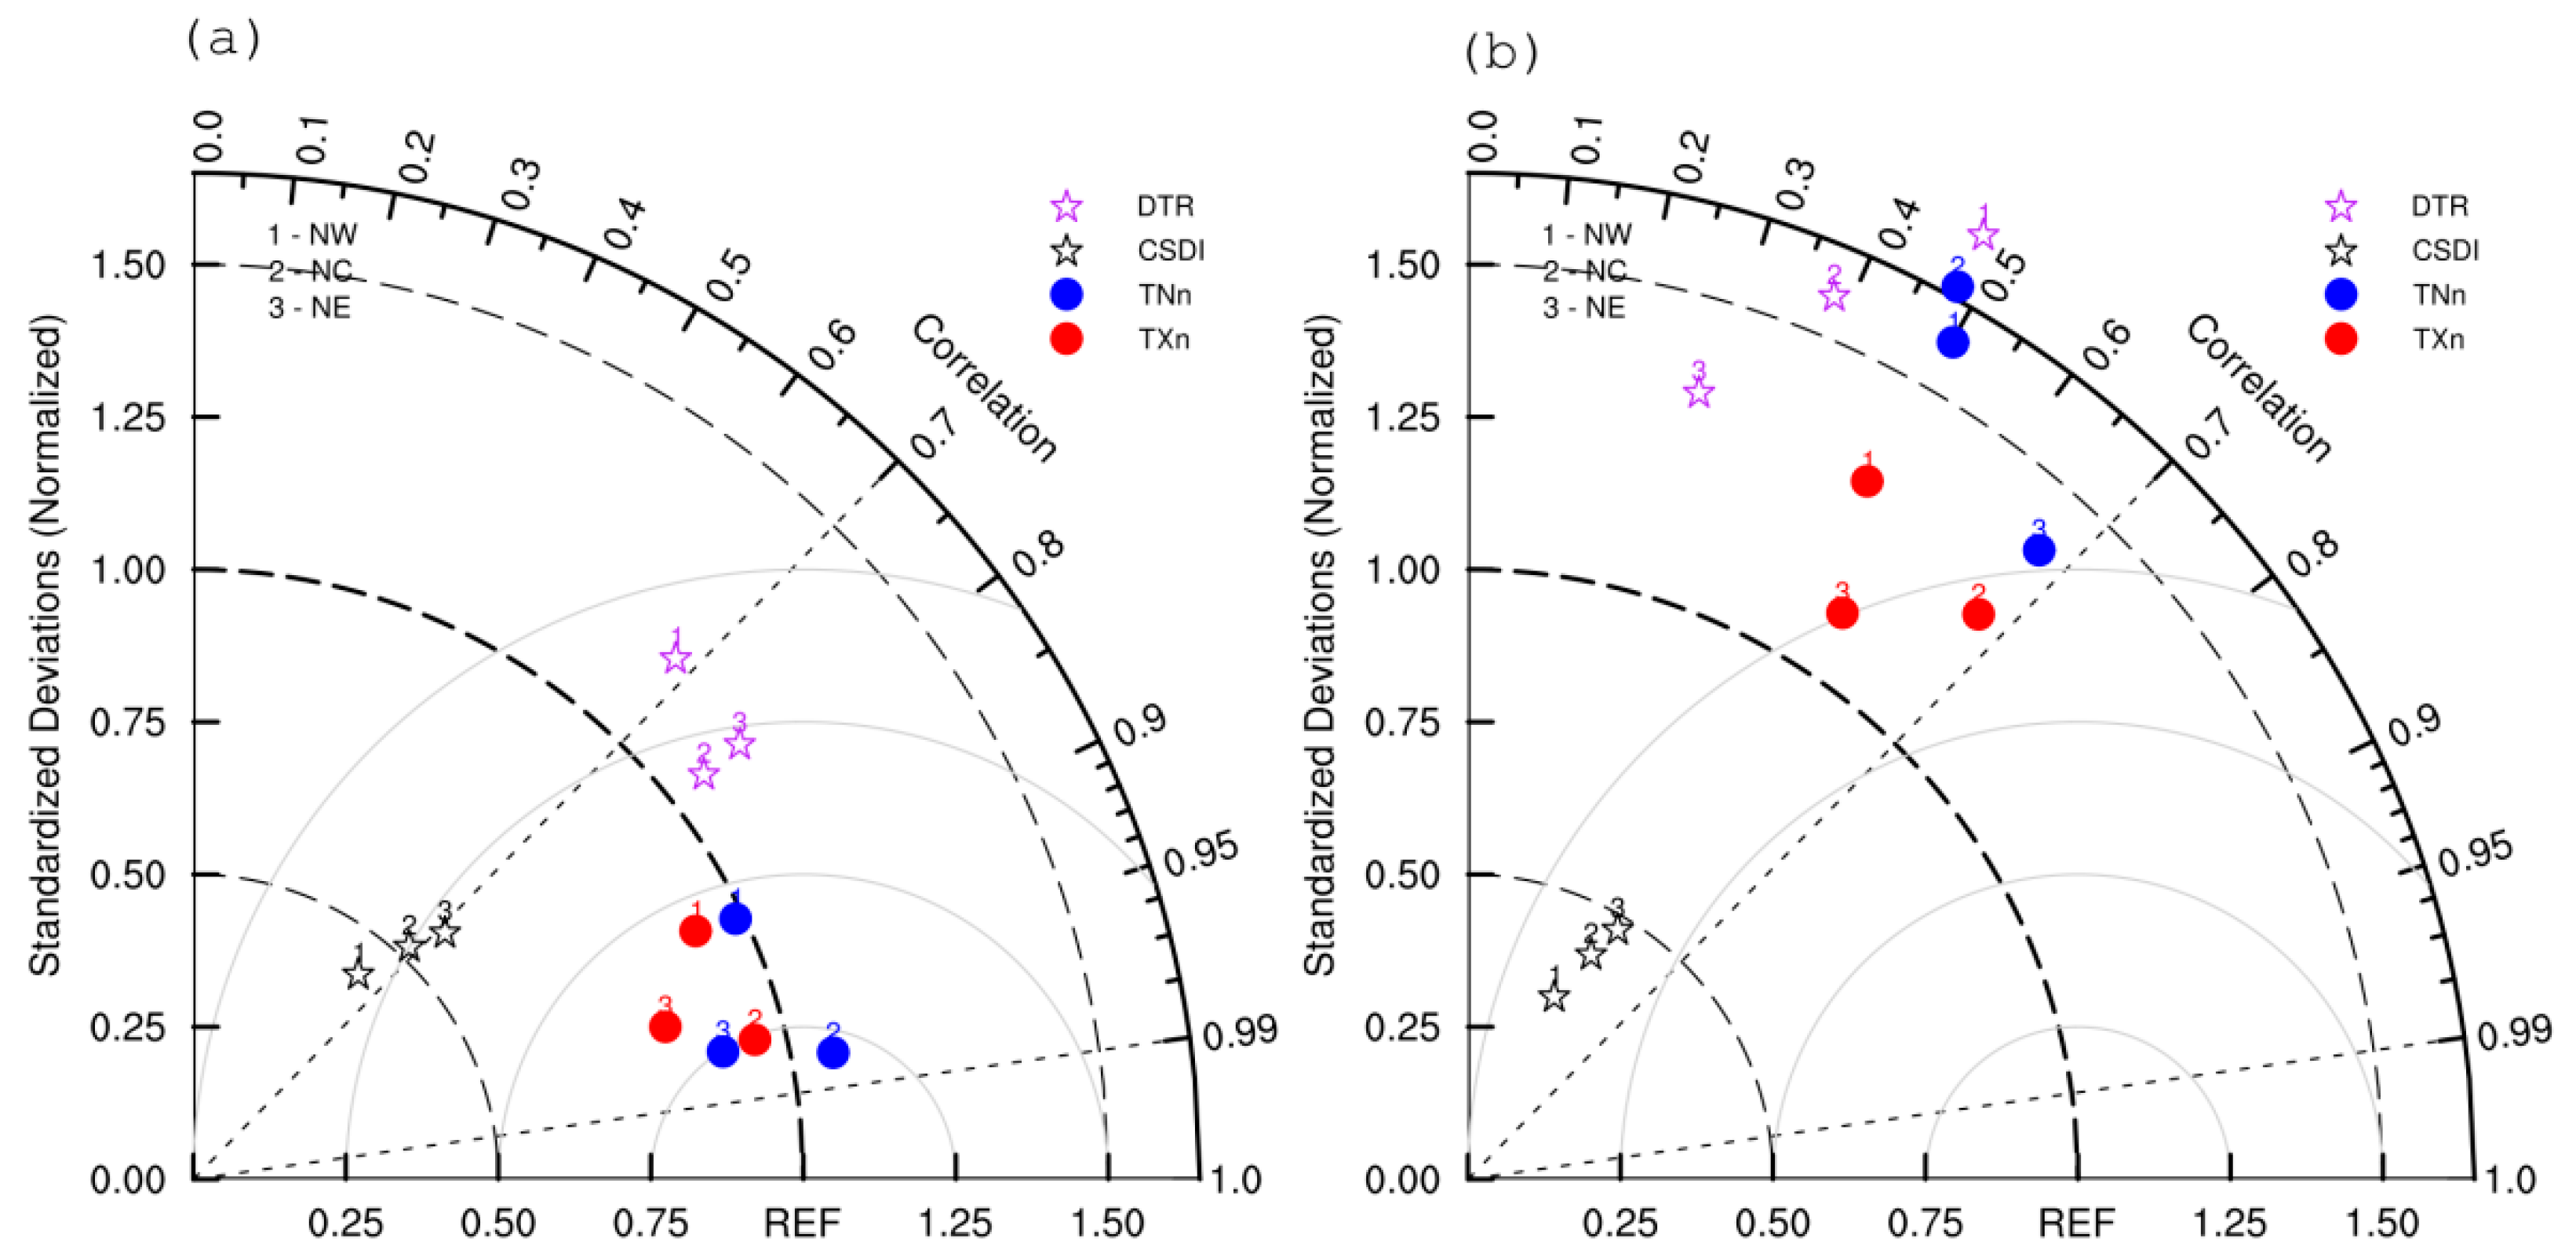
3.1. Evaluation of Historical Simulation
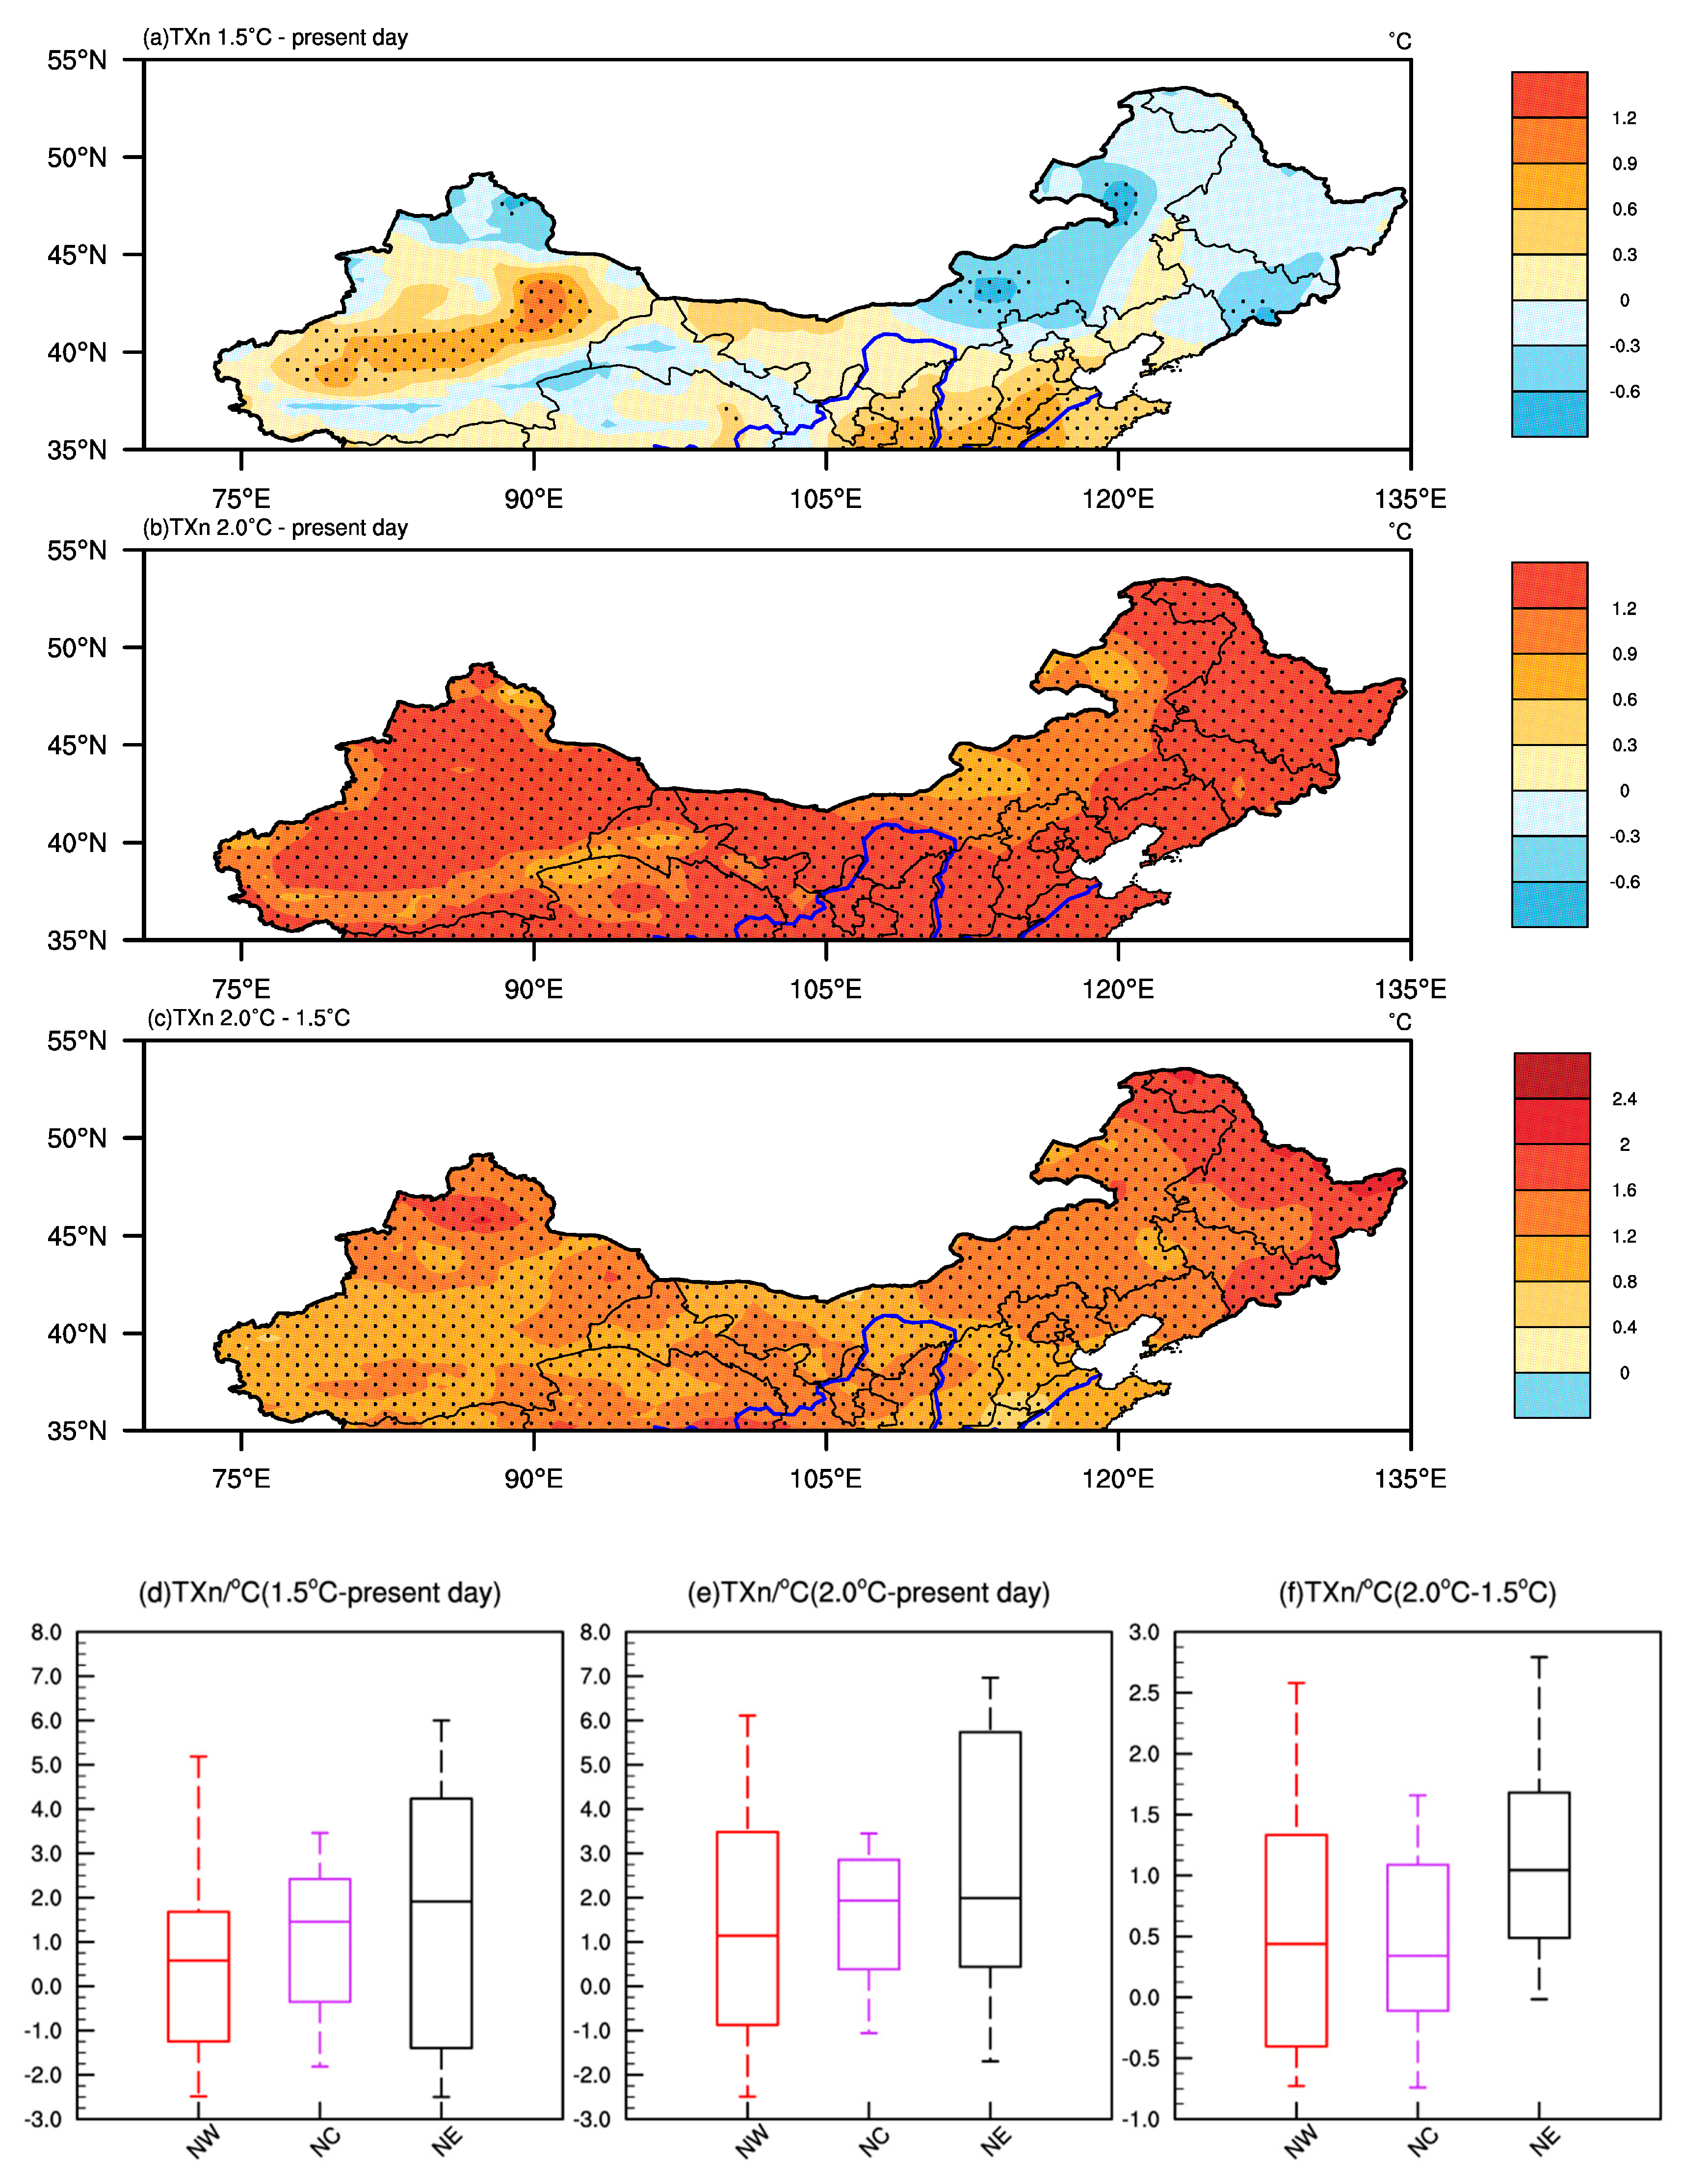
3.2. Minimum Surface Air Temperature Changes
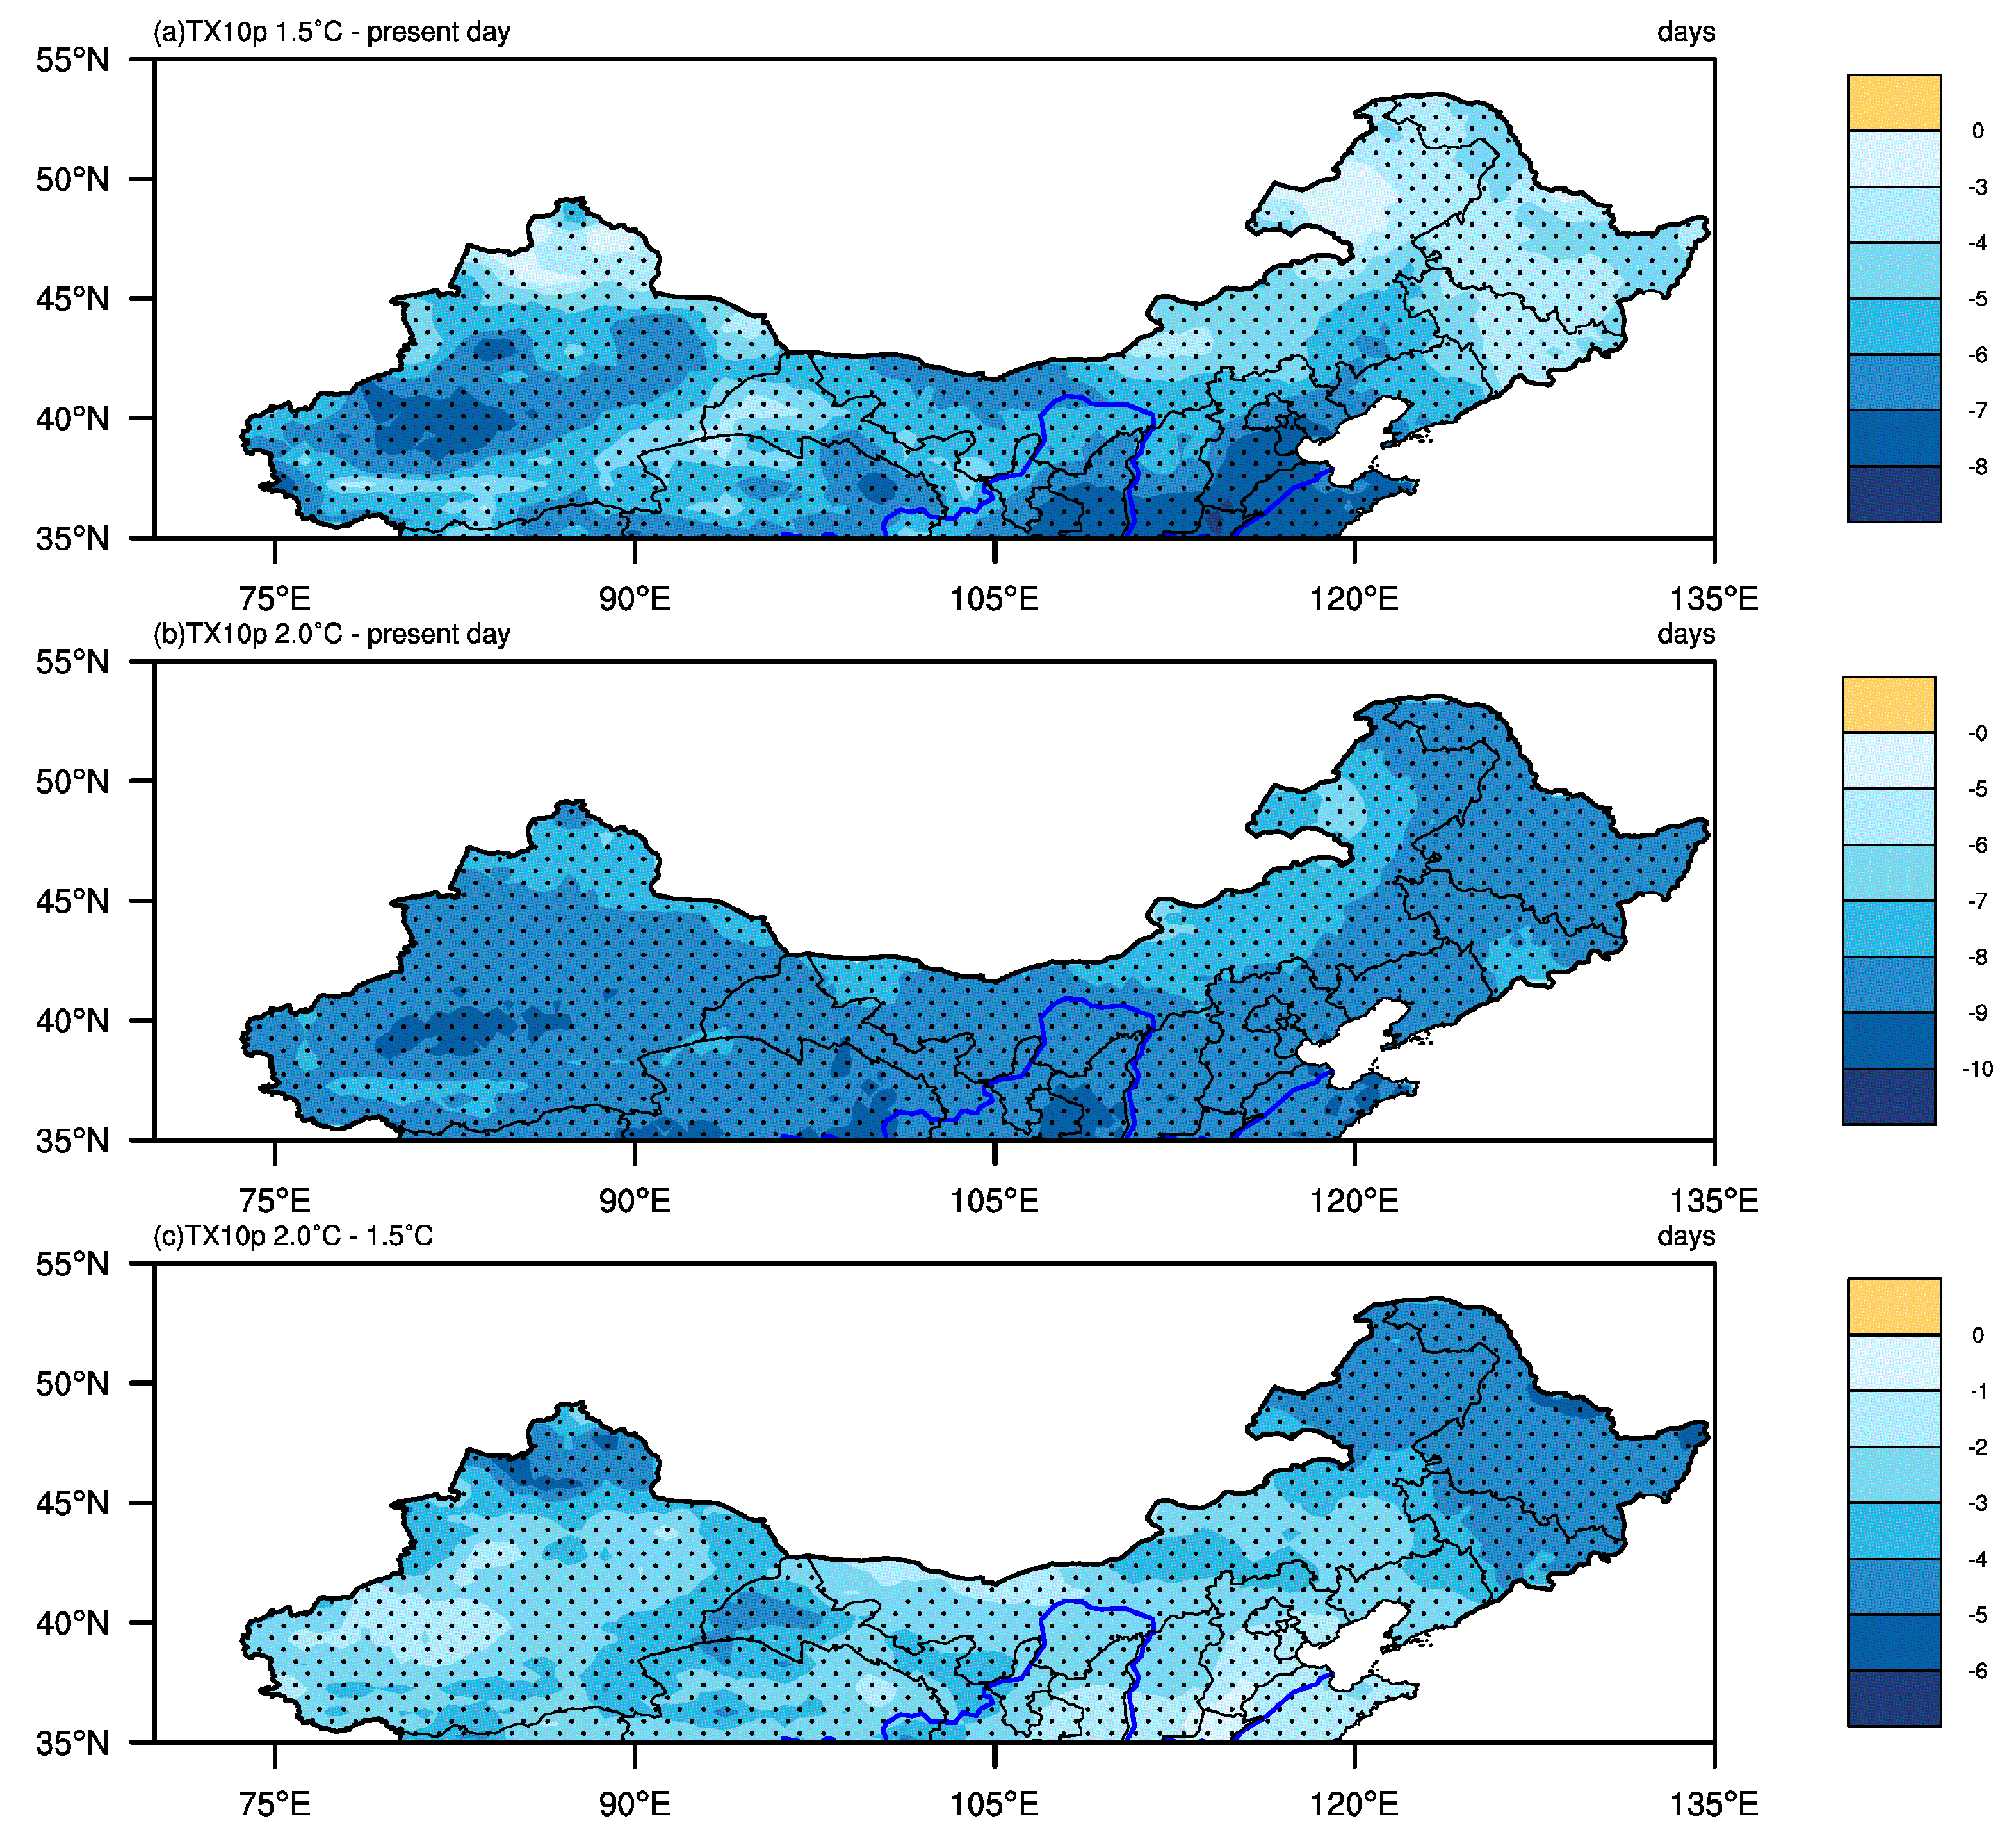
3.3. Changes in Low Temperature Extremes
3.4. Changes in Probability Ratio
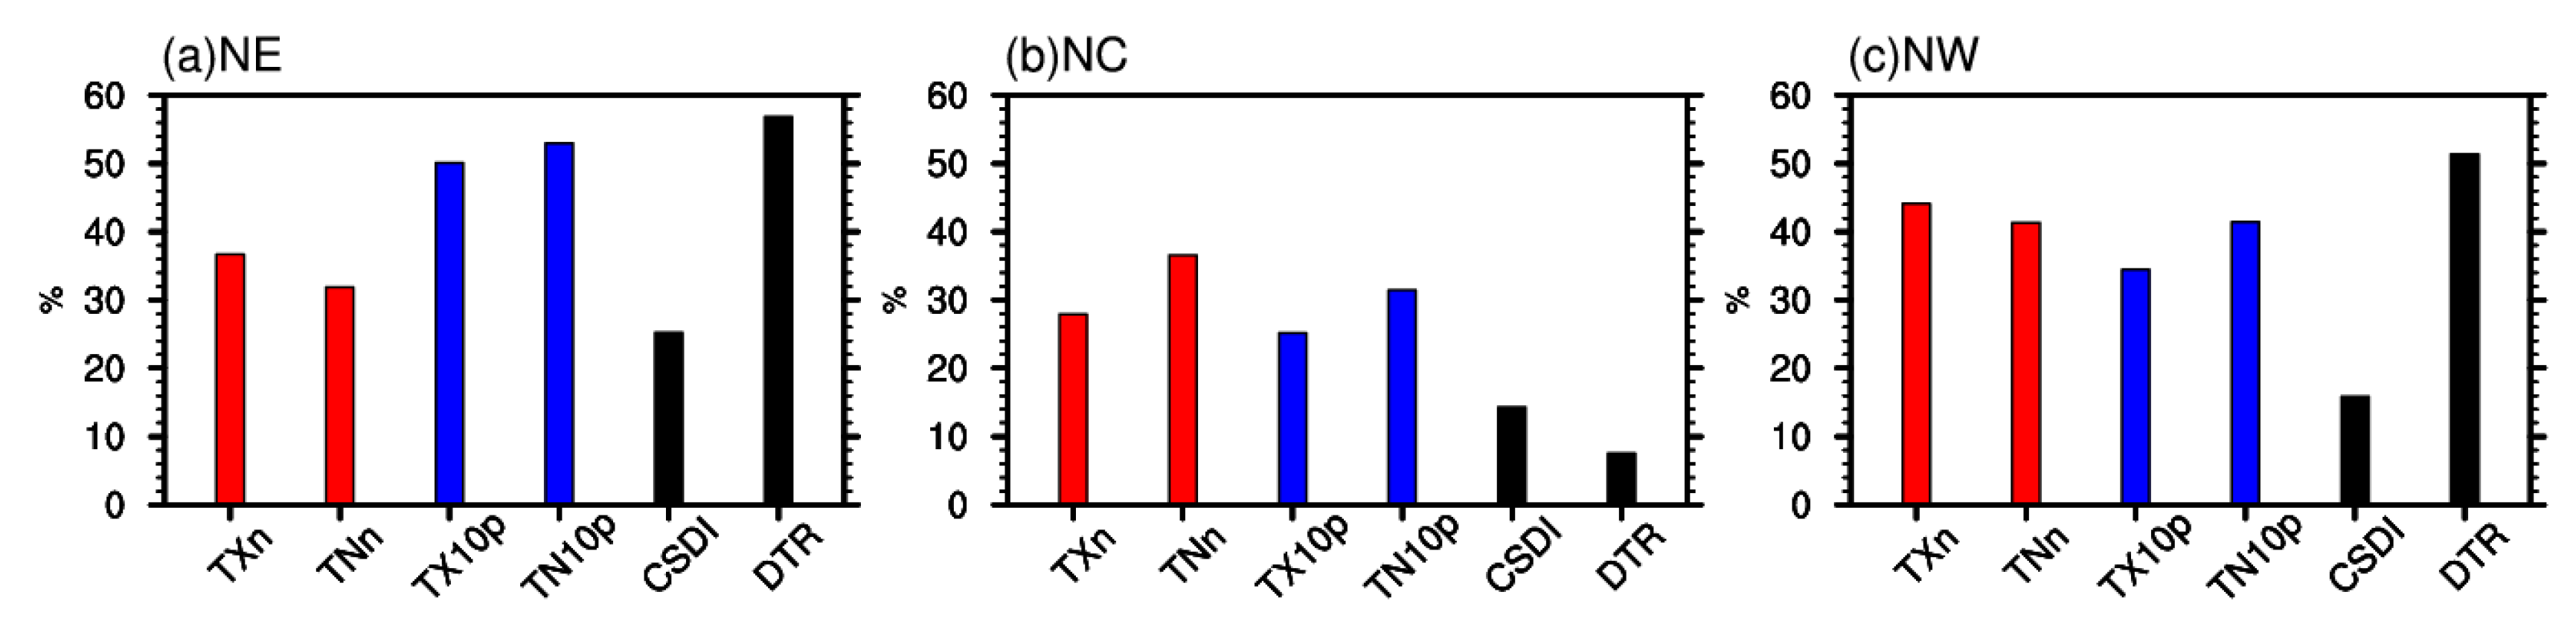
3.5. Avoided Impacts
4. Conclusions and Discussion
Supplementary Materials
Author Contributions
Funding
Conflicts of Interest
References
- IPCC. Climate Change 2013: The Physical Sciences Basis. Contribution of Working Group I to the Fifth Assessment Report of the Intergovernmental Panel on Climate Change; Cambridge University Press: Cambridge, UK; New York, NY, USA, 2013; p. 1535. [Google Scholar]
- Zhou, B.; Xu, Y.; Wu, J.; Dong, S.; Shi, Y. Changes in temperature and precipitation extreme indices over China: Analysis of a high-resolution grid dataset. Int. J. Climatol. 2016, 36, 1051–1066. [Google Scholar] [CrossRef]
- Zeng, N.; Ding, Y.H.; Pan, J.H.; Zing, N.; Ding, Y.; Pan, J.; Wang, H.; Gregg, J. Climate change—The Chinese challenge. Science 2008, 319, 730–731. [Google Scholar] [CrossRef] [PubMed]
- UNFCCC. Adoption of the Paris Agreement. Proposal by the President. Report No.FCCC/CP/2015/L.9/Rev.1. Proposal by the President. 2015. Available online: https://unfccc.int/sites/default/files/resource/docs/2015/cop21/eng/l09r01.pdf (accessed on 12 December 2015).
- Schleussner, C.F.; Lissner, T.K.; Fischer, E.M.; Wohland, J.; Perrette, M.; Golly, A.; Rogelj, J.; Childers, K.; Schewe, J.; Frieler, K.; et al. Differential climate impacts for policy-relevant limits to global warming: The case of 1.5 °C and 2 °C. Earth Syst. Dyn. 2016, 7, 327–351. [Google Scholar] [CrossRef]
- Hur, J.; Ahn, J.B.; Shim, K.M. The change of cherry first-flowering date over South Korea projected from downscaled IPCC AR5 simulation. Int. J. Climatol. 2014, 34, 2308–2319. [Google Scholar] [CrossRef]
- Dosio, A.; Fischer, E.M. Will half a degree make a difference? Robust projections of indices of mean and extreme climate in Europe under 1.5 °C, 2 °C, and 3 °C global warming. Geophys. Res. Lett. 2018, 45, 935–944. [Google Scholar] [CrossRef]
- Jiang, D.; Sui, Y.; Lang, X. Timing and associated climate change of a 2 °C global warming. Int. J. Climatol. 2016, 36, 4512–4522. [Google Scholar] [CrossRef]
- Sui, Y.; Lang, X.; Jiang, D. Projected signals in climate extremes over China associated with a 2 °C global warming under two RCP scenarios. Int. J. Climatol. 2018, 38, e678–e697. [Google Scholar] [CrossRef]
- Yang, J.H.; Ren, C.Y.; Jiang, Z.H. Characteristics of Extreme Temperature Event and Its Response to Regional Warning in Northwest China in Past 45 Years. Chin. Geogr. Sci. 2008, 18, 70–76. [Google Scholar] [CrossRef]
- Pal, I.; Al-Tabbaa, A. Long-term changes and variability of monthly extreme temperatures in India. Theor. Appl. Climatol. 2010, 100, 45–56. [Google Scholar] [CrossRef]
- You, Q.L.; Kang, S.C.; Aguilar, E.; Pepin, N.; Flügel, W.A.; Yan, Y.; Xu, Y.; Zhang, Y.; Huang, J. Changes in daily climate extremes in China and their connection to the large scale atmospheric circulation during 1961–2003. Clim. Dyn. 2011, 36, 2399–2416. [Google Scholar] [CrossRef]
- Su, B.D.; Jiang, T.; Jin, W.B. Recent trends in observed temperature and precipitation extremes in the Yangtze River basin, China. Theor. Appl. Climatol. 2006, 83, 139–151. [Google Scholar] [CrossRef]
- Chen, X.C.; Xu, Y.; Yao, Y. Changes in climate extremes over China in a 2 °C, 3 °C and 4 °C warmer world. Chin. J. Atmos. Sci. 2015, 39, 1123–1135. [Google Scholar] [CrossRef]
- Yao, Y.; Luo, Y.; Huang, J.B. Evaluation and projection of temperature extremes over China based on 8 modeling data from CIMP5. Adv. Clim. Change 2012, 8, 250–256. [Google Scholar]
- Yang, J.H.; Shen, Y.P.; Wang, P.X.; Yang, Q.G. Extreme low temperature events in Northwest China and their response to regional warming in the recent 45 Years. J. Glaciol. Geocryol. 2007, 29, 536–542. [Google Scholar]
- Zhang, Y.; Cao, L.J.; Xu, Y.L.; Dong, W.J. Scenario analyses on future changes of extreme temperature events over China. J. Appl. Meteorol. Sci. 2008, 19, 655–660. [Google Scholar]
- Yu, R.; Zhai, P.; Lu, Y. Implications of differential effects between 1.5 and 2 °C global warming on temperature and precipitation extremes in China’s urban agglomerations. Int. J. Climatol. 2017, 38, 2374–2385. [Google Scholar] [CrossRef]
- Sanderson, B.M.; Xu, Y.; Tebaldi, C.; Wehner, M.; O’Neill, B.C.; Jahn, A.; Pendergrass, A.G.; Lehner, F.; Strand, W.G.; Lin, L.; et al. Community climate simulations to assess avoided impacts in 1.5 and 2 °C futures. Earth Syst. Dyn. 2017, 8, 827–847. [Google Scholar] [CrossRef]
- Nangombe, S.; Zhou, T.; Zhang, W.; Wu, B.; Hu, S.; Zou, L.; Li, D. Record-breaking climate extremes in Africa under stabilized 1.5 °C and 2 °C global warming scenarios. Nat. Clim. Change 2018, 8, 375–380. [Google Scholar] [CrossRef]
- Kay, J.E.; Kay, J.E.; Deser, C.; Phillips, A.; Mai, A.; Hannay, C.; Strand, G.; Arblaster, J.M.; Bates, S.C.; Danabasoglu, G.; et al. The community earth system model (CESM) large ensemble project: A community resource for studying climate change in the presence of internal climate variability. Bull. Am. Meteorol. Soc. 2015, 96, 1333–1349. [Google Scholar] [CrossRef]
- Li, D.H.; Zhou, T.J.; Zou, L.W.; Zhang, W.X.; Zhang, L.X. Extreme high-temperature events over East Asia in 1.5 °C and 2 °C warmer futures: Analysis of NCAR CESM low-warming experiments. Geophys. Res. Lett. 2018, 45, 1541–1550. [Google Scholar] [CrossRef]
- Lin, L.; Wang, Z.L.; Xu, Y.Y.; Zhang, X.Y.; Zhang, H.; Dong, W.J. Additional Intensification of Seasonal Heat and Flooding Extreme Over China in a 2 °C Warmer World Compared to 1.5 °C. Earth Future 2018, 6, 968–972. [Google Scholar] [CrossRef]
- Xu, Y.; Gao, X.J.; Shen, Y.; Xu, C.H.; Shi, Y.; Giorgi, F. A daily temperature dataset over China and its application in validating a RCM simulation. Adv. Atmos. Sci. 2009, 26, 763–772. [Google Scholar] [CrossRef] [Green Version]
- Wu, J.; Gao, X.J. A gridded daily observation dataset over China region and comparison with the other datasets. Chin. J. Geophys. 2013, 56, 1102–1111. (In Chinese) [Google Scholar]
- Karl, T.R.; Nicholls, N.; Ghazi, A. Clivar/GCOS/WMO Workshop on Indices and Indicators for Climate Extremes Workshop Summary. Clim. Change 1999, 42, 3–7. [Google Scholar] [CrossRef]
- Tao, S.Y. Ten years in our country the study of cold wave in east Asia. Acta Meteorol. 1959, 30, 226–230. [Google Scholar]
- Chen, S.H.; Wang, J.S.; Ren, Y.; Qian, L. Evaluative characteristic of extreme minimum temperature of northwest China in recent 49 years. Plateau Meteorol. 2011, 30, 1266–1273. [Google Scholar]
- Liang, M.; Wu, L.G. Analysis of features of summer extreme high temperature in eastern China. J. Meteorol. Sci. 2015, 35, 701–709. [Google Scholar]
- Jung, T. Systematic errors of the atmospheric circulation in the ECMWF forecasting system. Q. J. R. Meteorol. Soc. 2005, 131, 1045–1073. [Google Scholar] [CrossRef] [Green Version]
- Scott, P.A.; Stone, D.A.; Allen, M.R. Human contribution to the European heatwave of 2003. Nature 2004, 432, 610–614. [Google Scholar]
- Ma, S.; Zhou, T.; Stone, D.A.; Polson, D.; Dai, A.; Stott, P.A.; von Storch, H.; Qian, Y.; Burke, C.; Wu, P.; et al. Detectable anthropogenic shift toward heavy precipitation over eastern China. J. Clim. 2017, 30, 6543–6560. [Google Scholar] [CrossRef]
- Taylor, K.E. In a Single Diagram. J. Geophys. Res. Atmos. 2001, 106, 7183–7192. [Google Scholar] [CrossRef]
- Cannon, A.J.; Sobie, S.R.; Murdock, T.Q. Bias correction of GCM precipitation by quantile mapping: How well do methods preserve changes in quantiles and extremes? J. Clim. 2015, 28, 6938–6959. [Google Scholar] [CrossRef]
- Dosio, A. Projections of climate change indices of temperature and precipitation from an ensemble of bias-adjusted high-resolution EURO-CORDEX regional climate models. J. Geophys. Res. Atmos. 2016, 121, 5488–5511. [Google Scholar] [CrossRef] [Green Version]
- Li, W.; Jiang, Z.; Zhang, X.; Li, L.; Sun, Y. Additional risk in extreme precipitation in China from 1.5 °C to 2.0 °C global warming levels. Sci. Bull. 2018, 63, 228–234. [Google Scholar] [CrossRef]
- Shi, C.; Jiang, Z.H.; Chen, W.L.; Li, L. Changes in temperature extremes over China under 1.5 °C and 2 °C global warming targets. Adv. Clim. Change Res. 2018. [Google Scholar] [CrossRef]
- Wang, A.Q.; Su, B.D.; Wang, Y.J.; Huang, J.L.; Wen, S.S.; Jiang, T. Variation of the extreme low-temperature events and farmland exposure under global warming of 1.5 °C and 2.0 °C. Acta Meteorol. Sin. 2017, 75, 415–428. [Google Scholar]


| Indices | Indicator Name | Definition | Unit |
|---|---|---|---|
| TXn | Min Tmax | Lowest winter daily maximum temperature | °C |
| TNn | Min Tmin | Lowest winter daily minimum temperature | °C |
| TX10p | Cool days | Days when Tmax < 10th percentile of 1976–2005 | days |
| TN10p | Cool nights | Days when Tmin < 10th percentile of 1976–2005 | days |
| CSDI | Cold spell duration indicator | At least six consecutive days when Tmin < 10th percentile | days |
| DTR | Diurnal temperature range | Difference between daily Tmax and Tmin | °C |
| Indices | TXn | TNn | TX10p | TN10p | CSDI | DTR |
|---|---|---|---|---|---|---|
| NW | 0.4 °C | 0.7 °C | −3.0 days | −2.0 days | −2.1 days | −1.1 °C |
| NC | 0.3 °C | 0.4 °C | −3.5 days | −1.8 days | −0.6 days | 0.2 °C |
| NE | 1.0 °C | 0.9 °C | −5.0 days | −6.0 days | −1.9 days | −0.8 °C |
| Areas | TXn | TNn | TX10p | TN10p | CSDI | DTR |
|---|---|---|---|---|---|---|
| NW | 44 | 42 | 34 | 44 | 14 | 52 |
| NC | 28 | 36 | 24 | 34 | 14 | 6 |
| NE | 37 | 30 | 50 | 54 | 24 | 56 |
© 2018 by the authors. Licensee MDPI, Basel, Switzerland. This article is an open access article distributed under the terms and conditions of the Creative Commons Attribution (CC BY) license (http://creativecommons.org/licenses/by/4.0/).
Share and Cite
Hu, W.; Zhang, G.; Zeng, G.; Li, Z. Changes in Extreme Low Temperature Events over Northern China under 1.5 °C and 2.0 °C Warmer Future Scenarios. Atmosphere 2019, 10, 1. https://doi.org/10.3390/atmos10010001
Hu W, Zhang G, Zeng G, Li Z. Changes in Extreme Low Temperature Events over Northern China under 1.5 °C and 2.0 °C Warmer Future Scenarios. Atmosphere. 2019; 10(1):1. https://doi.org/10.3390/atmos10010001
Chicago/Turabian StyleHu, Weiwei, Guwei Zhang, Gang Zeng, and Zhongxian Li. 2019. "Changes in Extreme Low Temperature Events over Northern China under 1.5 °C and 2.0 °C Warmer Future Scenarios" Atmosphere 10, no. 1: 1. https://doi.org/10.3390/atmos10010001