Article

Integration of lncRNA and mRNA Transcriptome Analyses Reveals Genes and Pathways Potentially Involved in Calf Intestinal Growth and Development during the Early Weeks of Life

1
Agriculture and Agri-Food Canada, Sherbrooke Research and Development Centre, Sherbrooke, QC J1M 0C8, Canada
2
Department of Animal Science, McGill University, Ste-Anne-De Bellevue, QC H9X 3V9, Canada
3
Département des Sciences Animales, Université Laval, Québec, QC G1V 0A9, Canada
*
Author to whom correspondence should be addressed.
Genes 2018, 9(3), 142; https://doi.org/10.3390/genes9030142
Submission received: 12 November 2017 / Revised: 15 February 2018 / Accepted: 21 February 2018 / Published: 5 March 2018
(This article belongs to the Section Animal Genetics and Genomics)

Abstract

:
A better understanding of the factors that regulate growth and immune response of the gastrointestinal tract (GIT) of calves will promote informed management practices in calf rearing. This study aimed to explore genomics (messenger RNA (mRNA)) and epigenomics (long non-coding RNA (lncRNA)) mechanisms regulating the development of the rumen and ileum in calves. Thirty-two calves (≈5-days-old) were reared for 96 days following standard procedures. Sixteen calves were humanely euthanized on experiment day 33 (D33) (pre-weaning) and another 16 on D96 (post-weaning) for collection of ileum and rumen tissues. RNA from tissues was subjected to next generation sequencing and 3310 and 4217 mRNAs were differentially expressed (DE) between D33 and D96 in ileum and rumen tissues, respectively. Gene ontology and pathways enrichment of DE genes confirmed their roles in developmental processes, immunity and lipid metabolism. A total of 1568 (63 known and 1505 novel) and 4243 (88 known and 4155 novel) lncRNAs were detected in ileum and rumen tissues, respectively. Cis target gene analysis identified BMPR1A, an important gene for a GIT disease (juvenile polyposis syndrome) in humans, as a candidate cis target gene for lncRNAs in both tissues. LncRNA cis target gene enrichment suggested that lncRNAs might regulate growth and development in both tissues as well as posttranscriptional gene silencing by RNA or microRNA processing in rumen, or disease resistance mechanisms in ileum. This study provides a catalog of bovine lncRNAs and set a baseline for exploring their functions in calf GIT development.

1. Introduction

From birth, calves undergo major physiological and dietary changes including adaptation to extrauterine life (first week of life), pre-ruminant stage (3 to 5 months of age) and weaning [1]. After birth, sufficient colostrum ingestion and microbial colonization is crucial for adequate development of the gastro-intestinal tract (GIT) and mucosal immune system [1,2]. These developmental transitions are accompanied by rapid changes in gene expression controlled by signal-mediated coordination of transcriptional and post-transcriptional mechanisms [3]. The transcriptional mechanisms include the activities of non-coding RNA (ncRNA) and transcription factors as well as epigenetic modifications. While only about 2% of the mammalian genome is transcribed as proteins, about 75–90% is transcribed as ncRNA, the vast majority being long non-coding RNA (lncRNA) [4].
LncRNAs are largely defined as RNA transcripts greater than 200 bp and possess no apparent protein coding potential [4,5]. LncRNAs are involved in the regulation of gene expression through diverse mechanisms including epigenetic modification of DNA, alternative splicing, posttranscriptional gene regulation, messenger RNA (mRNA) stability and translation [6,7,8]. Aided by deep and more sensitive sequencing technologies and computational prediction techniques, the catalogue of lncRNAs of mammalian species continues to rise. In humans, the number of lncRNA genes outstrips protein coding genes [9]. Increasing research has shown roles for lncRNA in many biological processes including genome imprinting, genome regulation, cellular differentiation and development, cardiac development and aging, regulation of innate immune response and disease [10,11,12,13]. LncRNAs can function in cis (cis-regulation), at the site of transcription, or in trans (trans-regulation) and as such participates in multiple networks regulating gene expression and function. The actions of lncRNA controls cell fate during development and dysregulation of these processes are known to underlie some disorders in humans as a result of chromosomal deletions and translocations [14].
A number of studies have provided evidence that lncRNAs are crucial players in cell differentiation and development including developmental regulation of pluripotency, differentiation, specialization, homeostasis, metamorphosis and embryonic development [11,14,15,16,17,18]. Analysis of lncRNA knockout mouse models reveals peri- and postnatal lethal phenotypes, incomplete penetrance, growth defects and defects in the lung, gastrointestinal tract and heart of neonates [19]. In particular, altered expression of several lncRNAs including F19, HOTAIR, ANRIL, FENDRR, etc., are linked with gastric and colon cancer [13]. In addition to tissue specificity of lncRNA expression [4,20,21], it is evident that they play roles in the development of the GIT [22,23,24].
Out of the thousands of lncRNAs identified in humans and other species, distinct roles have been characterized for just a small number [25,26,27] while roles for the vast majority are unknown. In bovine and other farm animal species, only a few studies have attempted a characterization of lncRNA transcripts. A pioneer study characterized the bovine ncRNA transcriptome and identified 23,060 bovine ncRNAs which were primarily intergenic, conserved and had modest correlation with protein coding genes [28]. Analyses of deep RNA sequence data identified 4848 and 584 lncRNAs, mainly intergenic lncRNAs in bovine skin and muscle, respectively [29,30,31]. A large number of lncRNAs (4227) including 18 highly expressed and 26 differentially regulated by diet supplemented with 5% linseed oil were identified in bovine mammary gland [32]. Another study identified 184 intergenic lncRNAs including 36 lncRNAs collocated with 172 milk related quantitative trait loci [33]. These data suggest regulatory roles of lncRNA in bovine.
In order to understand the possible roles of lncRNA during early development, we characterized and performed co-expression analyses of lncRNA and mRNA in the GIT of calves before and after weaning with a view to gaining insights into the occurrence, expression pattern and possible functions of lncRNAs during early growth. Clear understanding of the factors that regulate growth and immune maturation of the GIT of calves will promote informed calf management practices. The objectives of this study align with the mandate of the international consortium for Functional Annotation of Animal Genomes (FAANG, www.faang.org) [34,35], which is to detect functional regulatory elements in animal genomes necessary to understand how the genome is read and translated into complex phenotypes and thus fill the genotype-to-phenotype gap that is missing in current livestock improvement programs.

2. Materials and Methods

2.1. Animals and Management

Procedures for animal management were according to the national codes of practice for the care and use of farm animals in research, teaching and testing [36] and approved by the animal care and ethics committee of Agriculture and Agri-Food Canada.
Thirty-two Holstein calves ≈5 days old were used. Calves were housed in individual pens and raised following standard management procedures for 96 days (experiment day 1 (D1) to D96). Animals were fed milk replacer at 6 L/day for the first four days and 9 L/day thereafter (Goliath XLR 27-16, La Coop, Montreal, QC, Canada) until weaning. Starter feed (Calf starter, Shur-Gain, St-Hyacinthe, QC, Canada) was introduced on D8. Calves were fed hay and starter feed after weaning. Hay, starter feed and water were provided ad libitum. Animals were weaned on D53 and it was gradually put in place; beginning from D43, milk replacer was reduced by half each day and weaning was complete (D53) when animals consumed at least 1 kg of starter feed for three consecutive days. Growth of animals was monitored by bi-weekly body measurements. On experiment D33 (pre-weaning), 16 calves were humanely euthanized and another 16 on D96 (post-weaning) for collection of ileum and rumen tissues. The tissues (mid-rumen and mid-ileum) were aseptically collected, rinsed in phosphate buffered saline to remove digesta, cut into small pieces, snap frozen in liquid nitrogen, transferred into 2 mL cryopreservation tubes and stored at −80°C until used. It should be noted that, eight ileum tissue samples of D33 were contaminated during transportation from the abattoir to the laboratory and were not further considered in this study; and for this reason, only eight ileum tissue samples of D96 were included in the analysis.

2.2. RNA Isolation

Total RNA from rumen (n = 32) and ileum (n = 16) tissues (30 mg/sample) was extracted using miRNeasy Kit (Qiagen Inc., Toronto, ON, Canada) following manufacturer’s recommendations. Briefly, tissues were homogenized in 700 µL TRIzol Reagent (Life Technologies, Burlington, ON, Canada) with a Polytron homogenizer (Polytron PT 10-35 GT, Kinematica AG, Luzern, Switzerland) using a 7 mm probe for 10 s at 12,000 rpm, repeated three times with incubation on ice between repetitions. Following 5 min incubation at room temperature, 140 µL chloroform was added to the mixture and vortexed vigorously for 20 s. The mix was centrifuged (15 min at 12,000× g at 4 °C) and 1.5 volumes ethanol (100%) was added to the aqueous phase. Samples were then transferred to the column and washed steps performed according to kit’s recommendations. Elution was done twice using 30 µL nuclease-free water each time. Total RNA (10 µg) was subjected to DNase treatment with Turbo DNA-free Kit (Ambion Inc. Foster City, CA, USA) to remove contaminating genomic DNA. Nanodrop ND-1000 (NanoDrop Technologies, Wilmington, DE, USA) was used to determine the concentration of RNA (before and after DNase treatment) and the integrity was assessed with Agilent 2100 Bioanalyzer (Agilent Technologies, Santa Clara, CA, USA) using the RNA 6000 Nano Labchip Kit (Agilent Technologies) after DNase treatment. All samples had a RNA integrity number (RIN) ≥8.0.

2.3. Library Preparation and RNA-Sequencing

Total RNA (2 µg) was subjected to ribosomal RNA (rRNA) depletion using Ribo-Zero Gold rRNA Removal Kit (Illumina Inc., San Diego, CA, USA) following company recommendations. Generation of libraries for sequencing was made using NEBNext Ultra Directional RNA Library Prep Kit for Illumina (New England Biolabs, Whitby, ON, Canada) with NEBNext Multiplex Oligos for Illumina® (New England Biolabs) for barcoding the multiplexed samples. Library concentration was measured using the Quant-iT PicoGreen double-stranded DNA (dsDNA) Assay Kit (Life Technologies). Fragment size was estimated using High Sensitivity DNA Analysis Kit (Agilent) with Agilent 2100 Bioanalyzer (Agilent) and quantified by real time quantitative polymerase chain reaction (qPCR) using the Kapa Library Quantification Illumina/ABI Prism Kit protocol (KAPA Biosystems, Wilmington, MA, USA). Six libraries were pooled in equimolar amounts and paired-end sequenced (2 × 126 bp) in one lane on a High Throughput Model flow cell on an Illumina HiSeq 2500 system by The Centre for Applied Genomics, The Hospital for Sick Children, Toronto (http://www.tcag.ca/).

2.4. Sequence Data Processing, Alignment and Identification of Genes

Demultiplexed sequence files in fastq format were processed using a pipeline developed by McGill University and Genome Quebec Innovation Centre (MUGQIC, http://gqinnovationcenter.com/). Briefly, adaptor sequences were removed with Trimmomatic software v0.32 [37] which was set to keep reads longer than 32 bp with a minimum phred score of 30. Alignment of reads to the bovine genome (UMD3.1, v84) was accomplished with STAR v2.5.1b [38]. Following alignment, Picard tools [39] and RNA-SeQC [40] were used to generate quality control read metrics such as percentage of mapped reads and genomic localization (intronic, intergenic, etc.). Uniquely mapped and properly paired reads were used in transcript construction with Cufflinks (v2.2.1) [41] for mRNA identification. Constructed transcripts were compared with Ensembl bovine gene annotation (release 84) to identify expressed mRNAs using Cuffcompare [41].
For lncRNA identification, alignment files or properly mapped reads from all the samples of the same tissue were sorted and merged using Samtools v1.3.1 [42] prior to the transcript construction step with Cufflinks [41] to generate a unique set of all transcripts per tissue. To identify expressed lncRNAs, only transcripts >200 bp were kept and compared with Ensembl bovine gene annotation (release 84) to remove annotated transcripts (mRNA) and transcripts overlapping with other noncoding RNA species (transfer RNA (tRNA), rRNA, small nuclear RNA (snRNA), small nucleolar (snoRNA) and microRNA (miRNA)) using Cuffcompare [41]. Specifically, transcripts with class code “i” (predicted transcript fall entirely within a reference intron), “u” (predicted transcript is intergenic in comparison with known reference transcripts) and “x” (exon of predicted transcript overlaps reference but lies on the opposite strand) when compared against Ensembl-ncRNA databases were retained. Retained transcripts were then assessed for their coding potential using Coding-Non-Coding Index (CNCI) [43] and Coding-Potential Assessment Tool (CPAT) [44] and intersecting transcripts across CNCI score < 0 and CPAT score < 0.5 were blasted against the Swiss-prot database to further filter transcripts with the ability to code for a protein (evalue < 1 × 10⁻⁵) using usearch [45] and also transcripts that possessed an open reading frame with the ability to code for a peptide of 100 or more amino acids.
The retained transcripts were compared with known bovine lncRNA annotation from NONCODE2016 database [46] using Cuffcompare. Transcripts with class codes “=” (predicted transcript has exactly the same introns as the reference transcript), “c” (predicted transcript is contained within the reference transcript) and “j” (predicted transcript is a potential novel isoform that shares at least one splice junction with a reference transcript) were classified as known bovine lncRNAs while the rest were classified as novel lncRNAs. The expression of lncRNAs (known and novel) and mRNAs were quantified in each sample using HTSeq-count (v0.6.1p1) [47] with default settings (-s reverse).

2.5. Differential mRNA and lncRNA Expression Analyses

Differential gene expression (DE) was accomplished with DeSeq2 (v1.14.1) [48], an R package [49] that implements a negative binomial model in DE analysis. Those genes (mRNA or lncRNA) with DESeq2 normalized counts >5 and in at least 10% of libraries were considered truly expressed and were used in DE and pathway analyses. The differences in gene expression (mRNA or lncRNA) between D33 and D96 were considered significant at Benjamini and Hochberg [50] corrected p-value < 0.05.

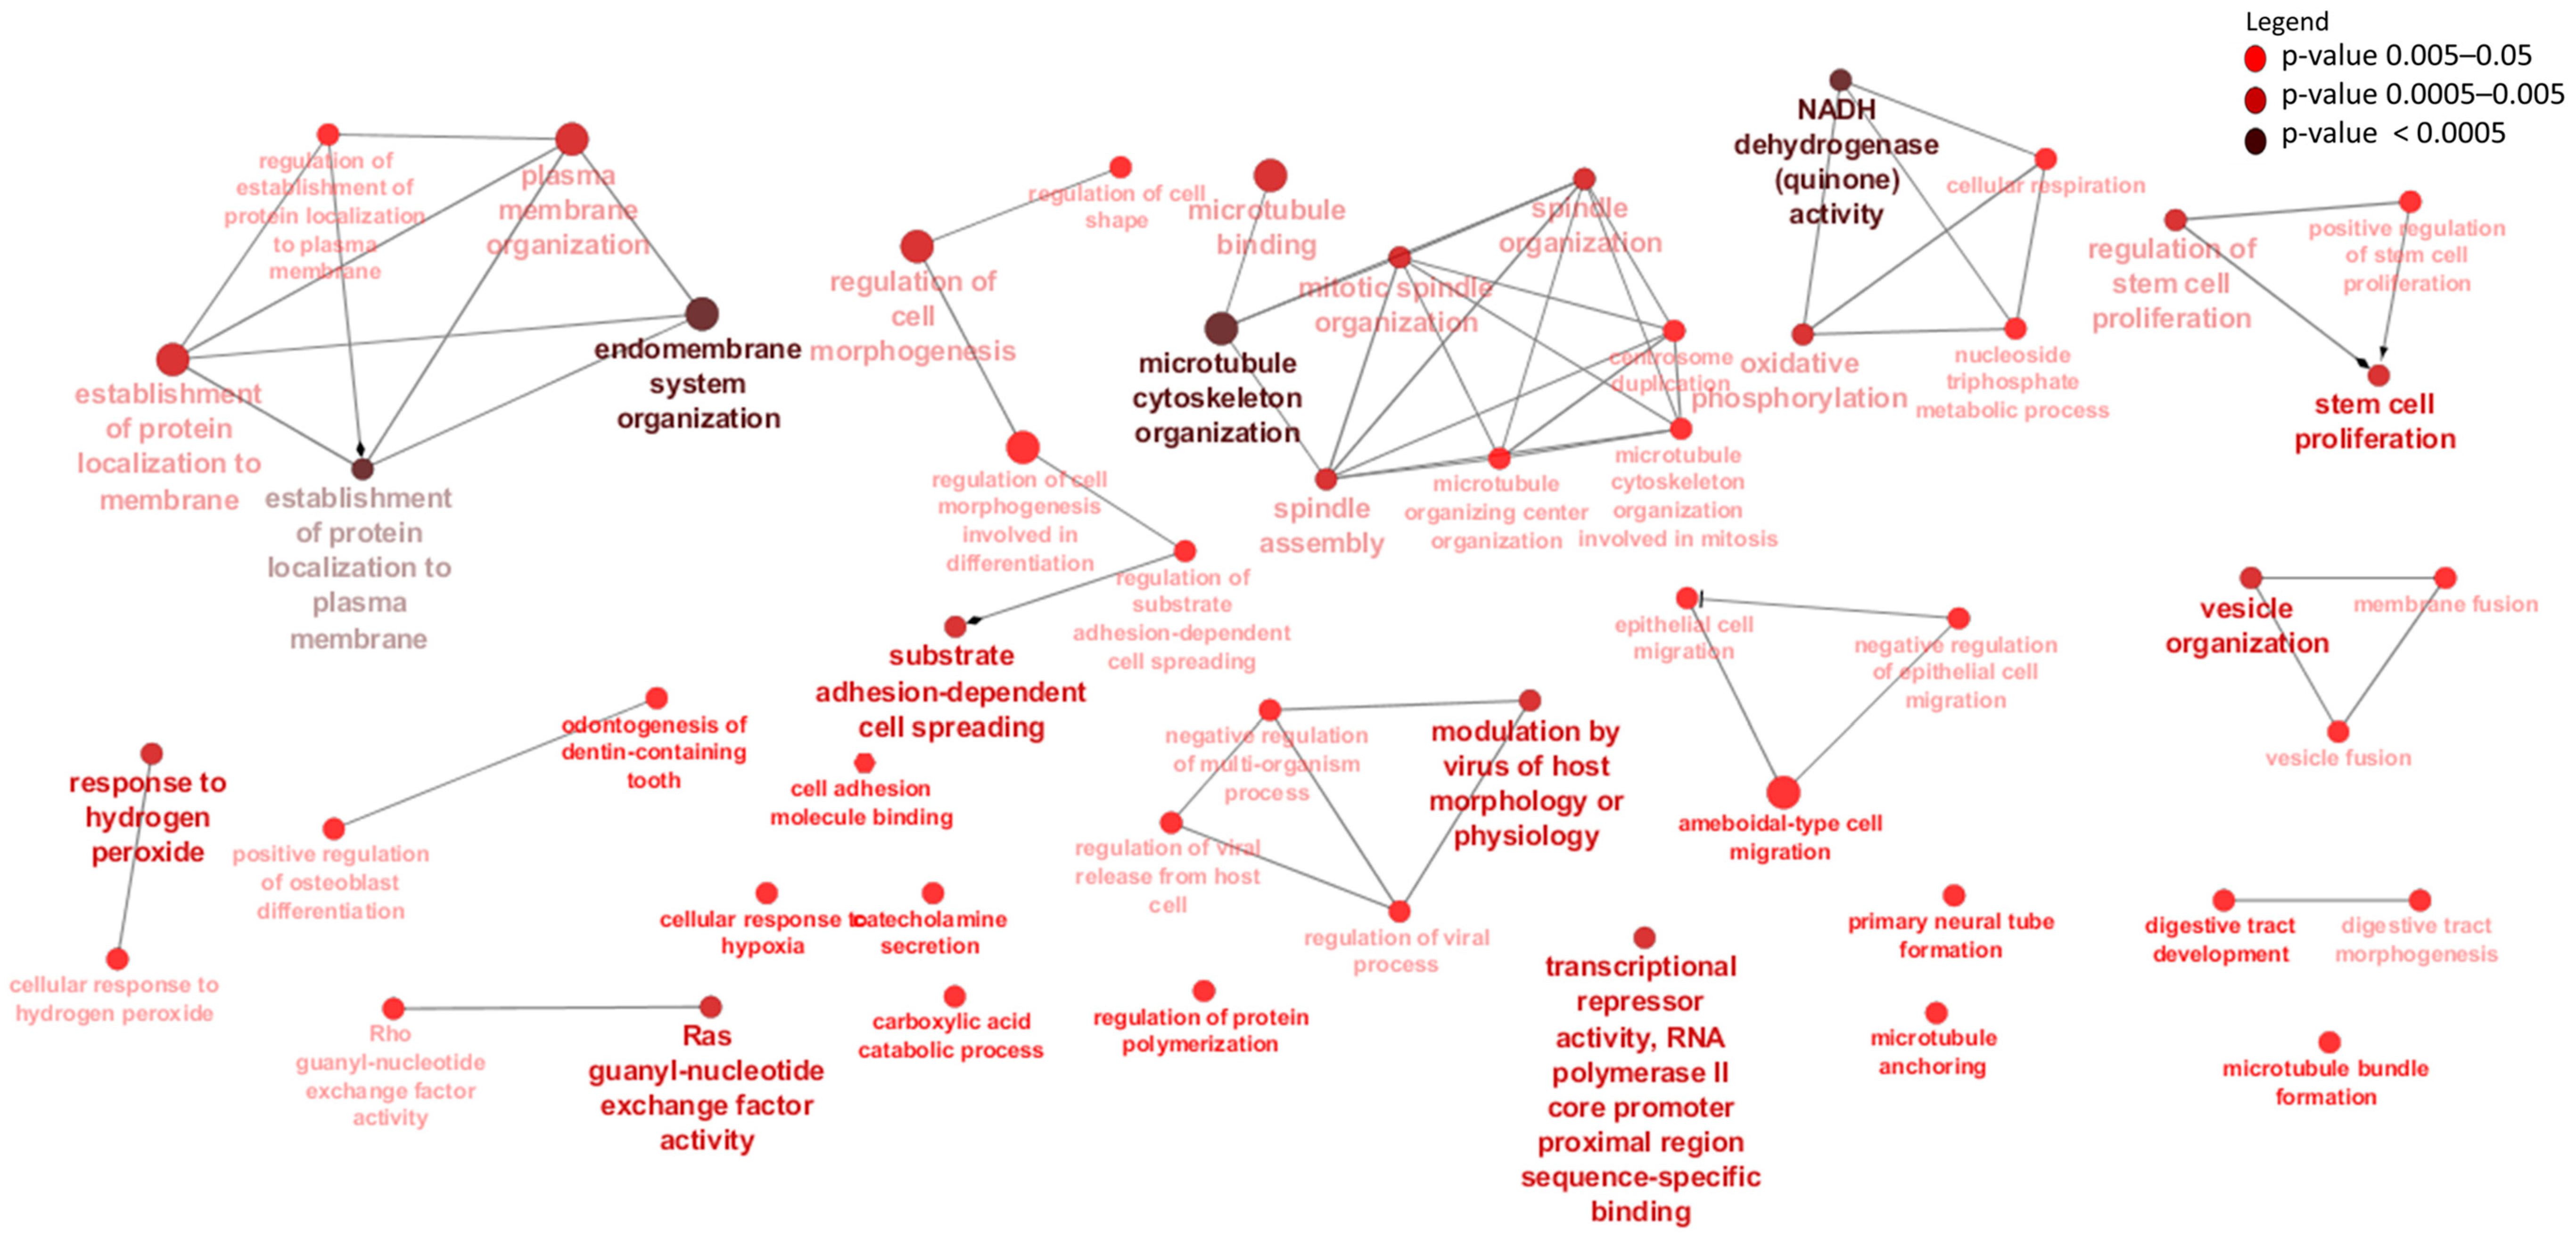
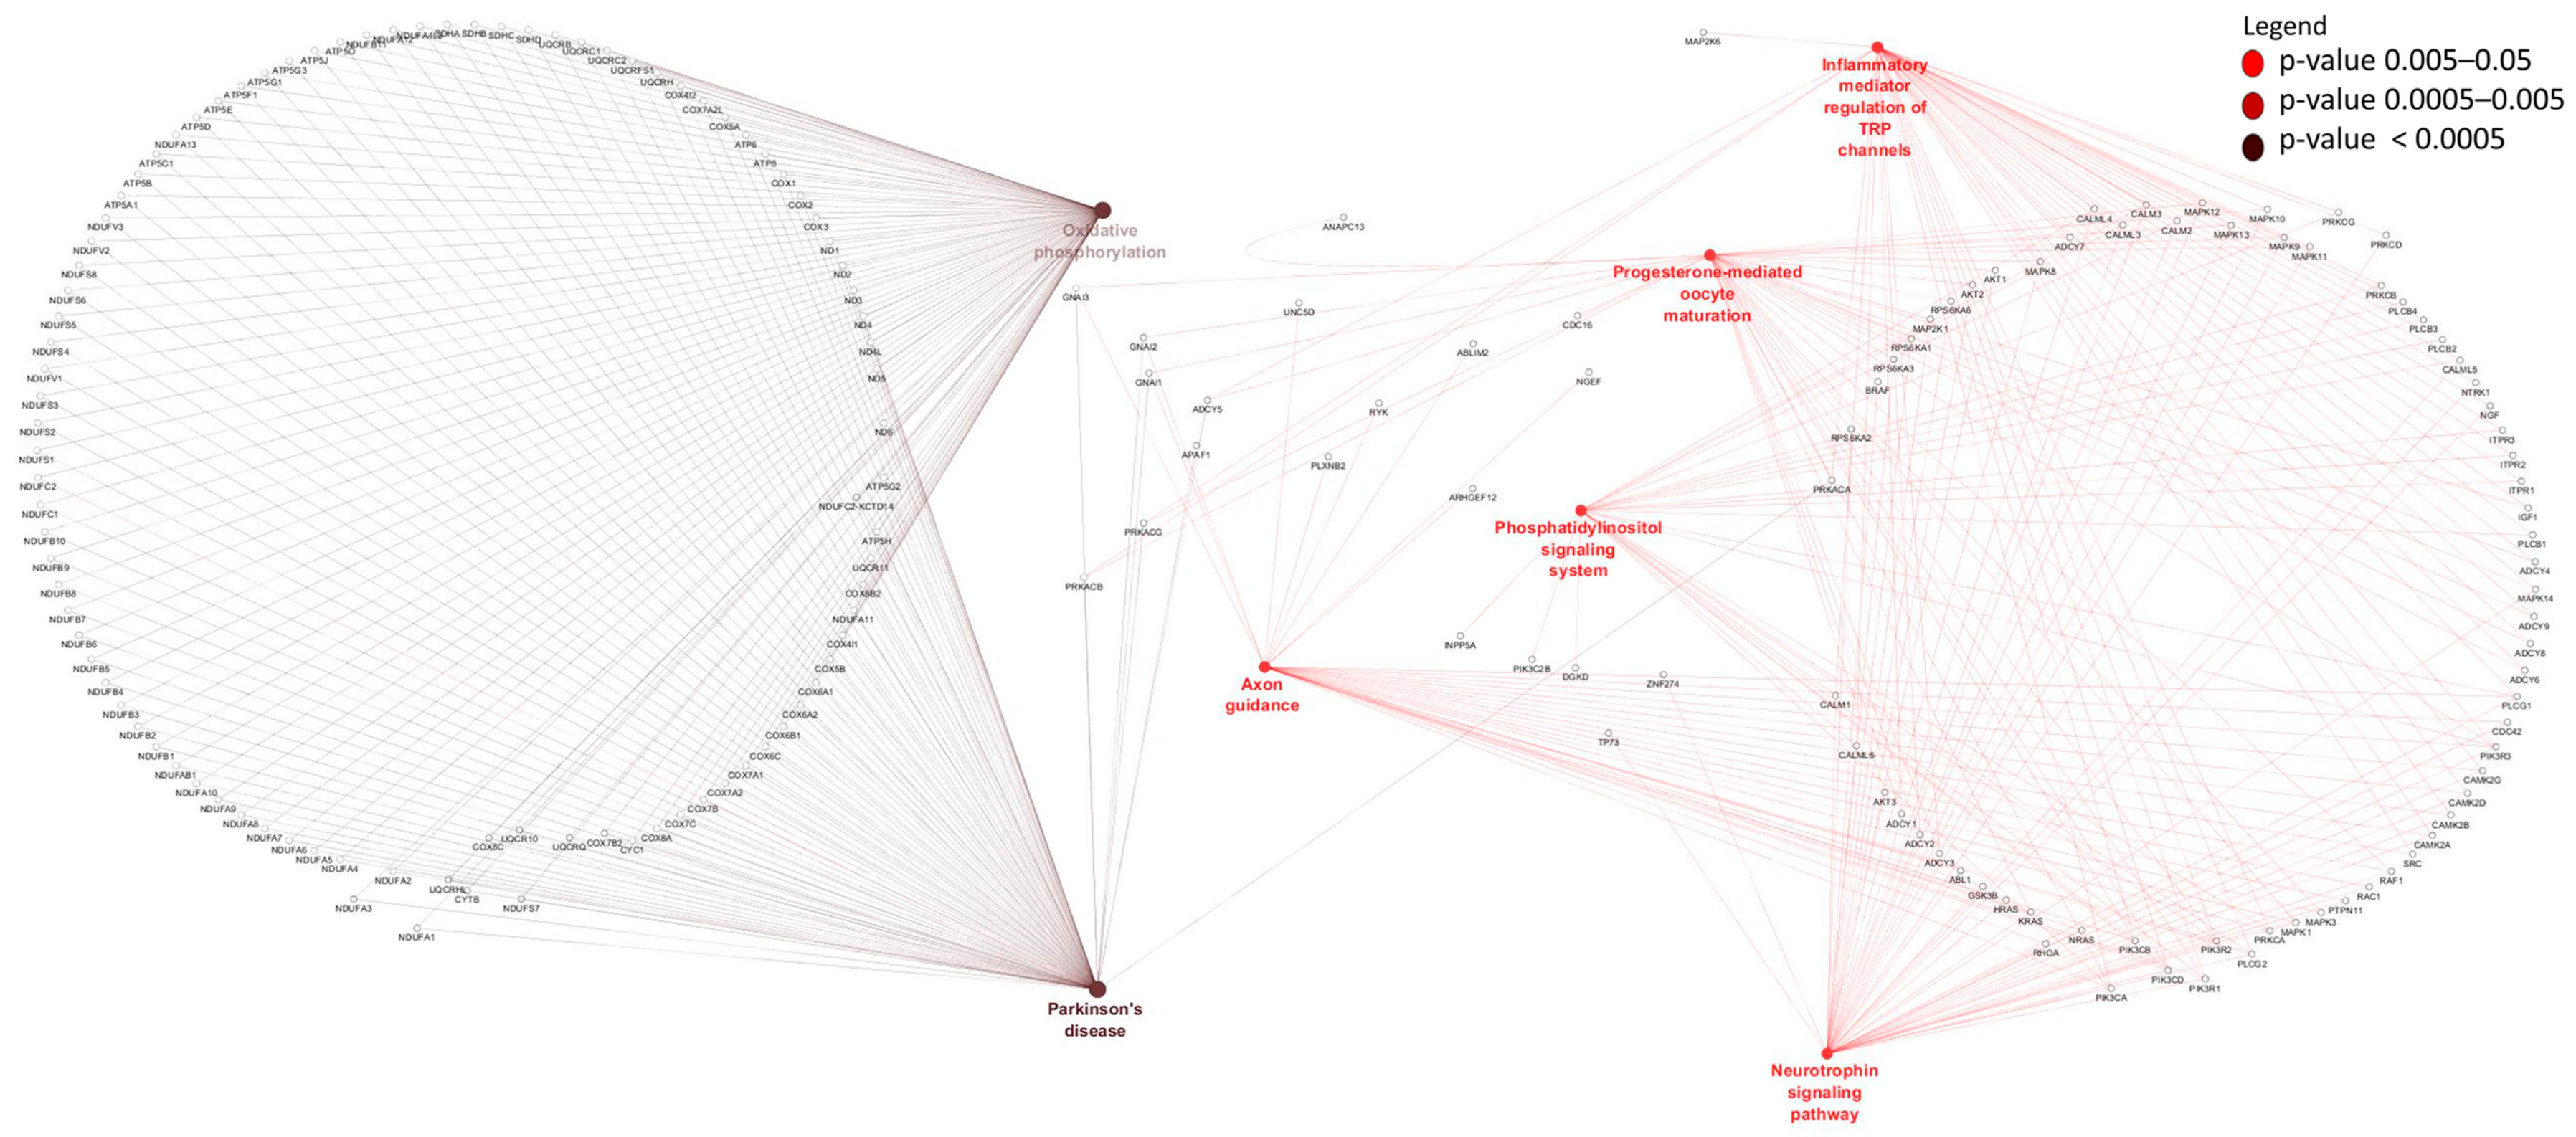
2.6. Gene Ontology and Pathways Enrichment of Differentially Expressed mRNAs

Differentially expressed genes were enriched for gene ontology (GO) and Kyoto Enciclopedia of Genes and Genomes (KEGG) pathways using ClueGO [51]. In this enrichment analysis, a hypergeometric test was used. For GO enrichment, the Bovine GO database and Benjamini and Hochberg (BH) [50] correction for multiple testing controlled p-values and GO with corrected p < 0.05 was considered significantly enriched. Meanwhile, since there are no KEGG databases for bovine species in ClueGO, the human KEGG database was used as background and pathways with uncorrected p < 0.05 were considered significantly enriched.

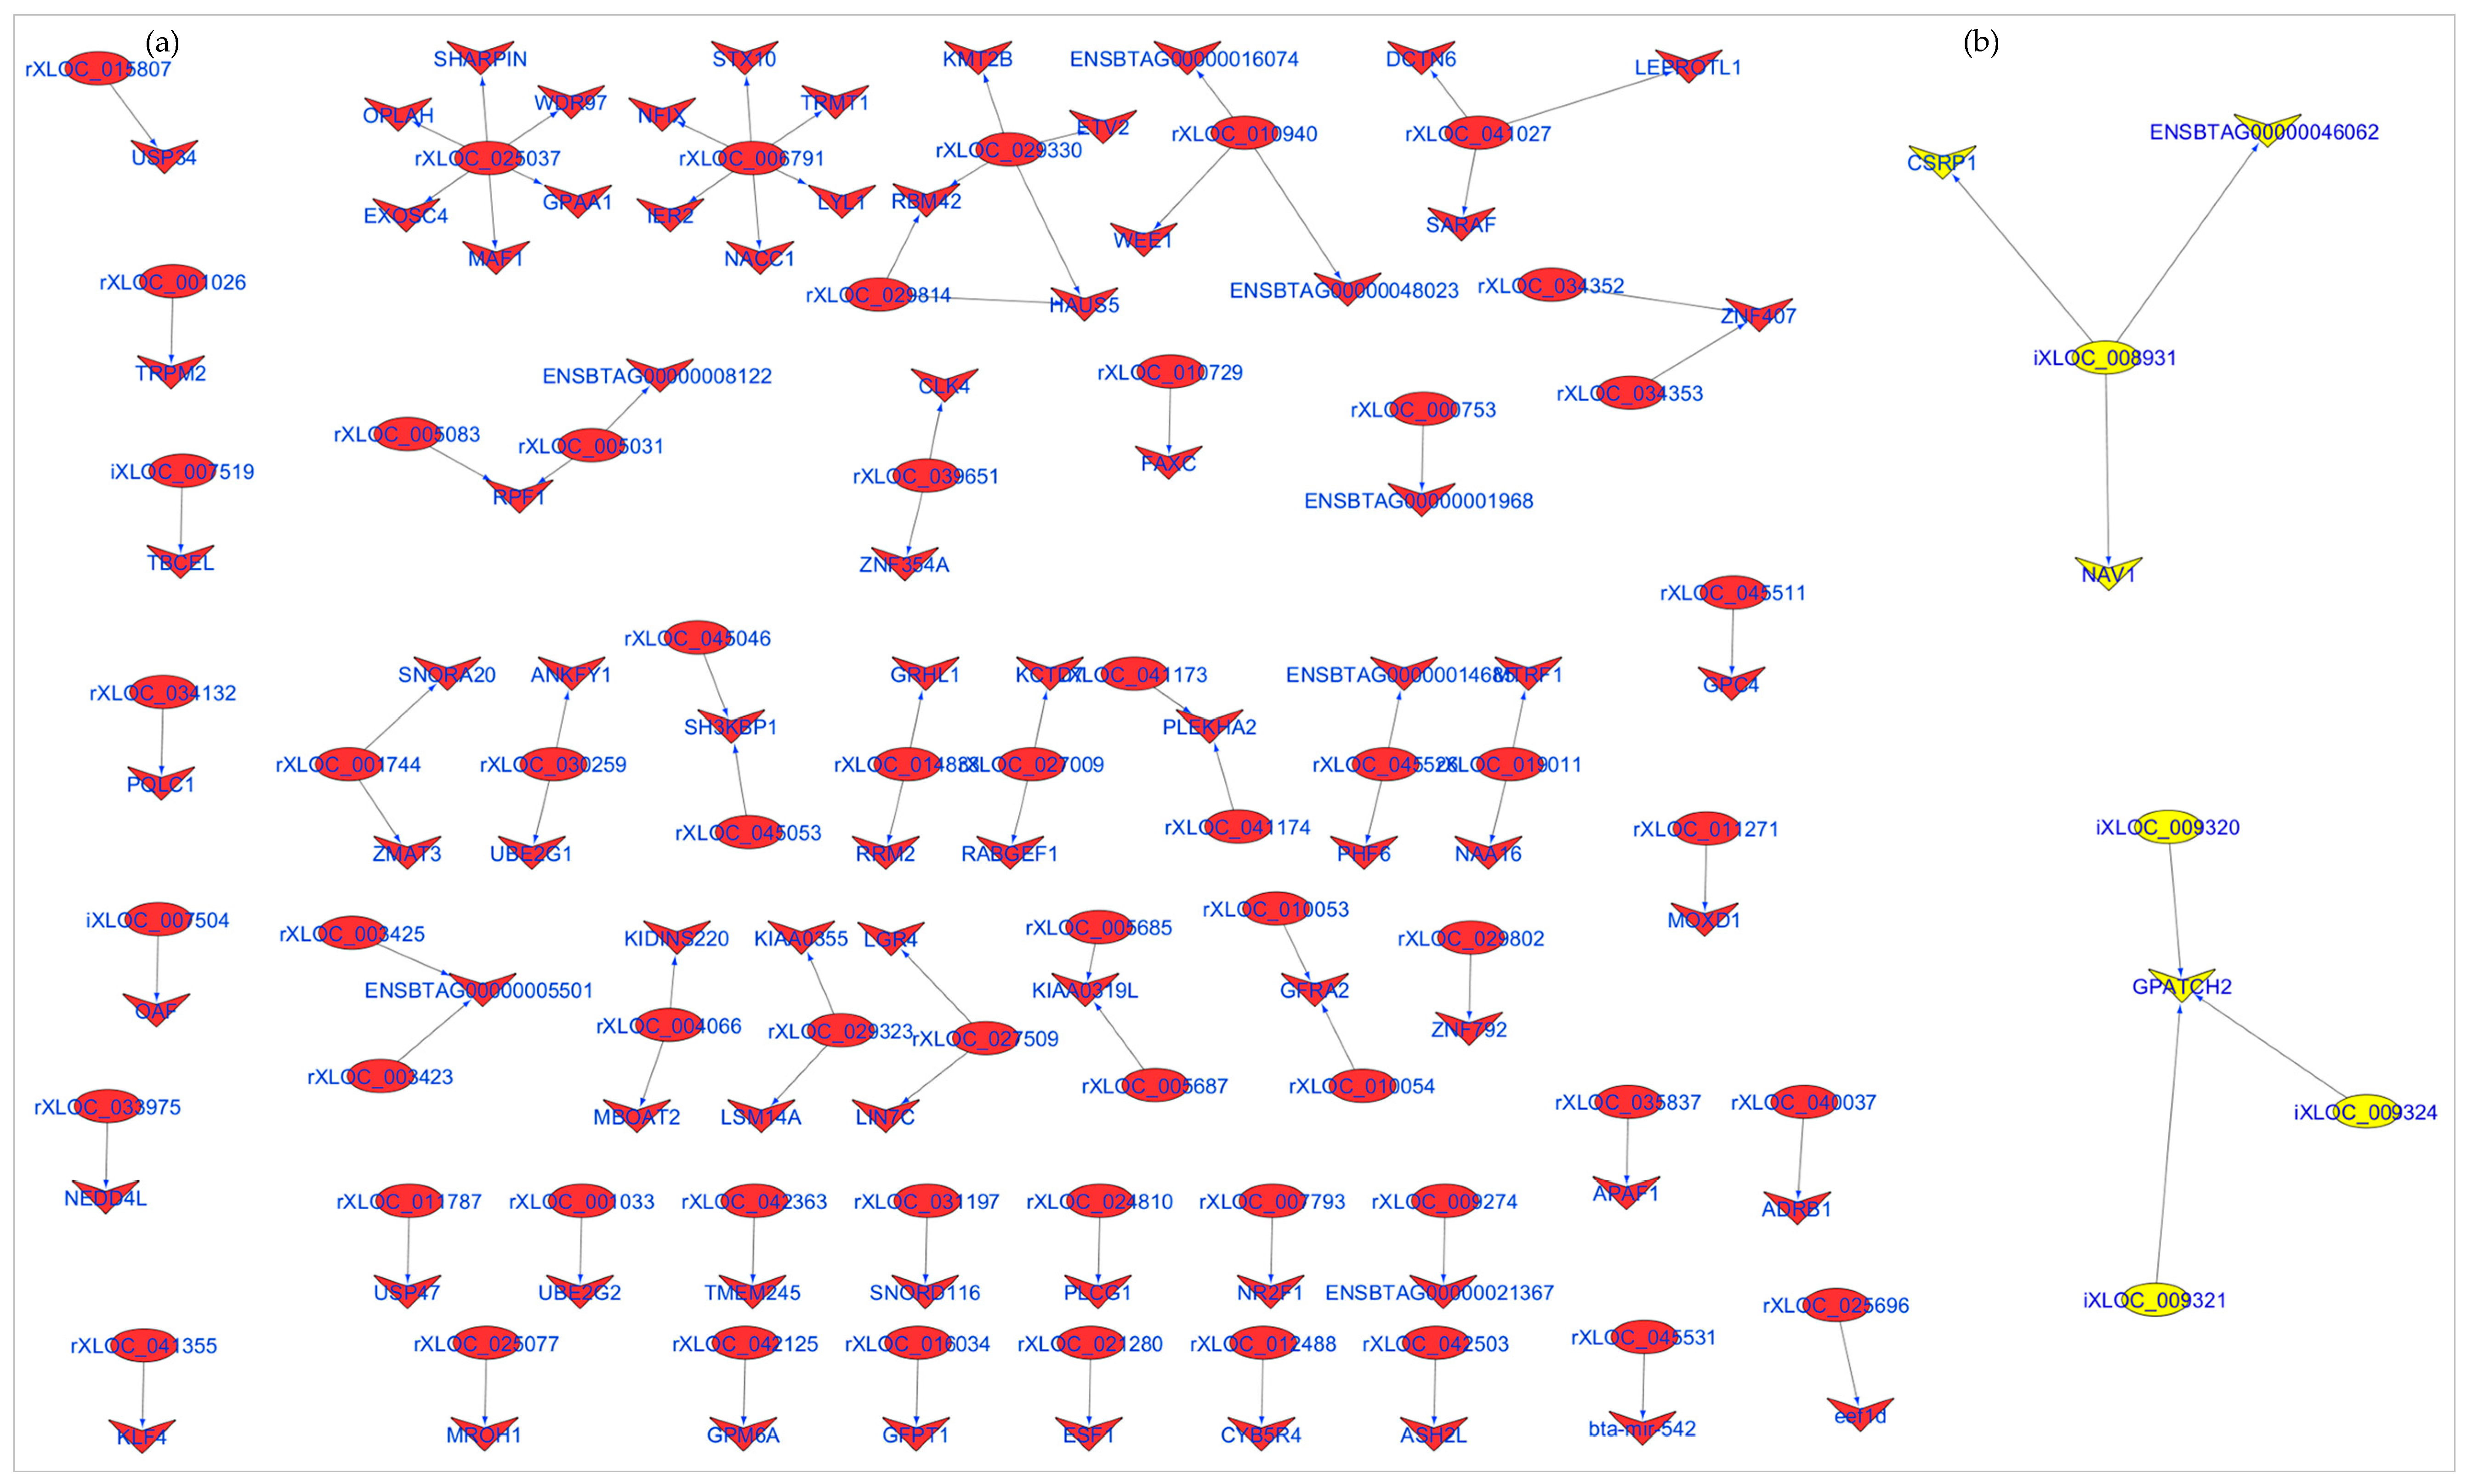
2.7. Identification of lncRNA cis Target Genes and cis Target Gene Enrichment

Since lncRNAs can cis regulate mRNAs, we performed co-expression analysis between mRNAs and lncRNAs in 50 Kb flanking regions of identified lncRNAs. Firstly, we computed Pearson’s correlation coefficients between each pair of lncRNA–mRNA. The mRNAs having significant correlations with lncRNAs at p.BH < 0.05 were considered potential cis target genes for those lncRNAs. Potential cis target genes of lncRNAs were subjected to enrichment analysis with ClueGO using the same procedure as for DE mRNAs. The interaction between DE lncRNAs and their cis target genes were visualized using Cystoscope v3.0 [52].

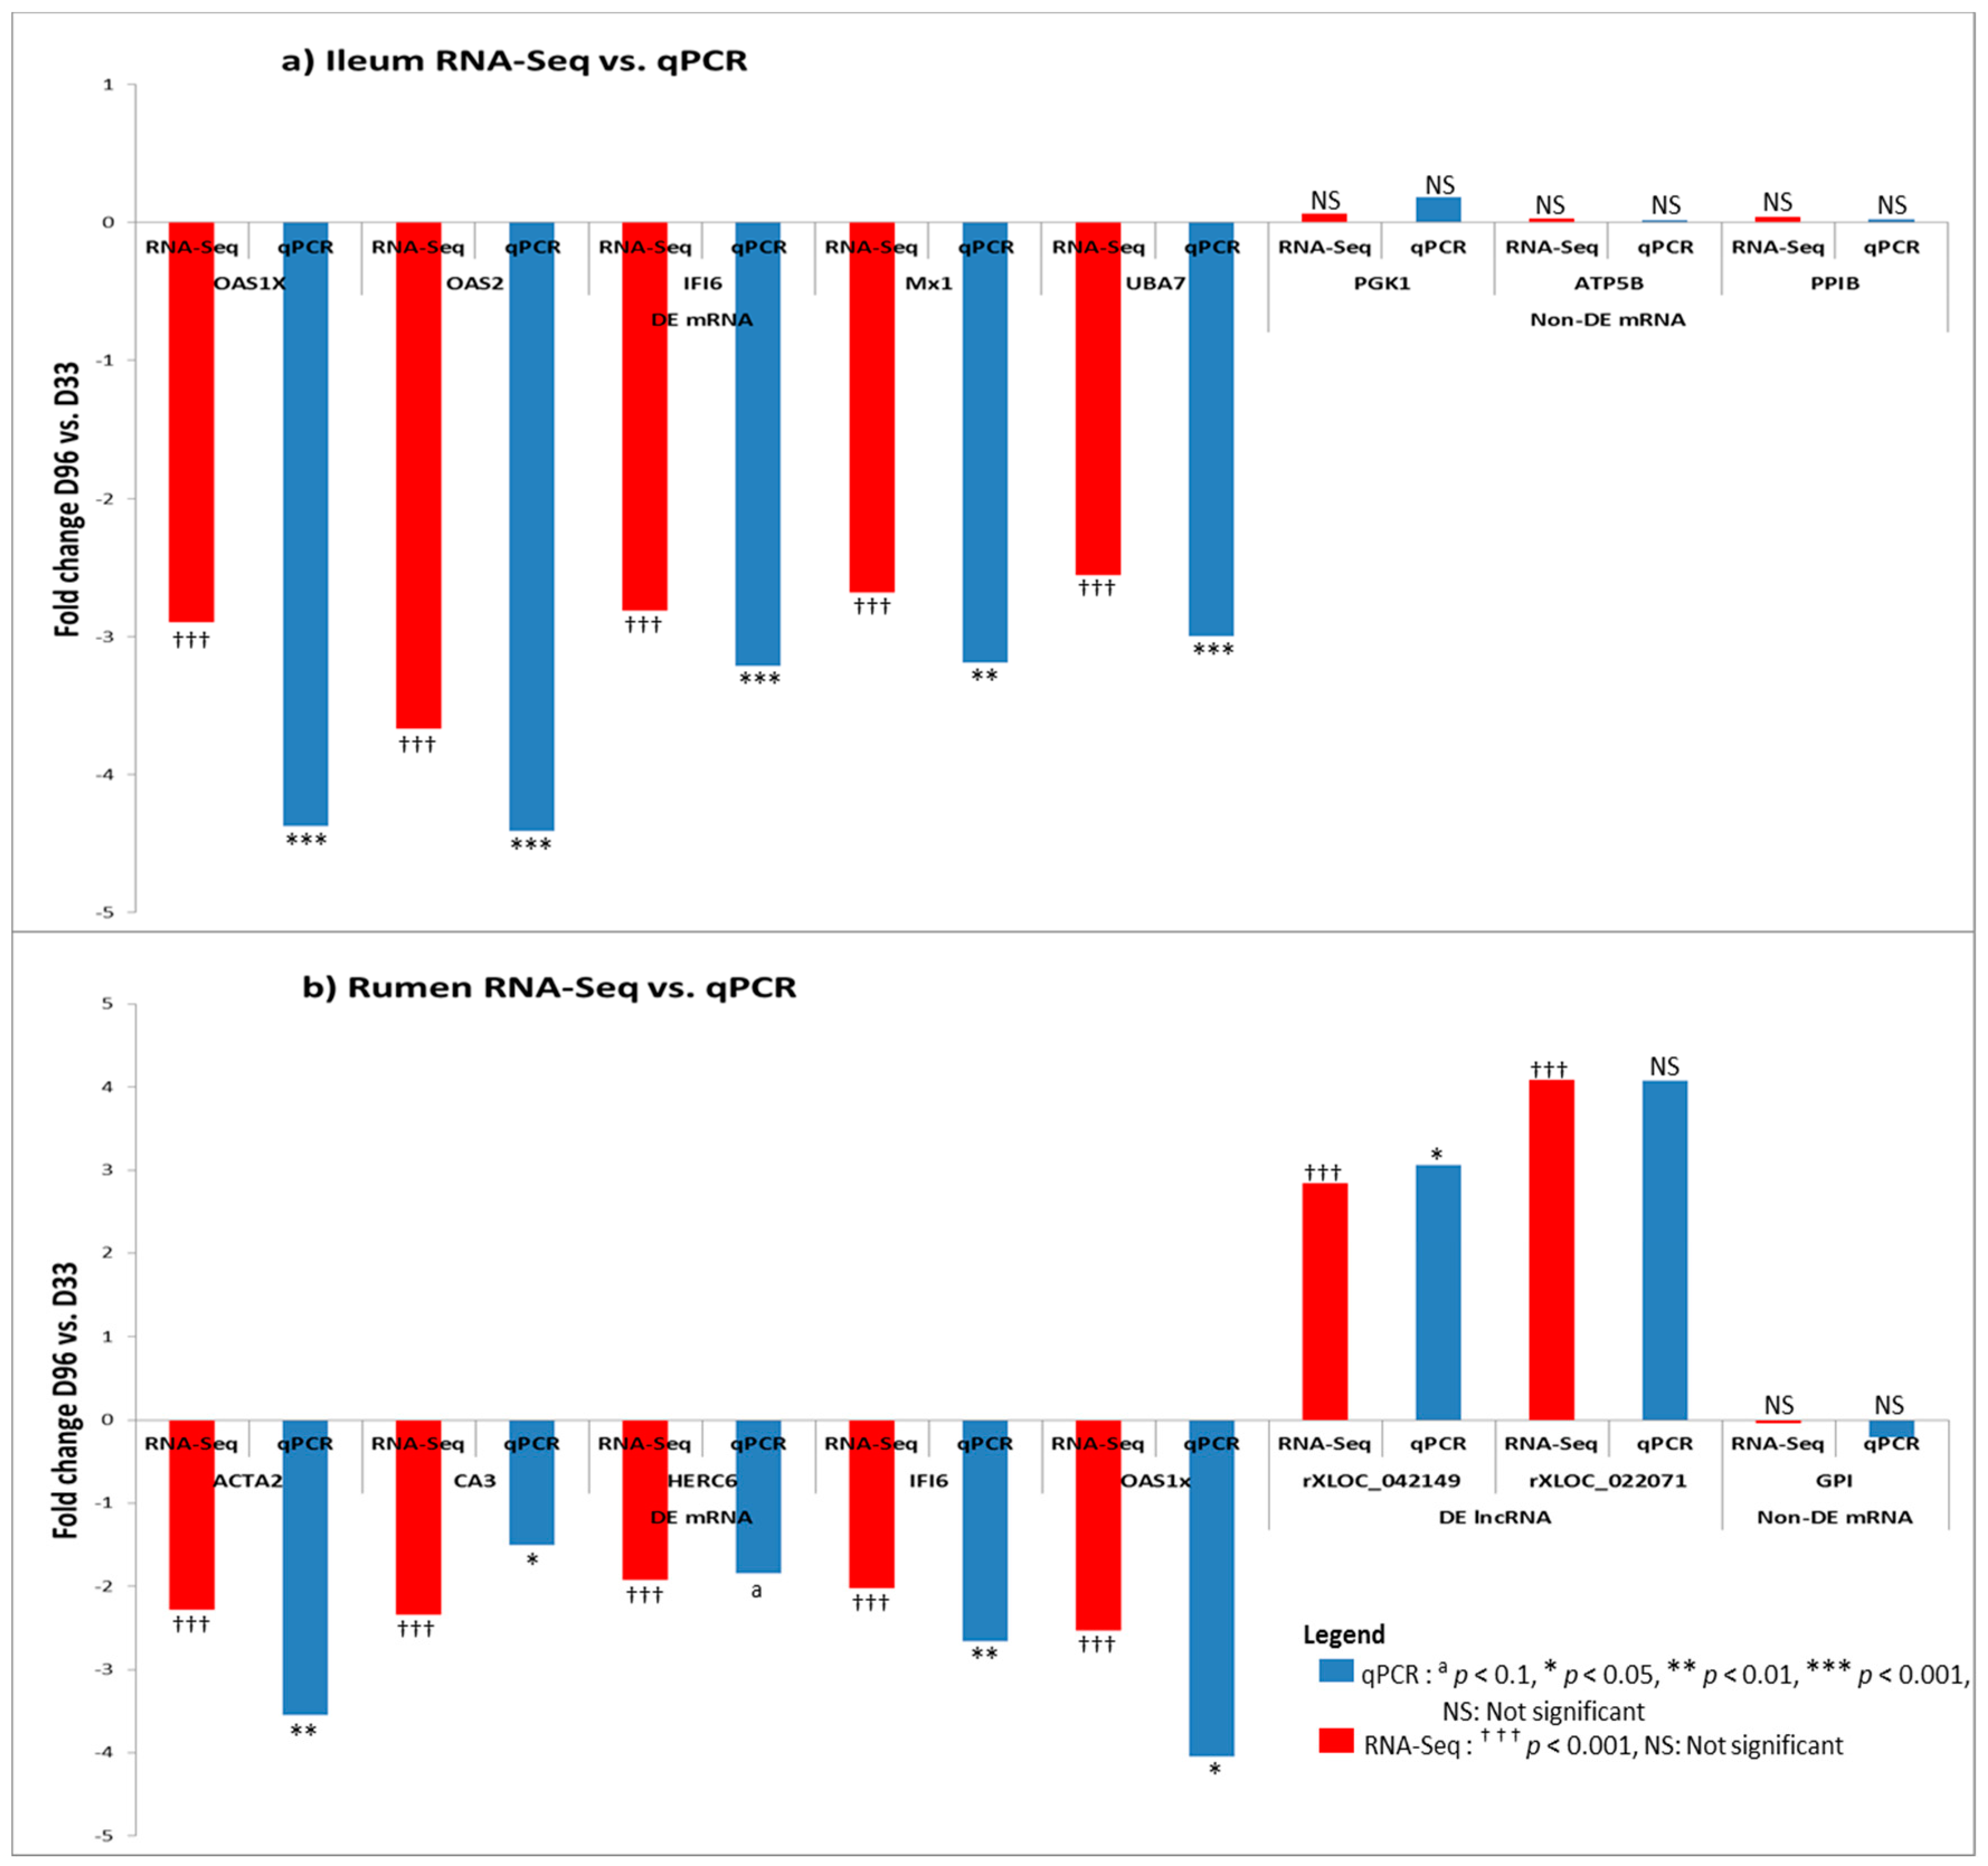
2.8. Real Time Quantitative Polymerase Chain Reaction

Real time quantitative PCR was performed to verify the expression levels of genes DE by the method of RNA-Seq. Four potential housekeeping genes (PPIB, ATP5B, GPI and PGK1) were randomly selected from the list of non-DE genes by RNA-Seq in both tissues. Two DE genes (IFI6 and OAS1X) were randomly selected from the list of DE genes common to both tissues while three DE genes in ileum tissue (OAS2, Mx1 and UBA7) and three DE genes in rumen tissue (ACTA2, CA3 and HERC6) were randomly selected from the list of DE genes unique to these tissues. Moreover, two lncRNAs were selected from rumen DE lncRNAs (rXLOC_042149 and rXLOC_022071; rXLOC denotes lncRNAs expressed in the rumen). Transcript-specific primers for the two lncRNAs and 12 mRNAs were designed using Integrated DNA Technologies Assay tool for real time quantitative PCR (Integrated DNA Technologies Inc., Skokie, IL, USA) (Supplementary Table S1). Reverse transcription was performed with the SuperScript III Reverse Transcriptase (Life Technologies Inc., Burlington, ON, Canada), using aliquots (1 μg) of the same total RNA used in RNA-Seq. The complementary DNA (cDNA) samples were diluted to 20 ng/μL. Real-time PCR reaction mix was composed of 5 µL Power SYBR Green PCR Master Mix (Life Technologies Inc.), 3 µL cDNA and 0.1 U AmpErase Uracil N-Glycosylase (UNG) (Life Technologies). Forward and reverse primer concentrations in the mix are presented in Supplementary Table S1. StepOne Plus Real-Time PCR System (Life Technologies) was used to perform qPCR reactions. The thermal cycling conditions were composed of a step for UNG treatment at 25°C for 5 min followed by an initial denaturation/activation step at 95 °C for 10 min, 45 cycles at 95 °C for 30 s, 60 °C for 60 s. The experiments were carried out in triplicate for each data point. The relative quantification of gene expression was determined using the 2−ΔΔCt method [53]. Normalization with GPI and ATP5B as housekeeping genes was done prior to statistical analysis for ileum and rumen samples, respectively. The housekeeping genes (GPI and ATP5B) were tested and found to be the most stable out of the four potentially stably expressed genes in their respective tissues using NormFinder. Statistical analysis (Student’s t-test with homogeneous variances) was done using MIXED procedure and SAS software (Statistical Analysis System, release 9.4, 2002–2012, SAS Institute Inc., Cary, NC, USA).

3. Results

3.1. RNA-Sequencing and Identification of Expressed mRNA and lncRNA Genes in the Gastrointestinal Tract of Calves

Next-generation RNA sequencing of 48 libraries from ileum and rumen tissues of calves generated a total of 2.5 billion reads (Supplementary Table S2). Following adaptor trimming and size selection, 2.4 billion reads (96%) with length >32 bp and having a phred score >30 were further processed. Out of this number, 91.84% were successfully mapped to the bovine genome (UMD.3.1). Out of successfully mapped reads, 86.17% uniquely mapped reads (Supplementary Table S2) were used in transcript construction.
A total of 24,616 expressed mRNAs were retained after removing transcripts that were not annotated to Ensemble bovine gene annotation release 84. After further filtering of genes with <5 normalized read counts and present in less than 10% of libraries, 15,905 and 15,628 genes in the ileum and rumen tissues, respectively were retained for further analyses (Supplementary Table S3).
After filtering and coding potential evaluation steps, lncRNA transcripts with ≥5 normalized counts and present in ≥10% of libraries resulting in 1568 (63 known and 1505 novel) and 4243 (88 known and 4155 novel) lncRNAs were considered expressed in ileum and rumen tissues, respectively (Supplementary Table S4a–d) and used in further analyses. Among them, 51 lncRNAs were common to both tissues (Supplementary Table S4e).

3.2. Genomic Features and Characteristics of Expressed lncRNAs

Majority (44.70%) of identified lncRNA transcripts were 200–999 bp long followed by transcripts 1000–2499 bp long (29.25%) while transcripts >9999 bp constituted only 1.25% of identified lncRNAs (Supplementary Table S5a). Two-hundred or more lncRNA genes/transcripts were located on 22 chromosomes (Bta 1, 2, 3, 4, 5, 7, 8, 9, 11, 12, 13, 14, 15, 16, 18, 19, 21, 24, 26, 28, 29 and x) (Supplementary Table S5b). Identified lncRNA genes were composed of one to five transcripts with majority composed of one transcript (95.85%) (Supplementary Table S5c). LncRNA transcripts were composed of one to 15 exons (Supplementary Table S5c). LncRNAs were classified based on their genomic locations into 11 classes with the reference of Ensembl bovine protein coding gene annotation (release 84) and majority (93%) were intergenic lncRNAs located at >1 Kb away from the nearest mRNA (Supplementary Table S5d).

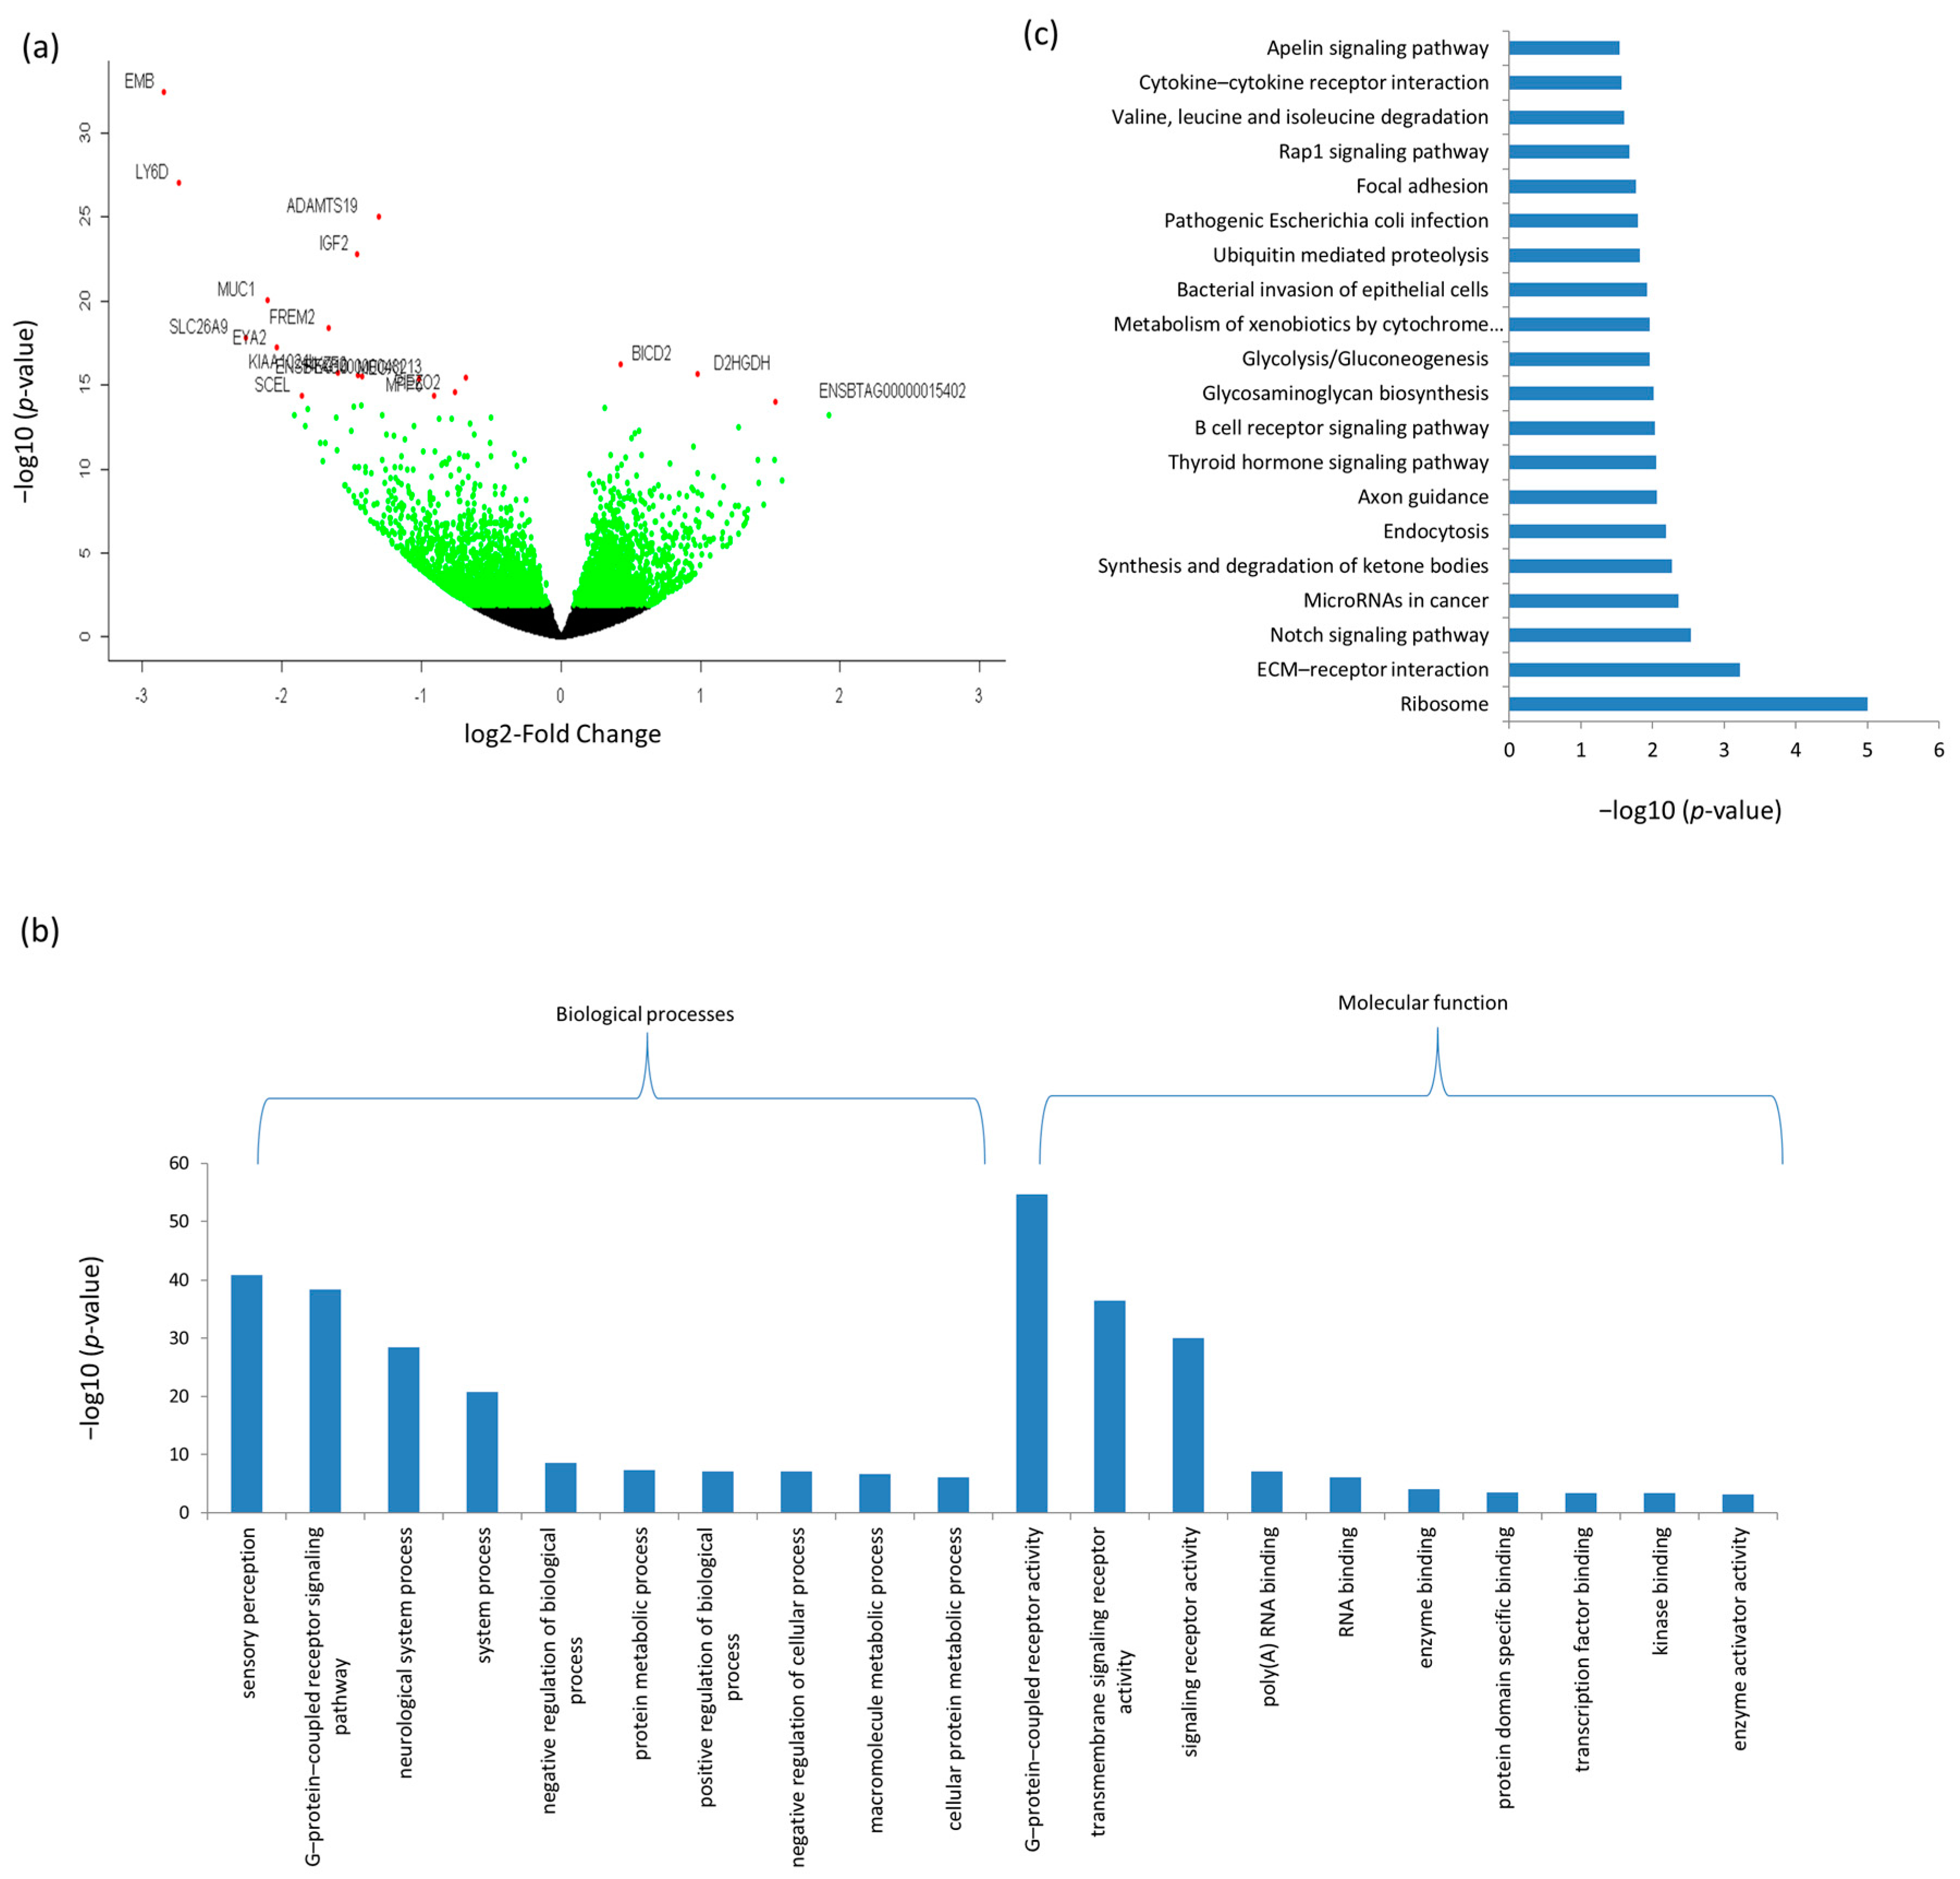
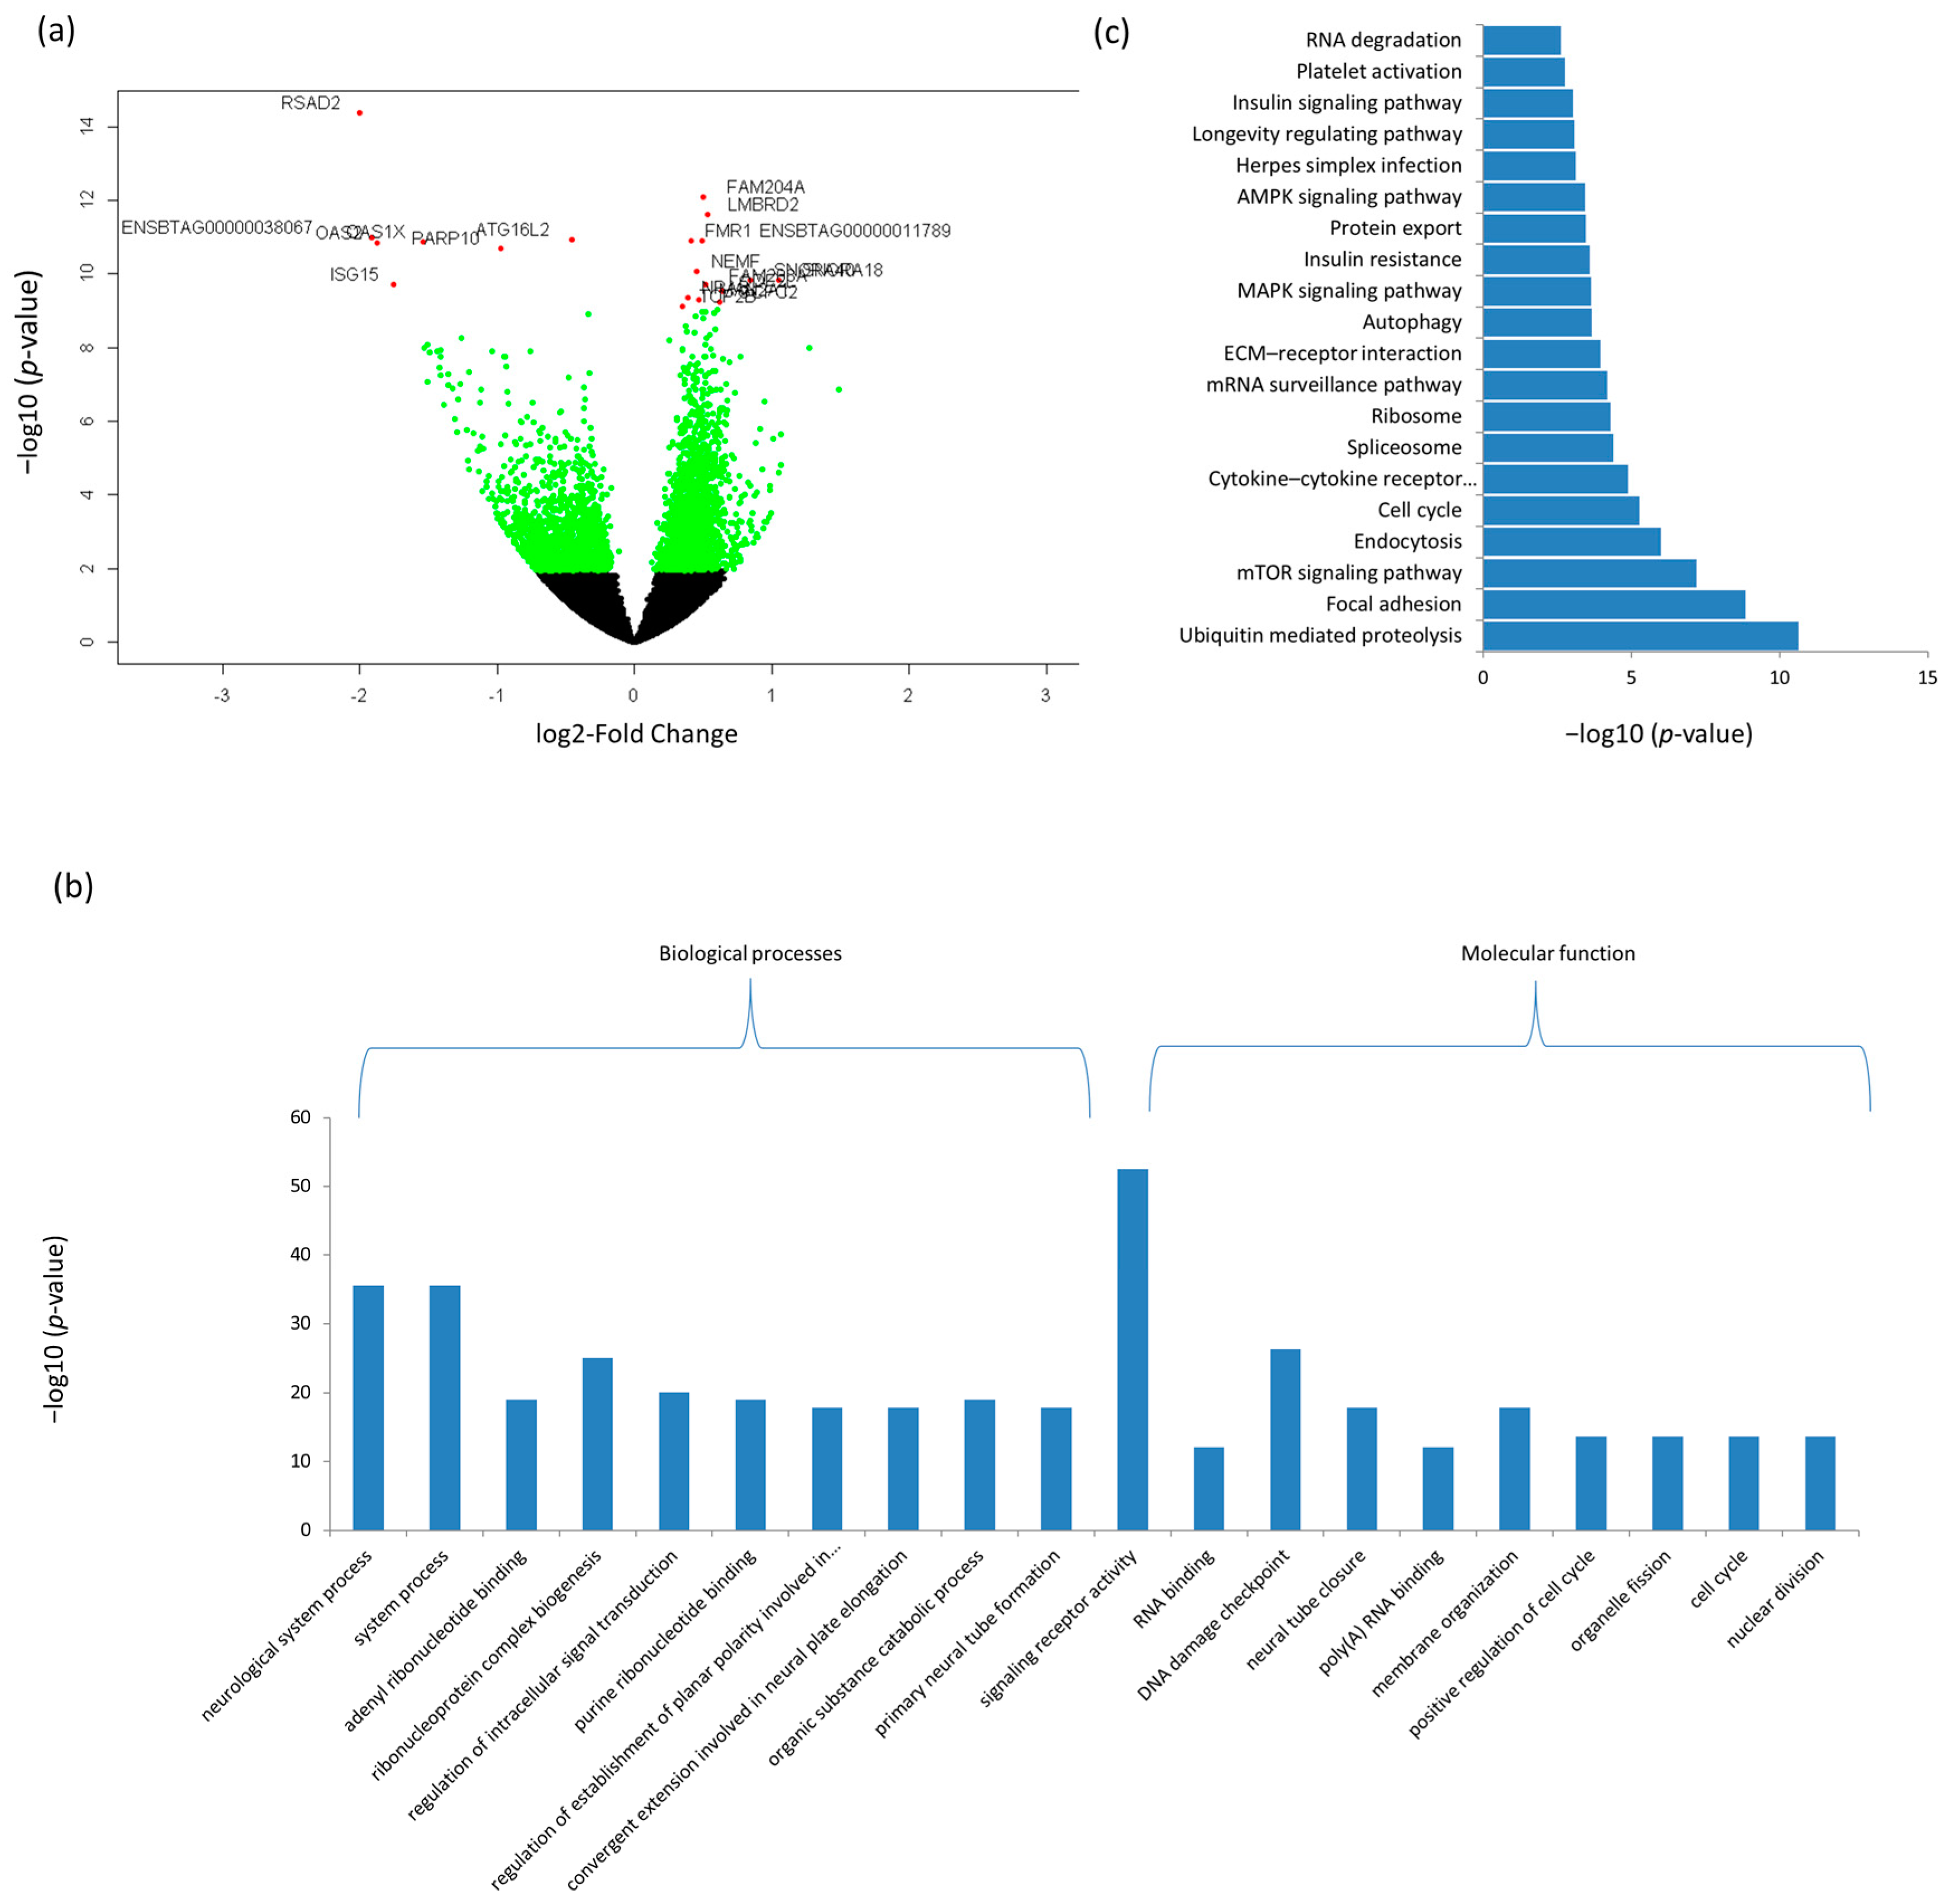
3.3. Differentially Expressed mRNAs and Enrichment Analyses

To identify differentially expressed genes, raw read counts of retained transcripts (mRNA or lncRNA) were imported into DESeq2 [48]. DESeq2 normalizes read counts by calculating a size factor for each sample to correct for library size and RNA composition bias. A total of 3310 and 4217 mRNAs were DE between D33 and D96 in Ileum and rumen tissues, respectively (Figure 1a and Figure 2a, Supplementary Table S6a,b). Out of this number, 850 DE mRNAs were common to both tissues (Supplementary Table S6c). The top 20 most significant DE mRNAs are shown in Table 1 and Figure 1a and Figure 2a. Embigin (EMB) and radical S-adenosyl methionine domain containing 2 (RSAD2) were the most significant DE mRNAs for rumen and ileum tissues, respectively (Table 1).
A total of 459 biological process (BP) and 52 molecular function (MF) GO terms were significantly enriched for rumen DE mRNAs and the most enriched terms were sensory perception (p = 1.3 × 10−41) and G-protein coupled receptor activity (p = 2.4 × 10−55), respectively (Figure 1b and Supplementary Table S7a). Moreover, rumen DE mRNAs were also significantly enriched for 36 KEGG pathways and the most significantly enriched pathway was Ribosome (p = 1.00 × 10−05) (Figure 1c and Figure S1 and Table S7b).
A total of 590 BP-GO and 110 MF-GO terms were significantly enriched for ileum DE mRNAs and the most enriched terms were neurological system process (p = 2.2 × 10−43) and signaling receptor activity (p = 5 × 10−50), respectively (Figure 2b and Table S7c). Moreover, ileum DE mRNAs were significantly enriched for 86 KEGG pathways and the most significantly enriched pathway was Ubiquitin mediated proteolysis (p = 23.0 × 10⁻¹²) (Figure 2c and Table S7d).

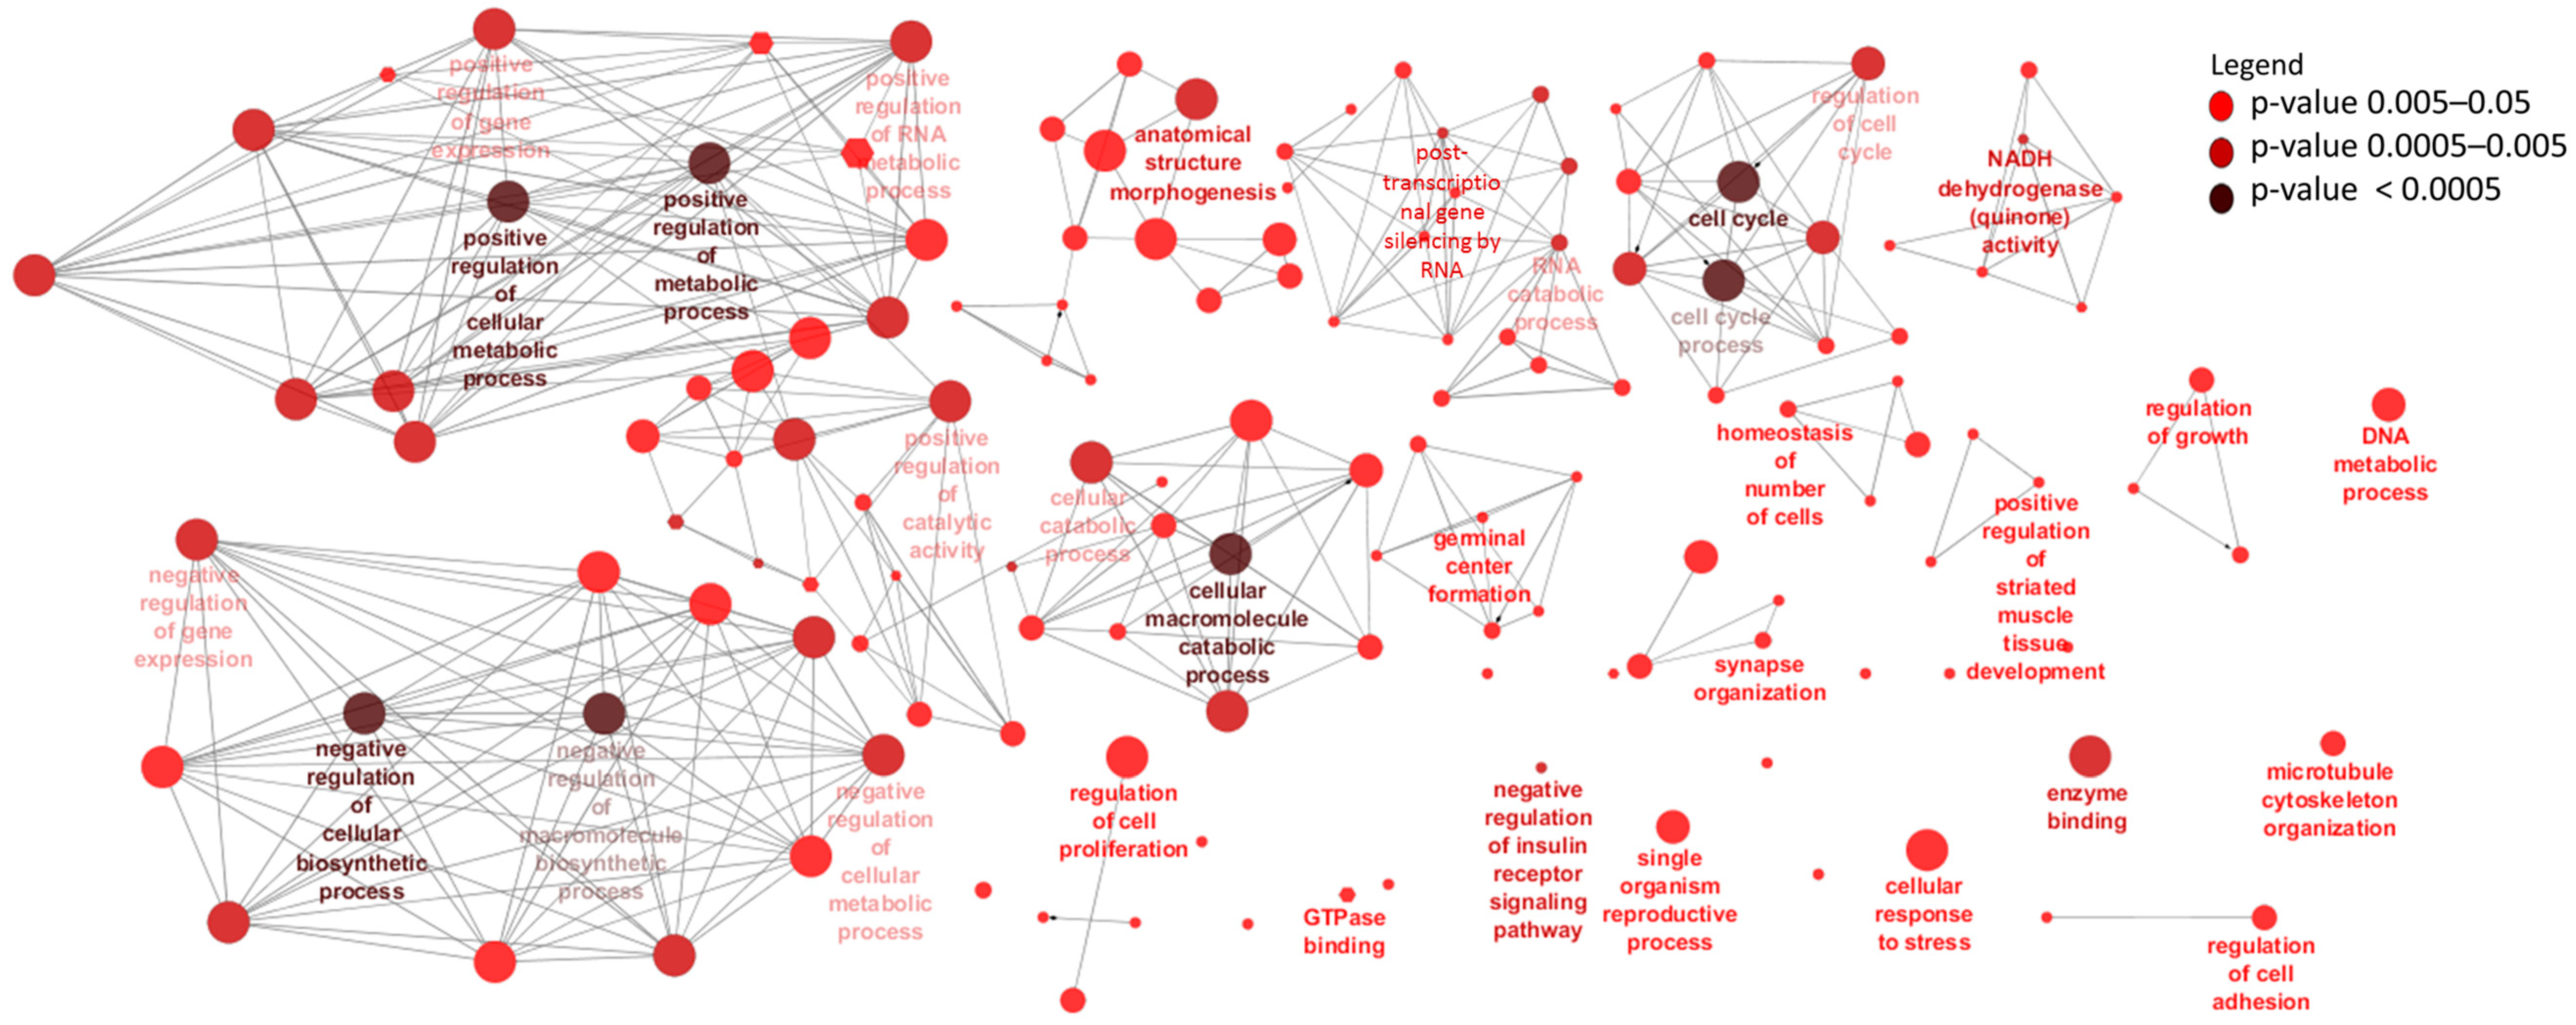
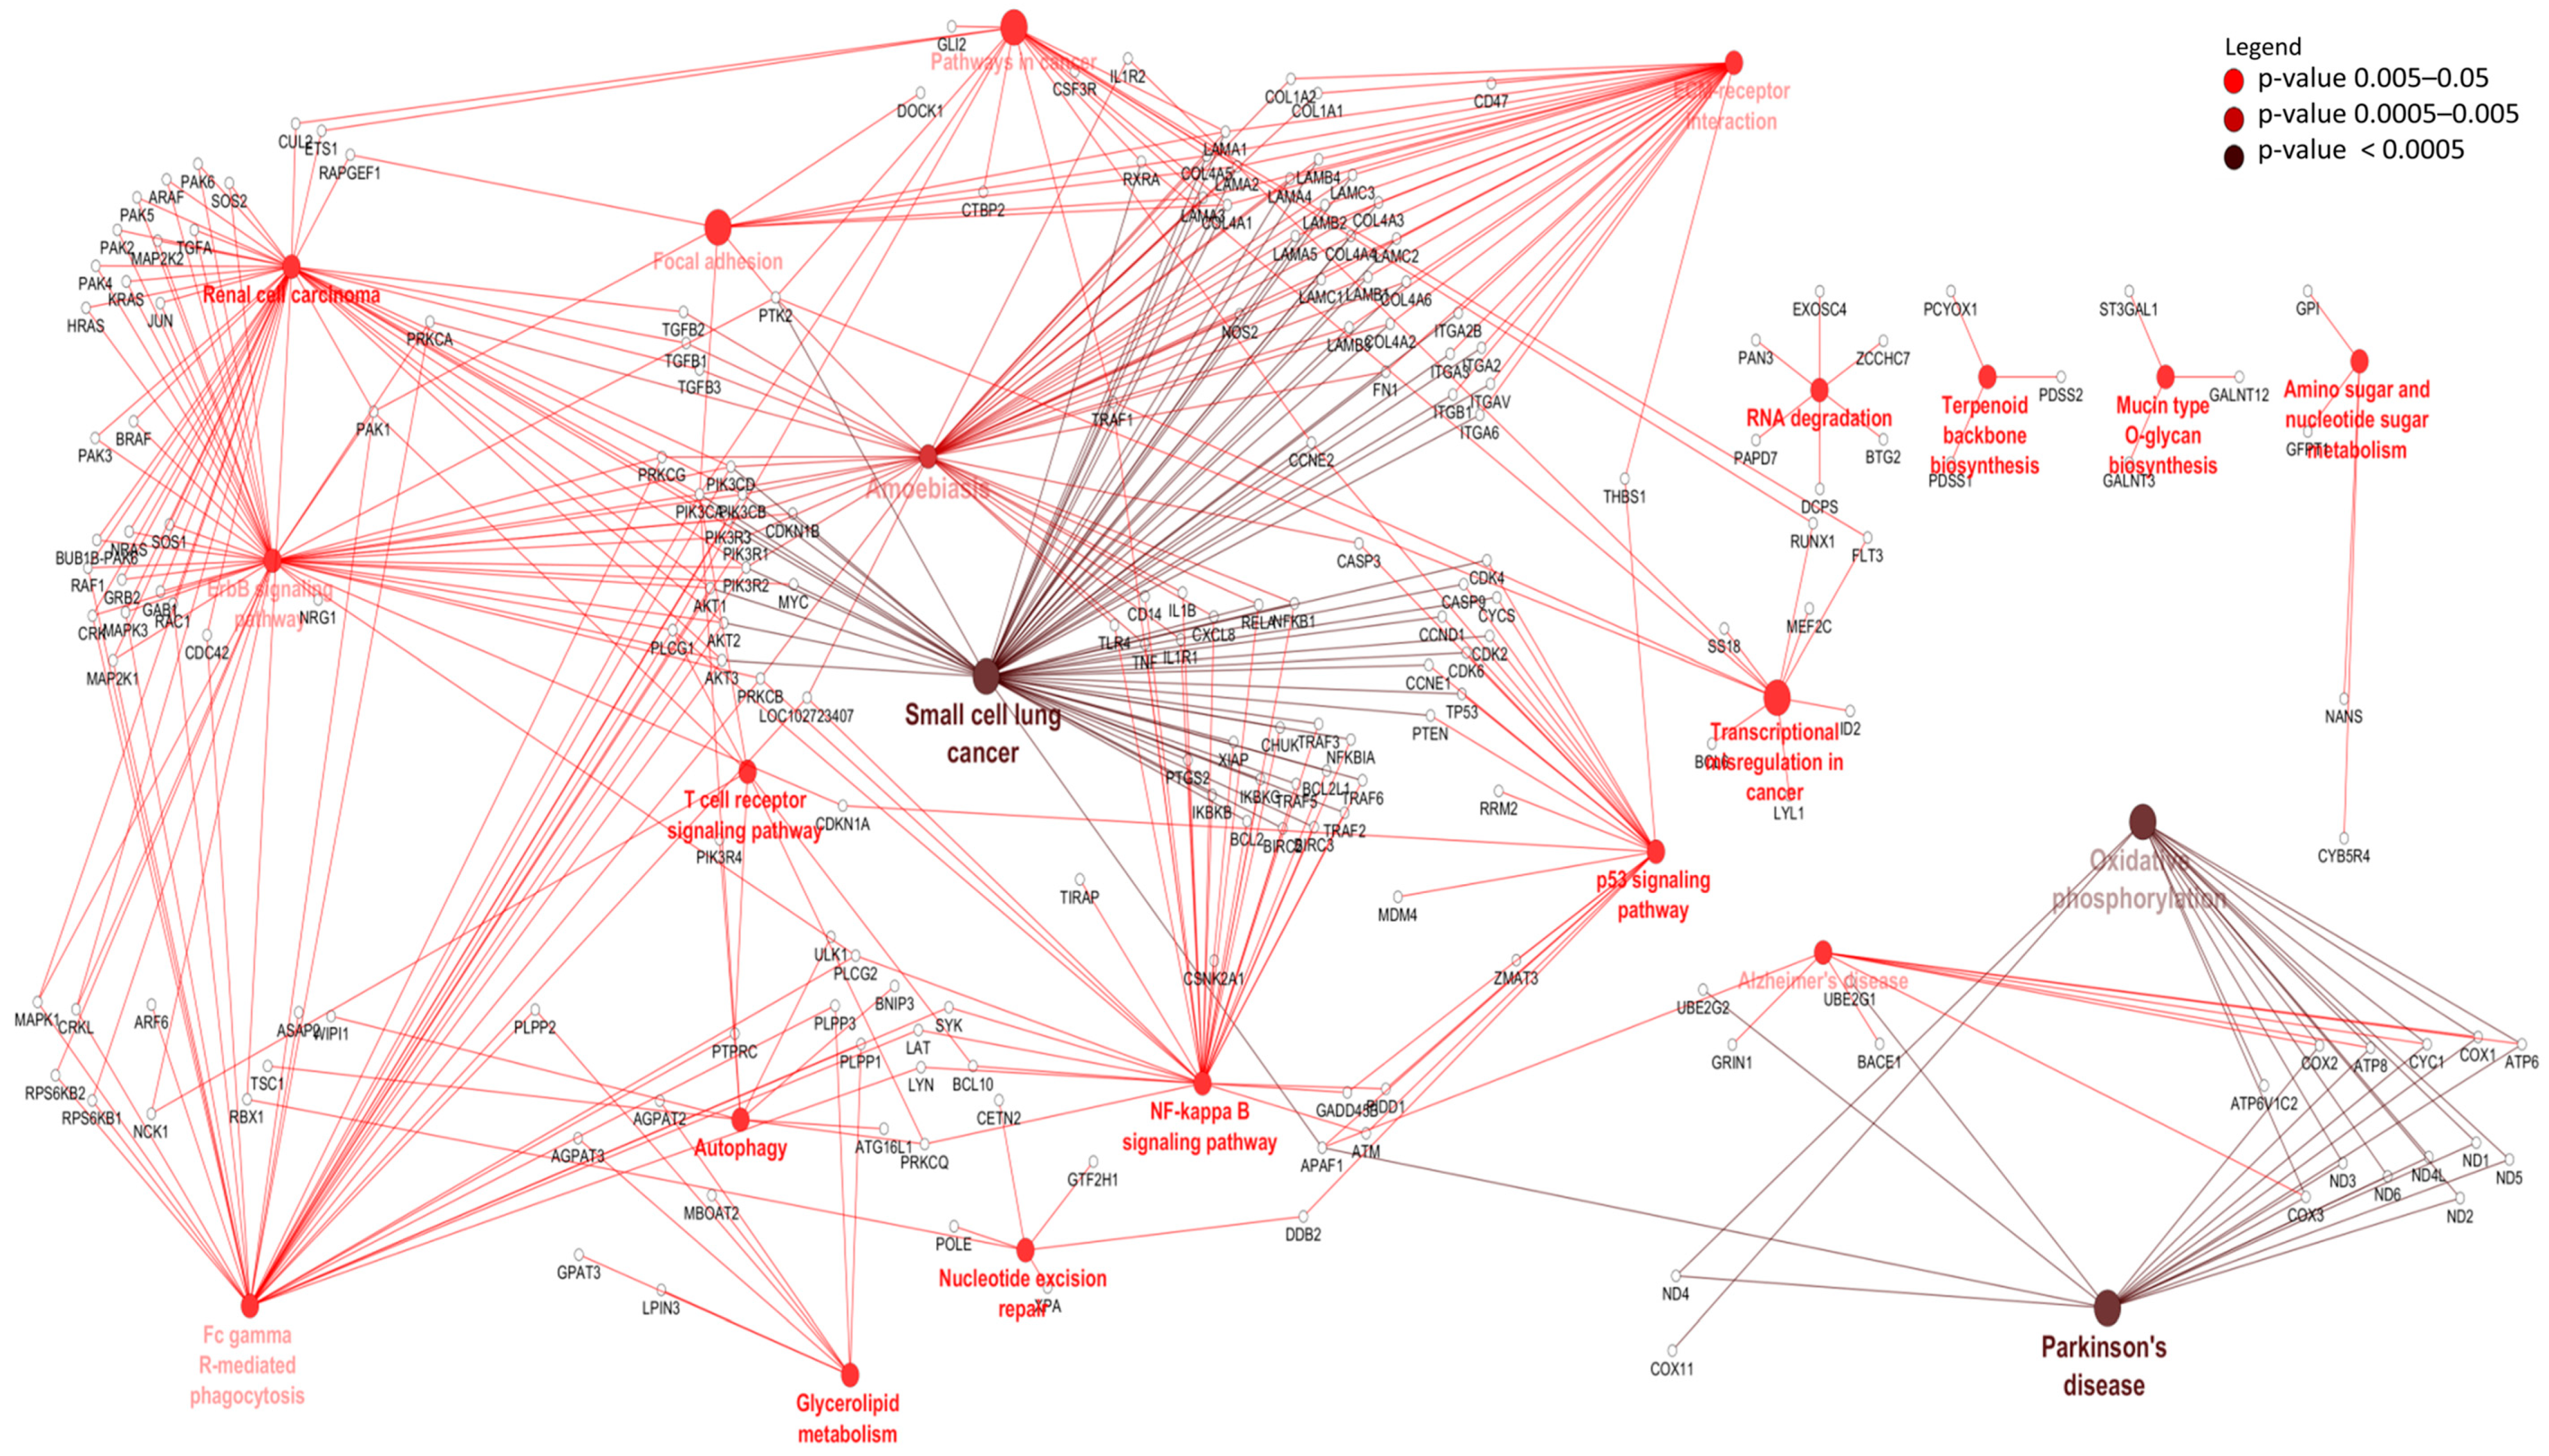
3.4. Identification and Enrichment Analyses of cis Target Genes of lncRNAs

To identify potential cis target genes of lncRNAs, a matrix of Pearson’s correlation was computed using the expression data of 15,628 mRNAs and 4243 lncRNAs and between 15,905 mRNA and 1567 lncRNAs for rumen and ileum tissues, respectively. A total of 632 mRNAs (within 50 Kb surrounding regions of lncRNAs) were significantly correlated (p < 0.05) with 884 lncRNAs and were considered their potential cis targets in rumen tissues (Supplementary Table S8a). Eight genes (WWOX, TTLL7, STAG2, BMPR1A, NEDD4L, KIAAO319L, COA1 and SUDS3) were the potential cis targets of 27, 21, 20, 19, 18, 17, 16, 16 and 15 lncRNAs in rumen tissue, respectively while rXLOC_044298 and rXLOC_036836 potentially cis targeted 13 and 6 mRNAs, respectively (Supplementary Table S8a). GO enrichment analysis indicated that the 632 cis target genes of rumen lncRNAs were significantly enriched for 129 BP-GO and 13 MF-GO terms (Supplementary Table S9a, Figure 3) and 22 KEGG pathways (Supplementary Table S9b and Figure 4).
For ileum tissue, 610 lncRNAs potentially cis regulated 439 mRNAs (Supplementary Table S8b) and iXLOC_044298 and iXLOC_036836 (iXLOC denotes lncRNA identified in the ileum) potentially cis targeted 13 and 6 mRNAs while BMPR1A and ST3GAL1 were potentially cis targeted by 21 and 18 different lncRNAs, respectively (Supplementary Table S8b). A total of 44 BP-GO and 7 MF-GO terms were enriched for the 407 potential cis genes of ileum lncRNAs (Supplementary Table S9c, Figure 5) while 8 KEGG pathways were significantly enriched (Supplementary Table S9d, Figure 6).

3.5. Differentially Expressed lncRNAs in Ileum and Rumen Tissues

A total of 14 and 525 lncRNAs were significantly DE between D33 and D96 in ileum and rumen tissues, respectively (Table S10a,b). The top significant DE lncRNAs are shown in Table 2. rXLOC_027852 and iXLOC_002882 were the most significant DE lncRNAs in rumen and ileum tissues, respectively. For rumen, 57 out of 525 DE lncRNAs had potential cis roles by correlating significantly with 77 mRNAs (Supplementary Table S10c). Most of the DE lncRNAs had only one potential cis target mRNA while rXLOC_025037 and rXLOC_006791 had the most potential cis target mRNAs (Figure 7). For ileum, 7 out of 14 DE lncRNAs had potential cis regulatory roles, targeting (significant correlation) five different mRNAs (Table S10d) and iXLOC_008931 potentially cis targeted three different mRNAs (Figure 7). Furthermore, one mRNA was the potential cis target of three lncRNAs (iXLOC_009320, iXLOC_009324 and iXLOC009321) in ileum tissue (Figure 7). Some of the potential cis target genes of DE lncRNAs were also significantly DE between D33 and D96 (Table 3 and Figure 7).

3.6. Real Time Quantitative PCR Confirmation of RNA-Seq Results

RNA-Seq results were mostly confirmed by qPCR analysis. For ileum samples, observed trend for all nine genes (four housekeeping and five DE genes) was similar to RNA-Seq results (Figure 8a). For rumen samples, the qPCR result was similar to RNA-Seq for four DE mRNAs, two lncRNAs and two housekeeping genes. However, one mRNA only showed a tendency towards significance (HERC6: p < 0.1) by the method of qPCR while one lncRNA (rXLOC_022071) was significantly DE by RNA-Seq but not by qPCR, although the fold change by both methods was the same (4.1-fold change, Supplementary Table S8b). Furthermore, two potential housekeeping genes PGK1 (p = 0.08) and PPIB (p = 0.06) in rumen tissue tended to be DE by the method of qPCR.

4. Discussion

4.1. Transcriptome mRNA Transition from Pre- to Post-Weaning Period in Rumen and Ileum Tissues

The rumen and ileum are important organs for the digestion and absorption of nutrients in ruminants. The molecular mechanisms and key drivers underlying developmental changes in rumen and ileum in the early part of life have been revealed in several omics studies such as transcriptome analysis [54,55] and microbiome analysis [56]. In this study, we observed that 20.8% (33,107 genes) and 27.0% (4217) bovine genes were significantly DE between the pre-weaning (D33) and post-weaning (D96) periods in ileum and rumen tissues, respectively (Figure 1 and Figure 2, Supplementary Table S6). High variation of gene expression in rumen and ileum tissues between the pre- and post-weaning periods might reflect changes in anatomical size increases, metabolic changes as well as adaptation to different diets. Calves were fed with different diets (milk replacer and solid feed (starter diet and hay)) which require the activities/interactions of different groups of enzymes and pathways to digest and absorb them. As a consequence, distinct groups of genes and pathways are required in each period.
In rumen, several high DE genes are important for immune functions such as lymphocyte antigen 6 family member D (LY6D), mucin 1 (MUC1), embigin (EMB) and EYA transcriptional coactivator and phosphatase 2 (EYA2). LY6D protein initiates the first stage of B cell development [57] while MUC1 protein plays important roles in the first line defense against invading pathogens [58]. Meanwhile, EMB and EYA2 have important roles in development processes [59,60]. As expected, DE genes were enriched in many biological processes related to regulation of biological and cellular processes, which reflect the major developmental changes in the physiology and functions of the rumen from pre- to post-weaning stages (Figure 1). Notably, top BP- and MF-GO terms are involved in G-protein-coupled receptors, which are important components of cell signaling and also vital processes required for the normal growth and development of cells [61]. Interestingly, top enriched MF-GO terms (e.g., poly(A) RNA binding, RNA binding, transcription factor binding and nucleic acid binding, etc.) for DE rumen genes involved in RNA processing reflects the many transcriptional activities that take place during growth and development. The most important pathway enriched for rumen DE genes was ribosomes, an important pathway for the regulation of protein biosynthesis. Other interesting pathways have roles in cellular signaling such as thyroid hormone, B cell receptor and Notch signaling pathways. The regulation of thyroid hormone is crucial for animals to respond to changes in nutrient availability and requirements and, to homeorhetic changes during different physiological stages [62]. Therefore, it is not surprising that this pathway was the most significantly enriched pathway in this study. Meanwhile, the enrichment of B cell receptor signaling pathway might reflect changes in immune activities in the rumen during the early period of growth, while the enrichment of Notch signaling pathways might reflect changes in cellular activities in rumen from the pre-weaning to the post-weaning stages.
In ileum, radical S-adenosyl methionine domain containing 2 (RSAD2) gene was the most significant DE gene between D33 and D96 (p.BH) = 6.05 × 10⁻¹¹). This gene plays a key role in the innate immune response system and has a wide variety of antiviral activities [63]. Another most significant DE gene, 2′-5′-oligoadenylate synthetase 2 (OAS2) (p.BH = 2.34 × 10−08), functions as a regulator in the innate immune response process [64,65]. Similar to rumen DE genes, many ileum DE genes were enriched in BP-GO terms involved in cellular signaling and system development while MF-GO terms are involved in RNA processing and cell cycle regulation (Figure 2, Table S7c). Notably, several BP-GO terms (negative regulation of type I interferon production, interferon-beta production and positive regulation by symbiont of host I-κB kinase/nuclear factor-κB (NF-κB) cascade) and KEGG pathways (T cell receptor signaling pathway, B cell receptor signaling pathway and tumor necrosis factor (TNF) signaling pathway) related to immune activities were significantly enriched for ileum DE genes. Previously, Malmuthuge et al. [66] examined the expression of immune related genes (Toll-like receptors (TLR), peptidoglycan recognition protein 1 (PGLYRP1) and antimicrobial peptides (β-defensin)) in GIT tissues from pre- (three weeks of age) and post-weaned (six weeks of age) calves and reported a down regulation of most TLR genes after weaning, coinciding with a drastic change in the microbiome, as well as the morphological and functional changes in the GIT. These results may reflect a developmental shift toward that of a mature ruminant GIT to prevent unnecessary inflammatory responses to a shifting intestinal microbiome [66]. However, we did not observe significant differential expression of TLR genes between the pre- and post-weaning periods in this study. In fact, the most important pathway enriched for DE genes in ileum was ubiquitin mediated proteolysis. Protein ubiquitination mainly functions as a signal for 26S proteasome dependent protein degradation and therefore plays an important role in eukaryotic cellular processes. Another interesting enriched pathway was insulin signaling pathway which was not enriched for rumen DE genes. The insulin signaling pathway is crucial for carbohydrate metabolism. Therefore, the expression of genes related to this process was changed more in the Ileum than in the rumen. Using functional prediction from microbiome data, Meale et al. [67] reported that genes related to carbohydrate metabolism decreased post-weaning suggesting a shift in nutrient metabolism away from the lower GIT to ruminal fermentation. Some other significantly enriched pathways were related to growth control and disease (e.g., mechanistic target of rapamycin (mTOR) signaling pathway), regulation of cell cycle (e.g., cell cycle pathway) and cell matrix adhesions (e.g., focal adhesion pathway).

4.2. lncRNAs in Rumen and Ileum Tissues and Predicted Functions

In this study, we identified 1567 (62 known and 1505 novel) and 4243 (88 known and 4155 novel) lncRNAs in ileum and rumen tissues, respectively (Supplementary Table S4). The differences in the number of identified lncRNAs in the rumen and ileum tissues might reflect their different roles in each tissue since lncRNAs are known to be tissue specific [4,20,21]. Similar to lncRNA studies in other bovine tissues [21,29,30,31,33] (the majority of identified lncRNAs were 200–999 bp long (44.70%) and composed of one transcript (95.85%). Moreover, in the same trend with other studies [4,21,28], the majority of identified lncRNA transcripts are located in the intergenic regions.
It is well documented that lncRNAs may act in cis or trans to regulate the activities of genes [15,68,69,70,71,72]. Due to current lack of information, the functions of bovine lncRNAs can be inferred either by their physical position to protein coding genes such as their potential cis target genes (genes neighboring lncRNAs) or by their co-expression relationship with mRNAs (guilt by association methods) [73,74,75,76]) or determined experimentally. To infer the function of lncRNAs, we identified their cis target genes (genes located within 50 Kb flanking regions of lncRNAs), especially those having significant co-expression correlation (p.BH < 0.05) with lncRNAs. The combination of two filtering options (distance and strength of correlation) strengthened the confidence of potential cis target gene prediction for these lncRNAs but might lead to the loss of information since there is no clear definition of the distance from lncRNAs that should qualify a gene as its cis target. Moreover, it should be noted that, the co-expression (guilt by association) analysis might not completely reflect the causal relationship between lncRNAs and mRNAs.
Nevertheless, we identified 632 potential cis target genes for 884 lncRNAs (Supplementary Table S8a) in the rumen. A most interesting potential cis target gene was WWOX, predicted as potential cis target gene to 27 different lncRNAs. This gene encodes a member of the short-chain dehydrogenases/reductases (SDR) protein family and is known as a tumor suppressor [77]. Furthermore, WWOX has been shown to be regulated by lncRNA rP11-190D6.2 [78]. Since WWOX was not significantly DE between pre- and post-weaning (p.BH = 0.13) periods, we suspect that it performs similar functions in both periods. Another interesting gene was bone morphogenetic protein receptor type 1A (BMPR1A), predicted as cis target of 13 lncRNAs (rXLOC_042928, rXLOC_042929, rXLOC_042930, rXLOC_042932, rXLOC_042934, rXLOC_042935, rXLOC_042936, rXLOC_042938, rXLOC_042939, rXLOC_042940, rXLOC_042942, rXLOC_042945 and rXLOC_042946) is important in Juvenile Polyposis Syndrome (JPS) in humans [79]. JPS is characterized by predisposition to hamartomatous polyps in the GIT [80]. Given the important function of BMPR1A gene in the GIT health of humans, further studies are required to establish it roles in the bovine GIT. rXLOC_044298 and rXLOC_036836 potentially cis targeted 13 and 6 mRNAs, respectively (Supplementary Table S8a) but none of them was significantly DE between the two periods. Therefore, further functional studies to characterise their roles are needed. rXLOC_036836 (NONBTAG014380.2) is a known lncRNAs located on bovine chromosome 5 (from 104,262,200 to 104,262,521 bp) but no report on it function in the rumen exist. Enrichment results indicated that a high number of potential cis target genes are involved in posttranscriptional gene silencing by RNA or microRNA processing. Although the interaction between lncRNAs and miRNAs is well documented [81,82], no information on such interaction is available in the rumen. The enrichment of potential cis target genes of lncRNAs suggest potential roles of lncRNAs in the regulation of cell cycle, metabolic process, cellular metabolic processes and cell macromolecule catabolic process (Figure 3) which are essential processes for normal development. Moreover, rumen lncRNAs play potential roles in the regulation of pathways involving energy sources (oxidative phosphorylation pathway), cell signaling (p53 signalling or ErbB signaling) and immunity (T cell receptor signaling, Fc-γ-mediated phagocytosis and NF-κB signaling) (Figure 4). The importance of these pathways in the development and functions of the rumen have been reported by several authors [83,84,85]. Perhaps, the most interesting results for rumen lncRNAs is the fact that several DE lncRNAs also potentially cis targeted mRNAs that were DE between pre- and post-weaning periods. A notable rumen DE lncRNA is rXLOC_025037, which also potentially cis targeted four DE genes (WDR97, MAF1, EXOSC4 and GPAA1) (Figure 7). Glycosylphosphatidylinositol anchor attachment 1 (GPAA1) gene serve an important function in linking proteins to the cell surface membrane while exosome component 4 (EXOSC4) is related to cyclin-dependent kinases (CDK)-mediated phosphorylation and removal of cell division cycle 6 (CDC6) and deadenylation-dependent mRNA decay [86], however it is not clear how these genes function in the rumen.
In ileum, 610 lncRNAs potentially cis-targeted 439 mRNAs (Supplementary Table S8b) and BMPR1A and ST3 β-galactoside α-2,3-sialyltransferase 1 (ST3GAL1) were amongst genes potentially cis-targeted by the highest number of lncRNAs. The function of BMPR1A has been described above, while ST3GAL1 is an important gene in cancer [87] but little is known about its functions in the ileum. Microtubule cytoskeleton organization and endomembrane system organization were the most significantly enriched GO terms for potential cis target genes of ileum lncRNAs (Figure 5, Supplementary Table S9c). These GO terms are essential to many cellular processes. Immune related GO terms such as modulation by virus of host morphology, physiology, lymphatic endothelial cell differentiation and regulation of viral release from host cell were also significantly enriched (Figure 5, Supplementary Table S9c) suggesting that ileum lncRNAs might have roles in the regulation of immunity pathways. Moreover, we also observed that inflammatory mediator regulation of transient receptor potential (TRP) channels pathway was significantly enriched for ileum lncRNAs potential cis target genes (ADCY7, MAP2K6, MAPK8 and PLCG1). The mammalian TRP superfamily comprises 28 TRP cation channels [88] involved in the regulation of gastrointestinal motility and absorption [89]. Similar to rumen, ileum lncRNAs might also regulate genes in oxidative phosphorylation pathway and lipid metabolism related pathways (glycosphingolipid biosynthesis and phosphatidylinositol signaling system). Interestingly, three DE lncRNAs also potentially cis regulated the G-patch domain-containing 2 (GPATCH2) gene with potential roles in spermatogenesis [90] and tumor growth during breast cancer [91]. However, the function of this gene in ileum is still unknown. Another notable gene is cysteine- and glycine-rich protein 1 (CSRP1), a member of the cysteine-rich protein (CSRP) family involved in regulatory processes important for development and cellular differentiation. Variants of CSRP1 have been associated with growth and carcass traits in cattle [92].

5. Conclusions

To the best of our knowledge, this is the first study to characterize the lncRNA expression in calf’s ileum and rumen tissues. This study has shown the potential molecular mechanisms and pathways involved in the early development of calf GIT. The enrichment of DE mRNAs confirmed the major drivers for the switch from pre- to post-weaning involved in the regulation of growth, development and immune function. Relevant genes for these processes such as LY6D, MUC1, EMB and EYA2 in rumen and RSAD2 and OAS2 in ileum tissues were identified. This study also characterized lncRNAs that may be involved in developmental processes of calves GIT and identified potential lncRNAs and the potential cis target genes that might be important for the regulation of the development of the GIT. Therefore, this study has set a baseline for the further exploration of the roles of lncRNAs in calf’s GIT.

Supplementary Materials

The following are available online at https://www.mdpi.com/2073-4425/9/3/142/s1. Figure S1: KEGG pathways enriched for differentially expressed mRNAs in rumen tissue, Figure S2: KEGG pathways enriched for differentially expressed mRNAs in ileum tissue, Table S1: Genes and primer sequences used in qPCR validation of RNA-Sequencing data, Table S2: RNA-Seq read mapping statistics, Table S3: Genes (mRNA) in (a) rumen and (b) ileum tissues retained for further analyses, Table S4: Identified lncRNA genes in ileum and rumen tissues of calves. (a) Ileum known lncRNAs; (b) Ileum novel lncRNAs; (c) Rumen known lncRNAs; (d) Rumen novel lncRNAs; (e) LncRNAs common to ileum and rumen tissues, Table S5: Genomic features and characteristics of identified lncRNA. (a) Transcript length distribution of lncRNAs; (b) Chromosomal distribution of identified lncRNA genes and transcripts in ileum and rumen tissues of calves; (c) Number of transcripts per lncRNA gene and exons per lncRNA transcript; and (d) LncRNA classes based on genomic location, Table S6: Differentially expressed mRNAs in (a) ileum and (b) rumen tissues and (c) common DE mRNAs, Table S7: (a) GO terms enriched for rumen DE mRNAs; (b) KEGG pathways enriched for rumen DE mRNAs; (c) GO terms enriched for ileum DE mRNAs; (d) KEGG pathways enriched for ileum DE mRNAs, Table S8: Potential cis target genes of lncRNAs in (a) rumen and (b) ileum tissues and (c) differentially expressed lncRNAs and their differentially expressed mRNAs, Table S9: (a) GO terms enriched for rumen lncRNA potential cis target genes; (b) KEGG pathways enriched for rumen lncRNA potential cis target genes; (c) GO terms enriched for ileum lncRNA potential cis target genes; (d) KEGG pathways enriched for ileum lncRNA potential cis target genes, Table S10: Differentially expressed lncRNAs between day 33 and day 96 in rumen (a) and ileum (b) and potential cis target mRNAs for DE lncRNAs in (c) rumen and (d) ileum tissues.

Availability of Sequence Data

The sequence data has been submitted to Gene Expression Omnibus database (BioProject PRJNA400067) and it is available through this link: https://www.ncbi.nlm.nih.gov/bioproject/400067.

Acknowledgments

Funding for this study was provided by Agriculture and Agri-Food Canada. We are grateful to Frédéric Beaudoin (Agriculture and Agri-Food Canada, Sherbrooke Research and Development Centre, and the barn staff of Agriculture and Agri-Food Canada, Sherbrooke Research and Development Centre for animal management during the animal phase of the project.

Author Contributions

E.M.I.-A. conceived and designed the experiments with inputs from N.B.; B.E.F. and P.-L.D. performed the experiments; P.-L.D. and D.N.D. analyzed the data; E.M.I.-A. and N.B. contributed reagents, materials, and analysis tools; E.M.I.-A. and D.N.D. wrote the paper; all authors revised and approved the final draft.

Conflicts of Interest

The authors declare no conflict of interest.

References

  1. Guilloteau, P.; Zabielski, R.; Blum, J.W. Gastrointestinal tract and digestion in the young ruminant: Ontogenesis, adaptations, consequences and manipulations. J. Physiol. Pharmacol. 2009, 60, 37–46. [Google Scholar] [PubMed]
  2. Malmuthuge, N.; Griebel, P.J.; Guan, L.L. The gut microbiome and its potential role in the development and function of newborn calf gastrointestinal tract. Front. Vet. Sci. 2015, 2. [Google Scholar] [CrossRef] [PubMed]
  3. Turner, M.; Galloway, A.; Vigorito, E. Noncoding RNA and its associated proteins as regulatory elements of the immune system. Nat. Immunol. 2014, 15, 484–491. [Google Scholar] [CrossRef] [PubMed]
  4. Derrien, T.; Johnson, R.; Bussotti, G.; Tanzer, A.; Djebali, S.; Tilgner, H.; Guernec, G.; Martin, D.; Merkel, A.; Knowles, D.; et al. The gencode v7 catalog of human long noncoding RNAs: Analysis of their gene structure, evolution, and expression. Genome Res. 2012, 22, 1775–1789. [Google Scholar] [CrossRef] [PubMed]
  5. Mukherjee, N.; Calviello, L.; Hirsekorn, A.; de Pretis, S.; Pelizzola, M.; Ohler, U. Integrative classification of human coding and noncoding genes through RNA metabolism profiles. Nat. Struct. Mol. Biol. 2017, 24, 86–96. [Google Scholar] [CrossRef] [PubMed]
  6. Quinn, J.J.; Chang, H.Y. Unique features of long non-coding RNA biogenesis and function. Nat. Rev. Genet. 2016, 17, 47–62. [Google Scholar] [CrossRef] [PubMed]
  7. Melissari, M.T.; Grote, P. Roles for long non-coding RNAs in physiology and disease. Pflugers Arch.-Eur. J. Physiol. 2016, 468, 945–958. [Google Scholar] [CrossRef] [PubMed]
  8. Mercer, T.R.; Mattick, J.S. Structure and function of long noncoding RNAs in epigenetic regulation. Nat. Struct. Mol. Biol. 2013, 20, 300–307. [Google Scholar] [CrossRef] [PubMed]
  9. Djebali, S.; Davis, C.A.; Merkel, A.; Dobin, A.; Lassmann, T.; Mortazavi, A.; Tanzer, A.; Lagarde, J.; Lin, W.; Schlesinger, F.; et al. Landscape of transcription in human cells. Nature 2012, 489, 101–108. [Google Scholar] [CrossRef] [PubMed]
  10. Devaux, Y.; Zangrando, J.; Schroen, B.; Creemers, E.E.; Pedrazzini, T.; Chang, C.-P.; Dorn, G.W., II; Thum, T.; Heymans, S. Long noncoding RNAs in cardiac development and ageing. Nat. Rev. Cardiol. 2015, 12, 415–425. [Google Scholar] [PubMed]
  11. Fatica, A.; Bozzoni, I. Long non-coding RNAs: New players in cell differentiation and development. Nat. Rev. Genet. 2014, 15, 7–21. [Google Scholar] [CrossRef] [PubMed]
  12. Heward, J.A.; Lindsay, M.A. Long non-coding RNAs in the regulation of the immune response. Trends Immunol. 2014, 35, 408–419. [Google Scholar] [CrossRef] [PubMed] [Green Version]
  13. Yang, Z.G.; Gao, L.; Guo, X.B.; Shi, Y.L. Roles of long non-coding RNAs in gastric cancer metastasis. World J. Gastroenterol. 2015, 21, 5220–5230. [Google Scholar] [CrossRef] [PubMed]
  14. Batista, Pedro J.; Chang, Howard Y. Long noncoding RNAs: Cellular address codes in development and disease. Cell 2013, 152, 1298–1307. [Google Scholar]
  15. Guttman, M.; Donaghey, J.; Carey, B.W.; Garber, M.; Grenier, J.K.; Munson, G.; Young, G.; Lucas, A.B.; Ach, R.; Bruhn, L.; et al. LincRNAs act in the circuitry controlling pluripotency and differentiation. Nature 2011, 477, 295–300. [Google Scholar] [CrossRef] [PubMed] [Green Version]
  16. Dinger, M.E.; Amaral, P.P.; Mercer, T.R.; Pang, K.C.; Bruce, S.J.; Gardiner, B.B.; Askarian-Amiri, M.E.; Ru, K.; Solda, G.; Simons, C.; et al. Long noncoding RNAs in mouse embryonic stem cell pluripotency and differentiation. Genome Res. 2008, 18, 1433–1445. [Google Scholar] [CrossRef] [PubMed]
  17. Chen, B.; Zhang, Y.; Zhang, X.; Jia, S.; Chen, S.; Kang, L. Genome-wide identification and developmental expression profiling of long noncoding RNAs during Drosophila metamorphosis. Sci. Rep. 2016, 6, 23330. [Google Scholar] [CrossRef] [PubMed]
  18. Caballero, J.; Gilbert, I.; Fournier, E.; Gagne, D.; Scantland, S.; Macaulay, A.; Robert, C. Exploring the function of long non-coding RNA in the development of bovine early embryos. Reprod. Fertil. Dev. 2014, 27, 40–52. [Google Scholar] [CrossRef] [PubMed]
  19. Sauvageau, M.; Goff, L.A.; Lodato, S.; Bonev, B.; Groff, A.F.; Gerhardinger, C.; Sanchez-Gomez, D.B.; Hacisuleyman, E.; Li, E.; Spence, M.; et al. Multiple knockout mouse models reveal lincRNAs are required for life and brain development. eLife 2013, 2, e01749. [Google Scholar] [CrossRef] [PubMed]
  20. Cabili, M.N.; Trapnell, C.; Goff, L.; Koziol, M.; Tazon-Vega, B.; Regev, A.; Rinn, J.L. Integrative annotation of human large intergenic noncoding RNAs reveals global properties and specific subclasses. Genes Dev. 2011, 25, 1915–1927. [Google Scholar] [CrossRef] [PubMed]
  21. Koufariotis, L.T.; Chen, Y.-P.P.; Chamberlain, A.; Vander Jagt, C.; Hayes, B.J. A catalogue of novel bovine long noncoding RNA across 18 tissues. PLoS ONE 2015, 10, e0141225. [Google Scholar] [CrossRef] [PubMed]
  22. Mirza, A.H.; Berthelsen, C.H.; Seemann, S.E.; Pan, X.; Frederiksen, K.S.; Vilien, M.; Gorodkin, J.; Pociot, F. Transcriptomic landscape of lncRNAs in inflammatory bowel disease. Genome Med. 2015, 7, 39. [Google Scholar] [CrossRef] [PubMed]
  23. Liang, L.; Ai, L.; Qian, J.; Fang, J.-Y.; Xu, J. Long noncoding RNA expression profiles in gut tissues constitute molecular signatures that reflect the types of microbes. Sci. Rep. 2015, 5, 11763. [Google Scholar] [CrossRef] [PubMed]
  24. Wang, J.Y.; Xiao, L.; Wang, J.Y. Post-transcriptional regulation of intestinal epithelial integrity by noncoding RNAs. Wiley Interdiscip. Rev. RNA 2017, 8. [Google Scholar] [CrossRef] [PubMed]
  25. McHugh, C.A.; Chen, C.-K.; Chow, A.; Surka, C.F.; Tran, C.; McDonel, P.; Pandya-Jones, A.; Blanco, M.; Burghard, C.; Moradian, A.; et al. The Xist lncRNA interacts directly with sharp to silence transcription through HDAC3. Nature 2015, 521, 232–236. [Google Scholar] [CrossRef] [PubMed]
  26. Gupta, R.A.; Shah, N.; Wang, K.C.; Kim, J.; Horlings, H.M.; Wong, D.J.; Tsai, M.C.; Hung, T.; Argani, P.; Rinn, J.L.; et al. Long non-coding RNA HOTAIR reprograms chromatin state to promote cancer metastasis. Nature 2010, 464, 1071–1076. [Google Scholar] [CrossRef] [PubMed]
  27. Gutschner, T.; Hammerle, M.; Eissmann, M.; Hsu, J.; Kim, Y.; Hung, G.; Revenko, A.; Arun, G.; Stentrup, M.; Gross, M.; et al. The noncoding RNA MALAT1 is a critical regulator of the metastasis phenotype of lung cancer cells. Cancer Res. 2013, 73, 1180–1189. [Google Scholar] [CrossRef] [PubMed]
  28. Qu, Z.; Adelson, D.L. Bovine ncRNAs are abundant, primarily intergenic, conserved and associated with regulatory genes. PLoS ONE 2012, 7, e42638. [Google Scholar] [CrossRef] [PubMed]
  29. Weikard, R.; Hadlich, F.; Kuehn, C. Identification of novel transcripts and noncoding RNAs in bovine skin by deep next generation sequencing. BMC Genom. 2013, 14, 789. [Google Scholar] [CrossRef] [PubMed]
  30. Billerey, C.; Boussaha, M.; Esquerré, D.; Rebours, E.; Djari, A.; Meersseman, C.; Klopp, C.; Gautheret, D.; Rocha, D. Identification of large intergenic non-coding RNAs in bovine muscle using next-generation transcriptomic sequencing. BMC Genom. 2014, 15, 499. [Google Scholar] [CrossRef] [PubMed]
  31. Liu, X.; Ding, X.; Li, X.; Jin, C.; Yue, Y.; Li, G.; Guo, H. An atlas and analysis of bovine skeletal muscle long noncoding RNAs. Anim. Genet. 2017, 48, 278–286. [Google Scholar] [CrossRef] [PubMed]
  32. Do, D.N.; Ibeagha-Awemu, E.M. Non-coding RNA roles in ruminant mammary gland development and lactation. In Current Topics in Lactation; InTech: London, UK, 2017. [Google Scholar]
  33. Tong, C.; Chen, Q.; Zhao, L.; Ma, J.; Ibeagha-Awemu, E.M.; Zhao, X. Identification and characterization of long intergenic noncoding RNAs in bovine mammary glands. BMC Genom. 2017, 18, 468. [Google Scholar] [CrossRef] [PubMed]
  34. Andersson, L.; Archibald, A.L.; Bottema, C.D.; Brauning, R.; Burgess, S.C.; Burt, D.W.; Casas, E.; Cheng, H.H.; Clarke, L.; Couldrey, C. Coordinated international action to accelerate genome-to-phenome with FAANG, the Functional Annotation of Animal Genomes Project. Genome Biol. 2015, 16, 57. [Google Scholar] [CrossRef] [PubMed]
  35. Tuggle, C.K.; Giuffra, E.; White, S.N.; Clarke, L.; Zhou, H.; Ross, P.J.; Acloque, H.; Reecy, J.M.; Archibald, A.; Bellone, R.R. Go-FAANG meeting: A Gathering on Functional Annotation of Animal Genomes. Anim. Genet. 2016, 47, 528–533. [Google Scholar] [CrossRef] [PubMed]
  36. CCAC. CCAC guidelines on: The care and use of farm animals in research, teaching and testing. Canadian Council on Animal Care, 2009. Available online: https://www.ccac.ca/Documents/Standards/Guidelines/Farm_Animals.pdf (accessed on 16 January 2013).
  37. Bolger, A.M.; Lohse, M.; Usadel, B. Trimmomatic: A flexible trimmer for illumina sequence data. Bioinformatics 2014, 30, 2114–2120. [Google Scholar] [CrossRef] [PubMed]
  38. Dobin, A.; Davis, C.A.; Schlesinger, F.; Drenkow, J.; Zaleski, C.; Jha, S.; Batut, P.; Chaisson, M.; Gingeras, T.R. Star: Ultrafast universal RNA-seq aligner. Bioinformatics 2013, 29, 15–21. [Google Scholar] [CrossRef] [PubMed]
  39. Picard tools. Available online: https://broadinstitute.github.io/picard/ (accessed on 17 June 2016).
  40. DeLuca, D.S.; Levin, J.Z.; Sivachenko, A.; Fennell, T.; Nazaire, M.-D.; Williams, C.; Reich, M.; Winckler, W.; Getz, G. RNA-SeQC: RNA-seq metrics for quality control and process optimization. Bioinformatics 2012, 28, 1530–1532. [Google Scholar] [CrossRef] [PubMed]
  41. Trapnell, C.; Roberts, A.; Goff, L.; Pertea, G.; Kim, D.; Kelley, D.R.; Pimentel, H.; Salzberg, S.L.; Rinn, J.L.; Pachter, L. Differential gene and transcript expression analysis of rna-seq experiments with tophat and cufflinks. Nat. Protoc 2012, 7, 562. [Google Scholar] [CrossRef] [PubMed]
  42. Li, H.; Handsaker, B.; Wysoker, A.; Fennell, T.; Ruan, J.; Homer, N.; Marth, G.; Abecasis, G.; Durbin, R. The sequence alignment/map format and samtools. Bioinformatics 2009, 25, 2078–2079. [Google Scholar] [CrossRef] [PubMed]
  43. Sun, L.; Luo, H.; Bu, D.; Zhao, G.; Yu, K.; Zhang, C.; Liu, Y.; Chen, R.; Zhao, Y. Utilizing sequence intrinsic composition to classify protein-coding and long non-coding transcripts. Nucleic Acids Res. 2013, 41, e166. [Google Scholar] [CrossRef] [PubMed]
  44. Wang, L.; Park, H.J.; Dasari, S.; Wang, S.; Kocher, J.-P.; Li, W. CPAT: Coding-potential assessment tool using an alignment-free logistic regression model. Nucleic Acids Res. 2013, 41, e74. [Google Scholar] [CrossRef] [PubMed]
  45. Edgar, R.C. Search and clustering orders of magnitude faster than BLAST. Bioinformatics 2010, 26, 2460–2461. [Google Scholar] [CrossRef] [PubMed]
  46. Zhao, Y.; Li, H.; Fang, S.; Kang, Y.; Hao, Y.; Li, Z.; Bu, D.; Sun, N.; Zhang, M.Q.; Chen, R. NONCODE 2016: An informative and valuable data source of long non-coding RNAs. Nucleic Acids Res. 2016, 44, D203–D208. [Google Scholar] [CrossRef] [PubMed]
  47. Anders, S.; Pyl, P.T.; Huber, W. HTSeq—A python framework to work with high-throughput sequencing data. Bioinformatics 2015, 31, 166–169. [Google Scholar] [CrossRef] [PubMed]
  48. Love, M.I.; Huber, W.; Anders, S. Moderated estimation of fold change and dispersion for RNA-seq data with DESeq2. Genome Biol. 2014, 15, 550. [Google Scholar] [CrossRef] [PubMed]
  49. R Development Core Team. R: A Language and Environment for Statistical Computing; R Foundation for Statistical Computing: Vienna, Austria, 2013; ISBN 3-900051-07-0. [Google Scholar]
  50. Benjamini, Y.; Hochberg, Y. Controlling the false discovery rate: A practical and powerful approach to multiple testing. J. R. Stat. Soc. Ser. B (Methodol.) 1995, 57, 289–300. [Google Scholar]
  51. Bindea, G.; Mlecnik, B.; Hackl, H.; Charoentong, P.; Tosolini, M.; Kirilovsky, A.; Fridman, W.H.; Pages, F.; Trajanoski, Z.; Galon, J. ClueGO: A cytoscape plug-in to decipher functionally grouped gene ontology and pathway annotation networks. Bioinformatics 2009, 25, 1091–1093. [Google Scholar] [CrossRef] [PubMed]
  52. Shannon, P.; Markiel, A.; Ozier, O.; Baliga, N.S.; Wang, J.T.; Ramage, D.; Amin, N.; Schwikowski, B.; Ideker, T. Cytoscape: A software environment for integrated models of biomolecular interaction networks. Genome Res. 2003, 13, 2498–2504. [Google Scholar] [CrossRef] [PubMed]
  53. Livak, K.J.; Schmittgen, T.D. Analysis of relative gene expression data using real-time quantitative PCR and the 2−ΔΔCT method. Methods 2001, 25, 402–408. [Google Scholar] [CrossRef] [PubMed]
  54. Chao, T.; Wang, G.; Ji, Z.; Liu, Z.; Hou, L.; Wang, J.; Wang, J. Transcriptome analysis of three sheep intestinal regions reveals key pathways and hub regulatory genes of large intestinal lipid metabolism. Sci. Rep. 2017, 7, 5345. [Google Scholar] [CrossRef] [PubMed]
  55. Liang, G.; Malmuthuge, N.; Bao, H.; Stothard, P.; Griebel, P.J.; Guan, L.L. Transcriptome analysis reveals regional and temporal differences in mucosal immune system development in the small intestine of neonatal calves. BMC Genom. 2016, 17, 602. [Google Scholar] [CrossRef] [PubMed]
  56. Meale, S.; Li, S.; Azevedo, P.; Derakhshani, H.; DeVries, T.; Plaizier, J.; Steele, M.; Khafipour, E. Weaning age influences the severity of gastrointestinal microbiome shifts in dairy calves. Sci. Rep. 2017, 7, 198. [Google Scholar] [CrossRef] [PubMed]
  57. Inlay, M.A.; Bhattacharya, D.; Sahoo, D.; Serwold, T.; Seita, J.; Karsunky, H.; Plevritis, S.K.; Dill, D.L.; Weissman, I.L. Ly6d marks the earliest stage of B-cell specification and identifies the branchpoint between B-cell and T-cell development. Genes Dev. 2009, 23, 2376–2381. [Google Scholar] [CrossRef] [PubMed]
  58. Moncada, D.M.; Kammanadiminti, S.J.; Chadee, K. Mucin and Toll-like receptors in host defense against intestinal parasites. Trends Parasitol. 2003, 19, 305–311. [Google Scholar] [CrossRef]
  59. Chao, F.; Zhang, J.; Zhang, Y.; Liu, H.; Yang, C.; Wang, J.; Guo, Y.; Wen, X.; Zhang, K.; Huang, B.; et al. Embigin, regulated by HOXC8, plays a suppressive role in breast tumorigenesis. Oncotarget 2015, 6, 23496–23509. [Google Scholar] [CrossRef] [PubMed]
  60. Krueger, A.B.; Drasin, D.J.; Lea, W.A.; Patrick, A.N.; Patnaik, S.; Backos, D.S.; Matheson, C.J.; Hu, X.; Barnaeva, E.; Holliday, M.J.; et al. Allosteric inhibitors of the Eya2 phosphatase are selective and inhibit Eya2-mediated cell migration. J. Biol. Chem. 2014, 289, 16349–16361. [Google Scholar] [CrossRef] [PubMed]
  61. Tuteja, N. Signaling through g protein coupled receptors. Plant Signal. Behav. 2009, 4, 942–947. [Google Scholar] [CrossRef] [PubMed]
  62. Todini, L. Thyroid hormones in small ruminants: Effects of endogenous, environmental and nutritional factors. Animal 2007, 1, 997–1008. [Google Scholar] [CrossRef] [PubMed]
  63. Chin, K.-C.; Cresswell, P. Viperin (cig5), an IFN-inducible antiviral protein directly induced by human cytomegalovirus. Proc. Natl. Acad. Sci. USA 2001, 98, 15125–15130. [Google Scholar] [CrossRef] [PubMed]
  64. Pulendran, B. Learning immunology from the yellow fever vaccine: Innate immunity to systems vaccinology. Nat. Rev. Immunol. 2009, 9, 741–747. [Google Scholar] [CrossRef] [PubMed]
  65. Hovanessian, A.G.; Svab, J.; Marie, I.; Robert, N.; Chamaret, S.; Laurent, A.G. Characterization of 69- and 100-kDa forms of 2-5A-synthetase from interferon-treated human cells. J. Biol. Chem. 1988, 263, 4945–4949. [Google Scholar] [PubMed]
  66. Malmuthuge, N.; Li, M.; Fries, P.; Griebel, P.J.; Guan, L.L. Regional and age dependent changes in gene expression of Toll-like receptors and key antimicrobial defence molecules throughout the gastrointestinal tract of dairy calves. Vet. Immunol. Immunopathol. 2012, 146, 18–26. [Google Scholar] [CrossRef] [PubMed]
  67. Meale, S.J.; Li, S.; Azevedo, P.; Derakhshani, H.; Plaizier, J.C.; Khafipour, E.; Steele, M.A. Development of ruminal and fecal microbiomes are affected by weaning but not weaning strategy in dairy calves. Front. Microbiol. 2016, 7, 582. [Google Scholar] [CrossRef] [PubMed]
  68. Kotake, Y.; Nakagawa, T.; Kitagawa, K.; Suzuki, S.; Liu, N.; Kitagawa, M.; Xiong, Y. Long non-coding RNA ANRIL is required for the PRC2 recruitment to and silencing of p15INK4B tumor suppressor gene. Oncogene 2011, 30, 1956–1962. [Google Scholar] [CrossRef] [PubMed]
  69. Maamar, H.; Cabili, M.N.; Rinn, J.; Raj, A. Linc-HOXA1 is a noncoding RNA that represses HOXA1 transcription in cis. Genes Dev. 2013, 27, 1260–1271. [Google Scholar] [CrossRef] [PubMed]
  70. Ponjavic, J.; Oliver, P.L.; Lunter, G.; Ponting, C.P. Genomic and transcriptional co-localization of protein-coding and long non-coding RNA pairs in the developing brain. PLoS Genet. 2009, 5, e1000617. [Google Scholar] [CrossRef] [PubMed]
  71. Rinn, J.L.; Kertesz, M.; Wang, J.K.; Squazzo, S.L.; Xu, X.; Brugmann, S.A.; Goodnough, L.H.; Helms, J.A.; Farnham, P.J.; Segal, E.; et al. Functional demarcation of active and silent chromatin domains in human HOX loci by noncoding RNAs. Cell 2007, 129, 1311–1323. [Google Scholar] [CrossRef] [PubMed]
  72. Wang, K.C.; Yang, Y.W.; Liu, B.; Sanyal, A.; Corces-Zimmerman, R.; Chen, Y.; Lajoie, B.R.; Protacio, A.; Flynn, R.A.; Gupta, R.A.; et al. A long noncoding RNA maintains active chromatin to coordinate homeotic gene expression. Nature 2011, 472, 120–124. [Google Scholar] [CrossRef] [PubMed]
  73. Ren, H.; Wang, G.; Chen, L.; Jiang, J.; Liu, L.; Li, N.; Zhao, J.; Sun, X.; Zhou, P. Genome-wide analysis of long non-coding RNAs at early stage of skin pigmentation in goats (Capra hircus). BMC Genom. 2016, 17, 67. [Google Scholar] [CrossRef] [PubMed]
  74. Pauli, A.; Valen, E.; Lin, M.F.; Garber, M.; Vastenhouw, N.L.; Levin, J.Z.; Fan, L.; Sandelin, A.; Rinn, J.L.; Regev, A. Systematic identification of long noncoding RNAs expressed during zebrafish embryogenesis. Genome Res. 2012, 22, 577–591. [Google Scholar] [CrossRef] [PubMed] [Green Version]
  75. Sun, M.; Gadad, S.S.; Kim, D.-S.; Kraus, W.L. Discovery, annotation, and functional analysis of long noncoding RNAs controlling cell-cycle gene expression and proliferation in breast cancer cells. Mol. Cell 2015, 59, 698–711. [Google Scholar] [CrossRef] [PubMed]
  76. Do, D.N.; Dudemaine, P.-L.; Fomenky, B.; Ibeagha-Awemu, E.M. Transcriptome analysis of non-coding RNAs in livestock species: Elucidating the ambiguity. In Applications of RNA-seq and Omics Strategies-from Microorganisms to Human Health; InTech: London, UK, 2017. [Google Scholar]
  77. Aqeilan, R.I.; Trapasso, F.; Hussain, S.; Costinean, S.; Marshall, D.; Pekarsky, Y.; Hagan, J.P.; Zanesi, N.; Kaou, M.; Stein, G.S. Targeted deletion of Wwox reveals a tumor suppressor function. Proc. Natl. Acad. Sci. USA 2007, 104, 3949–3954. [Google Scholar] [CrossRef] [PubMed]
  78. Tong, W.; Yang, L.; Yu, Q.; Yao, J.; He, A. A new tumor suppressor lncRNA RP11-190D6. 2 inhibits the proliferation, migration, and invasion of epithelial ovarian cancer cells. Onco Targets Ther. 2017, 10, 1227–1235. [Google Scholar] [CrossRef] [PubMed]
  79. Zhou, X.-P.; Woodford-Richens, K.; Lehtonen, R.; Kurose, K.; Aldred, M.; Hampel, H.; Launonen, V.; Virta, S.; Pilarski, R.; Salovaara, R. Germline mutations in BMPR1A/ALK3 cause a subset of cases of juvenile polyposis syndrome and of cowden and bannayan-riley-ruvalcaba syndromes. Am. J. Hum. Genet. 2001, 69, 704–711. [Google Scholar] [CrossRef] [PubMed]
  80. Van Hattem, W.A.; Brosens, L.A.; de Leng, W.W.; Morsink, F.H.; Lens, S.; Carvalho, R.; Giardiello, F.M.; Offerhaus, G.J.A. Large genomic deletions of SMAD4, BMPR1A and PTEN in juvenile polyposis. Gut 2008. [Google Scholar] [CrossRef] [PubMed]
  81. Jalali, S.; Bhartiya, D.; Lalwani, M.K.; Sivasubbu, S.; Scaria, V. Systematic transcriptome wide analysis of lncRNA-miRNA interactions. PLoS ONE 2013, 8, e53823. [Google Scholar] [CrossRef] [PubMed]
  82. Wan, X.; Ding, X.; Chen, S.; Song, H.; Jiang, H.; Fang, Y.; Li, P.; Guo, J. The functional sites of miRNAs and lncRNAs in gastric carcinogenesis. Tumor Biol. 2015, 36, 521–532. [Google Scholar] [CrossRef] [PubMed]
  83. Naeem, A.; Drackley, J.; Stamey, J.; Loor, J. Role of metabolic and cellular proliferation genes in ruminal development in response to enhanced plane of nutrition in neonatal holstein calves. J. Dairy Sci. 2012, 95, 1807–1820. [Google Scholar] [CrossRef] [PubMed]
  84. Laarman, A.H.; Dionissopoulos, L.; AlZahal, O.; Steele, M.A.; Greenwood, S.L.; Matthews, J.C.; McBride, B.W. Butyrate supplementation affects mRNA abundance of genes involved in glycolysis, oxidative phosphorylation and lipogenesis in the rumen epithelium of holstein dairy cows. Am. J. Anim. Vet. Sci. 2013, 8, 239–245. [Google Scholar] [CrossRef]
  85. Baldwin, R.; McLeod, K.; Klotz, J.; Heitmann, R. Rumen development, intestinal growth and hepatic metabolism in the pre- and postweaning ruminant. J. Dairy Sci. 2004, 87, E55–E65. [Google Scholar] [CrossRef]
  86. EXOSC4 Gene – GeneCards | EXOS4 Protein | EXOS4 Antibody. Available online: http://www.genecards.org/cgi-bin/carddisp.pl?gene=EXOSC4 (accsessed on 18 October 2017).
  87. Picco, G.; Julien, S.; Brockhausen, I.; Beatson, R.; Antonopoulos, A.; Haslam, S.; Mandel, U.; Dell, A.; Pinder, S.; Taylor-Papadimitriou, J.; et al. Over-expression of ST3Gal-I promotes mammary tumorigenesis. Glycobiology 2010, 20, 1241–1250. [Google Scholar] [CrossRef] [PubMed]
  88. Ramsey, I.S.; Delling, M.; Clapham, D.E. An introduction to TRP channels. Annu. Rev. Physiol. 2006, 68, 619–647. [Google Scholar] [CrossRef] [PubMed]
  89. Boesmans, W.; Owsianik, G.; Tack, J.; Voets, T.; Berghe, P.V. TRP channels in neurogastroenterology: Opportunities for therapeutic intervention. Br. J. Pharmacol. 2011, 162, 18–37. [Google Scholar] [CrossRef] [PubMed]
  90. Hu, F.; Gou, L.; Liu, Q.; Zhang, W.; Luo, M.; Zhang, X. G-patch domain containing 2, a gene highly expressed in testes, inhibits nuclear factor-κB and cell proliferation. Mol. Med. Rep. 2015, 11, 1252–1257. [Google Scholar] [CrossRef] [PubMed]
  91. Lin, M.L.; Fukukawa, C.; Park, J.H.; Naito, K.; Kijima, K.; Shimo, A.; Ajiro, M.; Nishidate, T.; Nakamura, Y.; Katagiri, T. Involvement of G-patch domain containing 2 overexpression in breast carcinogenesis. Cancer Sci. 2009, 100, 1443–1450. [Google Scholar] [CrossRef] [PubMed]
  92. He, H.; Liu, X.-l.; Zhang, H.-l.; Yang, J.; Niu, F.-b.; Li, Z.-x.; Liu, Y.; Chen, L. Snv and haplotype analysis reveals new csrp1 variants associated with growth and carcass traits. Gene 2013, 522, 206–213. [Google Scholar] [CrossRef] [PubMed]
Figure 1. Differentially expressed genes and their enriched gene ontology (GO) terms and Kyoto Encyclopedia of Genes and Genomes (KEGG) pathways in rumen tissues. (a) Differentially expressed messenger RNAs (mRNAs); (b) top GO terms and (c) KEGG pathways. ECM: Extracellular matrix.
Genes 09 00142 g001
Figure 2. Differentially expressed genes and their enriched GO terms and KEGG pathways in ileum tissues. (a) Differentially expressed mRNAs; (b) top GO terms and (c) KEGG pathways. MAPK: Mitogen-activated protein kinase; mTOR: Mechanistic target of rapamycin.
Genes 09 00142 g002
Figure 3. Gene ontology terms enriched for rumen long non-coding RNA (lncRNA) cis target genes. Only the relevant or highly significantly enriched terms are shown. See Supplementary Table S9a for detailed results. GTPase: Single GTPase (guanosine triphosphate); NADH: Nicotinamide adenine dinucleotide reduced form.
Genes 09 00142 g003
Figure 4. Kyoto Enciclopedia of Genes and Genomes pathways enriched for rumen lncRNA potential cis target genes. ErbB: Epidermal growth factor receptor; Fc: Fragment crystallisable region; NF-κB: Nuclear factor-κB.
Genes 09 00142 g004
Figure 5. Gene ontology terms enriched for ileum lncRNA potential cis target genes.
Genes 09 00142 g005
Figure 6. Kyoto Enciclopedia of Genes and Genomes pathways enriched for ileum lncRNA potential cis target genes. TRP: Transient receptor potential.
Genes 09 00142 g006
Figure 7. LncRNAs and their potential cis target genes in (a) rumen and (b) ileum tissues.
Genes 09 00142 g007
Figure 8. Quantitative real time PCR (qPCR) validation of the RNA-Sequencing (RNA-Seq) expression results of (a) mRNAs (five differentially expressed (DE) and three non-DE or potential housekeeping mRNAs) in ileum tissue and (b) mRNAs (five differentially expressed and two non-DE) and two lncRNAs in rumen tissue.
Genes 09 00142 g008
Table 1. Top significant differentially expressed genes between day 33 (pre-weaning) and day 96 (post-weaning) in rumen and ileum tissues.
Ensemble NameGene NameBase MeanLog2FC 1p-Valuep.BH 2
Rumen
ENSBTAG00000044010EMB45.41−2.853.43 × 10−332.68 × 10⁻²⁹
ENSBTAG00000034498LY6D45.30−2.749.13 × 10−284.76 × 10⁻²⁴
ENSBTAG00000016145ADAMTS19281.43−1.309.85 × 10−263.85 × 10⁻²²
ENSBTAG00000013066IGF22769.08−1.461.57 × 10−234.91 × 10⁻²⁰
ENSBTAG00000017104MUC118.85−2.108.69 × 10−212.26 × 10⁻¹⁷
ENSBTAG00000017032FREM2344.45−1.673.78 × 10−198.45 × 10⁻¹⁶
ENSBTAG00000001382SLC26A926.28−2.261.52 × 10−182.97 × 10⁻¹⁵
ENSBTAG00000013336EYA25.79−2.046.12 × 10−181.06 × 10⁻¹⁴
ENSBTAG00000046549BICD2785.410.425.94 × 10−179.28 × 10⁻¹⁴
ENSBTAG00000048309KIAA1024L12.77−1.601.73 × 10−162.46 × 10⁻¹³
ENSBTAG00000002847D2HGDH305.500.982.26 × 10−162.94 × 10⁻¹³
ENSBTAG00000037804IKZF273.24−1.462.73 × 10−163.28 × 10⁻¹³
ENSBTAG00000038093PEG1091.51−1.433.29 × 10−163.68 × 10⁻¹³
ENSBTAG00000048213ENSBTAG0000004821387.58−0.683.71 × 10−163.86 × 10⁻¹³
ENSBTAG00000015751MEOX147.50−1.024.22 × 10−164.13 × 10⁻¹³
ENSBTAG00000011171PIEZO2194.57−0.762.83 × 10−152.61 × 10⁻¹²
ENSBTAG00000015303MPP635.74−0.914.26 × 10−153.70 × 10⁻¹²
ENSBTAG00000032821SCEL95.16−1.854.50 × 10−153.70 × 10⁻¹²
ENSBTAG00000015402ENSBTAG0000001540217.681.549.55 × 10−157.46 × 10⁻¹²
ENSBTAG00000021420EPHA745.08−1.431.76 × 10−141.31 × 10⁻¹¹
ENSBTAG00000018303PAPPA252.761.481.95 × 10−141.39 × 10⁻¹¹
Ileum
ENSBTAG00000016061RSAD2562.08−2.004.13 × 10−156.05 × 10⁻¹¹
ENSBTAG00000005057FAM204A296.540.508.36 × 10−136.13 × 10−09
ENSBTAG00000020142LMBRD2296.050.532.39 × 10−121.17 × 10−08
ENSBTAG00000011789ENSBTAG00000011789410.620.501.22 × 10−112.34 × 10−08
ENSBTAG00000012552FMR1676.180.421.23 × 10−112.34 × 10−08
ENSBTAG00000014628OAS2243.63−1.881.43 × 10−112.34 × 10−08
ENSBTAG00000019059ATG16L2319.11−0.451.14 × 10−112.34 × 10−08
ENSBTAG00000037527OAS1X643.29−1.541.38 × 10−112.34 × 10−08
ENSBTAG00000038067ENSBTAG00000038067124.15−1.929.93 × 10−122.34 × 10−08
ENSBTAG00000009677PARP10704.04−0.982.05 × 10−113.01 × 10−08
ENSBTAG00000004934NEMF958.940.468.49 × 10−111.13 × 10−07
ENSBTAG00000042280SNORA4055.730.851.46 × 10−101.65 × 10−07
ENSBTAG00000043258SNORA1833.131.051.44 × 10−101.65 × 10−07
ENSBTAG00000014707ISG15767.04−1.751.95 × 10−101.96 × 10−07
ENSBTAG00000019748FAM208A2070.640.522.00 × 10−101.96 × 10−07
ENSBTAG00000012907ODF2L283.560.642.85 × 10−102.62 × 10−07
ENSBTAG00000046797NRAS1034.730.394.52 × 10−103.90 × 10−07
ENSBTAG00000025029MAN2A11673.740.474.90 × 10−104.00 × 10−07
ENSBTAG00000008048GCFC2407.320.625.88 × 10−104.54 × 10−07
ENSBTAG00000004593TOP2B4025.860.357.58 × 10−105.56 × 10−07
1 Log2-fold change; 2 Corrected p-value using Benjamini and Hochberg correction.
Table 2. Top significantly differentially expressed lncRNAs between day 33 (pre-weaning) and day 96 (post-weaning) in rumen and ileum tissues.
LncRNA 1Bta 2StartEndNONCODE Name 3log2FC 4FC 5p-Valuep.BH 6
Rumen
rXLOC_0278521759,152,43859,152,902Novel−2.36−5.139.59 × 10−154.07 × 10⁻¹¹
rXLOC_0208091249,167,42149,168,996Novel2.415.333.35 × 10−147.11 × 10⁻¹¹
rXLOC_013111970,095,27470,095,655Novel−2.82−7.061.61 × 10−122.27 × 10−09
rXLOC_0258791523,812,35523,812,636Novel−0.83−1.783.29 × 10−123.49 × 10−09
rXLOC_0222471318,885,05718,885,409Novel2.616.119.49 × 10−128.05 × 10−09
rXLOC_0351782459,070,22159,070,559Novel1.362.572.79 × 10−111.97 × 10−08
rXLOC_0163601180,849,36680,849,978Novel1.793.451.02 × 10−106.12 × 10−08
rXLOC_0419532744,295,46344,296,339Novel1.613.051.15 × 10−106.12 × 10−08
rXLOC_0222131318,879,75918,880,268Novel2.164.472.45 × 10−101.05 × 10−07
rXLOC_033684378,439,92978,440,225NONBTAG012391.21.052.072.47 × 10−101.05 × 10−07
rXLOC_0391252633,565,52433,566,229Novel1.593.013.29 × 10−101.27 × 10−07
rXLOC_0419682744,323,63944,323,953Novel1.392.633.86 × 10−101.36 × 10−07
rXLOC_006593497,107,95497,108,721Novel2.646.224.86 × 10−101.58 × 10−07
rXLOC_008000795,774,87895,775,405Novel1.262.401.68 × 10−094.95 × 10−07
rXLOC_022071211,659,2561,663,385NONBTAG020155.12.034.091.85 × 10−094.95 × 10−07
rXLOC_0351732459,051,65459,052,324Novel1.522.871.87 × 10−094.95 × 10−07
rXLOC_0222541318,885,61118,886,350Novel2.495.612.47 × 10−096.17 × 10−07
rXLOC_0222111318,876,73918,879,073Novel2.264.802.65 × 10−096.25 × 10−07
rXLOC_0391032633,517,78433,518,636Novel1.372.592.90 × 10−096.47 × 10−07
rXLOC_045518X17,862,23117,862,527NONBTAG017530.21.733.313.18 × 10−096.74 × 10−07
Ileum
iXLOC_0028821178,563,63078,565,402Novel0.761.692.10 × 10−081.63 × 10−05
iXLOC_0093201621,758,31121,761,092Novel0.681.602.65 × 10−061.03 × 10−03
iXLOC_0075041531,279,33331,283,846Novel−1.15−2.221.37 × 10−053.54 × 10−03
iXLOC_0075191532,192,17432,195,976Novel0.661.589.51 × 10−051.48 × 10−02
iXLOC_033017843,640,11343,644,666Novel1.422.688.18 × 10−051.48 × 10−02
iXLOC_0093211621,761,25521,764,378Novel0.601.511.82 × 10−042.36 × 10−02
iXLOC_0089311649,402,72149,405,957Novel−0.88−1.842.88 × 10−043.10 × 10−02
iXLOC_0093241621,772,95621,777,346Novel0.481.403.41 × 10−043.10 × 10−02
iXLOC_031185781,563,60981,568,847Novel1.082.113.59 × 10−043.10 × 10−02
iXLOC_0134441963,355,76863,357,128Novel−0.95−1.934.56 × 10−043.13 × 10−02
iXLOC_0134491963,365,06963,365,658Novel−1.04−2.064.84 × 10−043.13 × 10−02
iXLOC_0157522063,795,77063,798,826Novel−0.91−1.884.69 × 10−043.13 × 10−02
iXLOC_0134571963,385,51263,386,885Novel−1.07−2.105.81 × 10−043.47 × 10−02
iXLOC_0092841621,647,68921,649,116Novel0.761.697.07 × 10−043.93 × 10−02
1 Prefix r and i indicates lncRNAs identified in rumen and ileum tissues, respectively; 2 Bta: Bovine chromosome; 3 Novel indicates lncRNAs that have not been reported in NONCODE database; 4 Log2-fold change; 5 Fold change; 6 Corrected p-value using Benjamini and Hochberg correction.
Table 3. Differentially expressed lncRNAs and their corresponding differentially expressed potential cis target genes in ileum and rumen tissues.
LncRNA 1Bta 2StartEndEnsembl GeneGene SymbolStartStopCor 3p.BH 4
Ileum
iXLOC_0075041531,279,33331,283,846ENSBTAG00000021338OAF31,312,38331,330,6380.972.30 × 10−10
iXLOC_0089311649,402,72149,405,957ENSBTAG00000016057CSRP149,332,77049,353,5170.837.72 × 10−05
iXLOC_0093201621,758,31121,761,092ENSBTAG00000001574GPATCH221,783,18921,808,5190.843.86 × 10−05
iXLOC_0093211621,761,25521,764,378ENSBTAG00000001574GPATCH221,783,18921,808,5190.759.20 × 10−04
iXLOC_0093241621,772,95621,777,346ENSBTAG00000001574GPATCH221,783,18921,808,5190.926.39 × 10−07
Rumen
rXLOC_0010261145,823,035145,824,769ENSBTAG00000021901TRPM2145,830,610145,871,7920.774.46 × 10−07
rXLOC_0010331146,129,434146,206,714ENSBTAG00000048090UBE2G2146,114,659146,120,8260.451.02 × 10−02
rXLOC_001744188,589,65988,590,085ENSBTAG00000012463ZMAT388,632,28788,663,9970.551.39 × 10−03
rXLOC_0040661188,446,93088,450,243ENSBTAG00000008160MBOAT288,390,47188,444,7760.851.72 × 10−09
rXLOC_006791713,559,78913,561,916ENSBTAG00000016352STX1013,548,24113,551,7080.782.51 × 10−07
rXLOC_006791713,559,78913,561,916ENSBTAG00000018229NFIX13,596,36713,658,1120.585.62 × 10−04
rXLOC_006791713,559,78913,561,916ENSBTAG00000019325TRMT113,572,87813,581,9650.767.57 × 10−07
rXLOC_009274863,568,39663,573,554ENSBTAG00000021367ENSBTAG0000002136763,617,04163,630,0820.742.49 × 10−06
rXLOC_0109401543,689,41343,689,680ENSBTAG00000016074ENSBTAG0000001607443,703,91143,770,0160.561.13 × 10−03
rXLOC_011271971,006,42371,217,097ENSBTAG00000019460MOXD171,245,10971,341,9300.577.51 × 10−04
rXLOC_0160341167,744,51567,747,453ENSBTAG00000017626GFPT167,684,39067,728,9590.658.63 × 10−05
rXLOC_025037141,907,6311,909,665ENSBTAG00000000658WDR971,913,0481,921,6670.421.91 × 10−02
rXLOC_025037141,907,6311,909,665ENSBTAG00000012242MAF11,921,7841,924,8180.641.17 × 10−04
rXLOC_025037141,907,6311,909,665ENSBTAG00000014607EXOSC41,947,1981,949,0740.431.48 × 10−02
rXLOC_025037141,907,6311,909,665ENSBTAG00000014610GPAA11,942,6721,945,9100.421.77 × 10−02
rXLOC_025696142,350,2282,354,178ENSBTAG00000014643eef1d2,317,9712,326,7180.441.42 × 10−02
rXLOC_0293301846,573,48646,573,914ENSBTAG00000002763KMT2B46,620,83646,640,9040.631.31 × 10−04
rXLOC_0302591925,389,24225,389,587ENSBTAG00000021091ANKFY125,337,35025,387,0680.595.42 × 10−04
rXLOC_0410272725,434,45525,440,584ENSBTAG00000013581LEPROTL125,422,50225,432,3270.532.25 × 10−03
rXLOC_0411732733,807,73533,808,050ENSBTAG00000003509PLEKHA233,747,81833,776,2710.594.35 × 10−04
rXLOC_0411742733,813,85033,814,207ENSBTAG00000003509PLEKHA233,747,81833,776,2710.658.60 × 10−05
rXLOC_042125276,446,2996,446,849ENSBTAG00000004231GPM6A6,267,2016,417,2080.402.47 × 10−02
rXLOC_0425032732,987,25532,989,352ENSBTAG00000000978ASH2L32,989,76933,014,9820.741.74 × 10−06
rXLOC_045046X130,424,538130,424,911ENSBTAG00000003727SH3KBP1130,459,281130,711,9130.421.97 × 10−02
rXLOC_045053X130,432,550130,433,452ENSBTAG00000003727SH3KBP1130,459,281130,711,9130.532.12 × 10−03
rXLOC_045511X17,169,63417,218,596ENSBTAG00000020644GPC417,087,44717,122,4260.732.75 × 10−06
rXLOC_045531X18,185,75118,188,438ENSBTAG00000030024ENSBTAG0000003002418,180,13318,180,2290.594.97 × 10−04
1 Prefix r and i indicates lncRNAs identified in rumen and ileum tissues, respectively; 2 Bta: Bovine chromosome; 3 The Person’s correlation coefficient; 4 Corrected p-value using Benjamini and Hochberg (BH) method.

