Article

Identification of FASN Gene Polymorphisms, Expression and Their Relationship with Body Size Traits in Guizhou White Goat (Capra hircus) with Different Genders

Guizhou Provincial Key Laboratory for Biodiversity Conservation and Utilization in the Fanjing Mountain Region, College of Agriculture and Forestry Engineering, Tongren University, Tongren 554300, China
*
Author to whom correspondence should be addressed.
Genes 2024, 15(6), 656; https://doi.org/10.3390/genes15060656
Submission received: 30 April 2024 / Revised: 18 May 2024 / Accepted: 20 May 2024 / Published: 22 May 2024
(This article belongs to the Special Issue Genetics and Breeding in Sheep and Goats)

Abstract

:
To investigate the nucleotide variation sites (SNPs) and expression differences of the fatty acid synthase gene (FASN) in Guizhou white goats, the relationship between the variation and body size traits was investigated. In this study, DNA was extracted from the blood of 100 samples of white goats from different regions in Guizhou province, China, and the variation sites were screened using pooled sequencing by mixing DNA samples, and 242 blood samples with body size traits were used for association analysis. The allele frequency, genotype frequency, homozygosity, heterozygosity and effective gene number were calculated by using PopGene 32.0 software, the population polymorphism information content was calculated by using PIC software (Version 0.6), and the state of genetic balance of the genes was analyzed by using the chi-square test. The mRNA of FASN gene expression levels in male and female goats were investigated by using real-time fluorescence quantitative PCR (RT-qPCR). The general linear mixed model of MINTAB software (Version 16.0) was used to analyze the association between FASN gene nucleotide mutation sites and body size traits. The results showed that there was one nucleotide mutation site g.141 C/T in the target fragment of FASN gene amplification, and revealed two alleles, C and T, and three genotypes CC, CT and TT. The genotype frequencies for CC, CT and TT were 0.4308, 0.4205 and 0.1487, respectively. The allele frequencies for C and T were 0.6410 and 0.3590, respectively. The genetic homozygosity (Ho) was higher than the heterozygosity (He). The χ2 test showed that the mutation site was in the Hardy–Weinberg equilibrium state (p > 0.05). The RT-qPCR results showed that the FASN gene had different expression levels in the longissimus dorsi muscle of male and female goats, and its expression was significantly higher in male goats than in female goats. The association analysis results showed that the mutation of the FASN gene had different effects on body size traits of male and female goats, and the presence of the populations of the T allele and the TT genotype recorded higher body size traits (body weight, heart girth and wither height) in female populations. Therefore, the site of the FASN gene can be used as a candidate marker for the early selection of growth traits in Guizhou white goats.

1. Introduction

Fatty acid synthase (FASN) is an enzymatic structure that catalyzes the synthesis of fatty acids, and can utilize acetyl-CoA and malonyl-CoA to synthesize long-chain fatty acids from scratch in the presence of NADPH. FASN is a key enzyme in the synthesis process, and most of the fatty acids required for animal fat deposition need to be synthesized de novo [1,2]. The FASN gene is located on chromosome 19 of the goat, with a full-length sequence of 18,795 bp, encoding a total of 2514 amino acid residues (RefSeq accession GCF_001704415.1). Studies have found that the protein involved in the expression of the FASN gene is a water-soluble and unstable protein, lacking signal peptides and transmembrane regions, with 20 amino acids that can serve as protein kinase phosphorylation sites [3,4]. Many researchers have conducted studies on the important regulatory role of the FASN gene in fatty acid synthesis in animal production. It was found that there is a correlation between the polymorphism of the FASN gene and fat tissue deposition in pigs [5]. Moreover, some studies have found that the expression correlation analysis of FASN gene in 10 tissues including sheep tail fat, heart, kidney, liver, etc., showed that the FASN gene is expressed in all 10 tissues, and the expression quantity in tail fat is significantly higher than in the other 9 tissues [6,7,8]. In the cattle population, it has also been found that the FASN gene may have a significant impact on cattle carcass traits, with research indicating that there is a certain correlation between FASN gene variation and carcass traits, body size traits and intramuscular fat deposition in Qinchuan cattle [9,10].
Therefore, the FASN gene is an important candidate gene that affects the production performance of livestock animals. However, there are few reports on the study of the FASN gene in goats, and there is currently no report on the analysis of FASN gene variation and its relationship with growth traits in goats. Guizhou white goats, a famous local goat breed in China, play an important role in the development of the local livestock industry. Thus, this study aims to conduct research on the FASN gene in Guizhou white goats, analyze the nucleotide variations and tissue expression differences of the FASN gene in the Guizhou white goat population, and explore its correlation with the growth traits in Guizhou white goats with different genders in order to identify molecular genetic marker points that can help us to select goats with better growth traits in the early stages.

2. Materials and Methods

2.1. Animals and Data Collection

In order to explore the genetic variation in the goat FASN gene, 342 blood samples were collected and brought back to the laboratory for storage at −20 °C. Among these, 100 blood samples were collected to be used for nucleotide mutation detection from 7 different farms; another 242 blood samples were collected from 2 farms, and on each farm, the goats were randomly selected, with the age generally between 2 and 2.5 years old. Basic body size trait data of Guizhou white goats (body weight, heart girth, wither height, body length and circumference of cannon bone) for the corresponding individuals were also recorded. DNA extraction was performed using the DNA Extraction Kit (TIANGEN Biotech, Beijing, China). The DNA from 100 samples of the 7 different farms was diluted to the same concentration with TE and 2 μL was taken for mixing to prepare mixed DNA for subsequent pooled sequencing. Another 242 DNA samples were used for the analysis of growth trait association. All DNA samples were stored at −20 °C prior to use. In addition, 3 male and 3 female Guizhou white goats’ longissimus dorsi tissues were collected, respectively. Before slaughter, we measured the live weight, and after slaughter, we measured the carcass weight, meat weight, calculated yield and net meat rate. The samples were immediately preserved in liquid nitrogen after collection until RNA extraction. The total RNA was isolated from longissimus dorsi tissue using the RNAsimple Total RNA Kit (TIANGEN Biotech, Beijing, China) following the manufacturer’s protocols. Aliquots (200 ng) of total RNA were used for cDNA synthesis using TransScript One-Step gDNA removal and cDNA Synthesis SuperMix (TransGen Biotech, Beijing, China) following the manufacturer’s protocols.

2.2. Primer Design and PCR Amplification

Using the FASN gene sequence information for goats from the NC_030826.1 assembly in the NCBI database as a reference, the appropriate primer fragment length was selected, containing part of the 21st exon and part of the 21st intron, and primer 5.0 software (Version 5.0, Premier Biosoft International, Palo Alto, CA, USA) was used to design the PCR primer, which was synthesized by the Sangon Biotech Service Company (Chengdu, China), to amplify the fragment of the FASN gene. The primer information is shown in Table 1 (the primer P1, and after screening for polymorphic sites, a new primer P2 was designed for precise detection, containing nucleotide mutation sites). The primers were dissolved in ultrapure water and stored at −20 °C.
The PCR amplification was conducted using 2 × Taq PCR StarMix, with a reaction volume of 40 μL, which contained 2 μL of DNA template, 22 μL of 2 × Taq PCR StarMix, 2 μL of upstream primers, 2 μL of downstream primers and 12 μL of ddH2O. The PCR reaction process includes pre-denaturation at 95 °C for 5 min, denaturation at 95 °C for 30 s, annealing at 57 °C for 30 s and extension at 72 °C for 30 s for 40 cycles, final extension at 72 °C for 10 min for 1 cycle, and preservation at 10 °C. The amplified products of the PCR were analyzed by using 1.5% agarose gel electrophoresis for 15 min.
RT-qPCR detects the relative expression level of the FASN gene using a fluorescent quantitative PCR detection kit produced by TransGen Biotech Co., Ltd. (Beijing). The amplification system is 20 μL: cDNA template (1 μg/L) at 1 μL, 2 × PCR super mix at 10 μL, upstream and downstream primers (10 μmol/L) at 0.5 μL, respectively, and ddH2O at 8 μL. The RT-qPCR reaction process includes 94 °C denaturation for 1 min for one cycle, followed by 94 °C for 10 s, 58 °C for 30 s and 72 °C for 10 s for 38 cycles. Three technical repetitions were run for each sample and the results were normalized to GAPDH. The primers’ information of the PCR and RT-qPCR of the FASN gene is given in Table 1.

2.3. Measurements and Statistical Analysis

The mutation sites of the FASN gene were analyzed by the MegAlign software with DNASTAR lasergene (Versionn7.1.0, DNASTAR, Inc., Madison, Wisconsin, USA). Genetic diversity parameters (including genotype frequency, allele genotype frequency, observed homozygosity (Ho), expected heterozygosity (He) and Hardy–Weinberg test (χ2 test)) were calculated by using PopGene 32.0 software (Molecular Biology and Biotechnology Centre, University of Alberta, Edmonton, AB, Canada). The polymorphic information content (PIC value) was calculated by using PIC software (PIC_CALC, Version 0.6, Yellow Sea Fisheries Research Institute (YSFRI), Chinese Academy of Fishery Sciences, Wuhan, China). General linear mixed-effect models (GLMMs) of MINITAB (Version 16, Minitab Inc., State College, PA, USA) were used to evaluate the effect of the presence/absence of the allele on the body size traits. For genotypes with a frequency greater than 5%, a series of GLMMs was used to evaluate the effect of the allele on the body size traits. The model used in the analysis is as follows:
Yijmn = μ + Ci + Fm + Xn + eimn
Among them, Yijmn represents the corresponding productive traits, μ represents the population mean, Ci represents the gender effect, Fm represents the genotype and allele effect, Xn represents the interaction effect between factors and eimn represents the random error. All results are expressed as “mean ± standard error”.
Differential expression analysis was performed as follows: ΔΔCt = (Ct FASN gene − Ct GAPDH) for the experimental group and (Ct FASN gene − Ct GAPDH) for the control group. The raw data were first processed using Excel 2019 software, and then, the 2−ΔΔCT method was used to calculate the relative gene expression level. One-way ANOVA was used to analyze the results for significance, with a significant difference established when p < 0.05.

3. Results

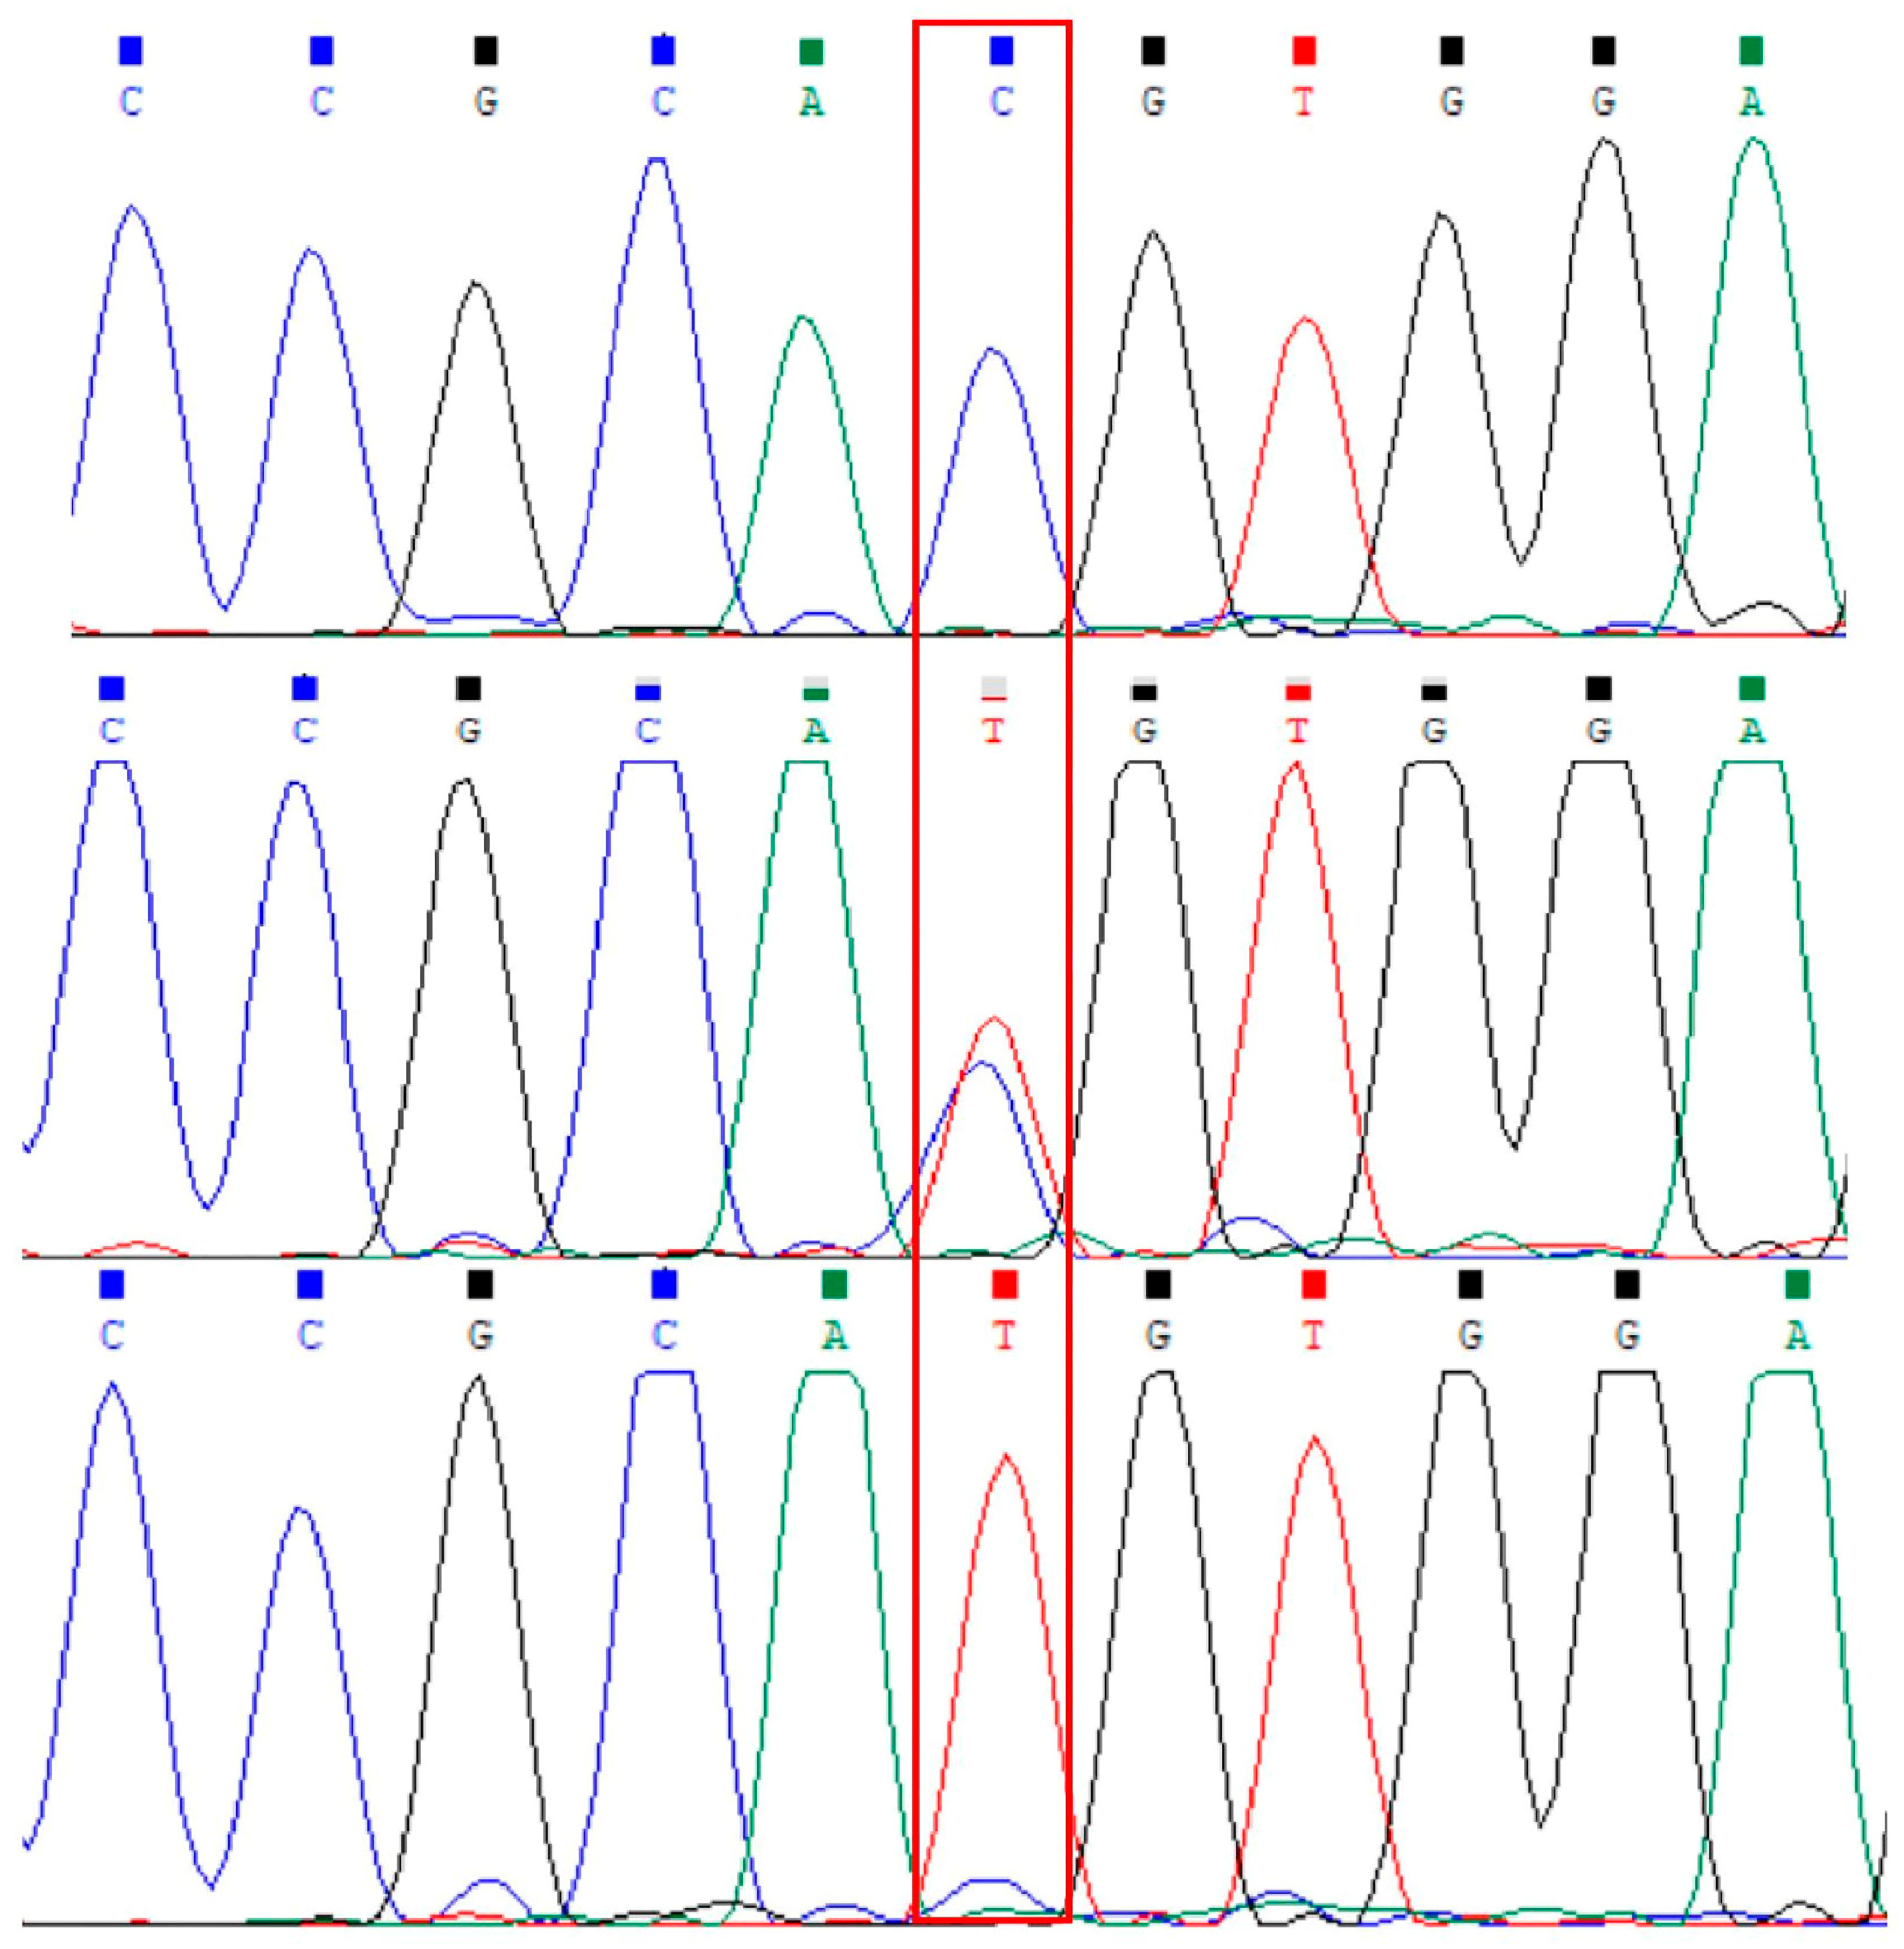
3.1. Analysis of the Polymorphism of the FASN Gene

We used 1.5% agarose to detect the PCR products. The amplified bands were clear and could be used for subsequent tests (Figure 1). A g.141C/T mutation or natural cleavage site was found in the region of exon 21 of the FASN gene by comparing the sequence of the P1 target fragment with the reference sequence (10614th position of NC_030826.1) and then through the verification of the target gene fragment amplified by the P2 primer (Figure 2). It is notable that the g.141C/T mutation is a synonymous mutation.
The 100 samples from 7 different farms were used to detect nucleotide variation sites through a pooled approach, and hence, no population genetic information was analyzed. In the 242 individuals of Guizhou white goat, there were three genotypes that were sequenced. These were CC (43.59%), TT (14.36%) and CT (42.05%), respectively. Meanwhile, the g.141C/T mutation signified that there were two different alleles C and T, and the frequencies were 64.6% and 35.4%, respectively (Table 2).
As shown in Table 2, the calculated polymorphic information content (PIC) value is 0.35 (PIC > 0.5 indicates high polymorphism, 0.25 < PIC < 0.5 represents moderate polymorphism, and PIC < 0.25 reflects low polymorphism), indicating that the PIC of this variant site is moderately polymorphic. Moreover, the genetic homozygosity (Ho) is greater than the genetic heterozygosity (He), and Ne is 0.4573. The chi-square test (χ2) indicates that the locus frequency is in the state of Hardy–Weinberg disequilibrium rather than Hardy–Weinberg equilibrium (p > 0.05).

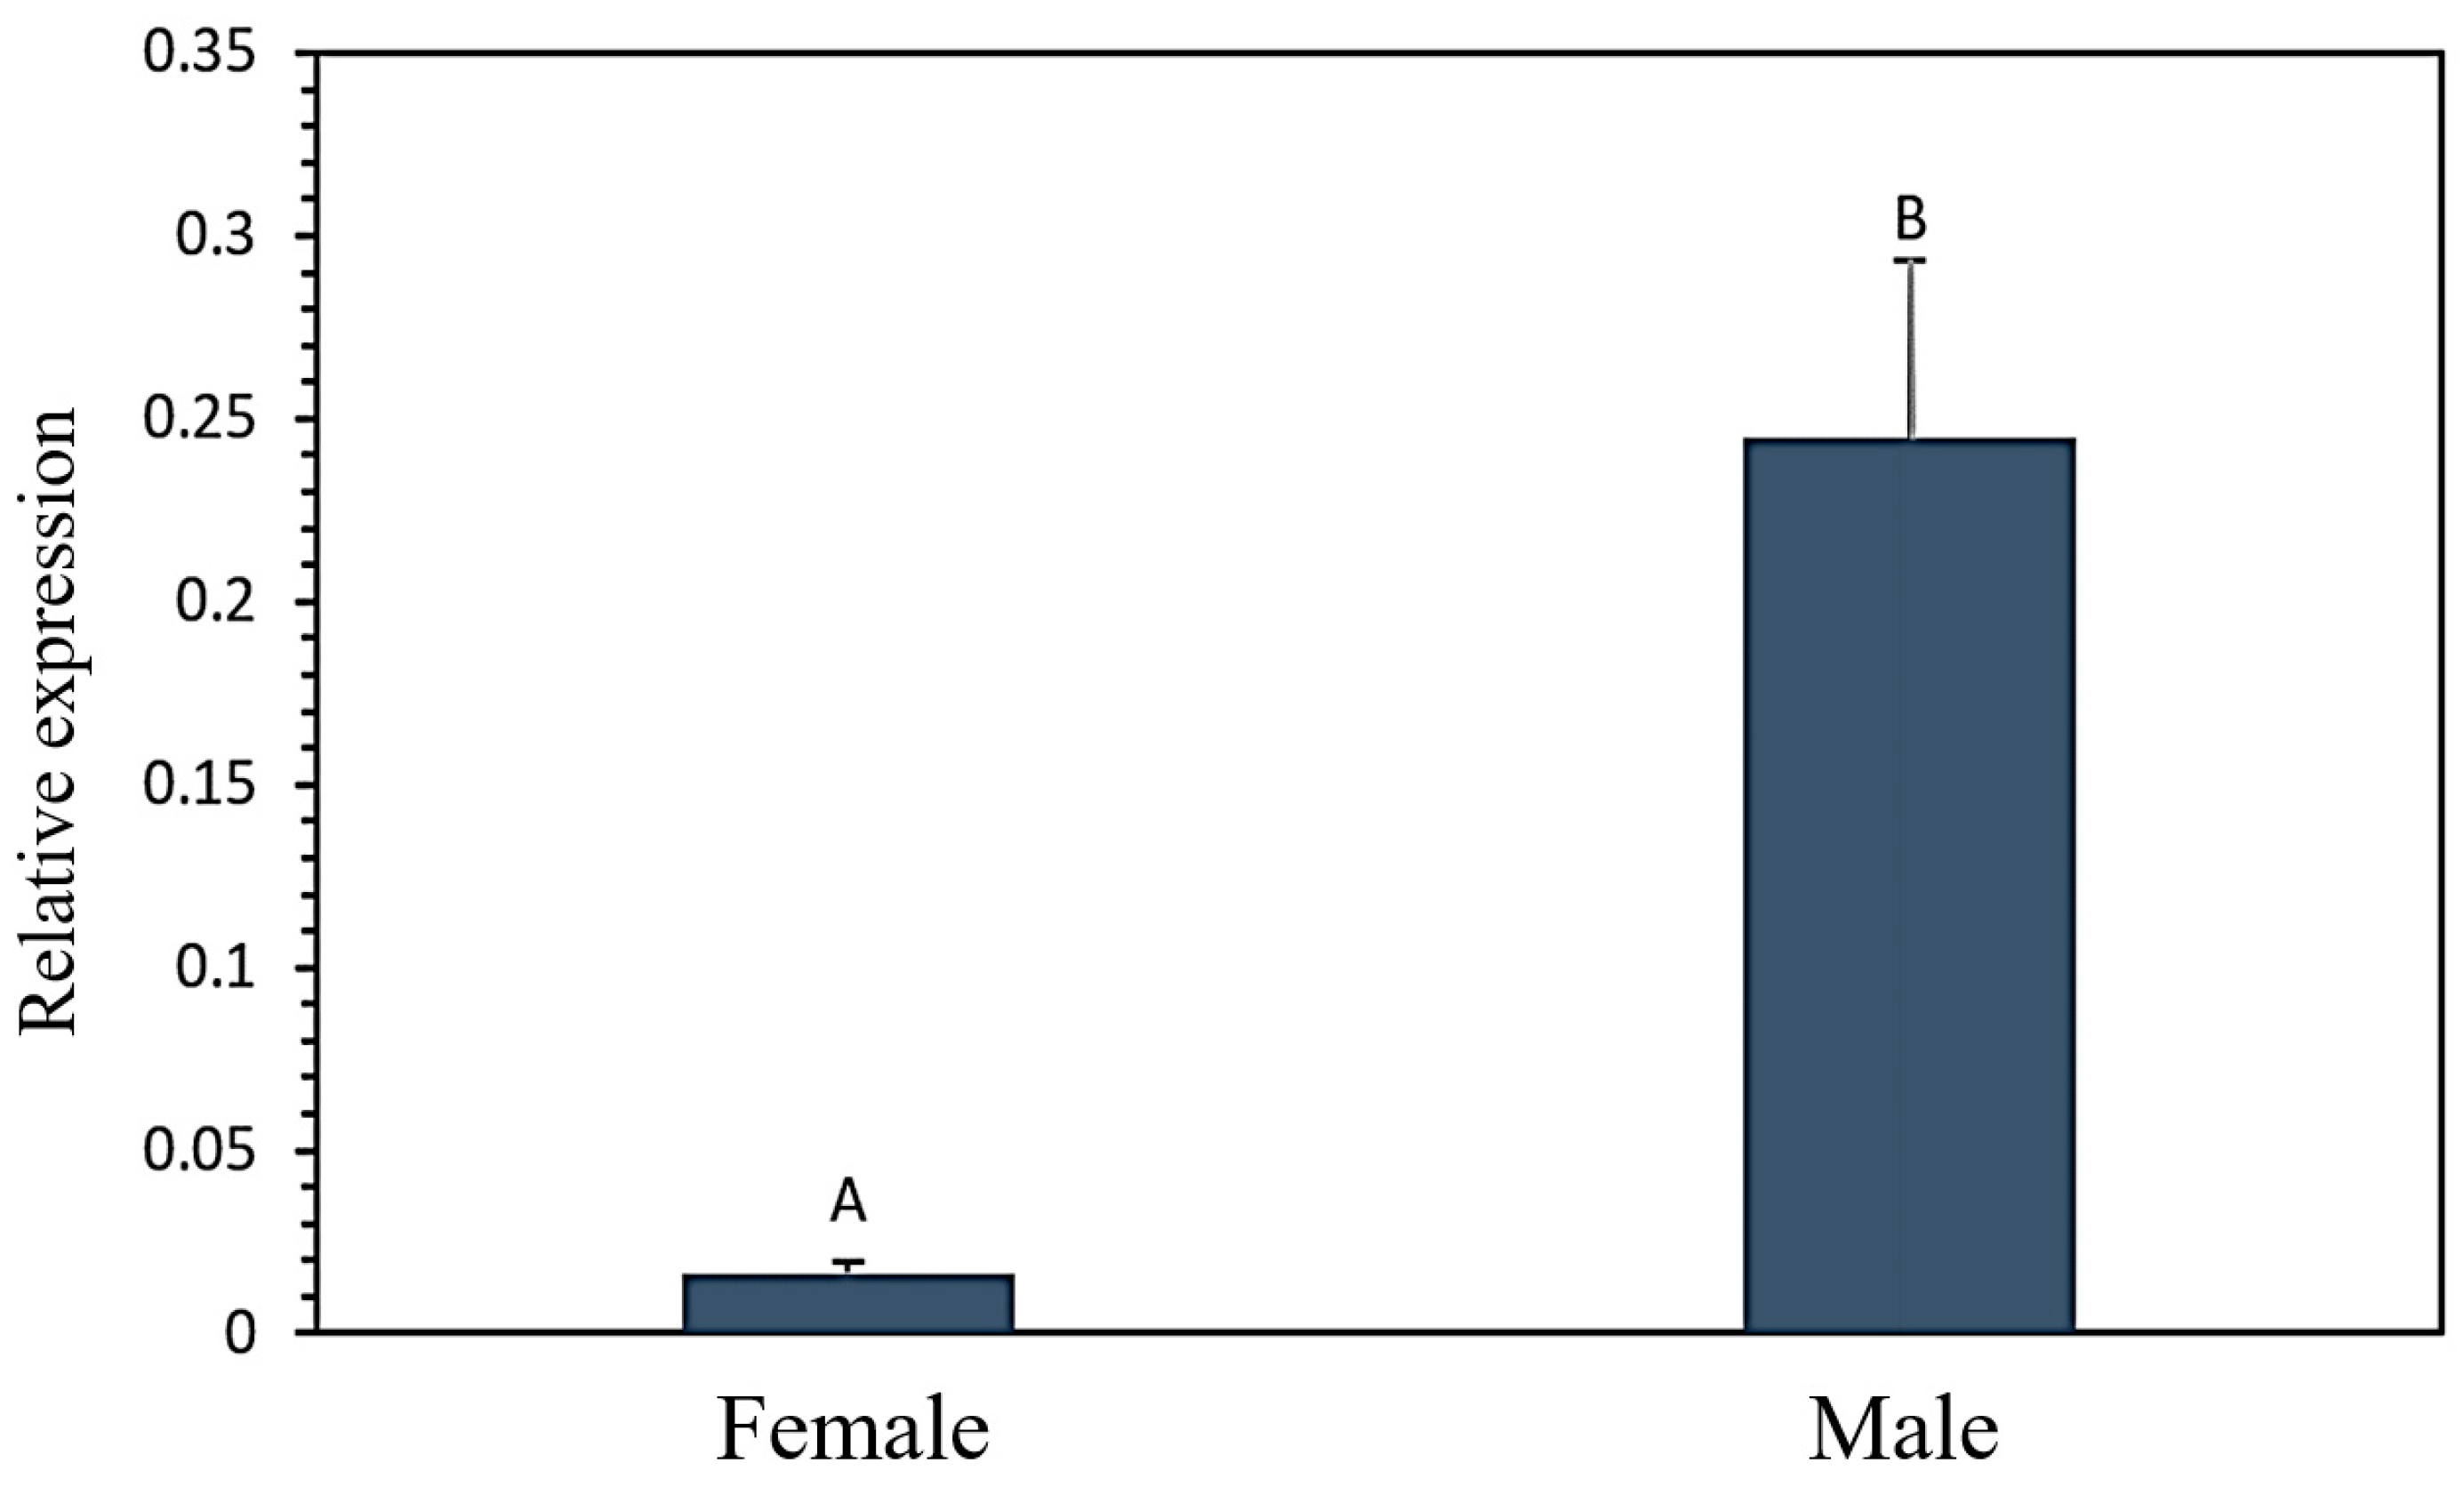
3.2. Analysis of the Differential Expression Level of the FASN Gene in Male and Female Goats

The mRNA expression level of the FASN gene was detected in longissimus dorsi tissue in male and female goats by using RT-qPCR. The results showed that the expression level has a gender-specific feature, with significantly lower expression in females than in male goats (Figure 3).

3.3. Effect of Variation in FASN on Body Size Traits

In the allele (presence/absence) model, the presence of C was associated with decreased body weight (p < 0.01), heart girth (p < 0.01) and wither height (p = 0.04). The presence of T was associated with increased body weight (p < 0.01) and heart girth (p = 0.05) (Table 3). The genotype was found to have an effect on body weight (p < 0.01) and heart girth (p = 0.01). The TT genotype resulted in a higher body weight and heart girth compared to those with the genotypes CC and CT (Table 4). No associations were found between the other FASN alleles/genotypes and body length and circumference of the cannon bone.
The results showed that the effect of variation in FASN gene on body size traits has a gender-specific feature. In the allele (presence/absence) model, the presence of C was associated with decreased body weight (p < 0.01), heart girth (p = 0.02), wither height (p < 0.01) and body length (p = 0.03) in female goats. The presence of T was associated with increased body weight (p < 0.01) in females (Table 5). The TT genotype resulted in a higher body weight (p < 0.01), heart girth (p = 0.05), wither height (p < 0.01) and body length (p = 0.04) compared to those with the genotypes CC and CT in female goats (Table 6). But no associations were found between the FASN alleles/genotypes and body size traits.

4. Discussion

The Guizhou white goat is a prized local breed with significant economic value, which is currently the largest local goat breed in Guizhou province, China. However, the breed faces challenges that impede its industrial advancement, including a protracted growth rate, diminished physical robustness, and a suboptimal feed utilization rate, all of which severely limit the development of the Guizhou white goat industry. The FASN gene, a pivotal player in the lipid metabolic pathway, encodes the enzyme fatty acid synthase. This enzyme catalyzes the de novo fatty acid synthesis, initiating from acetyl coenzyme A and malonyl-CoA, which is integral to the bioenergetic and structural requirements of the organism. The FASN-mediated biosynthetic pathway is not only fundamental to the assembly of cell membranes but also underpins energy storage and signal transduction mechanisms [1,3,11]. Throughout the ontogenetic trajectory of animals, the activity of the FASN gene is a determining factor in adipose tissue formation and energy deposition, directly influencing the growth trajectory, feed conversion efficiency and overall health of the animals [12,13,14]. Given the cardinal role of the FASN gene in regulating metabolic balance and growth, an investigation into the effects of its genetic variations on the growth performance of Guizhou white goats is both pertinent and timely; this could contribute to the economic potential and sustainability of the Guizhou white goat industry.
This study focuses on different groups of Guizhou white goats, identifying a nucleotide variation in exon 21 of the FASN gene, which is characterized as a synonymous mutation. Although the mutation site does not alter the amino acid sequence of the resultant protein, it may still have implications for gene expression and regulation, a phenomenon that warrants further exploration. The PIC at this specific locus has been calculated and is classified as moderately polymorphic for the population (0.5 > PIC > 0.25). This suggests considerable genetic diversity that could be harnessed through targeted breeding programs to enhance desirable traits. Despite intentional selection pressures exerted by breeders throughout the breed’s evolutionary history, the population remains in Hardy–Weinberg equilibrium. This equilibrium indicates a potential for future selective breeding initiatives aimed at improving production traits, such as growth rate, meat quality and carcass traits.
In this study, an analysis of FASN gene expression levels in the longissimus dorsi tissue of goats across different sexes revealed a marked disparity, with rams exhibiting significantly higher expression levels than ewes. This discovery holds significant implications for understanding the genetic underpinnings of growth differences between sexes in goats. Given that the FASN gene encodes a critical enzyme involved in the regulation of fatty acid synthesis rates, its elevated expression levels are typically associated with accelerated growth of muscular and adipose tissues. Empirical breeding observations corroborate this finding, as rams are known to surpass ewes in terms of growth velocity and meat production during their rapid growth phase. This sexual dimorphism in FASN gene expression aligns with the biological traits and provides indirect evidence that the FASN gene is an important candidate gene in the regulation of caprine growth. This correlation between FASN expression and growth characteristics is further supported in this study. Li et al. [15] have also reported gender-specific expression patterns of FASN in healthy adults which were positively correlated with increased serum triglyceride levels. Similarly, some studies have found that the FASN gene has different expression levels in pigs, Yanbian Yellow cattle and Gannan Yak, which reveals that the FASN gene is highly expressed in adipose tissue [16,17,18]. These findings indicate variable expression levels among breeds and tissues, which could contribute to the present result of its higher expression level in perirenal adipose tissue.
Extensive research has consistently revealed significant correlations between polymorphisms within the FASN gene and the growth performance parameters of domesticated animals. Aimaamory et al. [19] have provided compelling evidence that the A/G mutational site within the FASN gene exerts a significant influence on body weight and weight gain between birth and weaning of Awassi Sheep. This underscores the potential role of the FASN gene in modulating growth traits in Awassi Sheep. In the porcine domain, several studies have identified a significant correlation between the mutation locus on the porcine FASN gene and back fat fatty acid composition, feed conversion, meat color traits and back fat thickness [5,20,21]. These associations suggest that the FASN gene may be a critical determinant of meat quality attributes. In cows, FASN gene mutations have been correlated with alterations in milk fat content and the proportional composition of primary milk constituents [17,22]. In Qinchuan cattle, it has also been found that FASN gene mutations are significantly associated with growth, carcass traits, body size characteristics and intramuscular fat [9,10]. Therefore, these findings collectively substantiate the FASN gene’s role as a pivotal candidate gene impacting the growth traits of livestock. Building upon this foundation, in this study, the g.141C/T mutation within the FASN gene was identified to have a significant association with body weight and heart girth in Guizhou white goats. This association was found to be gender-specific, with the female population exhibiting a pronounced correlation between variations at this site and body weight, wither height, body length and heart girth, which could have important implications for sex-specific breeding strategies.

5. Conclusions

In conclusion, the work presented in this study confirms a single mutation site, g.141C/T, in exon 21 of the FASN gene. This mutation was found to have a significant impact on body weight, wither height, body length and heart girth in Guizhou white goats. Additionally, the association and expression levels of the FASN gene in longissimus dorsi tissues were found to be gender-specific. Therefore, further research into the role of the FASN gene in determining growth traits seems to be warranted.

Author Contributions

Q.A. and L.Z. performed the data analysis and wrote the manuscript. W.W., J.Y. and X.S. performed the investigation and collected the samples. J.M. and Y.Z. performed the procedures and formal analysis using the software. Q.A. performed the project administration and revised the manuscript. All authors have read and agreed to the published version of the manuscript.

Funding

This study was financially supported by the Science and Technology Program of Guizhou Province (support projects 2020-1Y029), the Innovative Talents of Guizhou Province (2022-(2020)-037), the Doctoral Talent Program of Tongren (Tongren Scientific Research 2023-4), the Doctoral Research Initiation Foundation of Tongren University (trxyDH2001) and the College Students’ Innovation and Entrepreneurship Program (20210605121).

Institutional Review Board Statement

All of the animal studies were conducted in strict compliance with the relevant guidelines established by the Ethics Committee of Tongren University, China (ethics approval file no. TRXY2022-037), 16 March 2022.

Data Availability Statement

The authors affirm that all of the data necessary for confirming the conclusions of this article are present within the article, figures and tables.

Conflicts of Interest

The authors declare no conflicts of interest.

References

  1. Semenkovich, C.F. Regulation of fatty acid synthase (FAS). Prog. Lipid Res. 1997, 36, 43–53. [Google Scholar] [CrossRef] [PubMed]
  2. Angeles, T.S.; Hudkins, R.L. Recent advances in targeting the fatty acid biosynthetic pathway using fatty acid synthase inhibitors. Expert Opin. Drug Dis. 2016, 11, 1187–1199. [Google Scholar] [CrossRef] [PubMed]
  3. Smith, S.; Witkowski, A.; Joshi, A.K. Structural and functional organization of the animal fatty acid synthase. Prog. Lipid Res. 2003, 42, 289–317. [Google Scholar] [CrossRef] [PubMed]
  4. Chirala, S.S.; Jayakumar, A.; Gu, Z.W. Human fatty acid synthase: Role of interdomain in the formation of catalytically active synthase dimer. Proc. Natl. Acad. Sci. USA 2001, 98, 3104–3108. [Google Scholar] [CrossRef] [PubMed]
  5. Maria, G.; Slawomir, S.; Katarzyna, R.; Maciej, S.; Marek, S. Pig fatness in relation to FASN and INSIG2 genes polymorphism and their transcript level. Mol. Biol. Rep. 2016, 43, 381–389. [Google Scholar]
  6. Zhao, L.; Li, F.; Liu, T.; Yuan, L.; Zhang, X.; Zhang, D.; Li, X.; Zhang, Y.; Zhao, Y.; Song, Q.; et al. Ovine ELOVL5 and FASN genes polymorphisms and their correlations with sheep tail fat deposition. Gene 2021, 807, 145954. [Google Scholar] [CrossRef] [PubMed]
  7. Yong, Q.; Zhiguo, H.; Qifa, L.; Zhenshan, L.; Chengli, H.; Guoqing, S.; Rong, D.; Zhuang, X. Developmental changes of the FAS and HSL mRNA expression and their effects on the content of intramuscular fat in Kazak and Xinjiang Sheep. J. Genet. Genom. 2007, 34, 909–917. [Google Scholar]
  8. Liu, C.; Liu, X.; Yuan, Z.; Zhang, X.; Li, F.; Yue, X. Expression profile of FASN gene and association of its polymorphisms with intramuscular fat content in Hu sheep. Anim. Biotechnol. 2023, 34, 4347–4356. [Google Scholar] [CrossRef]
  9. Gao, Y.Y.; Cheng, G.; Cheng, Z.X.; Bao, C.; Yamada, T.; Cao, G.F.; Bao, S.Q.; Schreurs, N.M.; Zan, L.S.; Tong, B. Association of variants in FABP4, FASN, SCD, SREBP1 and TCAP genes with intramuscular fat, carcass traits and body size in Chinese Qinchuan cattle. Meat Sci. 2022, 192, 108882. [Google Scholar] [CrossRef]
  10. Raza, A.H.S.; Gui, L.; Khan, R.; Schreurs, M.N.; Xiaoyu, W.; Wu, S.; Mei, S.; Wang, L.; Ma, X.; Wei, D.; et al. Association between FASN gene polymorphisms ultrasound carcass traits and intramuscular fat in Qinchuan cattle. Gene 2018, 645, 55–59. [Google Scholar] [CrossRef]
  11. Roy, R.; Taourit, S.; Zaragoza, P.; Eggen, A.; Rodellar, C. Genomic structure and alternative transcript of bovine fatty acid synthase gene (FASN): Comparative analysis of the FASN gene between monogastric and ruminant species. Cytogenet. Genome Res. 2005, 111, 65–73. [Google Scholar] [CrossRef]
  12. Cesar, A.S.M.; Regitano, L.C.A.; Koltes, J.E.; Fritz-Waters, E.R.; Lanna, D.P.D.; Gasparin, G.; Mourão, G.B.; Oliveira, P.S.N.; Reecy, J.M.; Coutinho, L.L. Putative regulatory factors associated with intramuscular fat content. PLoS ONE 2015, 10, e0128350. [Google Scholar] [CrossRef] [PubMed]
  13. Hausman, G.J.; Dodson, M.V.; Ajuwon, K.; Azain, M.; Barnes, K.M.; Guan, L.L.; Jiang, Z.; Poulos, S.P.; Sainz, R.D.; Smith, S.; et al. Boardinvited review: The biology and regulation of preadipocytes and adipocytes in meat animals. J. Anim. Sci. 2009, 87, 1218–1246. [Google Scholar] [CrossRef] [PubMed]
  14. Wang, H.N.; Qi, Z.; Li, X.L.; Xiang, J.Z. Nutritional regulation and molecular mechanism of intramuscular fat deposition. Chin. J. Anim. Nutr. 2020, 32, 2947–2958. [Google Scholar]
  15. Li, T.; Meng, W.; Liu, T.C.; Wang, Y.Z.; Zhang, M. Sex differences in FASN protein concentrations in urinary exosomes related to serum triglycerides levels in healthy adults. Lipids Health Dis. 2023, 22, 176. [Google Scholar] [CrossRef] [PubMed]
  16. Ji, S.; Yang, R.; Lu, C.; Qiu, Z.; Yan, C.; Zhao, Z. Differential expression of PPAR gamma, FASN, and ACADM genes in various adipose tissues and longissimus dorsi muscle from Yanbian Yellow cattle and Yan Yellow cattle. Asian Australas. J. Anim. Sci. 2014, 27, 10–18. [Google Scholar] [CrossRef]
  17. Shi, B.; Jiang, Y.; Chen, Y.; Zhao, Z.; Zhou, H.; Luo, Y.; Hu, J.; Hickford, J.G.H. Variation in the Fatty Acid Synthase gene (FASN) and its association with milk traits in Gannan yaks. Animals 2019, 9, 613. [Google Scholar] [CrossRef] [PubMed]
  18. Chen, J.; Yang, X.J.; Tong, H.; Chen, J.; Zhao, R.Q. Expressions of FAS and HSL mRNA in longissimus dorsi muscle and their relation to intramescular fat contents in pig. Chin. J. Agric. Biotechnol. 2004, 12, 422–426. [Google Scholar]
  19. Almaamory, Y.A.; Al-Anbari, N.N. Relationship of FASN Gene Polymorphism in Growth Performance and Wool Traits of Awassi Sheep. IOP Conf. Ser. Earth Environ. Sci. 2023, 1214, 012032. [Google Scholar] [CrossRef]
  20. Martina, Z.; Diana, L.; Paolo, Z.; Marcello, M.; Andrea, S.; Leonardo, N.C.; Roberta, D. Association study between backfat fatty acid composition and SNPs in candidate genes highlights the effect of FASN polymorphism in large white pigs. Meat Sci. 2019, 156, 75–84. [Google Scholar]
  21. Piórkowska, K.; Małopolska, M.; Ropka-Molik, K.; Szyndler-Nędza, M.; Wiechniak, A.; Żukowski, K.; Lambert, B.; Tyra, M. Evaluation of SCD, ACACA and FASN Mutations: Effects on Pork Quality and Other Production Traits in Pigs Selected Based on RNA-Seq Results. Animals 2020, 10, 123. [Google Scholar] [CrossRef] [PubMed]
  22. Vohra, V.; Kumar, M.; Chopra, A.; Niranjan, S.K.; Mishra, A.K.; Kataria, R.S. Polymorphism in Exon-40 of FASN Gene in Lesser known Buffalo breeds of India. J. Anim. Res. 2015, 5, 325–328. [Google Scholar]
Figure 1. Agarose electrophoresis of PCR products of goat FASN gene P1 target fragment.
Genes 15 00656 g001
Figure 2. The sequencing maps of the novel SNP in the goat FASN gene. A schematic representation of the FASN gene sequence with the novel position identified, the peaks in the red box represent the nucleotide variation sites.
Genes 15 00656 g002
Figure 3. The mRNA relative expression level of FASN in longissimus dorsi tissue of Guizhou white goats. Different letters above the error bars indicate significant differences at the p < 0.05 level.
Genes 15 00656 g003
Table 1. Primers information used for PCR and RT-qPCR.
PrimerPrimer Sequences (5′ → 3′)Tm (°C) Product Length (bp)
FASN-P1F:CTCTGGAAGGACAACTGGGT57 °C638 bp
R:AAGAGGGGCGAAATCTGTCA
FASN-P2F:CCGACGTGGTAATGAACAGG57 °C361 bp
R:CCCCTCAGAAGACATCAGCT
FASN
(RT-qPCR)
F:CTTGACACGGCTCAACTCG58 °C118 bp
R:ATAGGTGGGGATGCTGAGC
GAPDH
(RT-qPCR)
F: GGCCTCCAAGGAGTAAGGTC58 °C124 bp
R: CGGGAGATTCTCAGTGTGGT
Table 2. Population genetic analysis of FASN gene in goats.
GenotypeGenotype FrequencyAlleleAllele FrequencyHoHeNeχ2PIC
CC43.08%C64.1%0.54150.45850.45731.3437
(p = 0.25)
0.35
TT14.87%T35.9%
CT42.05%
Table 3. Association of FASN alleles with body size traits in goats.
Body Size TraitAllelePresentAbsentp-Value
Body weight (kg)C25.48 ± 0.7332.71 ± 1.44<0.01
T28.30 ± 0.8724.82 ± 1.04<0.01
Heart girth (cm)C69.19 ± 0.7873.95 ± 1.48<0.01
T71.33 ± 0.9168.56 ± 1.070.05
Wither height (cm)C57.23 ± 0.7060.12 ± 1.240.04
T57.81 ± 0.7858.10 ± 1.040.82
Body length (cm)C51.14 ± 1.0954.08 ± 2.040.19
T51.45 ± 1.2352.21 ± 1.600.70
Circumference of cannon bone (cm)C7.55 ± 0.187.90 ± 0.350.37
T7.69 ± 0.207.51 ± 0.250.57
For each body size trait, p-values in bold are significant.
Table 4. Association of FASN genotypes with body size traits in goat.
Body Size TraitsGenotypeMean ± Standard Errorp-Value
Body weight (kg)CC24.79 ± 1.0 a<0.01
CT26.18 ± 1.01 a
TT32.72 ± 1.44 b
Heart girth (cm)CC68.54 ± 1.06 a0.01
CT69.89 ± 1.11 ab
TT73.97 ± 1.48 b
Wither height (cm)CC58.09 ± 1.010.07
CT56.48 ± 0.95
TT60.11 ± 1.24
Body length (cm)CC52.34 ± 1.580.25
CT50.13 ± 1.45
TT54.16 ± 2.04
Circumference of cannon bone (cm)CC7.51 ± 0.250.65
CT7.59 ± 0.25
TT7.90 ± 0.36
In the same column, the values with different letter superscripts have a significant difference (p < 0.05).
Table 5. Association of FASN alleles with body size traits in male and female goats.
Body Size TraitAlleleMaleFemale
PresentAbsentp-ValuePresentAbsentp-Value
Body weight (kg)C30.41 ± 1.5930.19 ± 2.110.9328.42 ± 0.5833.16 ± 1.24<0.01
T30.47 ± 1.4630.08 ± 1.800.8430.55 ± 0.6827.29 ± 0.86<0.01
Heart girth (cm)C73.34 ± 2.8971.35 ± 3.560.6571.94 ± 0.6375.20 ± 1.280.02
T73.20 ± 2.5770.99 ± 3.590.5775.27 ± 0.7071.18 ± 0.960.08
Wither height (cm)C61.52 ± 2.1057.96 ± 2.580.2756.90 ± 0.6461.51 ± 1.18<0.01
T58.98 ± 1.8463.12 ± 2.570.1558.01 ± 0.7557.67 ± 1.070.79
Body length (cm)C54.98 ± 1.7053.81 ± 2.090.6650.25 ± 1.2758.50 ± 3.120.03
T54.01 ± 1.5055.82 ± 2.100.4350.90 ± 1.7152.75 ± 2.700.57
Circumference of cannon bone (cm)C8.17 ± 0.297.96 ± 0.360.637.32 ± 0.188.05 ± 0.430.15
T8.11 ± 0.268.04 ± 0.360.877.41 ± 0.217.45 ± 0.340.92
For each body size trait, p-values in bold are significant.
Table 6. Association of FASN genotypes with body size traits in male and female goats.
Body Size TraitGenotypeMaleFemale
Mean ± Standard Errorp-ValueMean ± Standard Errorp-Value
Body weight (kg)CC30.16 ± 1.880.9727.29 ± 0.84 a<0.01
CT30.71 ± 1.9829.45 ± 0.80 a
TT30.19 ± 2.1333.16 ± 1.23 b
Heart girth (cm)CC71.45 ± 3.660.6371.23 ± 0.95 a0.05
CT75.08 ± 3.5572.48 ± 0.82 ab
TT71.29 ± 3.5775.17 ± 1.28 b
Wither height (cm)CC63.25 ± 2.640.3157.70 ± 0.97 a<0.01
CT59.94 ± 2.5656.34 ± 0.82 a
TT58.01 ± 2.5861.52 ± 1.18 b
Body length (cm)CC55.86 ± 2.160.7352.75 ± 2.10 a0.04
CT54.18 ± 2.1049.00 ± 1.49 ab
TT53.84 ± 2.1158.50 ± 2.97 b
Circumference of cannon bone (cm)CC8.08 ± 0.370.827.45 ± 0.320.32
CT8.26 ± 0.367.25 ± 0.22
TT7.95 ± 0.368.05 ± 0.45
In the same column, the values with different letter superscripts have a significant difference (p < 0.05).
Disclaimer/Publisher’s Note: The statements, opinions and data contained in all publications are solely those of the individual author(s) and contributor(s) and not of MDPI and/or the editor(s). MDPI and/or the editor(s) disclaim responsibility for any injury to people or property resulting from any ideas, methods, instructions or products referred to in the content.

