Article

Insights into the Deep Phylogeny and Novel Divergence Time Estimation of Patellogastropoda from Complete Mitogenomes

1
National Engineering Research Center for Marine Aquaculture, Zhejiang Ocean University, Zhoushan 316022, China
2
National Engineering Laboratory of Marine Germplasm Resources Exploration and Utilization, Zhejiang Ocean University, Zhoushan 316022, China
3
Marine Fishery Institute of Zhejiang Province, Key Laboratory of Sustainable Utilization of Technology Research for Fishery Resource of Zhejiang Province, Zhejiang Ocean University, Zhoushan 316021, China
*
Authors to whom correspondence should be addressed.
These authors contributed equally to this work.
Genes 2022, 13(7), 1273; https://doi.org/10.3390/genes13071273
Submission received: 1 June 2022 / Revised: 13 July 2022 / Accepted: 16 July 2022 / Published: 18 July 2022
(This article belongs to the Special Issue Genetic Breeding and Genomics of Marine Shellfish)

Abstract

:
To further understand the origin and evolution of Patellogastropoda, we determined the mitochondrial genome sequence of Cellana toreuma, and compared its mitogenome characteristics with the other four limpets of Nacellidae. The ratio of Ka and Ks indicated that these Nacellidae species were suffering a purifying selection, with exception of the atp6 gene. The gene sequence is basically consistent among families, while there are great differences among Lottidae species. According to the mitogenome sequences of selected gastropod species, we reconstructed a new phylogenetic tree with two methods. The data complement the mitogenome database of limpets and is a favorable research tool for the phylogenetic analysis of Gastropoda. It is found that there is a long-branch attraction (LBA) artefact in the family Lottiidae of Patellogastropoda. Therefore, the Patellogastropoda was separated by Heterobranchia, and Lottiidae is located at the root of the whole phylogenetic tree. Furthermore, we constructed the divergence time tree according to the Bayesian method and discussed the internal historical dynamics, and divergence differences among the main lineages of 12 Patellogastropoda under an uncorrelated relaxed molecular clock. In turn, we made a more comprehensive discussion on the divergence time of limpets at the molecular level.

1. Introduction

Mitochondria are circular double-membrane semiautonomous organelle, which exist in the cells of most eukaryotic species. It has an independent and complete mitochondrial genome. They originate from an endosymbiotic α-proteobacterium and usually provide chemical energy sources through oxidative phosphorylation [1,2,3,4]. Because mutations affecting mitochondrial function are related to aging and disease, it also has certain biomedical significance [5,6]. The advantages of mitochondria are that their evolution rate is faster than that of nuclear genes in most species. Each cell has multiple copies of the mitochondrial genome and higher A-T content [7]. Moreover, it also has the characteristics of conservation gene function [8]. Mitogenome recombination is a common process in protists and plants [9,10]. Single genes may affect the progress of species relationships because of their different evolutionary rates [11]. Thus, the complete mitogenome is considered significant in population genetics and phylogeny, as well as an important tool for an in-depth understanding of gastropod phylogenetics.
Patellogastropoda, as an archaic mollusk, has caused concern in the scientific community. Due to their important ecological status and biodiversity, it is often researched in morphology, ecology, biogeography, embryology, and population genetics [12,13,14,15,16,17,18]. Patellogastropoda has assumed a significant role in the evolution of marine organisms among the gastropods on intertidal rocky shores. They have experienced a long period of species evolution, while the current classification indicates that Patellogastropoda includes the two superfamilies of Lottioidea (Gray, 1840) and Patelloidea (Rafinesque, 1815) [19]. According to the latest classification, the superfamily Lottioidea includes seven families (Acmaeidae, Eoacmaeidae, Erginidae, Lepetidae, Lottiidae, Neolepetopsidae, and Pectinodontidae), while the superfamily Patelloidea has only two families (Nacellidae and Patellidae) [19]. Previous identification of Patellogastropoda species was based on morphology and has caused taxonomic confusion. Limpets are considered cryptic species and the appearance of different species is almost similar. Surprisingly, the immature forms of limpets differ from the adults, which causes more complications for species identification.
The small economic limpet Cellana toreuma (Reeve, 1854) is found on sheltered to intertidal rocky shores and is widely distributed from tropical to Polar regions [20] this includes mainly China, Japan, South Korea, Ryukyu, Vietnam, and the Philippines [21,22,23,24,25,26,27]. The limpet is an important grazer and an ectoparasitic host of Philoblenna tumida (Ho, 1981), Hexanauplia [28,29,30]. Due to the complex biogeographic model of limpets, they are used to understand the distribution pattern of species in the intertidal zone along heterogeneous coastline [31,32,33,34]. Their shell is a rare Chinese herbal medicine, which is often collected and processed in summer [35]. It is mainly used for children with convulsions and other symptoms to implement a sedative effect [36]. The duration of planktonic larvae of C. toreuma is uncertain, while the reported results show that they can last for at least 8 to 13 days [37,38]. C. toreuma is sensitive to ambient temperature, and high temperature will affect cardiac performance and lead to large-scale mortality [39,40,41]. Early reports mention studies and analyses being conducted on morphological and population dynamics. Firth and Williams [37] used multiple environmental stressor influences to study the population dynamics of C. toreum. The effects of large changes in temperature and salinity associated with wet monsoon seasons on the structure and function of tropical rocky coasts are thus revealed. Wang and Wu [42] collected and measured data from northern Zhejiang, China, and studied the age and growth of C. toreum. It is concluded that their annual ring formation period is in January and the cycle is one year. Qian et al. [43] reported optical and electron microscopy to observe the radular morphological differences between C. toreuma and Cellana grata. Hirano [44] mentioned the activity pattern of C. toreuma field population and learned that it is more frequent at flood and ebb tide. Iwasaki [45] studied the interindividual trail following C. toreuma and found that they moved farther during spring tides. However, there have only been a few reports on the phylogenetic studies of this species. Wang et al. [24] selected a single mitochondrial COI to reveal the phylogeographical pattern of C. toreuma and investigate the effect of environmental and historical factors on this pattern. Similarly, Nakano [27] discovered a hidden species of C. toreuma through the COI gene and analyzed its fundamental evolutionary relationship. Until the 21st century, Nakano and Ozawa [26] presented a comprehensive phylogenetic study on the global limpets and combined mitochondrial and nuclear sequencing. These are just the preliminary study results of Patellogastropoda phylogeny.
Cellana toreuma, as one of the few mitochondrial whole-genome sequences of Patellogastropoda, provides a further supplement for the phylogenetic analysis of Patellogastropoda. Our aims were to (1) extend the taxonomic study method and improve the Patellogastropoda identification efficiency, (2) compare and evaluate the variation and conservation of mitogenomes to understand the latest classification of Patellogastropoda, (3) via A-T skew values and the relative synonymous codon usage (RSCU) of protein-coding genes (PCGs), understand the gene function, (4) establish a complete analysis system for gastropod phylogeny, especially for limpets evolution, and (5) evaluate divergence time of C. toreuma in subclass Patellogastropoda given the fossil record, so as to study the evolutionary history of limpets.

2. Materials and Method

2.1. Sample Collection, Identification, and DNA Extraction

Cellana toreuma wild specimens were collected from Qingdao of Shandong Peninsula in the Yellow Sea (October 2019; E 120° 45, N 36° 07). The specimens were deposited in absolute ethyl alcohol. The specimens were preliminarily identified through the published taxonomic book [46], and we consulted morphology experts from the marine biology museum of Zhejiang Ocean University. Fresh samples were immediately placed in absolute ethyl alcohol to ensure their quality. Using the rapid salting-out method, we extracted the genomic DNA from the adductor muscle [47]. The quality was determined by 1% agarose gel electrophoresis and stored in −20 °C for sequencing. We selected the best quality DNA from the six samples for the next-generation sequencing. All animal experiments were conducted under the guidance approved by the Animal Research and Ethics Committee of Zhejiang Ocean University.

2.2. Mitogenomes Sequencing, Assembly, and Annotation

Mitogenome sequencing of C. toreuma by the Illumina HiSeq X Ten platform was used to conduct high-throughput sequencing; this work was carried out by Origingene Bio-pharm Technology Co., Ltd. (Shanghai, China). The preliminary results showed that a sequencing library set with an average insert size of 400 bp was generated, and each library had about 10 Gb of the raw data. After that, it was necessary to delete contaminated reads and low-quality sequence fragments. The de novo assembled separate clean readings of the sequence via the NOVOPlasty software (https://github.com/ndierckx/NOVOPlasty (accessed on 26 May 2021)) [48].
The mitochondrial genome of C. toreuma was annotated and analyzed based on invertebrate genetic code by the MITOS web server (http://mitos2.bioinf.uni-leipzig.de/index.py (accessed on 30 May 2021)) [49]. We also referred to the uploaded mitogenome sequence of other Nacellidae species to ensure the accuracy of start and stop codons and gene sequences of the species in our study. The circular mitogenome visualization of C. toreuma was completed through the common CGView server (http://stothard.afns.ualberta.ca/cgview_server/index.html (accessed on 30 May 2021)) [50].

2.3. Sequence Analyses of Mitogenomes

The nucleotide composition of the whole mitogenome, PCGs, rRNA, tRNA genes, and A-T content were analyzed by MEGA 7.0 [51]. Meanwhile, it was also determined necessary to study the codon usage and the relative synonymous codon usage (RSCU) of PCGs. Then, the base skew values were calculated using the formulas at A-T skew = (A − T)/(A + T) and G-C skew = (G − C)/(G + C) [52]. In addition, we selected DnaSP6.0 [53] to analyze the non-synonymous (Ka) and synonymous (Ks) substitutions rates of mitogenomes in Nacellidae species to study their evolutionary adaptation. Of which other species in Nacellidae were downloaded from the GenBank database of NCBI (National Center for Biotechnology Information, https://www.ncbi.nlm.nih.gov/ (accessed on 17 March 2022)).

2.4. Phylogenetic Inference

To determine the phylogenetic position of the Patellogastropoda species in gastropods, phylogenetic analyses were performed based on the 13 protein-coding genes (PCGs) of the mitogenomes. A total of 87 sequences were downloaded from GenBank (https://www.ncbi.nlm.nih.gov/ (accessed on 17 March 2022)). Furthermore, two bivalves Donax variegatus and Donax trunculus were classified as outgroup [54] (Table 1). The software DAMBE 5.3.19 [55] was used to adjust the nucleotide sequence of each PCGs, and the substitution saturation was calculated via the GTR substitution model. The sequences were aligned using ClustalW of MEGA 7.0 [51] with the default parameters. Phylogenetic relationships were reconstructed for the maximum likelihood (ML) and Bayesian inference (BI) analyses with IQ-TREE [56] and MrBayes v3.2 [57]. The GTR + F + I + G4 model was chosen according to BIC and was the best fit selected in the ML methods analyses; we used ModelFinder to determine the best model data [58]. We reconstructed the consensus tree and used 1000 bootstrap replicates in ultrafast likelihood bootstrap. The BI analysis selected the best substitution GTR + I + G model under the AIC by MrModeltest 2.3 [59]. The first burn-in 25% of the trees were discarded, and two Markov chain Monte Carlo (MCMC) of simultaneous were operated for 2,000,000 generations. Sampling occurred every 1000 ultrafast bootstrap replicates to determine the branch support of the dataset. The phylogenetic tree was displayed using the online tool iTOL (Interactive Tree of Life, https://itol.embl.de/ (accessed on 20 March 2022)) and annotated with various datasets [60].

2.5. Divergence Time Estimation

The divergence time of the subclass Patellogastropoda species was estimated only at the nucleotide level, 13 PCGs used the Bayesian framework, and we used the uncorrelated and lognormal relaxed molecular clock model in BEAST v1.8.4 [61]. For the tree prior, we used a Yule process of speciation. Furthermore, we used two calibration points as the priors of the divergence times for calibration. The uniform distribution of the estimated divergence times was drawn by Priors [62] for fossil ages, and the 53 Mya point calibration was set as the root rate of Cellana based on the fossil of Cellana tramoserica (14–93 Mya). The 5.6 Mya point calibration was set as the root rate of Nacella based on the fossil of Nacella clypeater [62]. The final Markov chain samples every 1000 generations, discards 10% of the burn-in samples, and runs twice for 100 million generations through the TreeAnnotator v1.8.4 software in the BEAST software package. After that, we use Tracer v. 1.6 [63] to check the convergence of the chain, to ensure that the parameters of the effective sample sizes (ESSs) were greater than 200. We used the software FigTree v1.4.3 to visualize the divergence time tree [64].

3. Results and Discussion

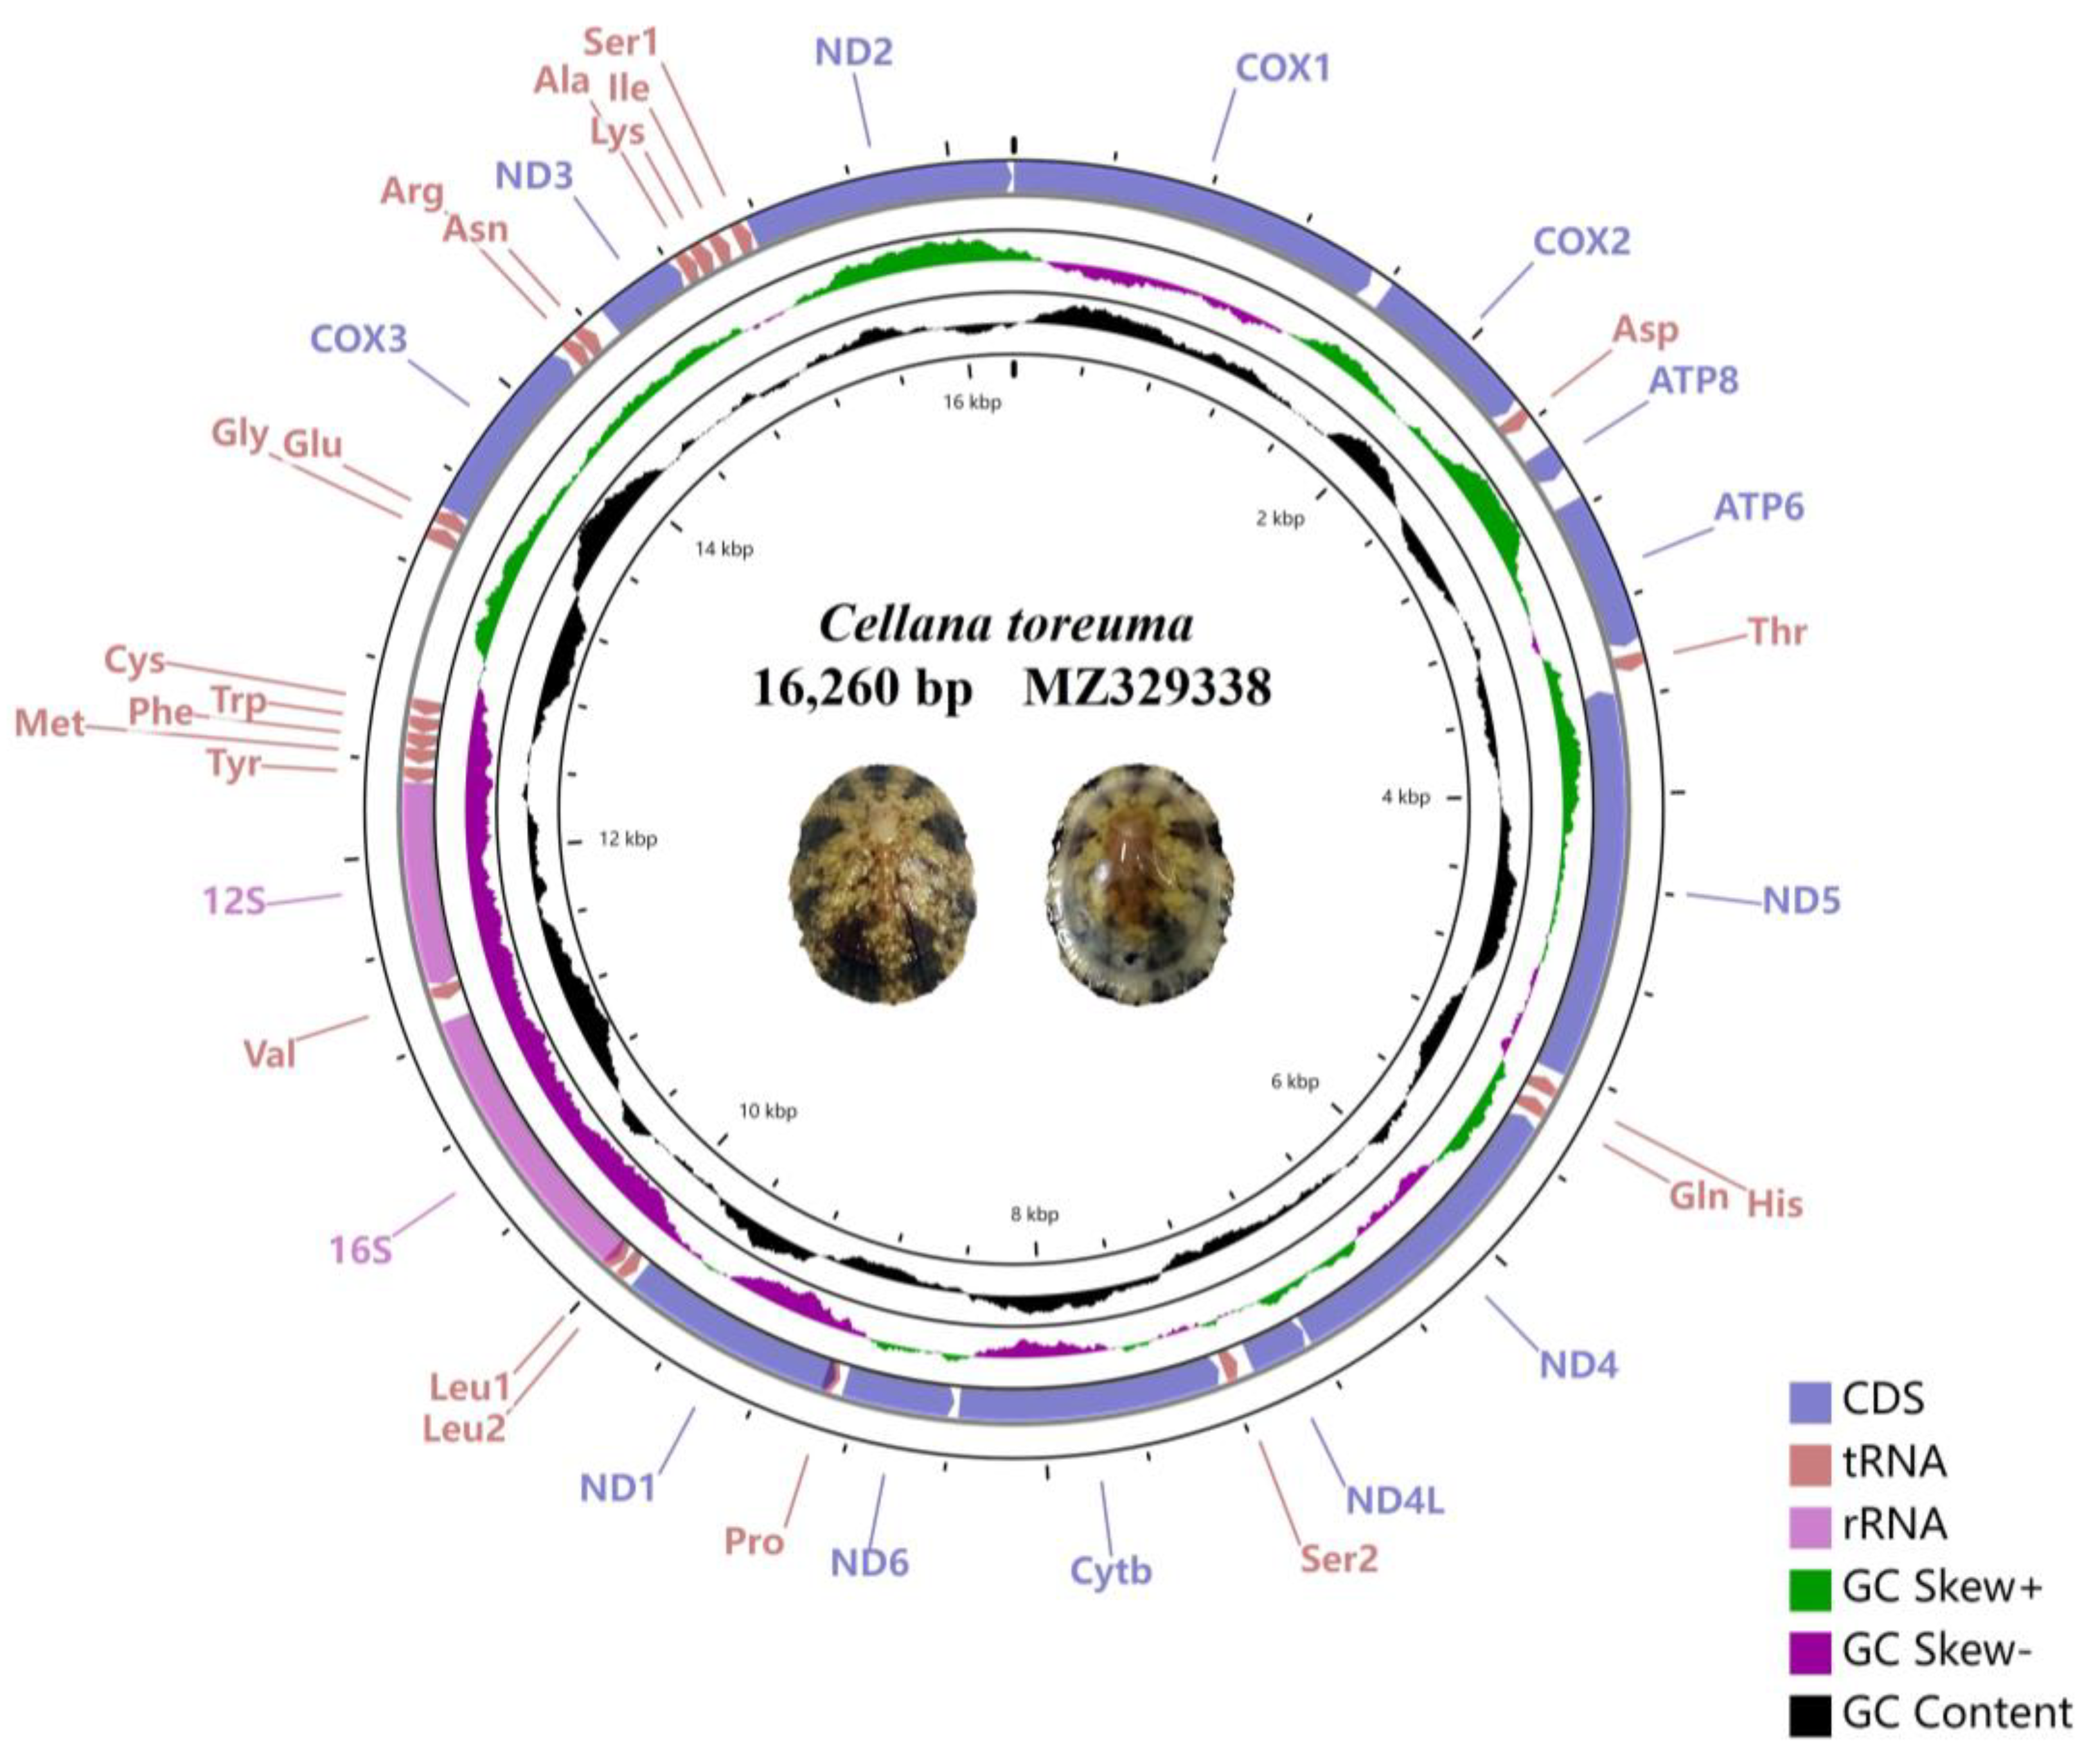
3.1. General Features of Entire Mitogenome

The whole mitogenome sequence of C. toreuma was sequenced with a length of 16,260 bp (GenBank accessions: MZ329338) which is consistent with previously reported species of the four Nacellidae families, approximately 16,153 to 16,767 (Table 1). The circular molecules are similar to other gastropods, which contain a highly variable control region and typically 37 genes including 2 ribosomal RNA genes, 13 protein-coding genes (PCGs), and 22 transfer RNA genes. Among them, a total of seventeen genes on the forward strand, including seven PCGs (cox1-3, atp8, atp6, nad3, and nad2), and ten tRNA genes (trnD, trnT, trnG, trnE, trnR, trnN, trnA, trnK, trnI, and trnS1). The other genes are encoded on the reverse strand (Table 2). The control region was located between the trnC and trnG gene, similar to other previously reported Nacellidae species (Figure 1) [65,66]. The genome structure of C. toreuma was identical to other Nacellidae mitogenomes, without gene rearrangement in this family. However, there was a big difference between their gene order to other families of Patellogastropoda species, whose rearrangement always brought up concern within the scientific community.
The nucleotide compositions of complete C. toreuma mitogenomes were A 28.9%, T 39.5%, G 19.9%, and C 11.7% (Table 3). Moreover, the nucleotide compositions of the mitogenomes from the other four species in the family Nacellidae, Patellogastropoda were downloaded and organized, and we compared the base compositions of these other Nacellidae species. In general, the A content of the five mitogenomes were from 26.5 to 28.9%, T 38.0 to 39.5%, G 19.9 to 22.7%, and C 11.7 to 13.9%, these base contacts only had a slight distinction. Results show that the A and T content of C. toreuma exhibited higher values than other species in the same family, with a range from 64.6% (Cellana nigrolineata) to 68.4%. The nucleotide compositions were all skewed away from C in favor of G, the G-C skews were from 0.177 (N. clypeater) to 0.283 (C. nigrolineata), and from A in favor of T, the A-T skews were negative from −0.180 (Nacella concinna) to −0.155 (C. toreuma), indicating the occurrence of more Ts than As.

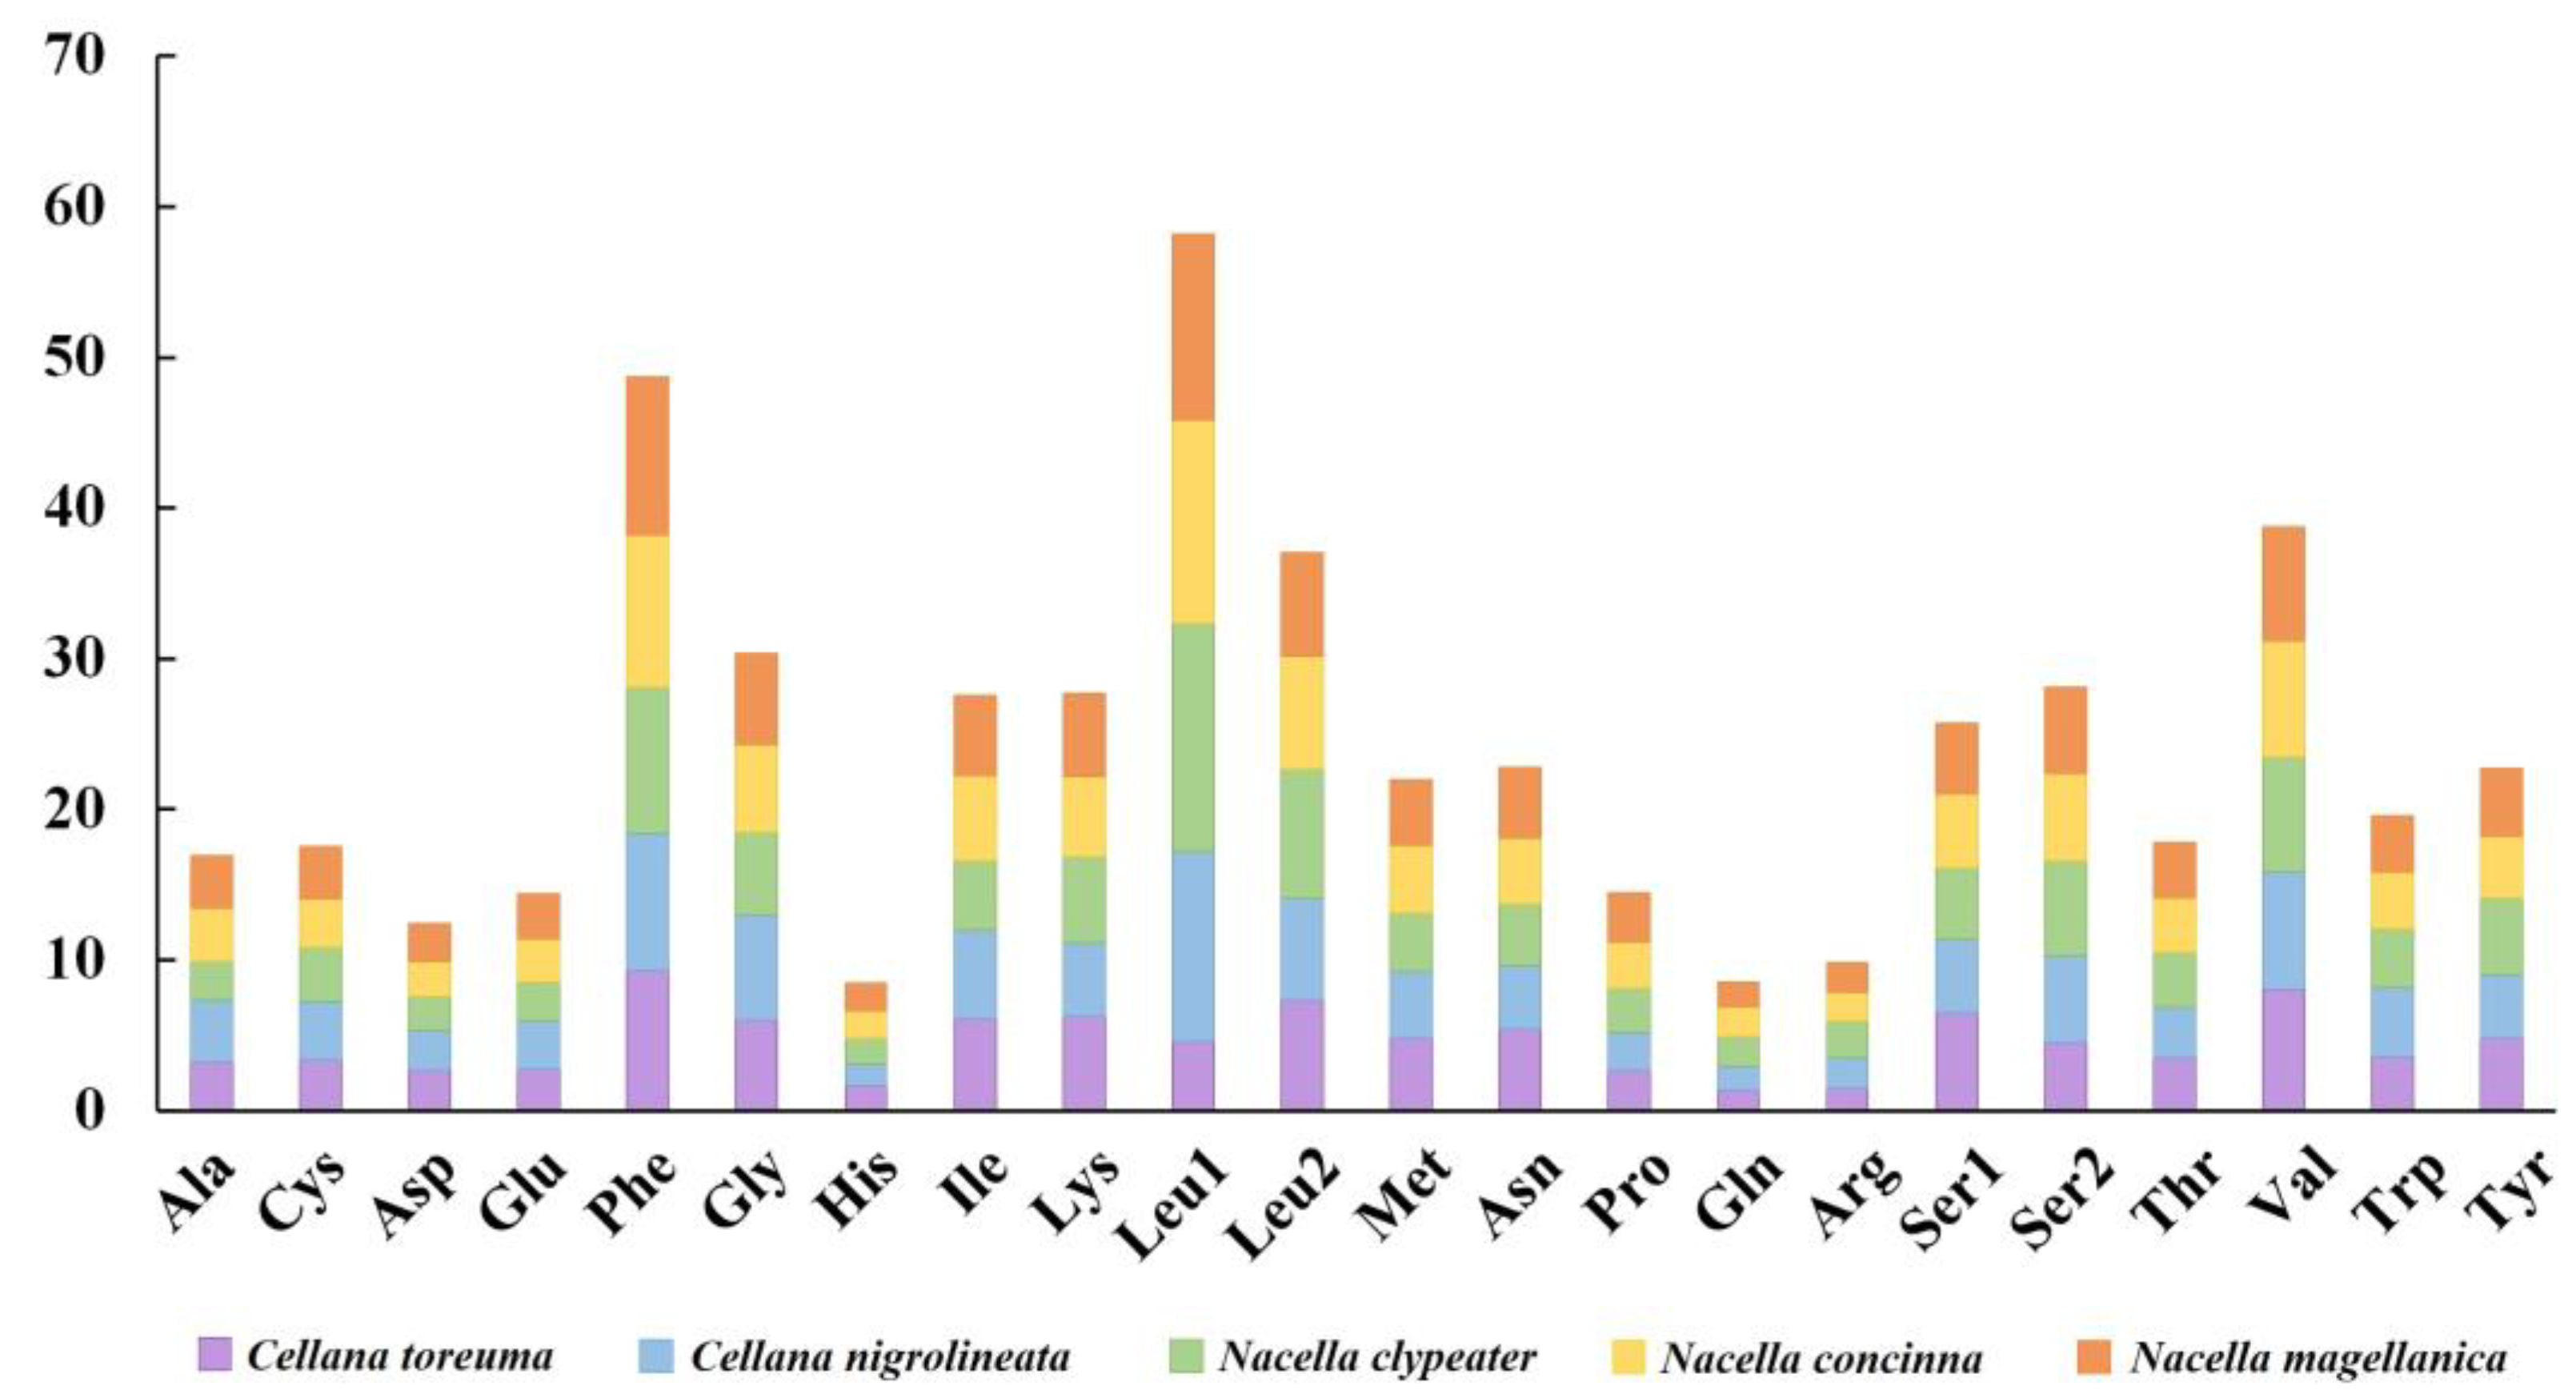
3.2. tRNA, rRNA, PCGs Genes, and Control Region

For the tRNA genes of C. toreuma, the length ranged from 1497–1560 bp, which had an A and T content of 69.6%, which is the highest compared to other Nacellidae species (Table 3). Due to the tRNAs of this limpet having similar values of A and T base, the A-T skew was 0, while the A-T skew of the other four species were negative. However, all the G-C skews were slightly positive from 0.103 (C. toreuma) to 0.125 (N. clypeater). For the rRNA genes, with lengths ranging from 2143 to 2222 bp, the A-T skews were positive from 0.169 (C. toreuma) to 0.237 (N. concinna), indicating a strong skew away from A. Furthermore, almost all G-C skews of these species were negative, except the new limpet C. toreuma.
For the PCGs, the length ranging from 11,046 to 11,286 bp, each species in this family exhibited a negative A-T skew and a positive G-C skew, with values from −0.221 to −0.201. The first codon position of PCGs was observed to be a negative A-T skew, with the A-T content reaching about 65%, and the most value being 67% in C. toreuma. The second and third codon positions of PCGs were similar, while their G-C skews had the opposite results. The mitogenomes of Nacellidae are rich in A-T, which is similar to other invertebrates. The C. toreuma mitogenomes conventional started with the initiation codon ATG or ATT and stopped with TAA or TAG.
Generally, the mitogenome of metazoans is quite compact, whereas a total of 1641 bp in 30 intergenic spacers were found in C. toreuma mitogenome, ranging from 1 to 643 bp in length. Additionally, the control region was found between trnC and trnG (Table 2). Simultaneously, three overlapping sites (totally 87 bp) are observed ranging from 2 to 47 bp, which is commonly identified in other Nacellidae.

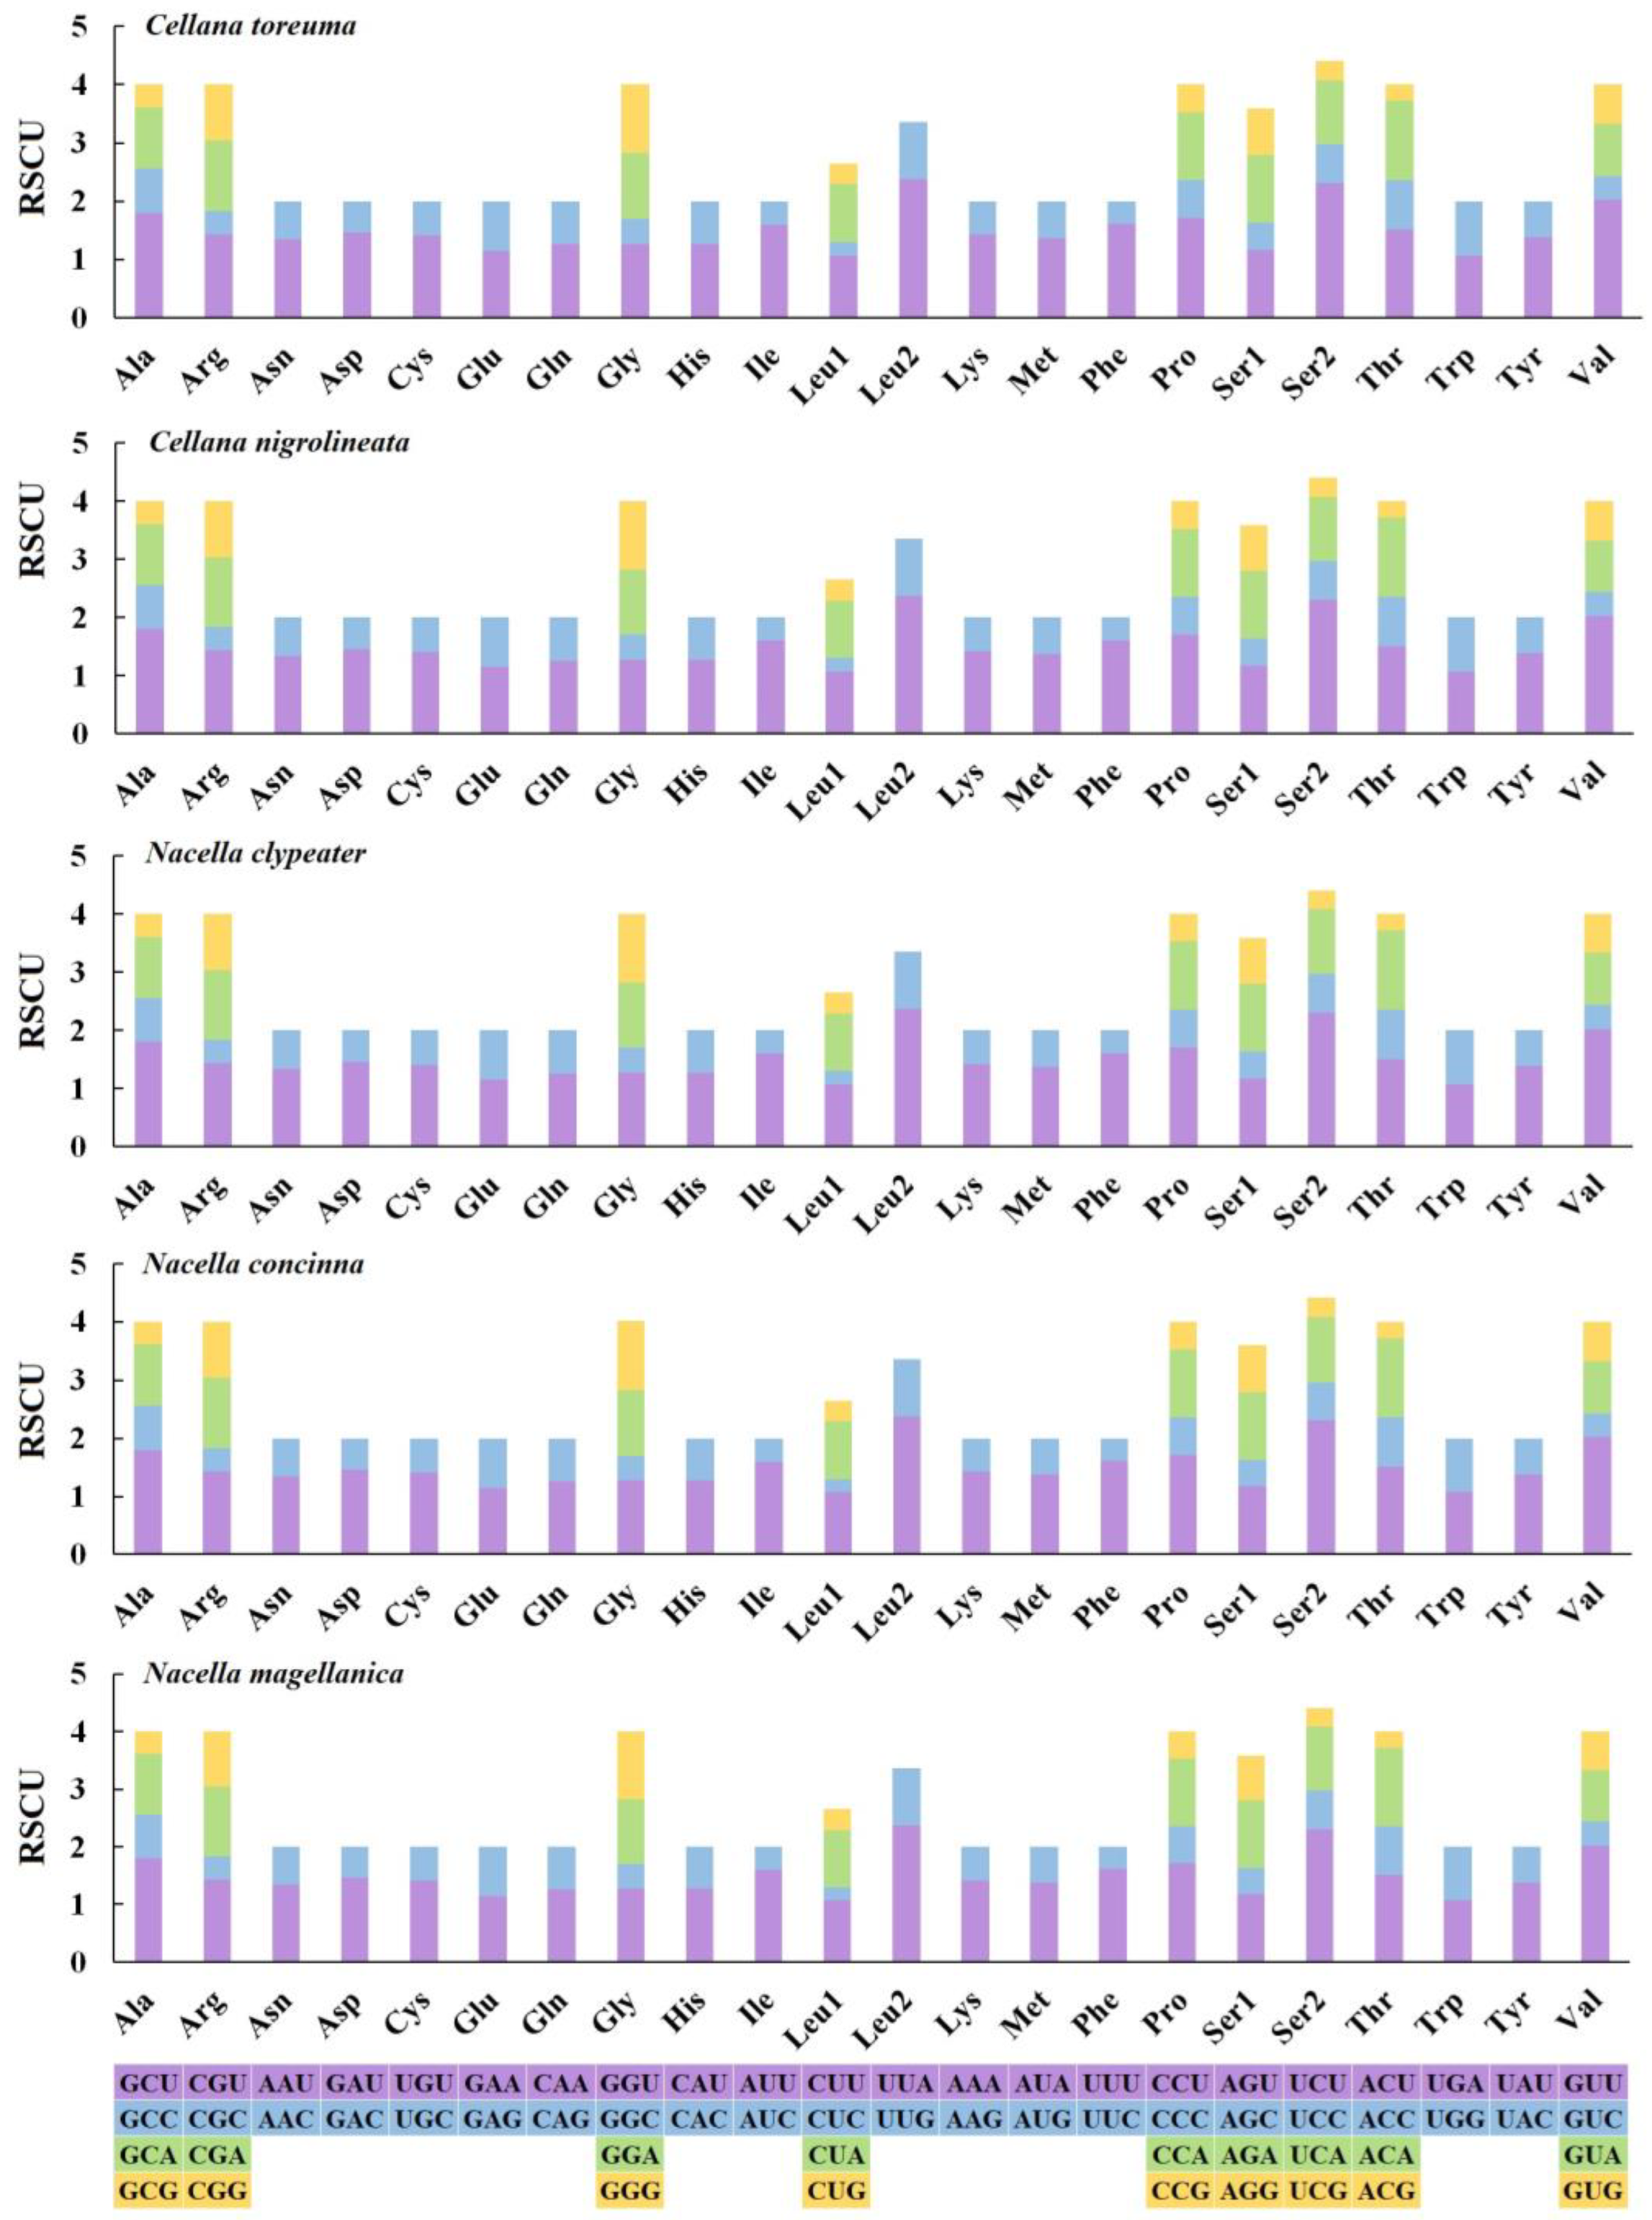
3.3. Mitochondrial Gene Codon Usage

The amino acids of five Nacellidae species, Leu1, Phe, and Val, were most frequently utilized ranging from 7.60 to 15.11% in Phe of N. clypeater (Figure 2). The rare amino acid was concentrated in His, Gln, and Arg, most of them less than 2 with the least being Gln of C. toreuma (only 1.38%), which is similar to other Patellogastropoda as previously reported [67,68].
The relative synonymous codon usage (RSCU) for 13 PCGs of these species was measured to understand the genetic codon bias of their sequenced mitogenomes. The results showed that the synonymous codon preferences are conserved among the five species, as may ascribe to their close relationships belonging to the same family. These preferences were also recognized in some other Patellogastropoda. The four most used codons for the five species sequenced are consistently UUA (Leu2), UCU (Ser2), GCU (Ala), and CCU (Pro) for five Nacellidae species (Figure 3), and the most frequent codons of them were UUA at 2.4% (Leu2) in N. magellanica. The least used codon was CUC (Leu1) in C. toreuma, which was 0.1%.

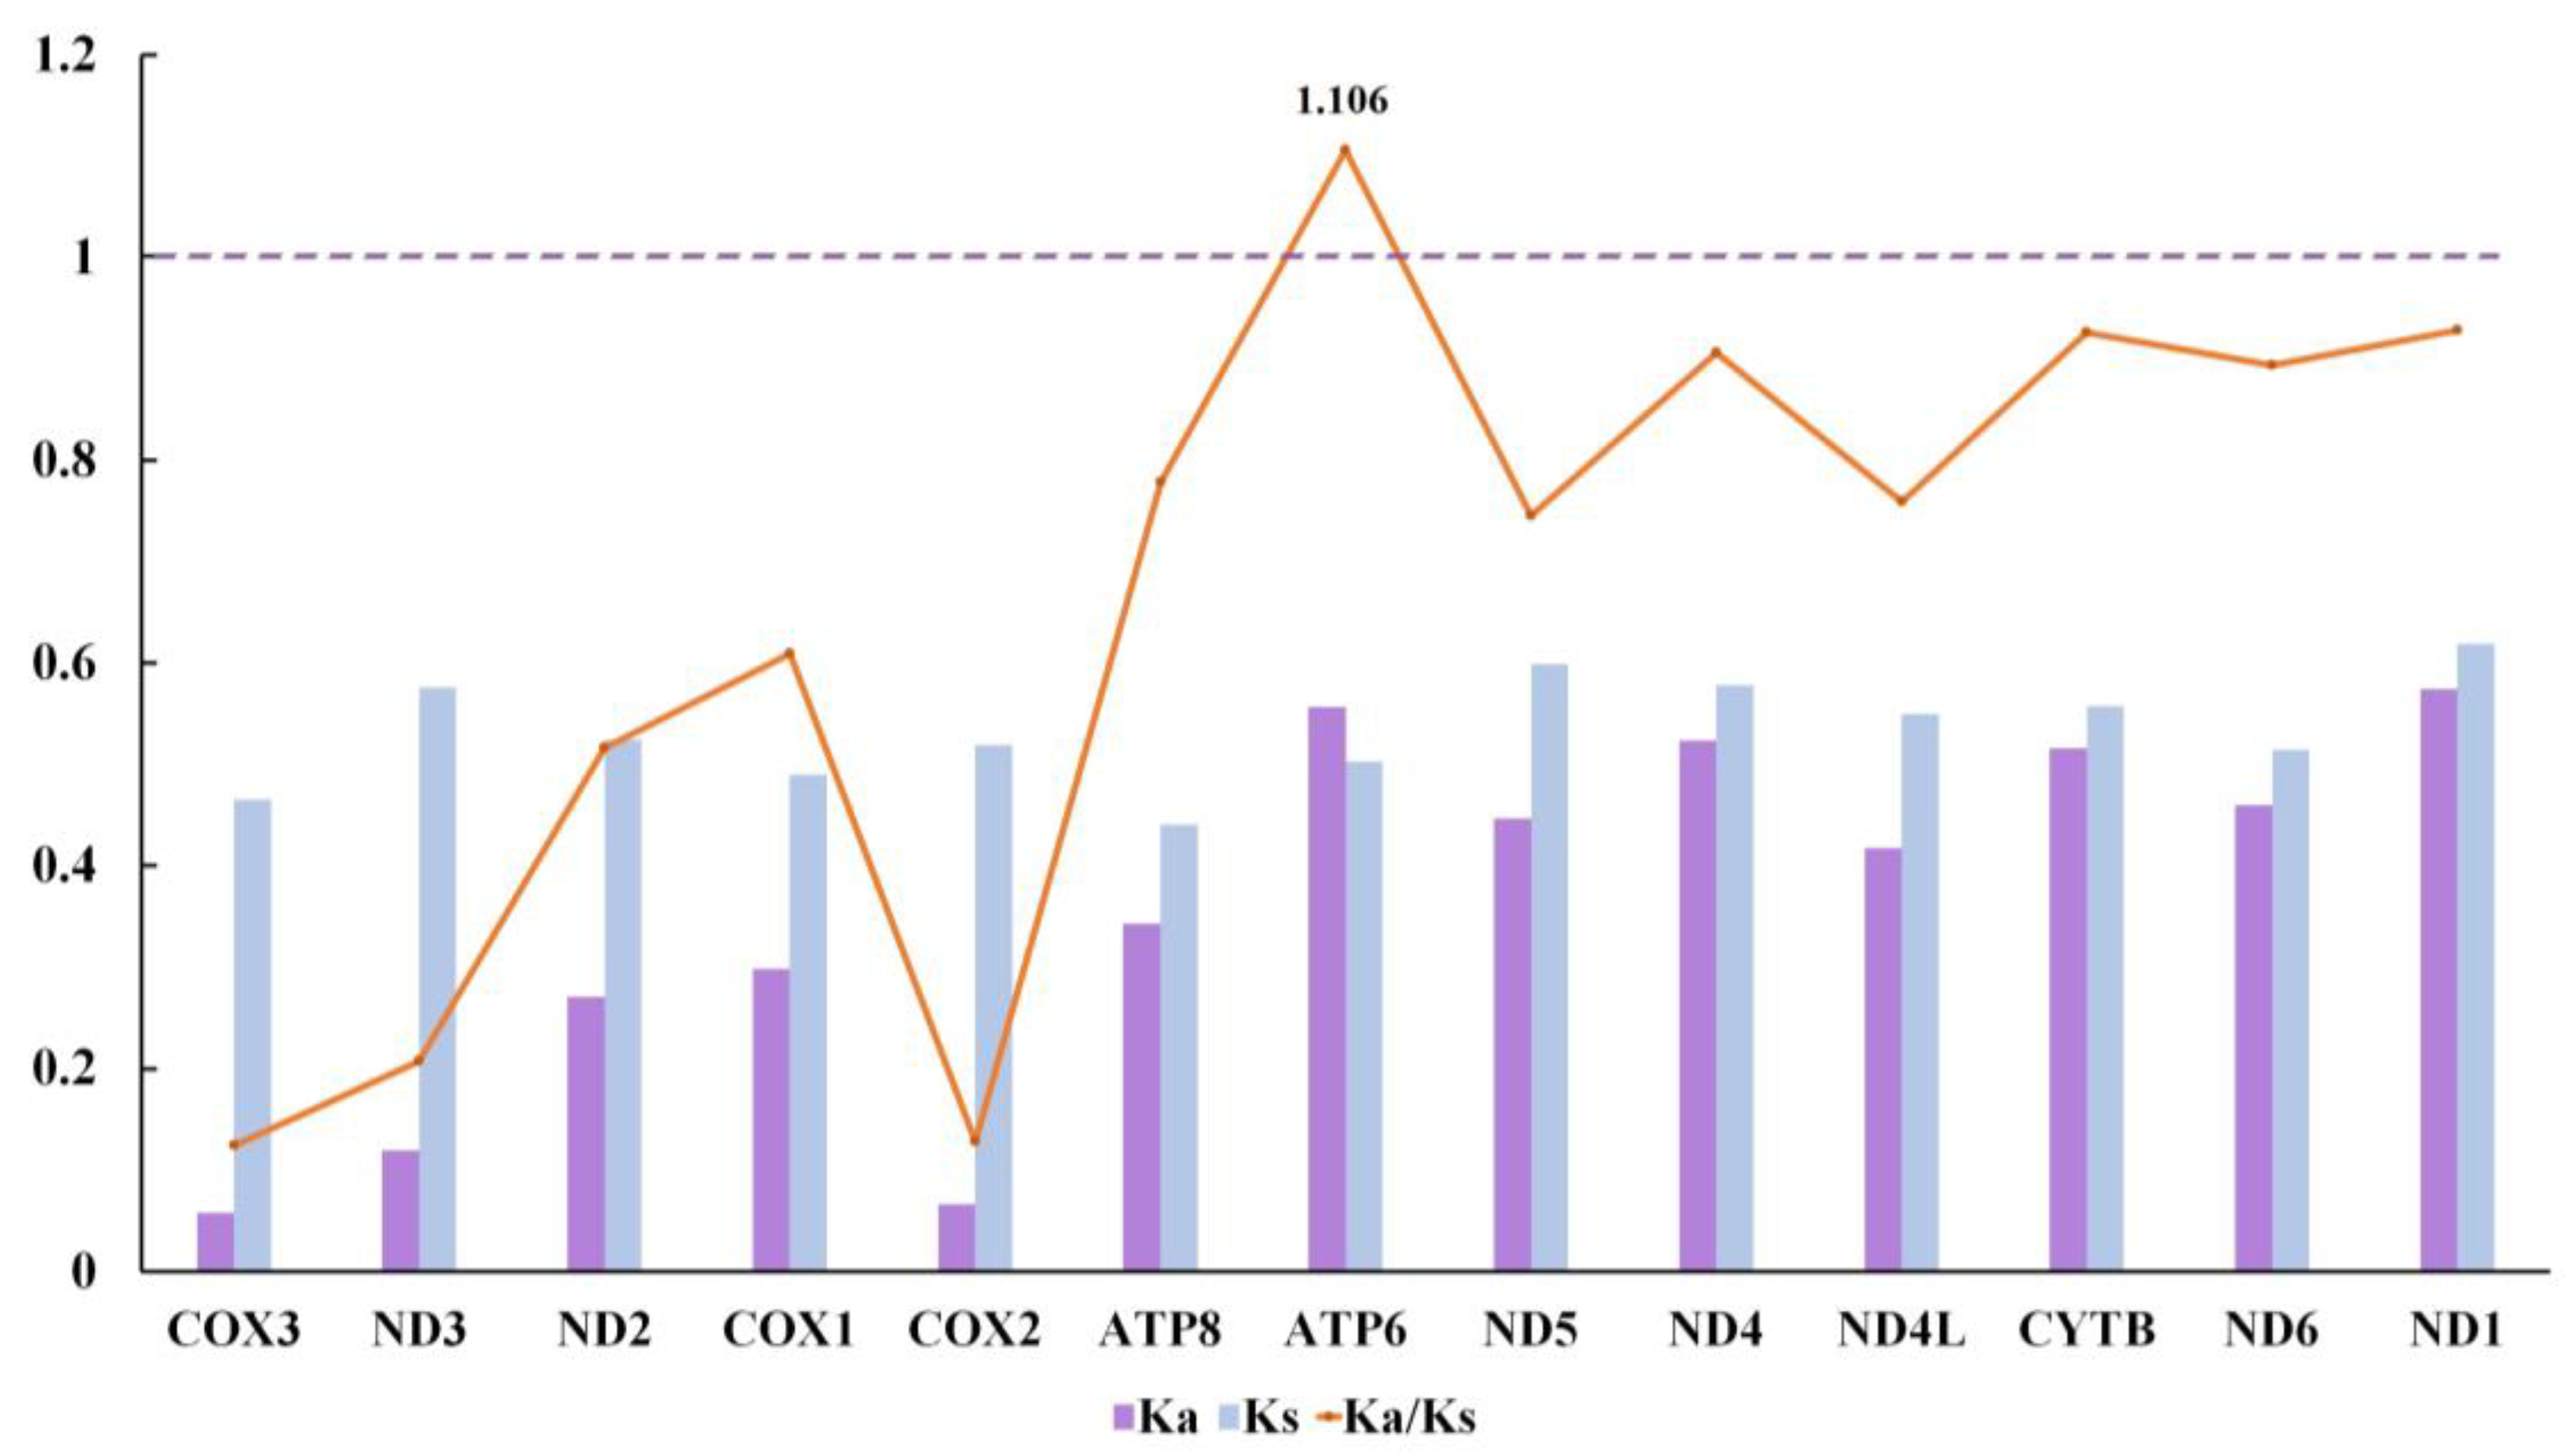
3.4. Selective Pressure Analysis

The selection pressure analysis also used these five species (Figure 4) to measure the ratio of non-synonymous and synonymous substitutions (Ka/Ks). We aimed to investigate the evolutionary and selective pressure relation. The results showed the average Ka/Ks ranging from cox3 (0.124) to atp6 (1.106). The ratio for most PCGs was below one, indicating that the mutations were swapped by synonymous substitutions; 13 PCGs of these mitogenomes were evolving under purifying selection. The remaining atp6 gene reached 1.106, which may be due to the influence of positive selection during evolution. Among these species, the cox3 gene had little change in amino acids and the lowest Ka/Ks ratio. It is widely used as a potential molecular marker for species identification, genetic diversity, and phylogenetic analysis [69,70].
The substitution saturation index of the combined dataset for 88 Patellogastropoda mitogenomes for 13 PCGs (Iss = 0.823) was significantly lower than the critical values (Iss.cSym = 0.860 or Iss.cAsym = 0.847, p = 0.000). Therefore, substitution of combined sequencing was unsaturated and suitable for phylogenetic analysis.

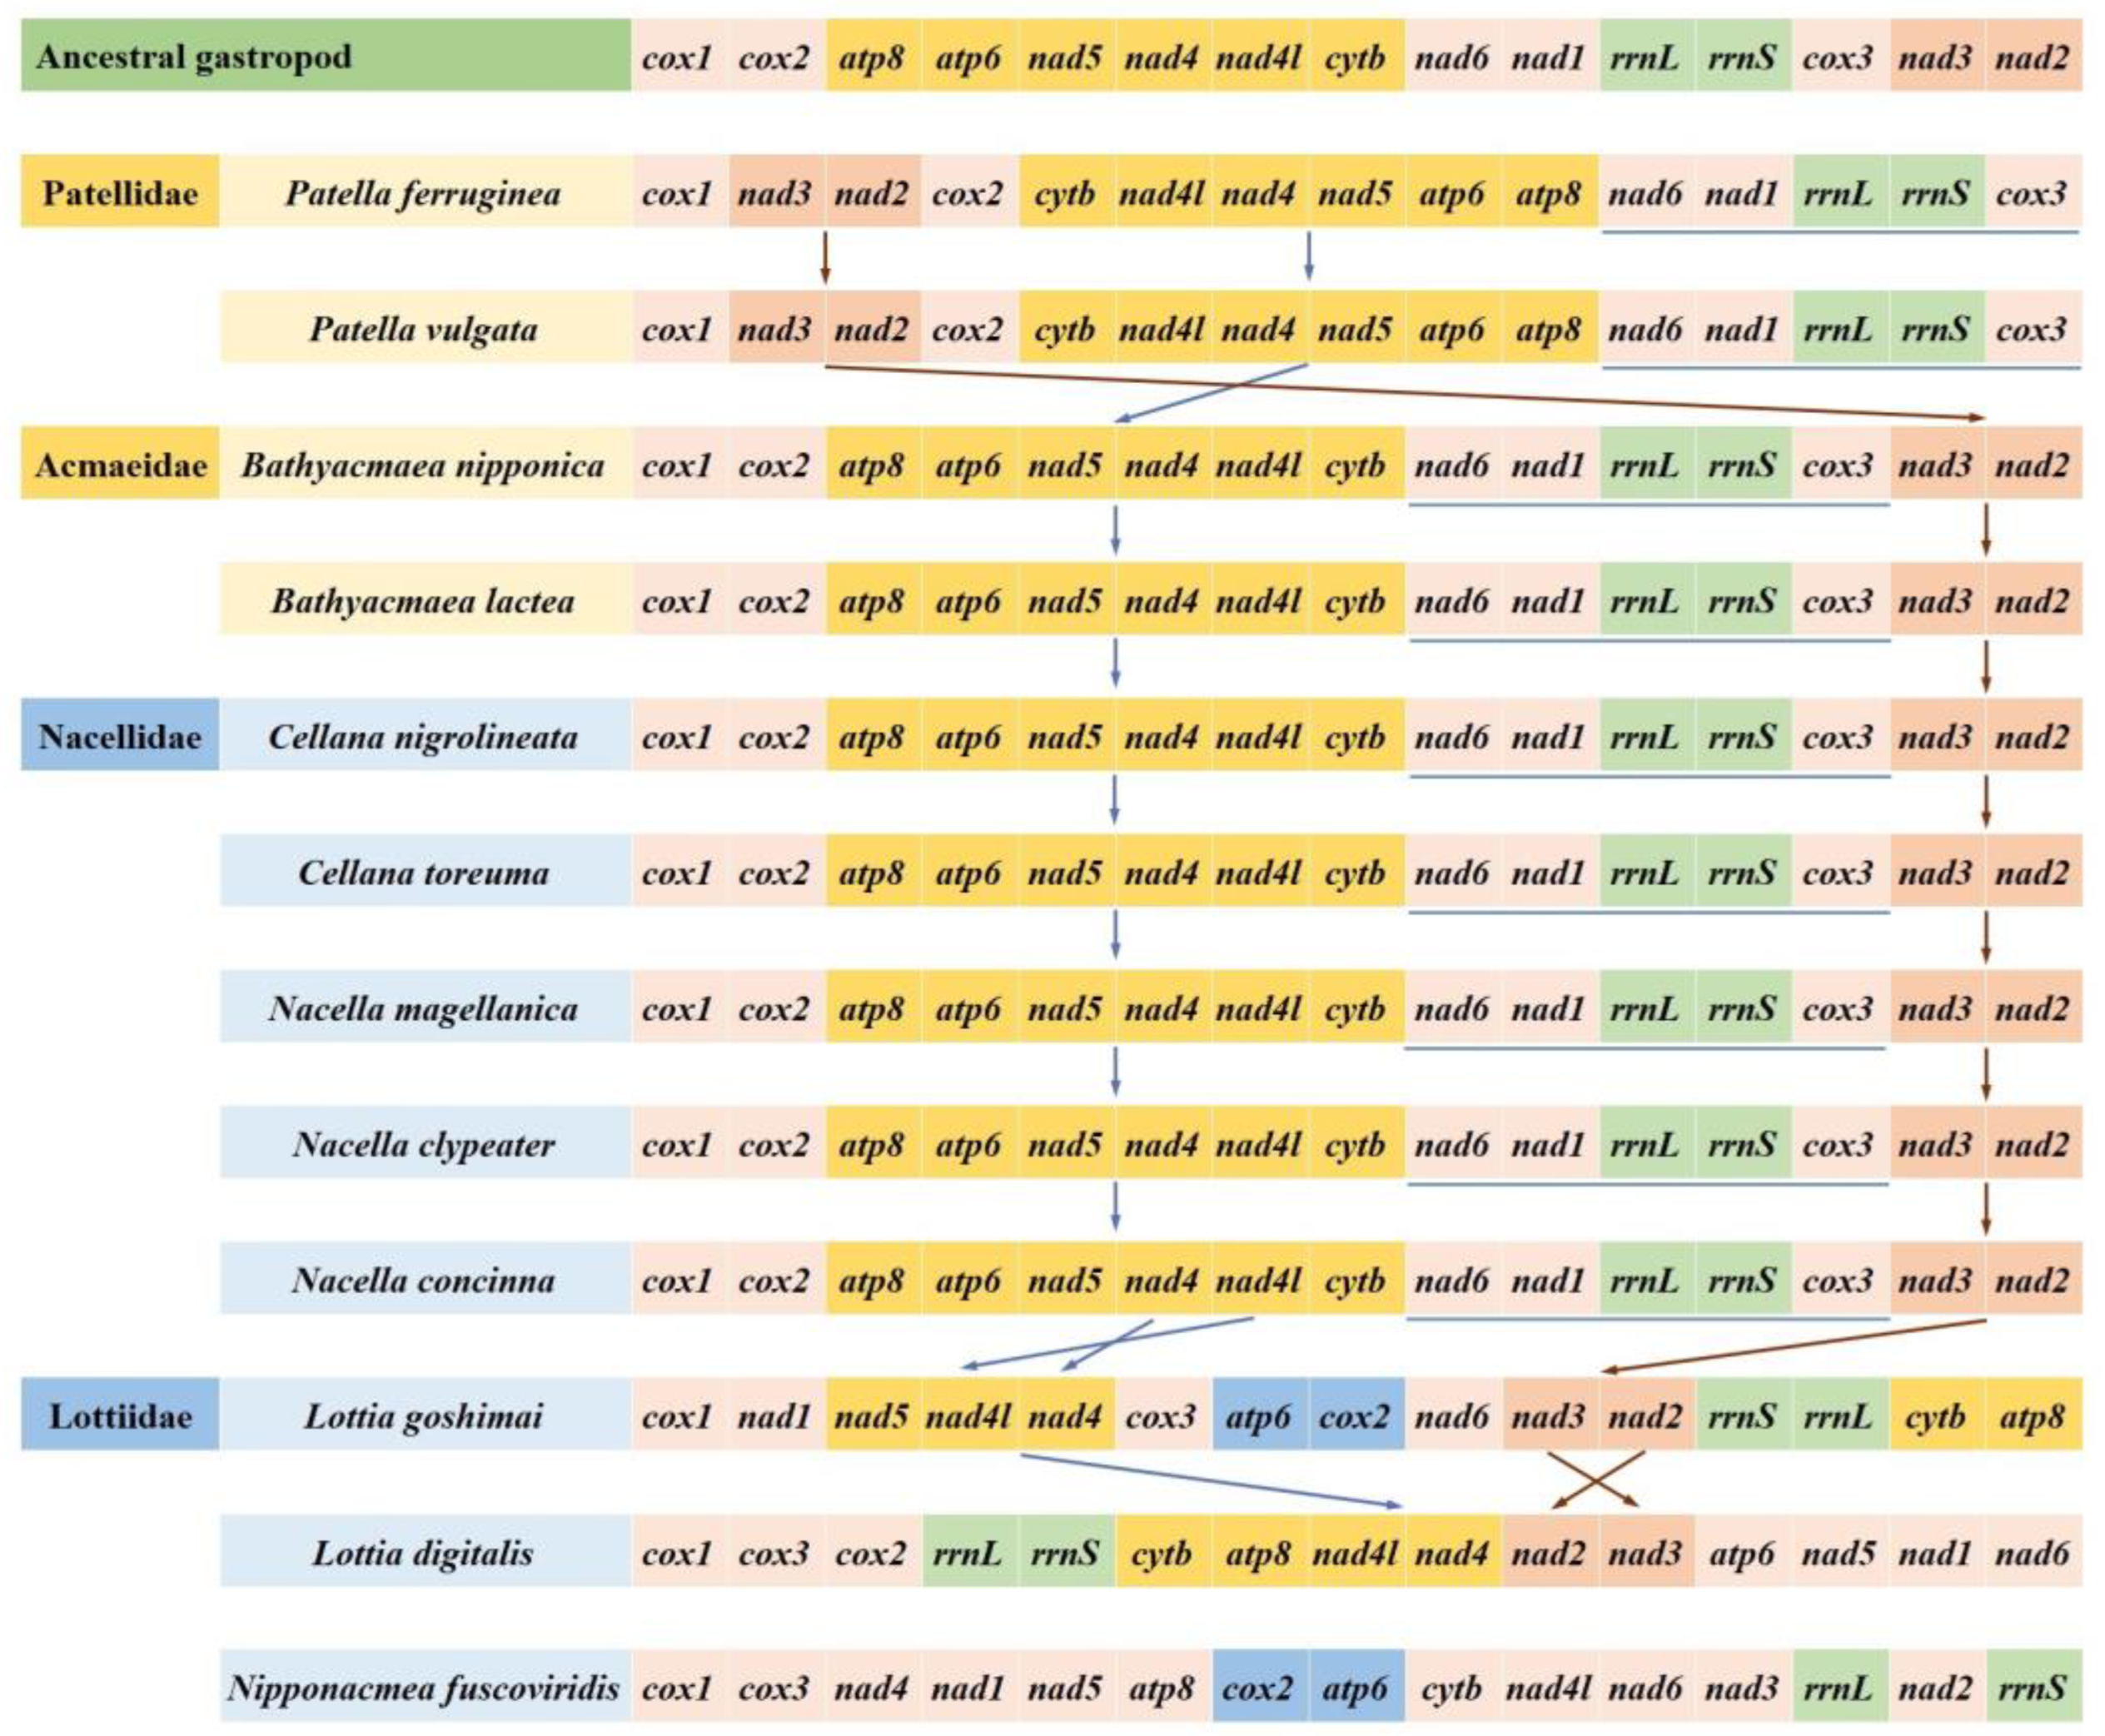
3.5. Gene Arrangement

According to the hypothetical gene order of ancestral gastropods, we compared the PCG gene arrangement of 12 species in four families of the subclass Patellogastropoda (Figure 5). The results showed that the gene order of the family Nacellidae, where C. toreuma was located, was the same as that of the family Acmaeidae, and was consistent with the ancestral gene order. In Patellidae, we found that only the nad3-nad2 fragment moved, and the position was transferred from one fragment of cox1 to the other. The nad6-nad1-rrnL-rrnS-cox3 fragment is still completely preserved. In addition, the atp8-atp6-nad5-nad4-nad4l-cytb gene fragment was completely reversed. It is worth noting that the gene rearrangement rate of the family Lottiidae is very high. Among them, L. goshimai retains the nad3-nad2 gene fragment, while the nad4 and nad4l genes in L. goshima are reversed; this situation also occurs in Lottia digitalis. Moreover, the short gene fragment of rrnL-rrnS was retained in L. digitalis, and two rrnL fragments were reversed in L. goshimai. In particular, N. fuscoviridis hardly retains the gene fragments of its ancestors; however, we can find that it has the same fragment cox1-cox3 as L. digitalis in the same family. It also has the inversion of atp6 and cox2 genes with L. goshima, which may be the reservation of unique gene fragments produced in the evolutionary process of this family. In general, the rearrangement of Lottiidae remains the focus of our research. This irregular rearrangement may be responsible for the separation of this family from the other three families in the subclass Patellogastropoda.

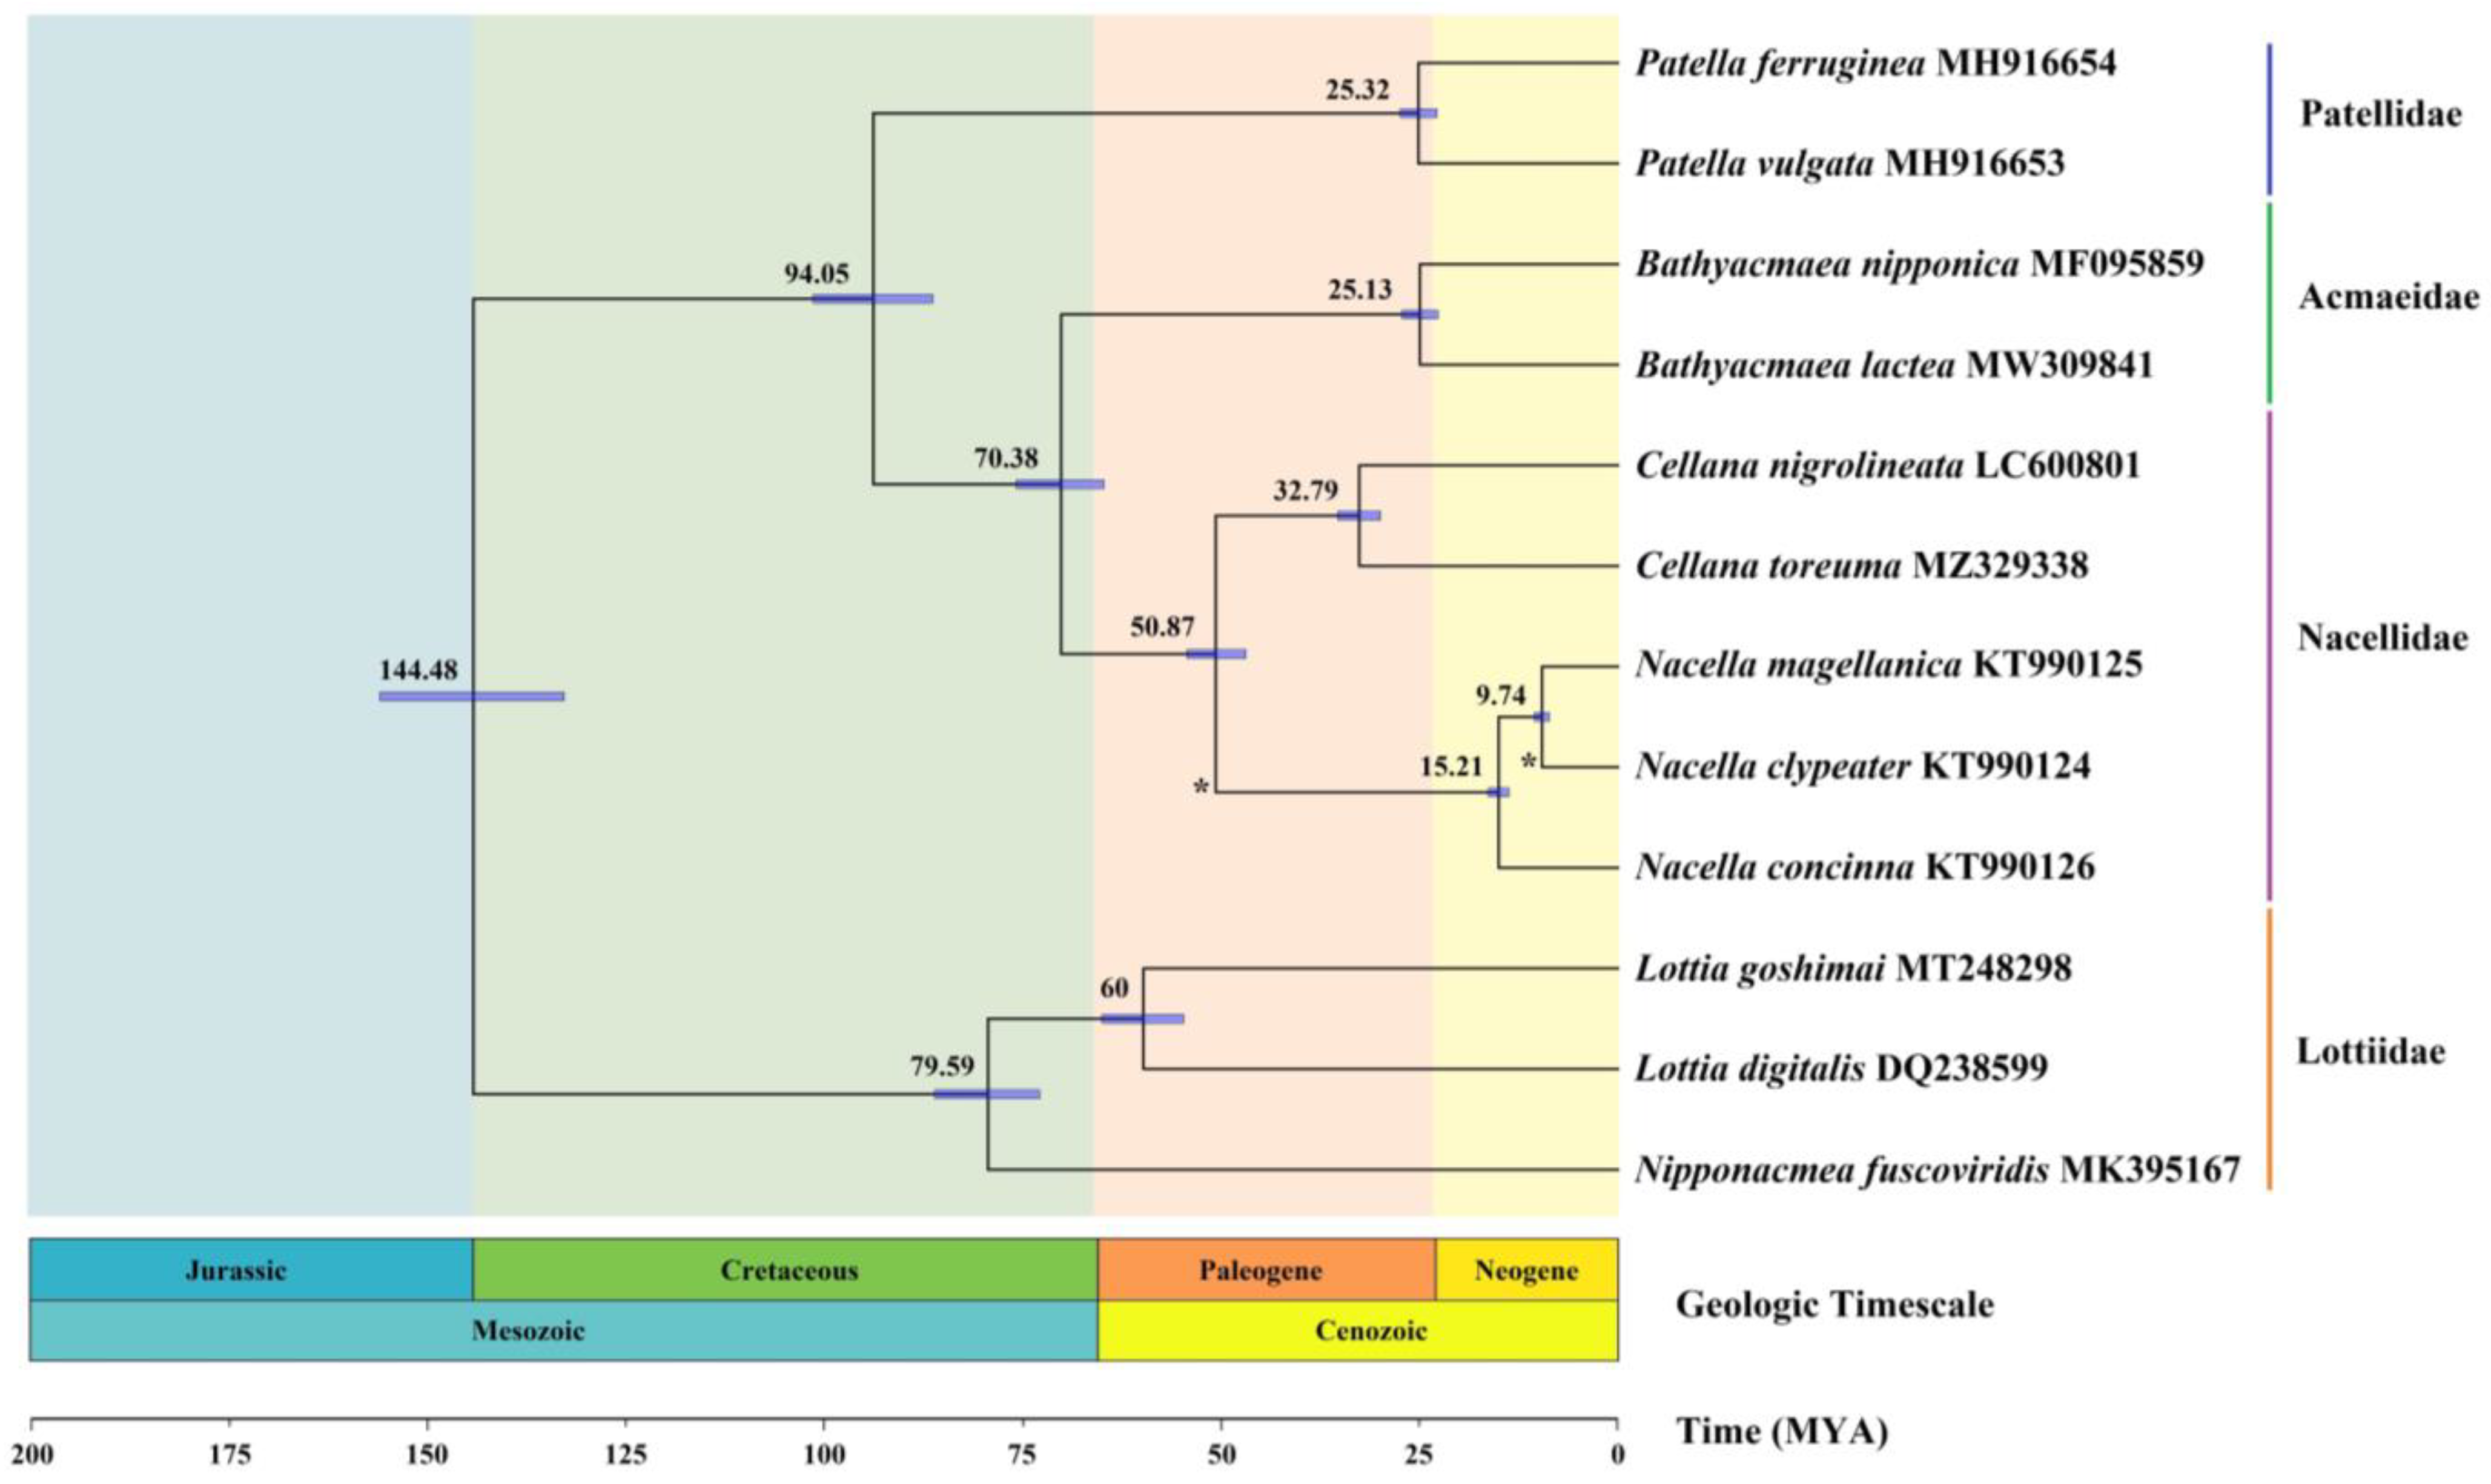
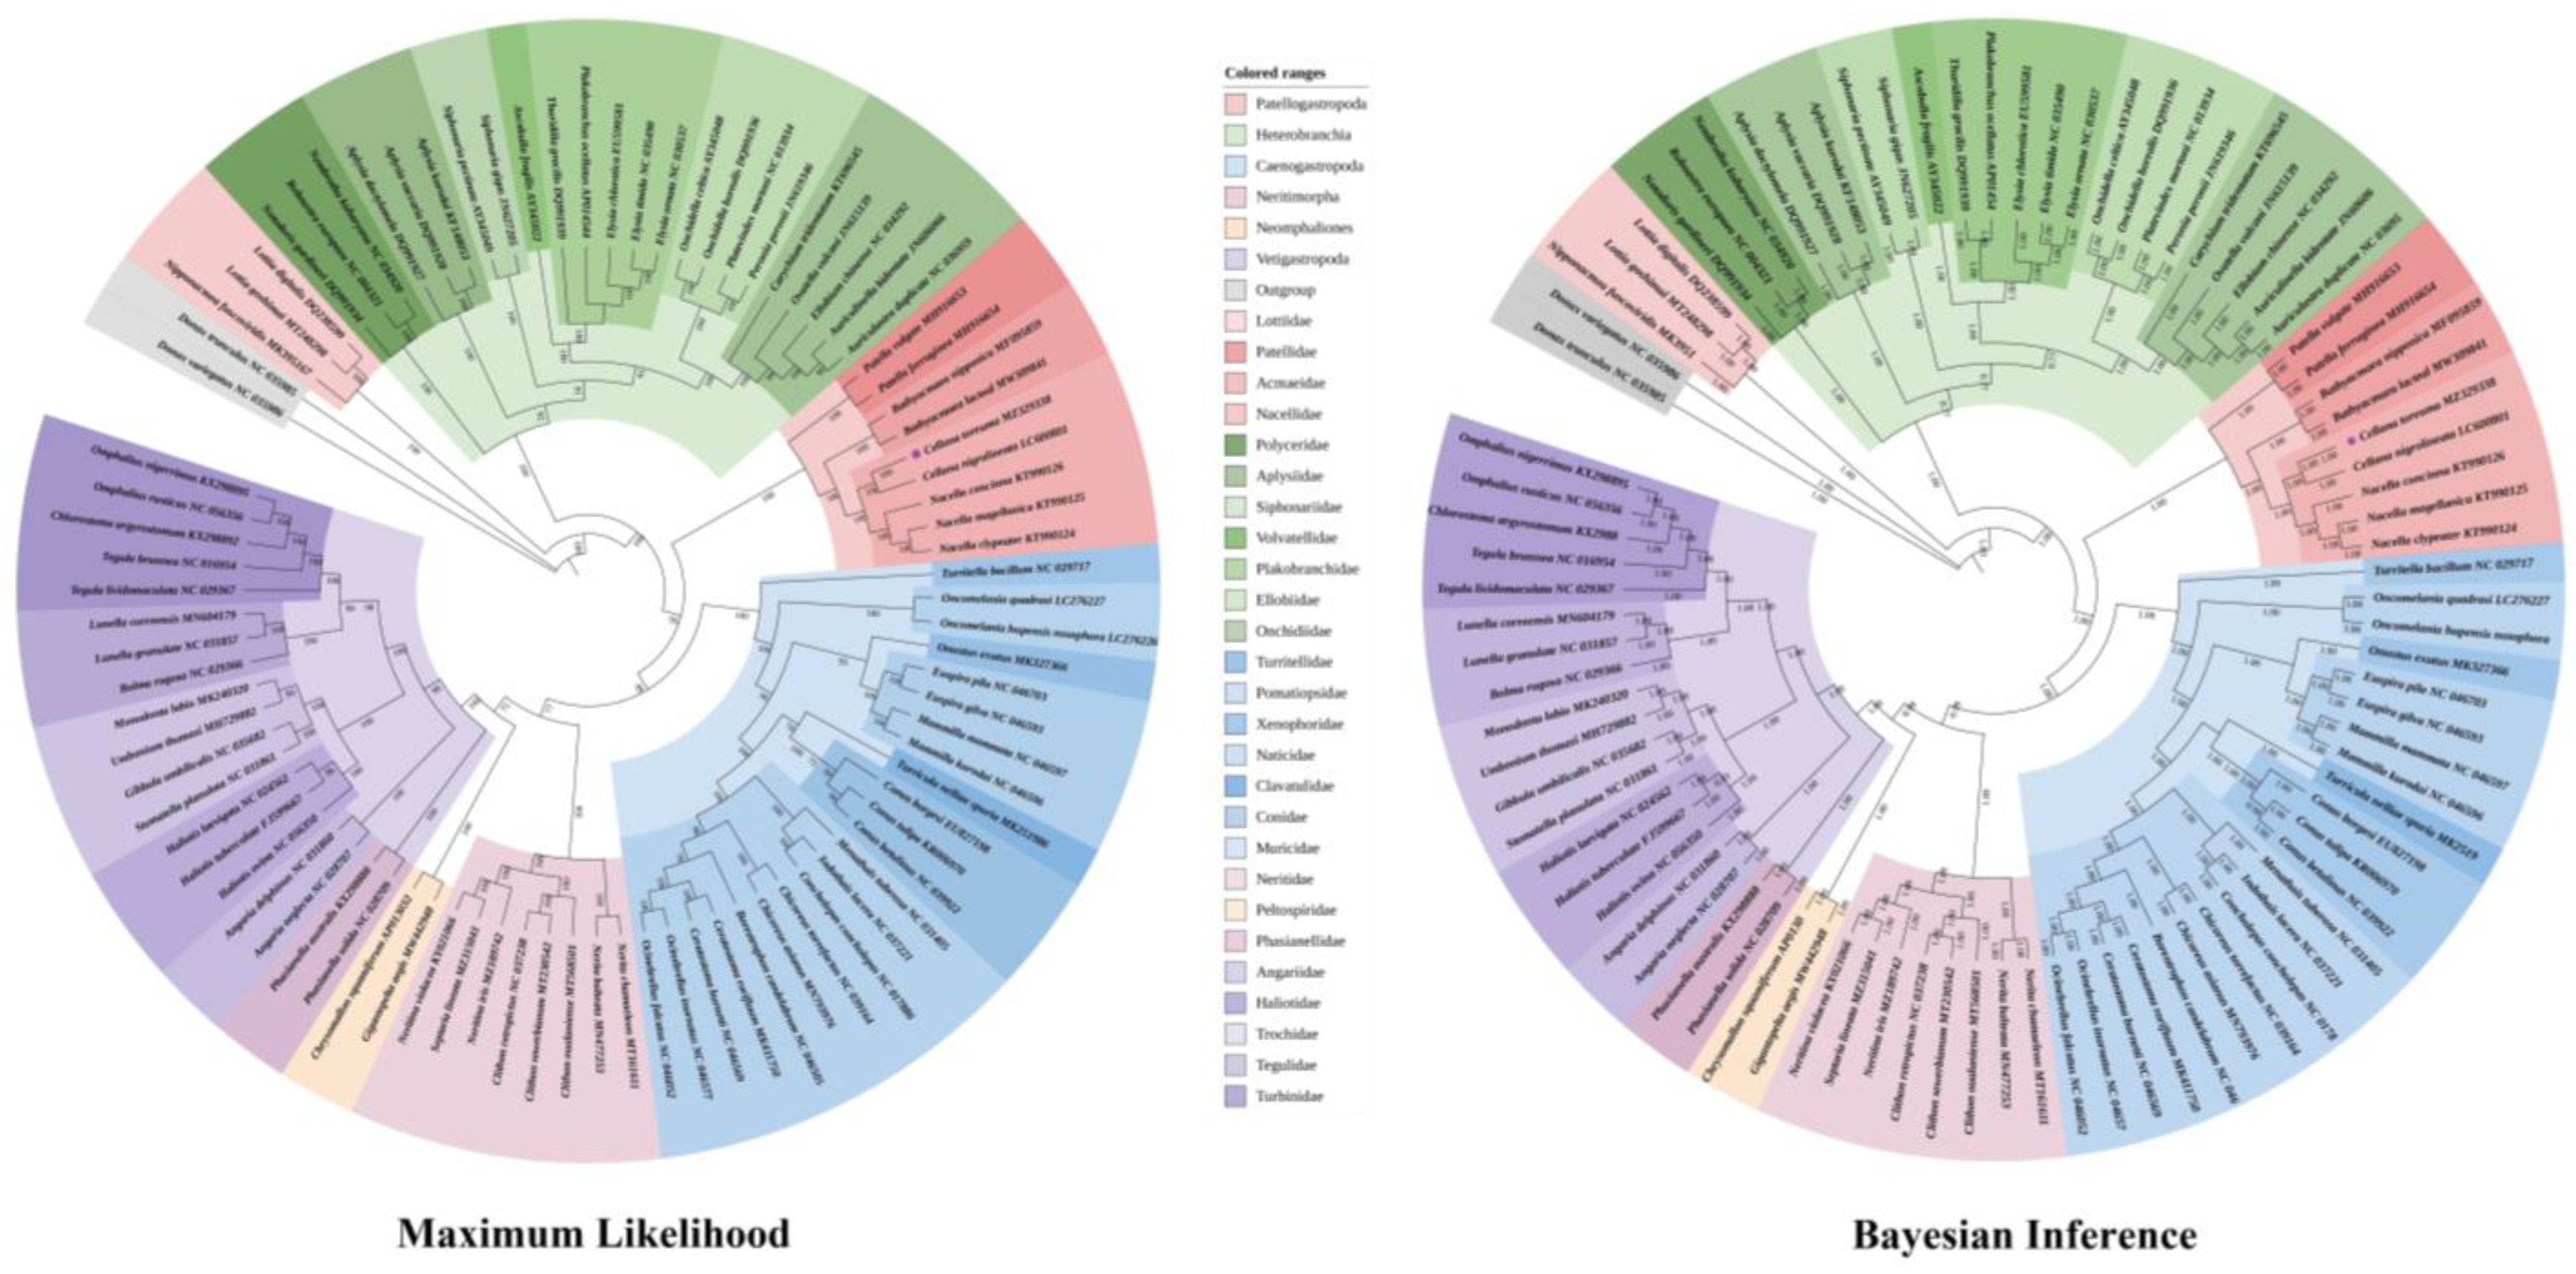
3.6. Phylogenetic Relationship

After a long period of evolution, the species of Patellogastropoda are mainly divided into two superfamilies, Lottioidea (Gray, 1840) and Patelloidea (Rafinesque, 1815). We concatenated the alignment of 13 common PCGs from C. toreuma, as combined in 86 species that represent 26 families of these 2 superfamilies in Gastropoda, (i.e., Patellogastropoda, Heterobranchia, Caenogastropoda, Neritimorpha, Neomphaliones, and Vetigastropoda). The bivalves D. variegatus and D. trunculus were set as outgroups (Figure 6). For ML and BI trees, the 88 species could be divided into seven major clades. Of which most branches exhibited high confidence of being coincidently classified with different clades, (i.e., BI: 1 posterior probability and 100% bootstraps value). Strikingly, we found that the Patellogastropoda species were divided into two branches, located on both sides of Heterobranchia. The family Lottiidae of Patellogastropoda was located at the foundational position of the integral phylogenomic tree, while other families such as Patellidae, Acmaeidae, and Nacellidae were located between Heterobranchia and Caenogastropoda. We speculated that this is probably a result of the long-branch attraction (LBA) artefact. This phenomenon was also discovered in the study of two limpets N. fuscoviridis and L. goshimai [68]. The LBA artifact was defined as taxa with long branches that evolve rapidly in phylogenetic analysis, regardless of their real evolutionary location, which is highly misleading because the inferred false relationship is often highly statistically supported [71]. Both BI and ML analyses are generally unable to avoid this artifact due to the limitations of their model, and there is no good solution at present, which is also a place that needs to be improved for the future. Some scholars have studied and discussed the LBA artifact in previous reports, but no studies can counteract phylogenetics. We still obtain such a branch under our repeated verification in both methods. After investigating, we speculated that the LBA artifact often produces misleading results usually resulting from uneven or adequate sampling, and the mitogenome data of Patellogastropoda is insufficient and cannot be solved temporarily. This makes us more interested in the evolutionary research of the subclass Patellogastropoda, and it is imperative to continue to find new data on Patellogastropoda. After that, these clades combined at the subclass Caenogastropoda. Phylogenetic relationships of the subclasses are recovering as ((((((Vetigastropoda + Neomphaliones) + Neritimorpha) + Caenogastroopoda) + Patellogastropoda) + Heterobranchia) + Patellogastropoda). Their overall branching is basically consistent with our previous evolutionary analysis. Arquez et al. [72] used mitogenome to analyze the evolution of five subclasses of Gastropoda. The results showed that Heterobranchia and Patellogastropoda were sister groups to each other, and this branch was located at the root of the entire evolutionary tree. Caenogastropoda, Vetigastropoda, and Vetigastropoda had the same branch as our study [72]. Subsequently, Osca et al. [73] also used the mitogenome to study the phylogeny of Gastropoda species. However, their result was slightly different, Caenogastropoda and Neritimorpha were sister groups, followed by the subclass Vetigastropoda. In addition, Uribe et al. [74] obtained a similar result to Osca et al. [73]; nevertheless, they added the species of the subclass Neomphalina, which are situated between Vetigastropoda and the sister group Heterobranchia and Patellogastropoda. Sun et al. [75] reconstructed the tree of several species of gastropods using mitogenome, species from Cocculiniformia and Neomphalina have been updated and divided into the Neomphalines subclass. These results were completely consistent with the evolutionary branches of several subclasses in our study [75]. In addition, branches from the present study were similar to the results of Feng et al. [76], except for the minimal change of Caenogastropoda and Neritimorpha. The simple phylogenetic analysis of the deep-sea limpet by Li et al. [77] was the same as the results of the present study, which confirms the reliability of our predicted branches of the phylogenetic tree.
Patellogastropoda has four families that make up the whole mitogenome, Nacellidae and Acmaeidae are sister groups, followed by Patellidae. The Lottiidae, as an independent branch, is located at the outermost of this subclass. Furthermore, our research species C. toreuma and C. nigrolineata are undoubtedly sister species, both belonging to the genus Cellana. They were divided into one branch with three species of the genus Nacella in the same Nacellidae family. Phylogenetic trees of the Nacellidae families stand for (C. toreuma + C. nigrolineata) + (N. concinna + (Nacella magellanica + N. clypeater). These evolutionary branches conform to the conventional evolutionary characteristics, complying with the results of existing studies.

3.7. Divergence Times

We found that only seven available species of complete Patellogastropoda mitogenomes were recorded in the Timetree (http://www.timetree.org/ (accessed on 21 March 2022)) with only three known divergent time points. These were concentrated in Nacella and Cellana during the Cenozoic Era (65 million years ago, Mya) [78]. However, the divergence time information of Bathyacmaea nipponica, Tectura paleacea, and Patella aspera were unknown, which is a very unusual situation in Gastropoda species. Our study was designed to estimate more information on the evolutionary time and understand the historical evolution and dynamics of the limpets.
Our study demonstrated that N. magellanica and N. clypeater were differentiated around 9.74 Mya, and N. concinna differentiated at 15.21 Mya (Figure 7). They are slightly earlier than the results in Timetree, but all the current differentiation occurred in the Neogene era. Nacella and Cellana were differentiated around 50.87 Mya, which is consistent with previous estimates of the divergence time. The analyses supported the supposition that the major Patellogastropoda lineages originated in the early Cretaceous and diversified in the middle and later Cretaceous; these have never been reported previously. In addition, the N. fuscoviridis family diversified to the genus Lottia in the later Cretaceous. The genera Lottia, Bathyacmaea, Patella, and Cellana were differentiated into Cenozoic Paleogene. All Nacellidae species differentiation is concentrated in the Cenozoic period. The geographical isolation in this period provided the environmental conditions for the Nacellidae differentiation, and marine sediments provided food sources for the growth of Patellogastropoda.

4. Conclusions

To carry out a good systematic study of limpets, a new potential species was found, and the mitogenomes of two species in the family Lottiidae were published. This provided more insights into mitogenomes in Patellogastropoda and supplemented the molecular database in such a classification group. We obtained the mitogenome sequences of C. toreuma by high-throughput sequencing with the length of 16,260 bp, similar to other limpets. Each mitogenome has the same composition and similar results of nucleotide composition for five Nacellidae. The gene order was generally uniform within families, except for the family Lottidae. Most PCGs were initiated with the ATG codon and terminated with TAA codon. For the analysis of selective pressure, we found that most of the 13 PCGs of Nacellidae were below 1, especially the cox3 gene which exhibited the lowest value that demonstrated high conservation. This indicates that PCGs were subject to purifying selection in the family, while the atp6 gene shows a high value, indicating that this gene may have been mutated in the process of evolution. The phylogenetic tree provided a further complement to the scientific classification of Patellogastropoda species. It is found that there is an LBA artifact in the family Lottiidae in Patellogastropoda, which deceived phylogenetic methods caused by the outgroup as distant or that the taxon sampling is poor. To solve this problem, we use two methods to construct evolutionary trees, but the Patellogastropoda is also divided into two branches on both sides of Heterobranchia. This study could provide the basic information for genetic characteristics, phylogenetic position, and evolution for these limpets, and provide a basis for resource management and selective breeding in aquaculture. This Cellana species was differentiated in the late Paleogene, and their evolution may be related to the geological events that changed their living environment.

Author Contributions

J.F. and J.M. analyzed the data, wrote the paper, and prepared the figures and tables; Y.Y. conceived and designed the experiments, reviewed drafts of the paper; J.L. contributed analysis tools, reviewed drafts of the paper; K.X. collected field material and processed the samples; B.G. and X.Y. supervised and directed the work. All authors reviewed the manuscript. All authors have read and agreed to the published version of the manuscript.

Funding

This work was financially supported by the National Key R&D Program of China (Grant No.: 2019YFD0901204), the Key R&D Program of Zhejiang Province (Grant No.: 2019C02056), NSFC Projects of International Cooperation and Exchanges (42020104009) and the Project of Bureau of Science and Technology of Zhoushan (No. 2020C21026 and No. 2021C21017).

Institutional Review Board Statement

Not applicable.

Informed Consent Statement

Not applicable.

Data Availability Statement

Not applicable.

Acknowledgments

We acknowledge all the financial support in the paper. We thank Chen Jian, a taxonomist from the Marine Biological Museum of Zhejiang Ocean University, for the accurate morphological identification of this specie before sequencing. The authors would like to express their gratitude for permits for sampling and observational fields.

Conflicts of Interest

The authors declare that they have no conflict of interest.

References

  1. Roger, A.J.; Muñoz-Gómez, S.A.; Kamikawa, R. The origin and diversification of mitochondria. Curr. Biol. 2017, 27, 1177–1192. [Google Scholar] [CrossRef] [Green Version]
  2. Hampl, V.; Čepička, I.; Eliáš, M. Was the mitochondrion necessary to start eukaryogenesis? Trends Microbiol. 2019, 27, 96–104. [Google Scholar] [CrossRef]
  3. Gray, M.W. Rickettsia, typhus and the mitochondrial connection. Nature 1998, 396, 109–110. [Google Scholar] [CrossRef] [PubMed]
  4. Zhang, M.; Gao, Z.; Yin, J.; Zhang, T.; Zhang, X.; Yuan, D.; Li, T.; Zhong, Y.; Ma, E.; Ren, Z. Complete mitochondrial genome of two Thitarodes species (Lepidoptera, Hepialidae), the host moths of Ophiocordyceps sinensis and phylogenetic implications. Int. J. Biol. Macromol. 2019, 140, 794–807. [Google Scholar] [CrossRef] [PubMed]
  5. Mottis, A.; Herzig, S.; Auwerx, J. Mitocellular communication: Shaping health and disease. Science 2019, 366, 827–832. [Google Scholar] [CrossRef]
  6. Hämäläinen, R.H.; Landoni, J.C.; Ahlqvist, K.J.; Goffart, S.; Ryytty, S.; Rahman, M.O.; Brilhante, V.; Icay, K.; Hautaniemi, S.; Wang, L. Defects in mtDNA replication challenge nuclear genome stability through nucleotide depletion and provide a unifying mechanism for mouse progerias. Nat. Metab. 2019, 1, 958–965. [Google Scholar] [CrossRef] [Green Version]
  7. Zhao, Z.; Zhu, K.; Tang, D.; Wang, Y.; Wang, Y.; Zhang, G.; Geng, Y.; Yu, H. Comparative analysis of mitochondrial genome features among four Clonostachys species and insight into their systematic positions in the order hypocreales. Int. J. Mol. Sci. 2021, 22, 5530. [Google Scholar] [CrossRef]
  8. Williams, S.; Foster, P.; Littlewood, D. The complete mitochondrial genome of a turbinid Vetigastropod from MiSeq Illumina sequencing of genomic DNA and steps towards a resolved gastropod phylogeny. Gene 2014, 533, 38–47. [Google Scholar] [CrossRef]
  9. Cole, L.W.; Guo, W.; Mower, J.P.; Palmer, J.D. High and variable rates of repeat-mediated mitochondrial genome rearrangement in a genus of plants. Mol. Biol. Evol. 2018, 35, 2773–2785. [Google Scholar] [CrossRef]
  10. Fritsch, E.S.; Chabbert, C.D.; Klaus, B.; Steinmetz, L.M. A genome-wide map of mitochondrial DNA recombination in yeast. Genetics 2014, 198, 755–771. [Google Scholar] [CrossRef] [Green Version]
  11. Crous, P.W.; Groenewald, J.Z. A phylogenetic re-evaluation of Arthrinium. IMA Fungus 2013, 4, 133–154. [Google Scholar] [CrossRef] [PubMed] [Green Version]
  12. Bowman, R.S. The morphology of Patella spp. juveniles in Britain, and some phylogenetic inferences. J. Mar. Biol. Assoc. UK 1981, 61, 647–666. [Google Scholar] [CrossRef]
  13. Branch, G.M.; Branch, M.L. Competition between Cellana tramoserica (Sowerby) (Gastropoda) and Patiriella exigua (Lamarck) (Asteroidea), and their influence on algal standing stocks. J. Exp. Mar. Biol. Ecol. 1980, 48, 35–49. [Google Scholar] [CrossRef]
  14. Fuchigami, T.; Sasaki, T. The shell structure of the recent Patellogastropoda (Mollusca: Gastropoda). Paleontolog. Res. 2005, 9, 143–168. [Google Scholar] [CrossRef]
  15. Hodgson, A.N. Spermatozoal morphology of Patellogastropoda and Vetigastropoda (Mollusca: Prosobranchia). Mem. Mus. Nat. D’histoire Nat. 1995, 166, 167–178. [Google Scholar]
  16. Hodgson, A.N.; Bernard, R.T.F. A comparison of the structure of the spermatozoa and spermatogenesis of 16 species of Patellid limpet (Mollusca: Gastropoda: Archaeogastropoda). J. Morphol. 1988, 195, 205–223. [Google Scholar] [CrossRef]
  17. Hodgson, A.N.; Ridgway, S.; Branch, G.M.; Hawkins, S.J. Spermatozoan morphology of 19 species of prosobranch limpets (Patellogastropoda) with a discussion of patellid relationships. Philos. Trans. R. Soc. Lond. Ser. B 1996, 351, 339–347. [Google Scholar] [CrossRef]
  18. Vakani, B.; Nakano, T.; Kundu, R. Diversity and taxonomy of the intertidal patellogastropod limpets of the mainland Indian coastline. Zootaxa 2020, 4728, 211–226. [Google Scholar] [CrossRef]
  19. Bouchet, P.; Rocroi, J.P. Classification and nomenclator of gastropod families. Malacologia 2005, 47, 85–397. [Google Scholar]
  20. Reeve, L.A. Monograph of the genus Patella. In Conchologia Iconica, or, Illustrations of the Shells of Molluscous Animals; Lovell Reeve: London, UK, 1854; Volume 8, pp. 1–42. [Google Scholar]
  21. Wang, Z.X.; Wu, C.W.; Liu, Z.Y. Preliminary study on the ecologicals, habits and characteristics of Cellana toreuma (Reeve) in the North of Zhejiang coastal area. J. Zhejiang Ocean Univ. 2001, 20, 7–13. [Google Scholar]
  22. Huang, X.; Wang, T.; Ye, Z.; Han, G.; Dong, Y. Temperature relations of aerial and aquatic physiological performance in a mid-intertidal limpet Cellana toreuma: Adaptation to rapid changes in thermal stress during emersion. Integr. Zool. 2015, 10, 159–170. [Google Scholar] [CrossRef] [PubMed]
  23. Dong, Y.W.; Wang, H.S.; Han, G.D.; Ke, C.H.; Zhan, X.; Nakano, T.; Williams, G.A. The impact of Yangtze River discharge, ocean currents and historical events on the biogeographic pattern of Cellana toreuma along the China coast. PLoS ONE 2012, 7, e36178. [Google Scholar] [CrossRef] [PubMed] [Green Version]
  24. Wang, J.; Ganmanee, M.; Shau-Hwai, A.T.; Mujahid, A.; Dong, Y.W. Pleistocene events and present environmental factors have shaped the phylogeography of the intertidal limpet Cellana toreuma (Reeve, 1855) (Gastropoda: Nacellidae) in Southeast Asia and China. J. Molluscan Stud. 2016, 82, 378–390. [Google Scholar] [CrossRef] [Green Version]
  25. Powell, A.W.B. The patellid limpets of the world (Patellidae). Indo-Pac. Mollusca 1973, 3, 75–206. [Google Scholar]
  26. Nakano, T.; Ozawa, T. Worldwide phylogeography of limpets ofthe order Patellogastropoda: Molecular, morphological and palaeontological evidence. J. Molluscan Stud. 2007, 73, 79–99. [Google Scholar] [CrossRef]
  27. Nakano, T.; Espinosa, F. New alien species in the Atlantic Ocean? Mar. Biodivers. Rec. 2010, 3, e39. [Google Scholar] [CrossRef]
  28. Connell, J.H. Community interactions on marine rocky intertidal shores. Annu. Rev. Ecol. Syst. 1972, 3, 169. [Google Scholar] [CrossRef]
  29. Branch, G.M. The biology of limpets: Physical factors, energy flow, and ecological interactions. Oceanogr. Mar. Biol. Annu. Rev. 1981, 19, 235–380. [Google Scholar]
  30. Underwood, A.J.; Benedetti-Cecchi, L.; Åberg, P.; Arenas, F.; Arrontes, J.; Castro, J.O.; Hartnoll, R.G.; Jenkins, S.R.; Paula, J. A continental scale evaluation of the role of limpet grazing on rocky shores. Oecologia 2006, 147, 556–564. [Google Scholar] [CrossRef]
  31. Goldstien, S.J.; Schiel, D.R.; Gemmell, N.J. Comparative phylogeography of coastal limpets across a marine disjunction in New Zealand. Mol. Ecol. 2006, 15, 3259–3268. [Google Scholar] [CrossRef]
  32. Goldstien, S.J.; Gemmell, N.J.; Schiel, D.R. Molecular phylogenetics and biogeography of the nacellid limpets of New Zealand (Mollusca: Patellogastropoda). Mol. Phylogenet. Evol. 2006, 38, 261–265. [Google Scholar] [CrossRef] [PubMed]
  33. Goldstien, S.J.; Gemmell, N.J.; Schiel, D.R. Colonisation and connectivity by intertidal limpets among New Zealand, Chatham and Sub-Antarctic Islands. I. Genetic connections. Mar. Ecol. Prog. Ser. 2009, 388, 111–119. [Google Scholar] [CrossRef]
  34. Ribeiro, P.A.; Branco, M.; Hawkins, S.J.; Santos, A.M. Recent changes in the distribution of a marine gastropod, Patella rustica, across the Iberian Atlantic coast did not result in diminished genetic diversity or increased connectivity. J. Biogeogr. 2010, 37, 1782–1796. [Google Scholar] [CrossRef]
  35. Editorial Board of Chinese Materia Medica, State Administration of Traditional Chinese Medicine. Chinese Materia Medica; Shanghai Science and Technology Publishers: Shanghai, China, 1999. [Google Scholar]
  36. Chen, D. Zoology of China: Mollusca; Science Press: Beijing, China, 1999. [Google Scholar]
  37. Firth, L.B.; Williams, G.A. The influence of multiple environmental stressors on the limpet Cellana toreuma during the summer monsoon season in Hong Kong. J. Exp. Mar. Biol. Ecol. 2009, 375, 70–75. [Google Scholar] [CrossRef]
  38. Bird, C.E.; Holland, B.S.; Bowen, B.W.; Toonen, R.J. Contrasting phylogeography in three endemic Hawaiian limpets (Cellana spp.) with similar life histories. Mol. Ecol. 2007, 16, 3173–3186. [Google Scholar] [CrossRef]
  39. Williams, G.A.; Morritt, D. Habitat partitioning and thermal tolerance in a tropical limpet, Cellana grata. Mar. Ecol. Prog. Ser. 1995, 124, 89–103. [Google Scholar] [CrossRef] [Green Version]
  40. Chelazzi, G.; De Pirro, M.; Williams, G.A. Cardiac responses to abiotic factors in two tropical limpets, occurring at different levels of the shore. Mar. Biol. 2001, 139, 79–85. [Google Scholar] [CrossRef]
  41. Dong, Y.W.; Williams, G.A. Variations in cardiac performance and heat shock protein expression to thermal stress in two differently zoned limpets on a tropical rocky shore. Mar. Biol. 2011, 158, 23–31. [Google Scholar] [CrossRef]
  42. Wang, Z.Z.; Wu, C.W. Study on the age and growth of Cellauma toreuma (Reeve) in North Zhejiang coastal area. J. Zhejiang Ocean Univ. 2000, 19, 316–323. [Google Scholar]
  43. Qian, W.; Wang, Y.N.; Lu, K.H.; Wang, J.H.; Liu, L.G. Morphological discrimination of radula between two species of Cellana. Chinese J. Zool. 2011, 46, 76–85. [Google Scholar] [CrossRef]
  44. Hirano, Y. Studies on activity pattern of the patellid limpet Cellana toreuma (Reeve). J. Exp. Mar. Biol. Ecol. 1979, 40, 137–148. [Google Scholar] [CrossRef]
  45. Iwasaki, K. Interindividual trail following by the intertidal patellid limpet Cellana toreuma. J. Mar. Biol. Assoc. UK 1998, 78, 1019–1022. [Google Scholar] [CrossRef]
  46. Zhang, S.P. Seashells of China; China Ocean Press: Beijing, China, 2008; pp. 46–50. [Google Scholar]
  47. Aljanabi, S.M.; Martinez, I. Universal and rapid salt-extraction of high quality genomic DNA for PCR-based techniques. Nucleic. Acids. Res. 1997, 25, 4692–4693. [Google Scholar] [CrossRef]
  48. Dierckxsens, N.; Mardulyn, P.; Smits, G. NOVOPlasty: De novo assembly of organelle genomes from whole genome data. Nucleic. Acids. Res. 2017, 45, e18. [Google Scholar] [CrossRef] [PubMed] [Green Version]
  49. Bernt, M.; Donath, A.; Jühling, F.; Externbrink, F.; Florentz, C.; Fritzsch, G.; Pütz, J.; Middendorf, M.; Stadler, P.F. MITOS: Improved de novo metazoan mitochondrial genome annotation. Mol. Phylogenet. Evol. 2013, 69, 313–319. [Google Scholar] [CrossRef] [PubMed]
  50. Grant, J.R.; Stothard, P. The CGView Server: A comparative genomics tool for circular genomes. Nucleic Acids Res. 2008, 36, 181–184. [Google Scholar] [CrossRef] [PubMed]
  51. Kumar, S.; Stecher, G.; Tamura, K. MEGA7: Molecular Evolutionary Genetics Analysis Version 7.0 for Bigger Datasets. Mol. Biol. Evol. 2016, 33, 1870–1874. [Google Scholar] [CrossRef] [Green Version]
  52. Hassanin, A.; Léger, N.; Deutsch, J. Evidence for multiple reversals of asymmetric mutational constraints during the evolution of the mitochondrial genome of Metazoa, and consequences for phylogenetic inferences. Syst. Biol. 2005, 54, 277–298. [Google Scholar] [CrossRef]
  53. Rozas, J.; Rozas, R. DnaSP, DNA sequence polymorphism: An interactive program for estimating population genetics parameters from DNA sequence data. Comput. Appl. Biosci. 1995, 11, 621–625. [Google Scholar] [CrossRef]
  54. Fernández-Pérez, J.; Nantón, A.; Ruiz-Ruano, F.J.; Camacho, J.P.M.; Méndez, J. First complete female mitochondrial genome in four bivalve species genus Donax and their phylogenetic relationships within the Veneroida order. PLoS ONE 2017, 12, e0184464. [Google Scholar] [CrossRef]
  55. Xia, X. DAMBE5: A comprehensive software package for data analysis in molecular biology and evolution. Mol. Biol. Evol. 2013, 30, 1720–1728. [Google Scholar] [CrossRef] [PubMed] [Green Version]
  56. Nguyen, L.T.; Schmidt, H.A.; von Haeseler, A.; Minh, B.Q. IQ-TREE: A fast and effective stochastic algorithm for estimating maximum-likelihood phylogenies. Mol. Biol. Evol. 2015, 32, 268–274. [Google Scholar] [CrossRef]
  57. Ronquist, F.; Teslenko, M.; Van Der Mark, P.; Ayres, D.L.; Darling, A.; Hohna, S.; Larget, B.; Liu, L.; Suchard, M.A.; Huelsenbeck, J.P. MrBayes 3.2: Efficient Bayesian phylogenetic inference and model choice across a large model space. Syst. Biol. 2012, 61, 539–542. [Google Scholar] [CrossRef] [Green Version]
  58. Kalyaanamoorthy, S.; Minh, B.Q.; Wong, T.K.F.; von Haeseler, A.; Jermiin, L.S. ModelFinder: Fast model selection for accurate phylogenetic estimates. Nat. Methods 2017, 14, 587. [Google Scholar] [CrossRef] [Green Version]
  59. Nylander, J.A.; Ronquist, F.; Huelsenbeck, J.P.; Nieves-Aldrey, J. Bayesian phylogenetic analysis of combined data. Syst. Biol. 2004, 53, 47–67. [Google Scholar] [CrossRef] [Green Version]
  60. Letunic, I.; Bork, P. Interactive tree of life (iTOL) v6: An online tool for the display and annotation of phylogenetic and other trees. Nucleic Acids Res. 2016, 44, 242–245. [Google Scholar] [CrossRef]
  61. Drummond, A.J.; Suchard, M.A.; Xie, D.; Rambaut, A. Bayesian phylogenetics with BEAUti and the BEAST 1.7. Mol. Biol. Evol. 2012, 29, 1969–1973. [Google Scholar] [CrossRef] [Green Version]
  62. González-Wevar, C.A.; Nakano, T.; Cañete, J.I.; Poulin, E. Molecular phylogeny and historical biogeography of Nacella (Patellogastropoda: Nacellidae) in the Southern Ocean. Mol. Phylogenet. Evol. 2010, 56, 115–124. [Google Scholar] [CrossRef]
  63. Rambaut, A.; Suchard, M.A.; Xie, D.; Drummond, A.J. Tracer v1.6. Available online: http://tree.bio.ed.ac.uk/software/tracer/2014 (accessed on 22 March 2022).
  64. Rambaut, A. FigTree, Version 1.4.3. Available online: http://tree.bio.ed.ac.uk/software/figtree/ (accessed on 1 July 2016).
  65. Nakashima, S.; Shimizu, M.; Hirota, K.; Hiruta, S.F.; Setiamarga, D.H.E. Complete mitochondrial genome of the pacific limpet Cellana nigrolineata (Gastropoda: Patellogastropoda) determined by shotgun sequencing using the Illumina ngs platform. Mitochondrial DNA Part B 2021, 6, 1857–1859. [Google Scholar] [CrossRef]
  66. Gaitan-Espitia, J.D.; Gonzalez-Wevar, C.A.; Poulin, E.; Cardenas, L. Antarctic and sub-Antarctic Nacella limpets reveal novel evolutionary characteristics of mitochondrial genomes in Patellogastropoda. Mol. Phylogenet. Evol. 2019, 131, 1–7. [Google Scholar] [CrossRef]
  67. Uribe, J.E.; Irisarri, I.; Templado, J.; Zardoya, R. New patellogastropod mitogenomes help counteracting long-branch attraction in the deep phylogeny of gastropod mollusks. Mol. Phylogenet. Evol. 2019, 133, 12–23. [Google Scholar] [CrossRef] [PubMed]
  68. Feng, J.T.; Guo, Y.H.; Yan, C.R.; Ye, Y.Y.; Li, J.J.; Guo, B.Y.; Lü, Z.M. Comparative analysis of the complete mitochondrial genomes in two limpets from Lottiidae (Gastropoda: Patellogastropoda): Rare irregular gene rearrangement within Gastropoda. Sci. Rep. 2020, 10, 19277. [Google Scholar] [CrossRef]
  69. Uwai, S.; Yotsukura, N.; Serisawa, Y.; Muraoka, D.; Hiraoka, M.; Kogame, K. Intraspecific genetic diversity of Undaria pinnatifida in Japan, based on the mitochondrial cox3 gene and the ITS1 of nrDNA. Hydrobiologia 2006, 553, 345–356. [Google Scholar] [CrossRef] [Green Version]
  70. Lee, K.M.; Diem, D.; Boo, S.M. Phylogenetic relationships of Rosenvingea (Scytosiphonaceae, Phaeophyceae) from Vietnam based on cox3 and psaA sequences. Algae 2014, 29, 289–297. [Google Scholar] [CrossRef] [Green Version]
  71. Felsenstein, J. Cases in which parsimony or compatibility methods will be positively misleading. Syst. Zool. 1978, 27, 401–410. [Google Scholar] [CrossRef]
  72. Arquez, M.; Colgan, D.; Castro, L.R. Sequence and comparison of mitochondrial genomes in the genus Nerita (Gastropoda: Neritimorpha: Neritidae) and phylogenetic considerations among gastropods. Mar. Genom. 2014, 15, 45–54. [Google Scholar] [CrossRef] [PubMed]
  73. Osca, D.; Templado, J.; Zardoya, R. The mitochondrial genome of Ifremeria nautilei and the phylogenetic position of the enigmatic deep-sea Abyssochrysoidea (Mollusca: Gastropoda). Gene 2014, 547, 257–266. [Google Scholar] [CrossRef] [Green Version]
  74. Uribe, J.E.; Kano, Y.; Templado, J.; Zardoya, R. Mitogenomics of Vetigastropoda: Insights into the evolution of pallial symmetry. Zool. Scr. 2016, 45, 145–159. [Google Scholar] [CrossRef] [Green Version]
  75. Sun, J.; Liu, Y.; Xu, T.; Zhang, Y.; Chen, C.; Qiu, J.W.; Qian, P.Y. The mitochondrial genome of the deep-sea limpet Bathyacmaea nipponica (Patellogastropoda: Pectinodontidae). Mitochondrial DNA Part B 2019, 4, 3175–3176. [Google Scholar] [CrossRef] [Green Version]
  76. Feng, J.T.; Xia, L.P.; Yan, C.R.; Miao, J.; Ye, Y.Y.; Li, J.J.; Guo, B.Y.; Lü, Z.M. Characterization of four mitochondrial genomes of family Neritidae (Gastropoda: Neritimorpha) and insight into its phylogenetic relationships. Sci. Rep. 2021, 11, 11748. [Google Scholar] [CrossRef]
  77. Liu, Y.; Li, Y.; Wang, M.; Bao, Z.; Wang, S. The complete mitochondrial genome and phylogenetic analysis of the deep-sea limpet Bathyacmaea lactea. Mitochondrial DNA Part B 2021, 6, 2090–2091. [Google Scholar] [CrossRef] [PubMed]
  78. Li, J.Y.; Zeng, C.; Yan, G.Y.; He, L.S. Characterization of the mitochondrial genome of an ancient amphipod Halice sp. MT-2017 (Pardaliscidae) from 10,908 m in the Mariana Trench. Sci. Rep. 2019, 9, 2610. [Google Scholar] [CrossRef] [PubMed] [Green Version]
Figure 1. Gene map of the complete mitogenomes for Cellana toreuma (GenBank accession No. MZ329338). The ring indicates gene arrangement and distribution.
Genes 13 01273 g001
Figure 2. Percentage of each amino acid for proteins coded by PCGs in the five mitochondrial genomes of Nacellidae.
Genes 13 01273 g002
Figure 3. The relative synonymous codon usage (RSCU) in the mitochondrial genomes of five Nacellidae species.
Genes 13 01273 g003
Figure 4. Selective pressure analysis for 13 PCGs among 5 Nacellidae mitochondrial genomes. Species of Nacellidae are shown in Table 1. The purple and blue boxes indicate the number of nonsynonymous substitutions per nonsynonymous sites (Ka) and the number of synonymous substitutions per synonymous sites (Ks), respectively. The orange line indicates the mean of pairwise divergence of the Ka/Ks ratio.
Genes 13 01273 g004
Figure 5. Comparison of mitochondrial gene order of the family Nacellidae in Patellogastropoda.
Genes 13 01273 g005
Figure 6. Phylogenetic tree inferred using maximum likelihood (ML) and Bayesian inference (BI) methods based on concatenated sequences of 13 PCGs from 88 gastropod mitogenomes. The sequences of two bivalves were chosen as the outgroups. The purple dots indicate C. toreuma sequenced in this study. The number at each node is the bootstrap probability.
Genes 13 01273 g006
Figure 7. Divergence time estimation analysis of Nacellidae inferred via Bayesian relaxed dating methods (BEAST) based on the nucleotide sequences of 13 PCGs. Fossil samples used to calibrate internal nodes are represented by an asterisk. A total of 95% HPD is reported as blue bars, and Bayesian posterior probabilities are reported for each node.
Genes 13 01273 g007
Table 1. List of species analyzed in this study and their GenBank accession numbers.
SubclassFamilySpeciesSize (bp)Accession No.
PatellogastropodaLottiidaeNipponacmea fuscoviridis18,720MK395167
Lottia goshimai18,192MT248298
Lottia digitalis26,835DQ238599
PatellidaePatella vulgata14,808MH916653
Patella ferruginea14,400MH916654
AcmaeidaeBathyacmaea nipponica16,792MF095859
Bathyacmaea lactea18,446MW309841
NacellidaeCellana toreuma16,260MZ329338
Cellana nigrolineata16,153LC600801
Nacella concinna16,761KT990126
Nacella magellanica16,663KT990125
Nacella clypeater16,742KT990124
HeterobranchiaPolyceridaeNotodoris gardineri14,424DQ991934
Roboastra europaea14,472NC_004321
Nembrotha kubaryana14,395NC_034920
AplysiidaeAplysia dactylomela14,128DQ991927
Aplysia vaccaria14,130DQ991928
Aplysia kurodai14,131KF148053
SiphonariidaeSiphonaria pectinate14,065AY345049
Siphonaria gigas14,518JN627205
VolvatellidaeAscobulla fragilis14,745AY345022
PlacobranchidaeThuridilla gracilis14,259DQ991939
Plakobranchus ocellatus14,173AP014544
Elysia chlorotica14,132EU599581
Elysia timida14,088NC_035490
Elysia ornata14,188NC_030537
OnchidiidaeOnchidella celtica14,150AY345048
Onchidella borealis14,510DQ991936
Platevindex mortoni13,991NC_013934
Peronia peronii13,968JN619346
EllobiidaeCarychium tridentatum13,908KT696545
Ovatella vulcani14,274JN615139
Ellobium chinense13,979NC_034292
Auriculinella bidentata14,135JN606066
Auriculastra duplicata13,920NC_036959
CaenogastropodaTurritellidaeTurritella bacillum15,868NC_029717
PomatiopsidaeOncomelania quadrasi15,184LC276227
Oncomelania hupensis nosophora15,182LC276226
XenophoridaeOnustus exutus16,043MK327366
NaticidaeEuspira pila15,244NC_046703
Euspira gilva15,315NC_046593
Mammilla mammata15,319NC_046597
Mammilla kurodai15,309NC_046596
TurridaeTurricula nelliae spuria16,453MK251986
ConidaeConus borgesi15,536EU827198
Conus tulipa15,756KR006970
Conus betulinus16,240NC_039922
MuricidaeMenathais tuberosa15,294NC_031405
Indothais lacera15,272NC_037221
Concholepas concholepas15,495NC_017886
Chicoreus torrefactus15,359NC_039164
Chicoreus asianus15,361MN793976
Boreotrophon candelabrum15,265NC_046505
Ceratostoma rorifluum15,338MK411750
Ceratostoma burnetti15,334NC_046569
Ocinebrellus inornatus15,324NC_046577
Ocinebrellus falcatus15,326NC_046052
NeritimorphaNeritidaeNerita chamaeleon15,716MT161611
Nerita balteata15,571MN477253
Clithon oualaniense15,706MT568501
Clithon sowerbianum15,919MT230542
Clithon retropictus15,802NC_037238
Neritina iris15,618MW694828
Septaria lineata15,697MW694829
Neritina violacea15,710KY021066
NeomphalionesPeltospiridaeChrysomallon squamiferum15,388AP013032
Gigantopelta aegis16,097MW442948
VetigastropodaPhasianellidaePhasianella solida16,698NC_028709
Phasianella australis18,397KX298888
AngariidaeAngaria neglecta19,470NC_028707
Angaria delphinus19,554NC_031860
HaliotidaeHaliotis ovina16,531NC_056350
Haliotis tuberculata16,521FJ599667
Haliotis laevigata16,545NC_024562
TrochidaeStomatella planulata17,151NC_031861
Gibbula umbilicalis16,277NC_035682
Umbonium thomasi15,998MH729882
Monodonta labio16,440MK240320
TurbinidaeBolma rugosa17,432NC_029366
Lunella granulate17,190NC_031857
Lunella correensis17,308MN604179
TegulidaeTegula lividomaculata17,375NC_029367
Tegula brunnea17,690NC_016954
Chlorostoma argyrostomum17,780KX298892
Omphalius rusticus18,067NC_056356
Omphalius nigerrimus17,755KX298895
Table 2. Annotation of the Cellana toreuma mitochondrial genome.
GeneStrandLocationLengthCodonsIntergenic Nucleotide*(bp)Anticodon
StartStop
cox1+115421542ATG/TAA74
cox2+16172315699ATG/TAA21
trnD+2337240367 58GTC
atp8+24622650189ATG/TAA248
atp6+28993393495ATG/TAA34
trnT+3428349669 53TGT
nad5-355052321683ATG/TAA39
trnH-5272533968 30GTG
trnQ-5370543869 24TTG
nad4-546368151353ATA/TAA5
nad4l-68217087267ATG/TAA49
trnS2-7137720468 17
cob-722283671146ATG/TAG20
nad6-83888870483ATT/TAA24
trnP-8895896268 −47TGG
nad1-89169881966ATT/TAA21
trnL2-9903996866 4
trnL1-997310,04169 −38
rrnL-10,00411,2691266 87
trnV-11,35711,42367 0TAC
rrnS-11,42412,310887 0
trnY-12,31112,37666 15GTA
trnM-12,39212,45867 −2CAT
trnF-12,45712,52468 2GAA
trnW-12,52712,59569 8TCA
trnC-12,60412,67067 643GCA
trnG+13,31413,38067 7TCC
trnE+13,38813,45568 0TTC
cox3+13,45614,235780ATG/TAG22
trnR+14,25814,32467 1TCG
trnN+14,32614,39570 76GTT
nad3+14,47214,825354ATG/TAA7
trnA+14,83314,90068 0TGC
trnK+14,90114,97373 13TTT
trnI+14,98715,05468 31GAT
trnS1+15,08615,15368 3GCT
nad2+15,15716,2541098ATA/TAG5
Intergenic nucleotide*(bp): positive values indicated the interval sequence of adjacent genes, and negative values indicated the overlapping of adjacent genes.
Table 3. Nucleotide compositions of the mitogenomes from five species in family Nacellidae of the Patellogastropoda.
Lengh (bp)A (%)T (%)G (%)C (%)A+T (%)AT-SkewGC-Skew
Cellana toreuma16,260 28.939.519.911.768.4−0.155 0.261
tRNAs1497 34.834.816.813.669.60.000 0.103
rRNAs2153 41.729.714.514.171.40.169 0.016
PCGs11,133 26.539.817.316.466.3−0.201 0.027
1st5420 30.936.421.611.167.3−0.083 0.319
2nd5420 28.838.119.913.266.9−0.140 0.201
3rd5420 27.043.918.410.770.9−0.238 0.264
Cellana nigrolineata16,153 26.538.022.712.764.6−0.179 0.283
tRNAs1498 33.433.918.014.667.4−0.007 0.104
rRNAs2143 41.627.714.616.169.30.201 −0.047
PCGs11,046 25.436.818.918.862.2−0.184 0.003
1st5385 28.136.323.512.264.3−0.128 0.317
2nd5384 26.037.922.913.263.9−0.186 0.268
3rd5384 25.540.021.912.765.4−0.221 0.265
Nacella clypeater16,742 27.538.619.913.966.1−0.169 0.177
tRNAs1560 32.633.719.014.766.3−0.015 0.125
rRNAs2222 43.127.514.614.870.60.221 −0.006
PCGs11,283 26.338.917.617.265.2−0.193 0.009
1st5581 25.840.419.214.766.1−0.221 0.132
2nd5581 28.238.319.813.766.5−0.151 0.182
3rd5580 28.437.320.913.465.7−0.134 0.217
Nacella concinna16,761 27.138.920.413.666.0−0.180 0.197
tRNAs1501 32.634.118.714.666.8−0.022 0.122
rRNAs2216 44.027.114.214.771.10.237 −0.017
PCGs11,286 25.738.718.117.564.4−0.201 0.015
1st5587 28.236.421.314.164.6−0.127 0.202
2nd5587 26.539.519.914.166.0−0.198 0.171
3rd5587 26.640.819.912.767.4−0.212 0.220
Nacella magellanica16,663 27.438.920.113.666.2−0.174 0.192
tRNAs1500 32.434.118.814.766.5−0.026 0.124
rRNAs2214 43.527.414.414.671.00.227 −0.008
PCGs11,280 26.239.017.517.265.2−0.197 0.009
1st5555 28.037.021.513.565.0−0.139 0.230
2nd5554 27.738.020.114.265.7−0.158 0.170
3rd5554 26.441.618.813.268.1−0.224 0.175
Publisher’s Note: MDPI stays neutral with regard to jurisdictional claims in published maps and institutional affiliations.

