Abstract
Studies of local adaptation in populations of chinaberry (Melia azedarach L.) are important for clarifying patterns in the population differentiation of this species across its natural range. M. azedarach is an economically important timber species, and its phenotype is highly variable across its range in China. Here, we collected M. azedarach seeds from 31 populations across its range and conducted a common garden experiment. We studied patterns of genetic differentiation among populations using molecular markers (simple sequence repeats) and data on phenotypic variation in six traits collected over five years. Our sampled populations could be subdivided into two groups based on genetic analyses, as well as patterns of isolation by distance and isolation by environment. Significant differentiation in growth traits was observed among provenances and families within provenances. Geographic distance was significantly correlated with the quantitative genetic differentiation (QST) in height (HEIT) and crown breadth. Climate factors were significantly correlated with the QST for each trait. A total of 23 climatic factors were examined. There was a significant effect of temperature on all traits, and minimum relative humidity had a significant effect on the survival rate over four years. By comparing the neutral genetic differentiation (FST) with the QST, the mode of selection acting on survival rate varied, whereas HEIT and the straightness of the main trunk were subject to the same mode of selection. The variation in survival rate was consistent with the variation in genetic differentiation among populations, which was indicative of local adaptation. Overall, our findings provide new insights into the responses of the phenological traits of M. azedarach to changes in the climate conditions of China.
1. Introduction
Members of the genus Melia Linnaeus (Meliaceae: Melioideae: Melieae) are deciduous trees or shrubs that occur in tropical and subtropical areas of the eastern hemisphere, including south of the Yellow River in China. The genus Melia has been proposed to comprise either one (M. azedarach Linn.) or three (M. azedarach, M. toosendan Sieb. et Zucc., and M. dubia Cav.) species [1,2,3,4], and much debate remains regarding the taxonomy of this group. Melia species can grow rapidly, and they are widely grown in China, especially M. azedarach, because of the mechanical properties of their wood, which makes them resistant to insects, pathogens, and corrosion [1]. Melia species are also often used as medicinal plants for the treatment of various diseases, including diarrhea, diabetes, rheumatic diseases, and hypertension [5]. Several studies have examined the chemical constituents (e.g., limonoids and triterpenoids) extracted from the fruits, stem bark, and leaves of M. azedarach and M. toosendan [6,7]. Plants in the genus Melia might provide useful future medicines in light of their diverse medicinal properties.
The features often used to distinguish Melia species, such as the genes underlying differences in phytochemicals and the phylogenetic relationships among species, have not been thoroughly explored. This deficiency in our knowledge of the features delimiting these species affects the efficiency of genetic breeding programs, as well as the ability of Melia species to be used as medicinal plants. Morphological differences among Melia species are subtle. M. azedarach has the following distinguishing features: 3–6-loculed ovaries, small fruits less than 2 cm in length, leaflets with blunt teeth, and inflorescences as long as the leaves. M. toosendan has the following distinguishing features: 6–8-loculed ovaries, large fruits approximately 3 cm in length, leaflets with indistinct blunt teeth on the entire margin, and inflorescences half as long as the leaves. M. dubia has the following distinguishing features: petals pilose on both sides, elliptic drupes, and distribution restricted to south of the Five Ridges. M. toosendan is often considered a synonym of M. azedarach, and it has been infrequently documented in China [1,4]. The geographic distributions of M. azedarach and M. toosendan overlap; they also show overlap in their flowering time (April to May for M. azedarach vs. March to April for M. toosendan). These species were likely generated by a sympatric speciation event, and they might naturally hybridize given that their flowers are diecious. Populations of the genus Melia in China thus represent a M. azedarach species complex; M. azedarach is considered the model species of the genus Melia [1].
Local adaptation occurs when the mean fitness of a population is greater in its native habitat than in foreign habitats [8,9,10]. Local adaptation is shaped by various evolutionary mechanisms, including selection, genetic drift, mutation, and gene flow. Divergent selection often acts on populations occurring in spatially heterogeneous environments; local adaptation to such environments can thus contribute to shaping the responses of populations to changes in the environment [11]. Several methods have been used to study local adaptation. Field experiments can be conducted to clarify the role of environmental factors (i.e., non-genetic factors) underlying phenotypic differentiation among populations and at various geographic scales [12,13]. Common garden experiments can also be conducted to clarify the relative importance of different factors in shaping local adaptation between populations using comparisons of neutral genetic differentiation (FST) and quantitative genetic differentiation (QST); genome scans can be used to identify genes involved in local adaptation, and genomic regions under selection can be identified in populations via high-density genetic markers [14,15,16]. Linkage maps and QTLs have been used to reveal fitness-associated phenotypic variation that is closely related to genotypes linked with marker loci; this approach has also been used to generate linkage maps and find association sites in species with large populations, short life cycles, and abundant molecular markers, such as Arabidopsis and rice [17,18,19]. Genome-wide association studies can also be used to identify single-nucleotide polymorphisms and alleles associated with environmental factors and phenotypes in species with several populations, large sample sizes, and reference genomes [20,21].
The provenance trial approach is generally used to (i) characterize variation in quantitative traits among populations, (ii) determine progeny performance, and (iii) estimate genetic parameters [22]. This approach has been used to study several tree species, including Platycladus orientalis [23], Populus fremontii [24], Populus trichocarpa [25], Eucalyptus dunnii [26], and Pinus caribaea [27]. Provenance trials are also effective for detecting natural selection and predicting the ability of populations to adapt to future climate change [28,29,30,31]. Several studies have shown that provenance trials can be used to characterize local adaptation among populations and clarify differentiation in quantitative traits among populations [32,33]. Previously conducted provenance trials of the M. azedarach complex have focused on estimating heritability and predicting genetic gain to aid breeding programs [34,35,36]. However, the local adaptation of various populations in the M. azedarach complex, as well as the role that lineage sorting has played in mediating local adaptation, has not yet been clarified. Here, we used provenance trials over five years to determine the role that selection has played in driving differentiation among populations of the M. azedarach complex. The results of this analysis provide key information that will aid forest breeding programs.
Simple sequence repeat (SSR) markers are generally considered selectively neutral, and an analysis of SSRs can provide information complementary to data on adaptive molecular variation among populations [37]. Specifically, this analysis involves characterizing (i) the population genetic structure to evaluate the rates of natural hybridization; (ii) the effects of isolation by distance (IBD) to quantify the levels of gene flow; and (iii) the evolutionary genetic relationships among populations to evaluate their taxonomic status. A comparison of the population differentiation indicated by molecular markers () [38] and that driven by quantitative traits () [39] can be used to identify the relative importance of climate factors and geographic distance in shaping the evolution of the traits mediating adaptation. Thus, data from provenance trials and information on population history can be used to clarify patterns of differentiation in the M. azedarach complex.
The aims of this study were to determine (i) whether there is local adaptation among M. azedarach populations according to analyses of phylogenetic relationships and population structure derived from molecular markers, and (ii) whether ecological adaptation plays a role in species differentiation through provenance trials. The results of these analyses will provide new insights into the role of natural selection in shaping patterns of differentiation among M. azedarach populations.
2. Materials and Methods
2.1. Sample Sites and Collection of Seeds
Seed samples were obtained from 43 populations across the entire range of the M. azedarach complex (Table 1; Figure 1). These samples were obtained as far south as a tropical rainforest in southern China (Lingshui, Hainan province) to as far north as a temperate monsoon forest in northern China (Tai’an, Shandong province); the difference in the mean annual temperatures between these regions is 16.4 °C. Samples of putative M. toosendan and M. azedarach could not be distinguished according to seed size and leaf morphology. M. dubia samples could not be identified because the sizes of their seeds and other distinguishing leaf traits remain unclear. The number of samples obtained from each population ranged from 14 to 15 for the SSR dataset; in each provenance trail, each population comprised 1–26 families with 50 individuals each (Experiment I, Table 1). Provenance trials were conducted (Experiment II, Table 1).

Table 1.
Population information for this study.
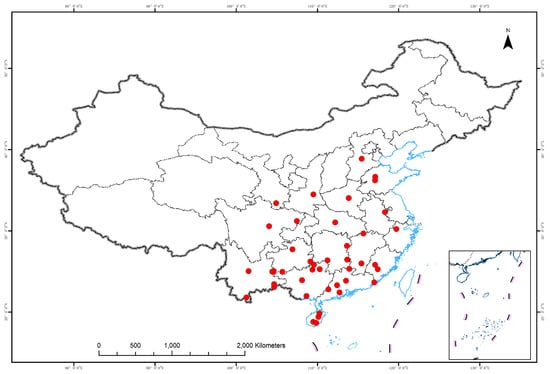
Figure 1.
Geographic locations of the populations sampled in this study.
A nuclear SSR marker analysis was conducted using 31 samples, including ten populations with half-sib pedigrees and 21 populations lacking known pedigrees (Table 1). Samples used in the SSR marker analysis were from populations spanning the entire range of the M. azedarach complex (Figure 1 and Table 1).
2.2. Provenance Trials
Seedlings from the 22 provenances, including 236 half-sibs, were obtained from seeds sown in a field at the South China Agriculture University, Guangzhou, Guangdong province, China, in February 2014 (Table 1). When the seedlings were 30 cm in height, 50 individuals per family were transplanted to the Leizhou Experimental Site at Suixi, Zhanjiang (20°57′12″ N, 109°48′34″ E), Guangdong province, China. This site is a subtropical area featuring a maritime monsoon climate. The average annual temperature is 23.5 °C, and the average annual precipitation ranges from 1417 to 1804 mm. The rainy season runs from May to October. Approximately two typhoons make landfall at this site annually.
Our field experiment was conducted using a randomized block design with 10 replicate blocks and five plots (each corresponding to a single family) per block in 3 m intervals, with a spacing of 1.5 m between plots. A total of 11,800 trees were planted on 1 May 2014.
2.3. Molecular Procedures
Leaf samples were obtained from 31 populations (Table 1) and stored at 80 °C until DNA extraction. The E.Z.N.A. high-performance DNA Mini Kit (Omega Bio-Tek, Inc. Norcross, GA, USA) was used to extract DNA from 150 mg leaf samples; the DNA was separated using electrophoresis on a 1.0% agarose gel. The concentration of DNA was measured using a Nano-Drop 1000 spectrophotometer (Thermo Fisher Scientific, Waltham, MA, USA); after adjusting the concentration to 50 ng/µL, the DNA was stored at 20 °C until PCR amplification.
A total of 15 SSR markers were screened from tests of 135 primer pairs for the M. azedarach complex (Supplementary Tables S1 and S2, [40]). PCR reactions were conducted in a total volume of 15 μL with approximately 50 ng of DNA, 1× PCR buffer, 1.33 mM MgCI2, 8 μM each pair of primers, 0.67 mM dNTPs, and 0.75 U Taq Polymerase (Invitrogen Inc., Carlsbad, CA, USA). The reactions were conducted in an Eastwin Thermal Cycler (EDC-810, Suzhou, China) with the following thermal cycling conditions: 4 min at 94 °C; 21 cycles of 94 °C, annealing at 56 to 60 °C for 30 s, with the annealing temperature decreased by 0.5 °C in each cycle, and an extension at 72 °C for 1 min; 25 cycles of 94 °C for 30 s, annealing at 52 to 62 °C for 30 s, with the annealing temperature decreased by 0.5 °C each cycle, and an extension at 72 °C for 1 min; and a final extension for 10 min. The samples were then stored at 4 °C for genotyping. Polymorphic bands of SSR markers were detected using silver staining methods via 6% denaturing polypropylene gel electrophoresis [41].
2.4. Analysis of Data from the Provenance Trials
We measured the following growth traits of M. azedarach for five consecutive years from 2015 to 2019: maximum stem height (HEIT), diameter at breast (1.3 m) height (DBH), the ground diameter in the first year (GBH), and the crown breadth (CRB). Measurements were also taken on the straightness of the main trunk (SMT), the number of branches (NOB), and the clear bole height (CBH) in 2016. Measurements of the survival rate (SR) were taken every year.
The straightness of the main trunk was scored visually using a scale from 1 to 4, with 1 indicating a trunk that was straight, 2 indicating a trunk that was slightly bent, 3 indicating a trunk that was largely bent, and 4 indicating a trunk with many twigs emanating from the ground. We used HEITi to refer to the maximum stem height (HEIT) at the ith measurement, with i = 1, 2, 3, 4, and 5 corresponding to measurements taken in 2015, 2016, 2017, 2018, and 2019, respectively. Other traits were referred to using a similar notation. A total of 30 traits were measured for five consecutive years (Supplementary Table S8).
Each observation was described using a mixed linear model:
where Yijkl is the lth observation in the kth family of the jth provenance in the ith block, μ is the overall mean, Bi is the fixed effect of the ith block (i = 1, 2,…, 10), Pj is the random effect of the jth provenance (j = 1, 2… 22), Fj(i) is the random effect of the kth family nested in the jth provenance, and Eijkl is the residual error.
Yijkl = μ + Bi + Pj + Fk(j) + Eijkl
Population genetic differentiation associated with quantitative traits was quantified using QST [39,42,43], which was calculated as follows:
where is the variance in provenance effects and is the variance in family effects. The variance components of were calculated for each population pair (231 pairs, Supplementary Table S5) and each trait using REML [44] in the R package AsReml-R 4.1.0.106 [45].
Climate data were used to characterize the environmental conditions at each provenance site and assess the effect of ecological variation on patterns of population differentiation. A total of 23 climatic variables were obtained from the National Meteorological Information Center of China (http://data.cma.cn/, accessed on 6 July 2016). These monthly climate data were collected from 22 weather stations in China from 1951 to 2012, and the means of each climatic factor were calculated (Supplementary Table S9). A pairwise distance matrix of populations was generated based on the absolute difference in climate variables between populations. Pearson correlation coefficients were estimated between the distance in each climate variable and the magnitude of the population differentiation in each trait.
2.5. Analysis of SSR Markers
A micro-checker was used to detect null alleles for all the genotypes obtained from 15 SSR primer pairs [46]. Analyses of molecular variance, Gst (unbiased Fst), Mantel tests, and allele frequency estimates were obtained using GenAlEx v. 6.502 [47]. Linkage disequilibria between loci and FST were estimated at multiple loci using Genepop v4.7 [48].
Genetic relationships among populations were inferred using Nei’s genetic distance [49] and the neighbor-joining method with 1000 bootstrap replicates in Phylip 3.695. Phylogenetic relationships were visualized using Poptree2 [50]; the Dsw distance [51] was calculated using microsatellite DNA data. An analysis of the population structure was conducted using the Structure 2.3.4 [52] software with the admixture model and assuming that the allele frequencies were correlated. The parameters in the population structure analysis were as follows: 10 iterations from K = 1 to K = 10 with 100,000 burn-in iterations and 100,000 iterations after the burn-in period, which ensured a steady-state distribution for parameter estimation. STRUCTURE HARVESTER (http://taylor0.biology.ucla.edu/structureHarvester/, accessed on 5 December 2015), [53]) was used to determine the optimal number of clusters (K-value).
To evaluate the relative importance of IBD, the geographic distance between populations was computed using the spherical distance (L) formula based on the longitude, latitude, and elevation:
where ; ; ; , , and are the longitude, latitude, and elevation of the ith population (i = 1, 2), respectively, and R is the radius of the Earth. Regression analysis [54] and Mantel tests (10,000 permutations) were performed between the matrices of geographic distance (Supplementary Table S6) and population differentiation using R scripts.
Differences between FST and QST were tested using the R package QstFstComp (https://github.com/kjgilbert/QstFstComp, accessed on 11 April 2019), [43]) to assess the local adaptation in quantitative traits. The bootstrapping method [55] was used to compute confidence intervals for QST and correct for variable sample sizes [43]. In this approach, observed differences between QST and FST were compared against the simulated expected distribution under a neutral hypothesis. Significant differences indicated the presence of natural selection [42].
3. Results
3.1. Population Genetic Differentiation
Null alleles were absent at all 15 SSR loci in the 31 populations according to the micro-checker analysis. A total of 110 of the 465 alleles (23.65%) were not in a Hardy–Weinberg equilibrium (HWE) after a Bonferroni correction (α = 0.05/465 = 0.00011) (Supplementary Table S3). The inbreeding coefficients (FIS) were generally negative at individual loci, and the observed heterozygosity was not greater than the expected values under a HWE.
The average polymorphic information content (PIC) was approximately 73.9%; the highest PIC value was observed in Liuyang, Hunan province (77.3%) and the lowest PIC value was observed in Wuzhishan, Hainan province (66.6%) (Table 2). Shannon’s information index (I) was highest (1.81 ± 0.46) in Ceheng, Guizhou province, and I was lowest (1.46 ± 0.43) in Wuzhishan, Hainan province; the average value of I was 1.69 ± 0.39. The number of observed alleles ranged from 6.00 ± 2.93 (Wuzhishan, Hainan province) to 8.60 ± 3.44 (Ceheng, Guizhou province), and the average number of observed alleles was 7.27 ± 2.46. The number of effective alleles ranged from 4.09 ± 1.86 to 5.78 ± 2.62, and the average number of effective alleles was 5.05 ± 1.85. The mean expected heterozygosity (He) ranged from 0.74 ± 0.11 (Wuzhishan, Hainan province) to 0.83 ± 0.06 (Liuyang, Hunan province), and the average He was 0.80 ± 0.08. The He in each population was greater than the average value of Nei’s gene diversity.
Table 2.
Number of alleles, polymorphic information content (PIC), expected heterozygosity (He), gene diversity (h), and Shannon’s information index (I) for 31 populations of M. azedarach L.
3.2. Genetic Diversity according to GST and IBD
An analysis of the population genetic differentiation revealed that 8.6% of the total genetic variation at multiple SSR loci was distributed among populations. The genetic differentiation significantly differed from zero at individual loci (p < 0.001; Table 3), and the GST values ranged from 0.0327 at the SSR120 locus to 0.1281 at the SSR117 locus. Significant relationships between the inverse number of migrants between populations inferred from GST/(1 − GST) and the logarithm of the geographic distance were observed for the loci SSR54, SSR74, SSR111, SSR117, and SSR123 (Table 3). A significant but weak effect of IBD was observed according to a multilocus analysis (a = −0.0353 and b = 0.0063; p = 0.010; R2 = 0.06; Table 3).
Table 3.
Population genetic differentiation and tests of IBD at individual SSR loci in M. azedarach.
The FST/(1 − FST) values ranged from 0.034 to 0.242, and the natural logarithm of the geographic distance ranged from 10.28 to 14.51. Mantel’s test based on multilocus FST/(1 − FST) and geographic distance matrices revealed weak IBD effects at multiple loci (r = 0.245, p = 0.01, Figure 2).
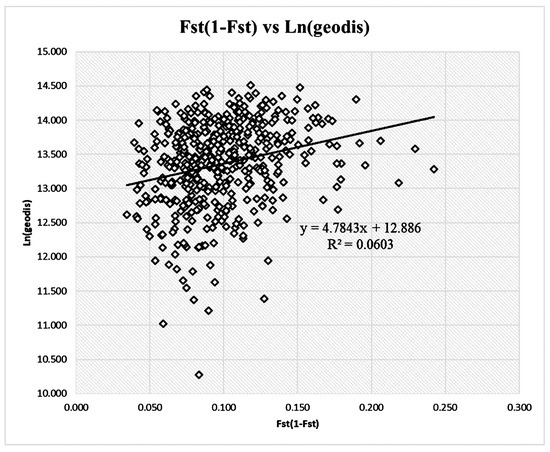
Figure 2.
Mantel test of genetic differentiation according to population distances.
3.3. Genetic Structure and Genetic Relationships among Populations
The STRUCTURE analysis revealed a maximum ΔK value at K = 2 (ΔK = 50), which indicated that the 31 populations could be divided into two groups (Figure 3). Group I (Figure 4, K = 2 in red) comprised populations 739 and 754 from the Yunnan province; populations 842, 843, and 858 from the Guizhou province; populations 1060 and 1061 from the Sichuan province; and population 1565 from the Gansu province. Group II (Figure 4, K = 2 in yellow) comprised population 102 from the Fujian province; populations 205 and 248 from the Jiangxi province; populations 307, 308, and 310 from the Hunan province; populations 412 and 415 from the Guangdong province; populations 524 and 525 from the Hainan province; populations 628, 631, and 652 from the Guangxi province; population 741 from the Yunnan province; population 844 from the Guizhou province; population 959 from the Zhejiang province; population 1162 from the Anhui province; population 1363 from the Henan province; population 1464 from the Shannxi province; population 1666 from the Hebei province; populations 1767 and 1768 from the Shandong province; and population 1869 from the Hubei province.
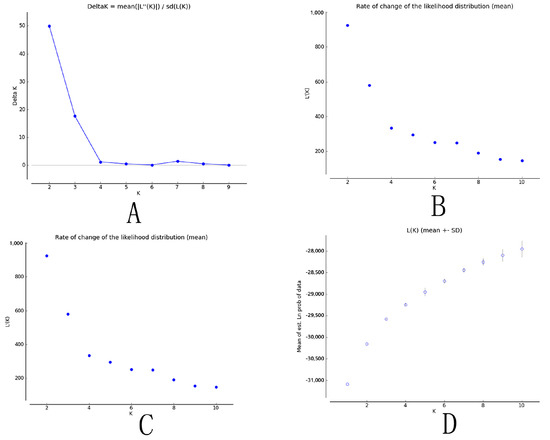
Figure 3.
Scatter diagrams of the parameters from the STRUCTURE analysis. (A): ΔK; (B): L’(K); (C): L’’(K); and (D): Ln P(D).
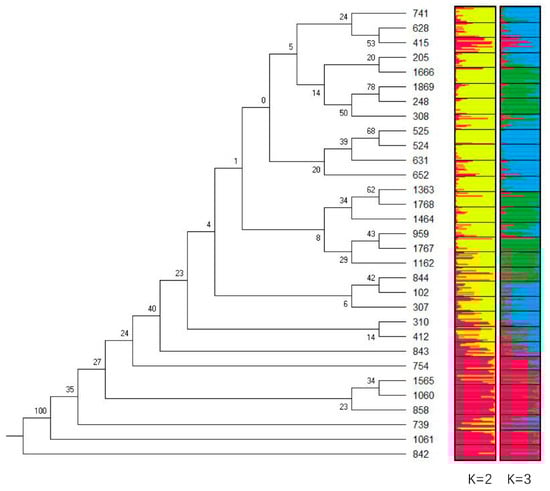
Figure 4.
A consensus tree of the genetic relationships and genetic structure among 31 populations of M. azedarach. (Note: the numbers at the forks are the bootstrap probabilities estimated from 1000 bootstrap samples in the neighbor-joining method).
When the populations of Group I and Group II were mapped to their geographic locations (Figure S1), Group II could be separated into two subgroups, with nine populations (248, 959, 1162, 1363, 1464, 1666, 1767, 1768, and 1869) from the middle and lower reaches of the Yangtze River to downstream of the Yellow River, and the other fourteen populations from the southern side of the Yangtze River to Hainan Island.
Nei’s genetic distance between populations ranged from 0.2383 (842–1061) to 1.2996 (525–1060), and the mean was 0.5684 ± 0.1575. A consensus tree of genetic relationships revealed two distinct groups (Figure 4), which coincided with those obtained from the STRUCTURE analysis (K = 2, 3; Figure 4). The populations in Group I (842, 843, 739, 754, 858, 1060, 1061, and 1565) were closely related but incompletely separated from the other populations; however, there was low support for this topology. The bootstrap probability values between the populations in Group I ranged from 0.23 (858–1060) to 1.00 (842–1061), and the mean value was 0.3838 ± 0.24. The bootstrap probability value between the populations in Group II ranged from 0.06 (307–102) to 0.78 (248–1869), and the mean value was 0.3483 ± 0.20. The approximately unbiased value was 0.45.
3.4. Population Differentiation in Phenotypic Traits and QST Distance Matrices
Two-factor analyses of variance of the provenances and families within provenances were conducted for each trait in each year of the provenance trials (Supplementary Table S4). Highly significant differences were observed in 30 traits among all 22 provenances (p < 0.0001). Significant variation was observed in 29 traits among families within provenances (p < 0.0001); however, the p-value for CBH5 was only below 0.01. The significant variation observed in all 30 traits indicated that these populations were highly differentiated.
The QST matrix was computed for the 30 traits across the five years of the provenance trials (Supplementary Table S5, [43]). The mean growth traits HEIT, CRB, and GBH/DBH increased from 1.544 to 10.697, from 0.919 to 2.820, and from 3.186 to 11.927, respectively. The mean SR, SMT, and NOB/CBH decreased from 0.803 to 0.546, from 1.730 to 1.416, and from 3.685 to 1.664, respectively. The annual mean of the QST values for the HEIT increased from 0.321 to 0.499, while that for the NOB/CBH increased from 0.437 to 0.777. The annual mean of the QST values for the CRB decreased from 0.488 to 0.461, while that of the GBH/DBH decreased from 0.556 to 0.497. However, the annual mean of the QST values for the SMT ranged from 0.412 to 0.621, while that of the SR ranged from 0.508 to 0.743. Both of them sharply decreased in the second year (Figure 5).
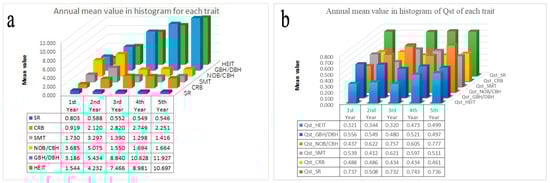
Figure 5.
Annual mean value for each trait and the QST of each trait during each year of the study.
3.5. Correlations between QST Distance Matrices and The Geographic Distance Matrix
The QST distance matrices for 15 of the 30 traits measured were significantly correlated with the geographic distance matrix (Supplementary Tables S5 and S6; Table 4). The traits with significant correlations included the height, crown, DBH, and SMT traits. The correlation coefficients of the five height traits ranged from −0.338 to −0.237 (p < 0.001), the correlation coefficients of the four crown traits ranged from −0.373 to −0.157 (p < 0.0171), and the correlation coefficients of the three DBH traits and three SR traits ranged from −0.183 to 0.0210 (0.0272 < p < 0.001). These findings indicated that the QST matrices of the HEIT, CRB, and SR were affected by geographic distance in five, four, and three of the years, respectively (Table 4). The QST matrices of the other traits were less affected by geographic distance than the HEIT, CRB, and SR.
Table 4.
Correlation between the QST matrices of the 30 measured traits and the geographic distance matrix by year.
3.6. Analysis of Ecological Adaptation
3.6.1. QST Matrices of Traits Correlated with Climate Factors
The environmental factors were mostly negatively correlated with the QST of the traits, and many of these correlations were highly significant (p < 0.001) (Supplementary Table S7). The HEIT was most strongly affected by the average temperature, average vapor pressure, and mean minimum temperature (p < 0.01 in more than four years). The GBH/DBH was most strongly affected by the wind direction with the maximum wind speed (p < 0.01 in all five years). The NOB/CBH was significantly affected by the extreme minimum temperature, average temperature, average vapor pressure, and mean maximum and minimum temperatures. The SMT was most strongly affected by the wind direction with the maximum wind speed (p < 0.05 in four years), average vapor pressure (p < 0.001 in three years), and average temperature (p < 0.01 in three years). The CRB was affected by the extreme maximum temperature and average station pressure in four years (p < 0.05). SR was most strongly affected by the minimum relative humidity in four years (p < 0.05); it was also affected by mean temperature anomalies in four years (p < 0.05). Temperature had a significant effect on all the traits and was thus the main cause of the differentiation in phenotypic traits.
3.6.2. Seedling Survival
There was a significant decrease in seedling survivorship (54.6% survival) across the five years of the study. The mean QST value in the second year was 0.508, which was significantly lower than that of the other years (0.732–0.743); this indicated that the pattern of local adaptation in the second year was different from that in the other years (Figure 6a). Three populations (739, 740, and 842) had substantial effects on the patterns of local adaptation, as their survival differed by as much as 52.3% compared with that of local populations (Figure 6b). None of the predictor variables explained the variance among population pairs in the patterns of local adaptation.
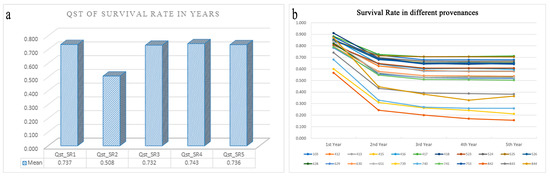
Figure 6.
QST mean value of the survival rate in each year (a); the survival rate of the different provenances in the five years (b).
3.7. QST–FST Comparison
QST and FST significantly differed for the maximum stem height, the straightness of the main trunk, and the survival rate (Table 5). The QST values of HEIT 4, 5, and 6 were −0.0615, −0.0648, and 0.0711 lower than the FST values (p = 0.016, 0.0178, and 0.0064, respectively). The QST value of SMT 6 was −0.0725 lower than the FST (p = 0.0072). The QST values of SR 5, 6, 7, and 8 were 0.1047, 0.1016, 0.1254, and 0.1235 higher than the FST values (p = 0.0152, 0.0132, 0.0040, and 0.0042, respectively). The QST values of growth traits were generally lower than the FST values, which indicated that the phenotypic differentiation was driven by uniform selection. The QST value for the survival rate was higher than the FST value, which indicated divergent selection; this finding is consistent with the relationships among the populations inferred from the SSR data.
Table 5.
Comparison of the QST values of traits with the FST values of microsatellite alleles in different populations.
4. Discussion
We obtained strong evidence for the local adaptation of M. azedarach populations in Yunnan, Guizhou, Sichuan, and Gansu (Group I). The seedlings from southern Guizhou and northern Guangxi were the tallest and had the highest DBH and survival rates [56]. The families from Guangdong and Hainan increased rapidly in height, DBH, CBH, SMT, and CRB [57]. A sharp decrease in survival was observed for the Yunnan and Guizhou populations in the second year of the study (Figure 6). An analysis of 12 key traits of the fruit stones and seeds of 70 M. azedarach provenances collected from 17 provinces revealed that the geographic variation in the stones and seeds was affected by both longitude and latitude; however, the geographic variation was more pronounced with latitude than with longitude [58]. These findings suggest that climate is the most important factor shaping patterns of local adaptation in M. azedarach. Below, we provide a more detailed discussion of the main findings.
4.1. Detection of Local Adaptation
Significant correlations were observed between the GST/(1 − GST) for five loci and geographic distance. Patterns in the GST and FST revealed a significant but weak IBD effect (Table 3; Figure 2). An analysis of the genetic structure and genetic relationships using SSR loci revealed that the populations could be divided into two groups: Group I, comprising populations from the Yunnan and Guizhou provinces, and Group II, comprising two groups of populations separated by the Yangtze River. These findings are more informative than those derived from sequence-related amplified polymorphism (SRAP) analyses [57]. Consistent with the analysis of the geographic variation of the fruit stones and seeds, there was a southwest–northeast gradient in the width of the stones and seeds and a northwest–southeast gradient in the hundred-grain weight of the stones and seeds. Group I of the SSRs coincided with Groups III and IV of the stones and seeds [3,58].
Significant differences were detected in six growth traits in each of the five years according to an analysis of variance, which indicated substantial differentiation among populations. The QST distance matrices of 15 growth traits were significantly correlated with the geographic distance matrix. The HEIT, GBH/DBH, NOB/CBH, SMT, CRB, and SR were affected by temperature in all five years, but the SR was most strongly affected by the minimum relative humidity in four of the years (p < 0.05). A sharp decrease in seedling survivorship to 54.6% was observed in the second year, and the mean QST value was 0.508 in this year. This phenomenon has also been appeared in another trial [59]. Following a cold damage in Henan, the mortality rates of the southern seedlings from Lishui, Zhejiang province; Chengdu, Sichuan province; Liling, Hunan province; and Nanchang, Jiangxi province were 62.5%, 58.2%, 44.2%, and 41.7%, respectively. By contrast, the survival rate of the seedlings from northern China was greater than 95%.
According to twelve phenological indexes and three geographic factors, the distribution of M. azedarach in China has been divided into 11 phenological areas [60]. To facilitate provenance allocation, three areas of provenance transfer have been identified according to an analysis of the genetic structure using SSRs and SRAPs associated with adaptability at the seedling stage [58]. The flowering phenology of M. azedarach, such as the timing of various developmental stages, flowering, and fruiting, ranges from August in Bogor to September in Gambung, West Java [61]. All the phenological patterns of M. azedarach are indicative of local adaptation.
The patterns of genetic differentiation and growth trait differentiation, as well as variation in the phenology of M. azedarach, are consistent with local adaptation in this species. Climate is the most important factor shaping the patterns of population differentiation, and the temperature and minimum relative humidity play the most important roles in shaping patterns of local adaptation.
4.2. FST–QST Comparison in a Common Garden Experiment
We conducted a common garden experiment with a randomized block design, and a total of 11,055 individuals from all populations were used to estimate the QST. The QST matrices of 30 traits significantly differed among the 22 provenances in a half-sib experiment (p < 0.0001). High sample sizes enhanced the accuracy of the QST estimates [43]. The trend surface analysis of growth and seed morphological traits demonstrated that the phenotypes of chinaberry vary with latitude and longitude ([3,58]; Table 4). This variation in growth traits with latitude and longitude caused the QST values to generally be significantly lower than the FST values, especially for the HEIT and SMT, which indicates uniform selection. This uniform selection on growth traits indicates the importance of rapid growth as a survival strategy in chinaberry, which is a pioneer tree species in forest ecosystems.
A population genetic differentiation analysis of M. azedarach revealed IBD and isolation by environment, and provided insights into the genetic relationships and genetic structure (Table 3; Figure 2 and Figure 4). Fossil studies suggest that these species might have originated during the Later Oligocene (30 million years ago (MYA)) in Nanning, China [62]. Other fruit fossils of Melia have been dated to the middle Miocene (20 MYA) of central Washington [63], the Middle Pleistocene (2 MYA) in northeastern Thailand [64], the Upper Miocene (24 MYA) in Poland [65], and the Holocene (1 MYA) in Jiangsu, China [66]. Geographic variation in the fruits and seeds of M. azedarach has been characterized in northern latitudes (18–38°) and eastern longitudes (100–122°) in China [58,67]. The size of seed fossils is similar to that of living species. Thus, the population with large seeds near the Sichuan Basin might have originated several MYA. The relationships among putative M. toosedan and putative M. azedarach were inferred by constructing a tree with 10,000 bootstrap replicates. The QST–FST distribution for each traittreatment combination was used to infer the empirical p-values associated with our point estimates of QST–FST. The QST of the SR was generally significantly higher than the FST at various latitudes, suggesting that natural selection has played a comparatively larger role in shaping the observed variation compared with genetic drift. The minimum relative humidity, average temperature, and geographic distance were the main environmental factors shaping local adaptation in M. azedarach.
5. Conclusions
Growth traits significantly varied with latitude and longitude in M. azedarach. The QST of traits was calculated using a common garden experiment with a half-sib design. The QST was significantly correlated with climate and geographic factors in all years. An analysis of the SSRs revealed significant population genetic differentiation. The survival rate was significantly affected by the population genetic differentiation, and patterns of local adaptation were affected by the minimum relative humidity, average temperature, and geographic distance. Generally, QST–FST comparisons are effective for clarifying patterns of local adaptation in M. azedarach.
Supplementary Materials
The following supporting information can be downloaded at: https://www.mdpi.com/article/10.3390/genes13111924/s1. Table S1. The information of 15 pair primers for SSR analysis; Table S2. Information and source of the 135 primers; Table S3. Tests of Hardy–Weinberg equilibrium at each SSR locus in each population; Table S4. Results of two-factor ANOVA analysis for provenance and family; Table S5. Qst matrix between populations for 30 traits; Table S6. Geographic distance matrix between populations; Table S7. The pearson correlation between Qst of traits and climate factors; Table S8. The original observed data of six phenotypic traits; Table S9. The mean values of original climate data and climate matrix.
Author Contributions
B.L. carried out the experiment, analyzed the data, and drafted the manuscript. X.C. initiated and coordinated the project. K.O., P.L. and C.L. participated in the trial setup and measured the growth traits. X.X. participated in data analysis and figure plotting. Q.Q. and W.Z. participated in DNA extraction and genotyping. H.L. managed the common garden experimental forests. All authors have read and agreed to the published version of the manuscript.
Funding
This research was funded by the department of education of the Guangdong province (2022KTSCX055), the Zhongkai University of Agriculture and Engineering (KA2005408A2), the Forestry Science and Technology Innovation Project in the Guangdong province (2011KJCX002, 2012KJCX002, 2013KJCX002), and the Natural Science Foundation of the Guandong province (2018A030310156, 2019A151011137).
Institutional Review Board Statement
Not applicable.
Informed Consent Statement
Not applicable.
Data Availability Statement
Not applicable.
Acknowledgments
We thank Xinsheng Hu for discussing some key point for this paper in the initial time, and thank TopEdit (www.topeditsci.com, accessed on 18 September 2022) for linguistic assistance during the preparation of this manuscript.
Conflicts of Interest
The authors declare no conflict of interest.
References
- Chen, S.K. Meliaceae. Flora Reipublicae Popularis Sinicae; Chen, C., Chang, H., Miau, R., Hsu, T., Eds.; Science Press: Beijing, China, 1997; Volume 43, pp. 99–103. (In Chinese) [Google Scholar]
- Peng, H.; David, J.M. Flora of China; Wu, Z., Peter, H.R., Eds.; Missouri Botanical Garden Press: St. Louis, MO, USA; Science Press: Beijing, China, 2008; pp. 130–131. [Google Scholar]
- Liao, B.; Wang, F.; Chen, L.; Li, P.; Ouyang, K.; Pian, R.; Liu, M.; Que, Q.; Zhou, X.; Xi, W.; et al. Population Structure and Genetic Relationships of Melia Taxa in China Assayed with Sequence-Related Amplified Polymorphism (SRAP) Markers. Forests 2016, 7, 81. [Google Scholar] [CrossRef]
- Sivaraj, I.; Nithaniyal, S.; Bhooma, V.; Senthilkumar, U.; Parani, M. Species delimitation of Melia dubia Cav. from Melia azedarach L. complex based on DNA barcoding. Botany 2018, 96, 329–336. [Google Scholar] [CrossRef]
- Nethmini, N.A.N.; Kim, M.S.; Chathuranga, K.; Ma, J.Y.; Kim, H.; Lee, J.-S. Melia azedarach extract exhibits a broad spectrum of antiviral effect in vitro and in vivo. J. Biomed. Transl. Res. 2020, 21, 125–136. [Google Scholar] [CrossRef]
- Zhang, Y.; Tang, C.P.; Ke, C.Q.; Yao, S.; Ye, Y. Limonoids and triterpenoids from the stem bark of Melia toosendan. J. Nat. Prod. 2010, 73, 664–668. [Google Scholar] [CrossRef] [PubMed]
- Wang, H.; Dong, H.Y.; He, Q.M.; Liang, J.L.; Zhao, T.; Zhou, L. Characterization of limonoids isolated from the fruits of Melia toosendan and their antifeedant activity against Pieris rapae. Chem. Biodivers. 2020, 17, e1900674. [Google Scholar] [CrossRef]
- Clausen, J.; Keck, D.D.; Hiesey, W.M. Regional differentiation in plant species. Am. Nat. 1941, 75, 231–250. [Google Scholar] [CrossRef]
- Williams, G.C. Natrual seicetion costs of reproduction and a refinement of lack principle. Am. Nat. 1966, 100, 687–690. [Google Scholar] [CrossRef]
- Kawecki, T.J.; Ebert, D. Conceptual issues in local adaptation. Ecol. Lett. 2004, 7, 1225–1241. [Google Scholar] [CrossRef]
- Blanquart, F.; Gandon, S.; Nuismer, S.L. The effects of migration and drift on local adaptation to a heterogeneous environment. J. Evol. Biol. 2012, 25, 1351–1363. [Google Scholar] [CrossRef] [PubMed]
- Hoban, S.; Kelley, J.L.; Lotterhos, K.E.; Antolin, M.F.; Bradburd, G.; Lowry, D.B.; Poss, M.L.; Reed, L.K.; Storfer, A.; Whitlock, M.C. Finding the Genomic Basis of Local Adaptation: Pitfalls, Practical Solutions, and Future Directions. Am. Nat. 2016, 188, 379–397. [Google Scholar] [CrossRef]
- Lind, B.M.; Menon, M.; Bolte, C.E.; Faske, T.M.; Eckert, A.J. The genomics of local adaptation in trees: Are we out of the woods yet? Tree Genet. Genomes 2018, 14, 1–30. [Google Scholar] [CrossRef]
- Platt, A.; Gugger, P.F.; Pellegrini, M.; Sork, V.L. Genome-wide signature of local adaptation linked to variable C p G methylation in oak populations. Mol. Ecol. 2015, 24, 3823–3830. [Google Scholar] [CrossRef] [PubMed]
- Oleksyk, T.K.; Smith, M.W.; O’Brien, S.J. Genome-wide scans for footprints of natural selection. Philos. Trans. R. Soc. B Biol. Sci. 2010, 365, 185–205. [Google Scholar] [CrossRef]
- Kubota, S.; Iwasaki, T.; Hanada, K.; Atsushi, J.N.; Fujiyama, A.; Toyoda, A.; Sugano, S.; Suzuki, Y.; Hikosaka, K.; Ito, M.; et al. A genome scan for genes underlying microgeographic-scale local adaptation in a wild Arabidopsis species. PLoS Genet. 2015, 11, e1005361. [Google Scholar]
- Allard, A.; Bink, M.C.; Martinez, S.; Kelner, J.-J.; Legave, J.-M.; di Guardo, M.; Di Pierro, E.A.; Laurens, F.; van de Weg, E.W.; Costes, E. Detecting QTLs and putative candidate genes involved in budbreak and flowering time in an apple multiparental population. J. Exp. Bot. 2016, 67, 2875–2888. [Google Scholar] [CrossRef] [PubMed]
- Ågren, J.; Oakley, C.G.; McKay, J.K.; Douglas, W. SchemskeAuthors Info & Affiliations Genetic mapping of adaptation reveals fitness tradeoffs in Arabidopsis thaliana. Proc. Natl. Acad. Sci. USA 2013, 110, 21077–21082. [Google Scholar]
- Goto, S.; Kajiya-Kanegae, H.; Ishizuka, W.; Kitamura, K.; Ueno, S.; Hisamoto, Y.; Kudoh, H.; Yasugi, M.; Nagano, A.J.; Iwata, H. Genetic mapping of local adaptation along the altitudinal gradient in Abies sachalinensis. Tree Genet. Genomes 2017, 13, 1–13. [Google Scholar] [CrossRef]
- Kujala, S.T.; Knürr, T.; Kärkkäinen, K.; Neale, D.B.; Sillanpää, M.J.; Savolainen, O. Genetic heterogeneity underlying variation in a locally adaptive clinal trait in Pinus sylvestris revealed by a Bayesian multipopulation analysis. Heredity 2017, 118, 413–423. [Google Scholar] [CrossRef]
- de Villemereuil, P.; Gaggiotti, O.E.; Mouterde, M.; Till-Bottraud, I. Common garden experiments in the genomic era: New perspectives and opportunities. Heredity 2016, 116, 249–254. [Google Scholar] [CrossRef]
- Namkoong, G. Introduction to Quantitative Genetics in Forestry; Department of Agriculture, Forest Service: Washington, DC, USA, 1979.
- Shen, X.; Chen, X. Variation in adaptation and growth as indicated by provenance trial Platycladus orientalis (L.) Franco. In Genetic Response of Forest Systems to Changing Environmental Conditions; Springer: Dordrecht, The Netherlands, 2001; pp. 51–61. [Google Scholar] [CrossRef]
- Cooper, H.F.; Grady, K.C.; Cowan, J.A.; Best, R.J.; Allan, G.J.; Whitham, T.G. Genotypic variation in phenological plasticity: Reciprocal common gardens reveal adaptive responses to warmer springs but not to fall frost. Glob. Chang. Biol. 2019, 25, 187–200. [Google Scholar] [CrossRef]
- McKown, A.D.; Klápště, J.; Guy, R.D.; El-Kassaby, Y.A.; Mansfield, S.D. Ecological genomics of variation in bud-break phenology and mechanisms of response to climate warming in Populus trichocarpa. New Phytol. 2018, 220, 300–316. [Google Scholar] [CrossRef]
- Lu, C.; Chen, J.B.; Liang, J.; Guo, D.Q.; Xiang, D.Y. Genetic Variation and Selection of Growth Traits in Eucalyptus dunnii Provenances Plantation. Guangxi For. Sci. 2018, 47, 18–23. [Google Scholar]
- Wang, H.; Malcolm, D.C.; Fletcher, A.M. Pinus caribaea in China: Introduction, genetic resources and future prospects. For. Ecol. Manag. 1999, 117, 1–15. [Google Scholar] [CrossRef]
- Matyas, C. Modeling climate change effects with provenance test data. Tree Physiol. 1994, 14, 797–804. [Google Scholar] [CrossRef] [PubMed]
- De Frenne, P.; Graae, B.J.; Rodríguez-Sánchez, F.; Kolb, A.; Chabrerie, O.; Decocq, G.; De Kort, H.; De Schrijver, A.; Diekmann, M.; Eriksson, O. Latitudinal gradients as natural laboratories to infer species’ responses to temperature. J. Ecol. 2013, 101, 784–795. [Google Scholar] [CrossRef]
- Thomann, M.; Imbert, E.; Engstrand, R.C.; Cheptou, P.-O. Contemporary evolution of plant reproductive strategies under global change is revealed by stored seeds. J. Evol. Biol. 2015, 28, 766–778. [Google Scholar] [CrossRef] [PubMed]
- Sanz, R.M.; Santos-Del-Blanco, L.; Notivol, E.; Chambel, M.R.; Martín, R.S.; Climent, J. Disentangling plasticity of serotiny, a key adaptive trait in a Mediterranean conifer. Am. J. Bot. 2016, 103, 1582–1591. [Google Scholar] [CrossRef] [PubMed]
- Becker, U.; Colling, G.; Dostál, P.; Jakobsson, A.; Matthies, D. Local adaptation in the monocarpic perennial Carlina vulgaris at different spatial scales across Europe. Oecologia 2006, 150, 506–518. [Google Scholar] [CrossRef]
- Ramírez-Valiente, J.A.; Etterson, J.R.; Deacon, N.J.; Cavender-Bares, J. Evolutionary potential varies across populations and traits in the neotropical oak Quercus oleoides. Tree Physiol. 2019, 39, 427–439. [Google Scholar] [CrossRef] [PubMed]
- Xu, L.; Liu, J.; Zhang, Z.; Yu, F.; Guo, J.; Yue, H. Effect of salt stress on growth and physiology in Melia azedarach seedlings of six provenances. Int. J. Agric. Biol. 2018, 20, 471–480. [Google Scholar] [CrossRef]
- Chauhan, S.K.; Dhakad, A.K.; Sharma, R. Growth dynamics of different half-sib families of Melia azedarach Linn. PLoS ONE 2018, 13, e0207121. [Google Scholar] [CrossRef]
- He, X.; Liao, B.Y.; Wang, F.; Chen, L.J.; Que, Q.M.; Chen, X.Y. Geographic variations in growth traits of different Melia azedarach provenances in the young forest period. J. South. China Agric. Univ. 2016, 37, 75–81. [Google Scholar]
- Zhu, Q.; Liao, B.-Y.; Li, P.; Li, J.-C.; Deng, X.-M.; Hu, X.-S.; Chen, X.-Y. Phylogeographic pattern suggests a general northeastward dispersal in the distribution of Machilus pauhoi in South China. PLoS ONE 2017, 12, e0184456. [Google Scholar] [CrossRef] [PubMed]
- Wright, S. The genetical structure of populations. Ann. Eugen. 1951, 15, 323–354. [Google Scholar] [CrossRef] [PubMed]
- Spitze, K. Population structure in Daphnia obtusa: Quantitative genetic and allozymic variation. Genetics 1993, 135, 367–374. [Google Scholar] [CrossRef]
- Wang, F.; Liao, B.Y.; Li, P.; Liu, M.Q.; Li, J.C.; Wu, L.Y.; Lin, W.; Chen, X.Y. Optimization of SSR-PCR reaction system and primer screening of Melia azedarach. For. Res. 2016, 29, 167–175. [Google Scholar]
- Ahmad, Z.; Mumtaz, A.S.; Nisar, M.; Khan, N. Diversity analysis of chickpea (Cicer arietinum L.) germplasm and its implications for conservation and crop breeding. Agric. Sci. 2012, 03, 723–731. [Google Scholar] [CrossRef][Green Version]
- Merila, J.; Crnokrak, P. Comparison of genetic differentiation at marker loci and quantitative traits. J. Evol. Biol. 2001, 14, 892–903. [Google Scholar] [CrossRef]
- Gilbert, K.J.; Whitlock, M.C. QST–FST comparisons with unbalanced half-sib designs. Mol. Ecol. Resour. 2015, 15, 262–267. [Google Scholar] [CrossRef] [PubMed]
- Patterson, H.D.; Thompson, R. Recovery of inter-block information when block sizes are unequal. Biometrika 1971, 58, 545–554. [Google Scholar] [CrossRef]
- Henderson, C.R. A simple method for unbiased estimation of variance components in the mixed mode. J. Anim. Sci. 1980, 58, 119. [Google Scholar]
- Van Oosterhout, J.J.; Bodasing, N.; Kumwenda, J.J.; Nyirenda, C.; Mallewa, J.; Cleary, P.R.; De Baar, M.P.; Schuurman, R.; Burger, D.M.; Zijlstra, E.E. Evaluation of antiretroviral therapy results in a resource-poor setting in Blantyre, Malawi. Trop. Med. Int. Health 2005, 10, 464–470. [Google Scholar] [CrossRef] [PubMed]
- Smouse, P.E.; Whitehead, M.R.; Peakall, R. An informational diversity framework, illustrated with sexually deceptive orchids in early stages of speciation. Mol. Ecol. Resour. 2015, 15, 1375–1384. [Google Scholar] [CrossRef]
- Rousset, F. genepop’007: A complete re-implementation of the genepop software for Windows and Linux. Mol. Ecol. Resour. 2008, 8, 103–106. [Google Scholar] [CrossRef]
- Nei, M. Genetic Distance between Populations. Am. Nat. 1972, 106, 283–292. [Google Scholar] [CrossRef]
- Takezaki, N.; Nei, M.; Tamura, K. POPTREE2: Software for Constructing Population Trees from Allele Frequency Data and Computing Other Population Statistics with Windows Interface. Mol. Biol. Evol. 2010, 27, 747–752. [Google Scholar] [CrossRef] [PubMed]
- Shriver, M.D.; Jin, L.; Boerwinkle, E.; Deka, R.; Ferrell, R.E.; Chakraborty, R. A novel measure of genetic distance for highly polymorphic tandem repeat loci. Mol. Biol. Evol. 1995, 12, 914–920. [Google Scholar] [PubMed]
- Pritchard, J.K.; Stephens, M.; Donnelly, P. Inference of population structure using multilocus genotype data. Genetics 2000, 155, 945–959. [Google Scholar] [CrossRef] [PubMed]
- Earl, D.A.; von Holdt, B.M. Structure harvester: A website and program for visualizing structure output and implementing the Evanno method. Conserv. Genet. Resour. 2012, 4, 359–361. [Google Scholar] [CrossRef]
- Rousset, F. Genetic Differentiation and Estimation of Gene Flow from F-Statistics Under Isolation by Distance. Genetics 1997, 145, 1219–1228. [Google Scholar] [CrossRef]
- O’Hara, R.B.; Merila, J. Bias and precision in Q ST estimates: Problems and some solutions. Genetics 2005, 171, 1331–1339. [Google Scholar] [CrossRef] [PubMed]
- He, X.; Deng, C.; Yang, J.Q.; Zhang, D.; ZM, J.; Liao, B.Y.; Wang, F.; Chen, X.Y. Geographic variation of growth traits in early stage for Melia azedarach among different Provenances. J. Beijing For. Univ. 2018, 40, 45–54. [Google Scholar] [CrossRef]
- He, X.; Li, J.; Wang, F.; Zhang, J.; Chen, X. Variation and Selection of Melia azedarach Provenances and Families. J. Northeast For. Univ. 2019, 47, 1–7. [Google Scholar]
- Liao, B.Y. Studies on Geographic Variation and Genetic Diversity of Chinese Populations of Melia azedarach L. Germplasm Resources; South China Agricultural University: Guangzhou, China, 2016. [Google Scholar]
- Cui, Y.D.; Fu, Z.X.; Wang, J.H.; Guo, S.P. Provenance experiment for study of chinaberry. Henan For. Technol. 1994, 6, 14–16. (In Chinese) [Google Scholar]
- Cheng, S.M.; Gu, W.C. The phenological division of distribution area in China for Melia azedarch. Sci. Silva Sin. 2005, 41, 186–191. [Google Scholar]
- Syamsuwida, D.; Palupi, E.R.; Siregar, I.Z.; Indrawan, A. Flower Initiation, Morphology, and Developmental Stages of Flowering-Fruiting of Mindi (Melia azedarach L). J. Manaj. Hutan Trop. (J. Trop. For. Manag. 2012, 18, 10–17. [Google Scholar] [CrossRef]
- Fu, Q.Y.L. Mummified Fruit and Seed Fossils Study from Nanning Basin of Guangxi in Late Oligocene; Sun Yat-Sen University: Guangzhou, China, 2019. [Google Scholar]
- Pigg, K.B.; DeVore, M.D.; Benedict, J.C. Fruits of Melia (Meliaceae, Melioideae) from the Middle Miocene Yakima Canyon Flora of Central Washington State, USA. In Paleobotany and Biogeography: A festschrift for Alan Graham in his 80th Year; MGBP: St. Louis, MO, USA, 2014; pp. 326–337. [Google Scholar]
- Grote, P.J. Studies of a flora from the Pleistocene of northeastern Thailand. In Advances in Mesozoic and Cenozoic Paleobotany; Jarzen, D.M., Retallack, G., Jarzen, S., Manchester, S.R., Eds.; Courier Forschungsinstitut Senckenberg: Frankfurt am Main, Germany, 2007; Volume 258, pp. 171–182. [Google Scholar]
- Czeczott, H.; Skirgiełło, A.; Zalewska, Z. Flora Kopalna Turowa Koło Bogatyni; Prace Muzeum Ziemi: Warsaw, Poland, 1961; Volume 4, pp. 1–117. [Google Scholar]
- Kong, Z.C.; Du, N.Q.; Zhang, Y.J.; Wang, F.B.; Liang, Y.L.; Wang, X.C. Discovery of Helicia fossil florule and sporopollen assemblage of Baohuashan in Jurong conuntry and its climatic and botanic significance. Quat. Sci. 1991, 11, 328–337. [Google Scholar]
- Chen, L.J.; Deng, X.M.; Ding, M.M.; Liu, M.Q.; Li, J.C.; Hui, W.K.; Liao, B.Y.; Chen, X.Y. Geographic variation in traits of fruit stones and seeds of Melia azedarach. J. Beijing For. Univ. 2014, 36, 15–20. [Google Scholar]
Publisher’s Note: MDPI stays neutral with regard to jurisdictional claims in published maps and institutional affiliations. |
© 2022 by the authors. Licensee MDPI, Basel, Switzerland. This article is an open access article distributed under the terms and conditions of the Creative Commons Attribution (CC BY) license (https://creativecommons.org/licenses/by/4.0/).