Article

Structural and Functional Heat Stress Responses of Chloroplasts of Arabidopsis thaliana

1
Department of Biosciences, Molecular Cell Biology of Plants, Goethe University, 60438 Frankfurt am Main, Germany
2
Molecular Systems Biology (MOSYS), Department of Functional and Evolutionary Ecology, University of Vienna, 1090 Vienna, Austria
3
Vienna Metabolomics Center (VIME), University of Vienna, 1090 Vienna, Austria
4
Frankfurt Institute of Advanced Studies (FIAS), D-60438 Frankfurt am Main, Germany
*
Author to whom correspondence should be addressed.
Current address: Department of Agronomy and Horticulture, University of Nebraska, Lincoln, NE 68588, USA.
Current address: Institute for Integrative Biology of the Cell (I2BC), CEA, CNRS, Université Paris-Saclay, 91198 Gif-sur-Yvette, France.
Genes 2020, 11(6), 650; https://doi.org/10.3390/genes11060650
Submission received: 18 May 2020 / Revised: 4 June 2020 / Accepted: 8 June 2020 / Published: 12 June 2020
(This article belongs to the Special Issue Heat Stress Response in Plants)

Abstract

:
Temperature elevations constitute a major threat to plant performance. In recent years, much was learned about the general molecular mode of heat stress reaction of plants. The current research focuses on the integration of the knowledge into more global networks, including the reactions of cellular compartments. For instance, chloroplast function is central for plant growth and survival, and the performance of chloroplasts is tightly linked to the general status of the cell and vice versa. We examined the changes in photosynthesis, chloroplast morphology and proteomic composition posed in Arabidopsis thaliana chloroplasts after a single or repetitive heat stress treatment over a period of two weeks. We observed that the acclimation is potent in the case of repetitive application of heat stress, while a single stress results in lasting alterations. Moreover, the physiological capacity and its adjustment are dependent on the efficiency of the protein translocation process as judged from the analysis of mutants of the two receptor units of the chloroplast translocon, TOC64, and TOC33. In response to repetitive heat stress, plants without TOC33 accumulate Hsp70 proteins and plants without TOC64 have a higher content of proteins involved in thylakoid structure determination when compared to wild-type plants.

1. Introduction

The maintenance of cellular homeostasis depends on a multitude of cellular processes, which ensures cellular and organismic survival [1]. Among others, the balancing and reprogramming of protein levels and composition is essential, which includes protein synthesis, folding, turnover and maintenance [2,3,4]. Equally important is the proper distribution of proteins within cells and their insertion into the destined compartments [5,6,7,8], which is either mediated by specialized translocon components within membranes or by vesicle transport [9,10]. Today, it is established that specific mechanisms that control the functional state of an organelle are interlinked with these translocation paths [11,12,13,14]. On the one hand, this is of particular importance considering that organelles such as chloroplasts employ thousands of different proteins synthesized in the cytosol to perform fundamental processes such as photosynthesis, amino acid, and lipid biosynthesis [15]. On the other hand, protein homeostasis and distribution in plant cells is sensitive to environmental changes [16,17,18]. For instance, temperature changes are known to affect multiple aspects of cellular homeostasis, including the regulation and distribution of proteins in cellular sub-compartments [19,20]. In general, the effect of heat stress (HS) on the proteome of whole tissues or organs has been well documented [21,22,23,24,25]. In addition, first insights were obtained into the organellar proteins in response to the HS of chloroplasts [19,26].
Chloroplasts are semi-autonomous organelles of endosymbiotic origin, and most chloroplast proteins are synthesized in the cytosol and transported across the chloroplast envelope membranes [27]. The general effect of HS on the functional properties of chloroplasts is well established [28,29,30]. For example, the inhibition of the carbon assimilation system [31], the over-reduction of the plastidic electron transport chain that results in enhanced reactive oxygen species (ROS) production [26,32], as well as the reduction of Rubisco activase activity [31], all lead to a reduction in photosynthesis under stress condition [33]. The functional adaptation is accompanied by changes in the morphological features of chloroplasts. It has been established that HS induces changes in the macroscopic structure of chloroplasts [34,35] and the reorganization of thylakoid membranes [36]. However, the effects of short and repetitive HS have not been documented for the structure and function of the chloroplasts.
Furthermore, it has been shown that translocation capacity and complex composition of the chloroplasts translocon is negatively affected upon HS exposure [37]. Moreover, chloroplasts’ precursor proteins accumulate in the cytosol upon HS [38]. This indicates the involvement of chaperones in protein transport to the surface of the chloroplast [39]. Thus, HS appears to affect the protein translocation event and indirectly modulate the translocation efficiency by pre-protein aggregation, or at least accumulation in the cytoplasm.
The translocon of the outer membrane of the chloroplasts (TOC) has four central components [5,6,9,12,27]. While three form the so-called core complex for translocation providing the final precursor protein receptor sides and the translocon [5,6], the fourth component, TOC64 (TOC component of 64 kDa), is discussed to provide a chaperone platform [40,41,42,43]. Its impact on protein translocation is regulatory, as a mutant lacking TOC64 function does not show a significant reduction of protein translocation efficiency on its own [44,45], but in conjunction with a mutant of the precursor protein receptor component TOC33 (TRANSLOCASE OF CHLOROPLAST 33) of the TOC core complex annotated as ppi1 [43]. However, the importance of the chaperone system for HS response reaction [46,47,48] renders TOC64 an exciting candidate for the integration of HS regulation and protein translocation. The interaction of TOC64 with chaperones depends on a so-called tetratricopeptide repeat (TPR) [41,49,50]. This domain recognizes the C-terminus of HSP90 (HEAT SHOCK PROTEIN 90) and HSP70 (HEAT SHOCK PROTEIN 70) chaperones [41] with a dissociation constant of about 200 µM [51], while the dissociation constant of the interaction between full-length TOC64 and full-length chaperones is in the range of about 2-15 µM [52]. The regulation of this interaction might depend on the recognition of auxin derivatives [42] or phosphorylation as established for the mitochondrial localized paralogue [53]. The latter, however, has not yet been established for the chloroplast localized form.
Here, we investigated the effect of HS on chloroplasts structure and function. For this, we considered wild-type Arabidopsis thaliana (Col-0) plants (WT), a toc64-III mutant [43] and a mutant of the TOC core complex component TOC33, ppi1 [54]. The plants were exposed to HS either once (HS-I; single term) or repeatedly (HS-II; repetitive). The latter was considered foreseeing the frequent episodes of HS in nature [55]. We observed that physiological parameters, including chlorophyll content and photosynthetic activity as well as chloroplasts ultrastructure, were altered in the mutants compared to wild-type plants under control conditions as well as under the two HS regimes. Moreover, significant alterations in the proteomes of mutants and wild-type plants were detected under control as well as under different heat stress regimes. Considering these obtained results, both WT and the mutant plant lines exposed to regular episodes of HS (HS-II) performed better compared to the plants exposed to HS only once (HS-I), thereby signifying that plants modulate structural and functional features of chloroplasts to acclimatize under regular episodes of HS.

2. Materials and Methods

2.1. Plant Material and Stress Treatment

A. thaliana wild-type (Col-0), ppi1, and toc64-III-1 plants [43,55] were grown for one week under an 8/16 h day/night cycle (21/18 °C). All cotyledons were fully opened. Plants were either kept under control conditions for the next 14 days (C), exposed to a single heat-stress on day 7 (HS-I: 42 °C for 2 h) and subsequently incubated as under control conditions for 14 days (single HS treatment), or every alternate day from day 7 onwards for the next 14 days (HS-II: 42 °C for 2 h; repetitive/periodic/repeatedly HS, Figure 1). After the treatment, all plants had > 6 rosette leaves and > 20% of the final rosette diameter, but inflorescence did not yet emerge. Plants treated with the respective conditions were used to analyze physiological parameters and proteomics at the time point of harvesting.

2.2. Measurement of Chlorophyll and Photosynthetic Activity

The measurement of chlorophyll and photosynthetic activity (actinic light: 134 µmol m2 s1) of wild-type and mutant plant lines was performed as defined before [43,56]. For measuring chlorophyll content, at least three plants (biological replicas) were used to calculate means (± SD) and statistical analysis was done using analysis of variance (ANOVA) and two-sided Student’s t-test. For the quantum yield, at least four plants (two biological replicas) with at least two areas of interest each were used to calculate means (± SD). Furthermore, a two-sided dependent samples t-test was used to compare the pairs of time points between two conditions or genotypes.

2.3. Analysis of Chloroplast Ultrastructure by Transmission Electron Microscopy

The leaves of wild-type and mutant plants were harvested, cut into 2–3-mm pieces, and fixed in 4% (v/v) glutaraldehyde in 50 mM Na-cacodylate buffer pH 7.4 for 2 h at room temperature. After washing, the ‘post-fixation step’ was performed in 1% (w/v) OsO4 in the same buffer at room temperature for 2 h. The samples were washed and dehydrated in a graded series of aqueous ethanol solutions (30–90%, v/v) followed by three changes in 100% ethanol and two changes in propylene oxide for 30 min at each step. Afterwards, samples were infiltrated in a graded series of epoxy resin (Araldite CY212, Agar Scientific, Stansted, UK) in propylene oxide- ratio 2:1 and 1:1 (v/v), each for 2 h. The samples were then transferred through two changes of 100% embedding medium, each for 3 h. The samples were kept in fresh 100% embedding medium, and the polymerization of specimens was performed in molds at 65 °C for 48 h. Ultrathin (50 nm) sections were made using a diamond knife with ultra-microtome and collected on copper grids. The sections were stained in 2% w/v uranyl acetate for 15 min, followed by 10 min of staining in Reynold’s lead citrate [56,57]. Transmission electron micrographs were taken on a Philips CM12 Transmission Electron Microscope operated at an accelerating voltage of 80 kV. Digital images were obtained using a Gatan Erlangshen ES500W (model 782) CCD camera (Pleasanton, CA, USA).

2.4. Isolation of Chloroplasts

The isolation of chloroplasts was performed as previously described [58]. Briefly, 21-day-old A. thaliana plants (WT and mutants) corresponding to each of the temperature regime (control, HS-I, and HS-II) were dark-adapted for half an hour before chloroplasts isolation. The isolation procedure was carried out at 4 °C. Three biological replicates of leaves from of 50 plant each were processed. Leaves were pooled and grounded using Ultra Turrax homogenizer in the isolation buffer (Sorbitol: 450 mM, Tricin: 20 mM and pH 8.4, magnesium chloride hexahydrate: 5 mM, EDTA: 10 mM, sodium bicarbonate: 5 mM). The homogenate was then passed through filtrate and centrifuged at 1500× g for 5 min. The pellet thus obtained was re-suspended in wash buffer (Sorbitol: 300 mM, Tricin: 20 mM and pH 7.6; magnesium chloride hexahydrate: 5 mM, EDTA: 2.5 mM). The suspended pellet was loaded onto a percoll gradient (top: 45% and bottom: 85%; Sorbitol: 300 mM, Tricin: 20 mM and pH 7.6; magnesium chloride hexahydrate: 5 mM and percoll) and spun at 10,000× g for 10 min. Then, the topmost layer was removed using the suction pressure to obtain middle green layer having intact chloroplasts. The intact chloroplasts were washed twice with the wash buffer and the pellet was finally suspended in 300 µL wash buffer. For protein extraction, isolated chloroplasts were dissolved in sodium-dodecyl-sulfate (SDS) buffer, and protein concentration of the samples was measured using amido black [59].

2.5. Shotgun Proteomics (GEL-LC-Orbitrap-MS)

Proteomics analysis of the isolated chloroplasts was performed as described before [60,61]. Pre-fractionation of the proteins was carried out by SDS-PAGE [60]. Fourty micrograms of total protein was loaded onto a gel and run for 1.5 cm. The gels were fixed and stained with in methanol:acetic acid:water:Coomassie brilliant blue R-250 (40:10:50:0.001), destained in methanol:water (40:60) and then each lane was divided into two fractions. Furthermore, the gel pieces were destained, equilibrated and digested with trypsin, desalted and concentrated according to [60]. A total of 10 μg of digested protein was injected (three technical replicates) into a one-dimensional (1D) nano-flow LC–MS/MS system equipped with a pre-column (C18, Eksigent, Redwood City, CA, USA). Peptides were eluted using a Ascentis column (Ascentis Express, peptide ES-C18 HPLC column (SUPELCO Analytical, Bellefonte, PA, USA), dimension 15 cm × 100 μm, pore size 2.7 μm) during an 80 min gradient from 5% to 50% (v/v) acetonitrile, 0.1% (v/v) formic acid. MS analysis was performed on an Orbitrap LTQ XL mass spectrometer (Thermo, Dreieich, Germany) with a controlled flow rate of 500 nl per minute. The specific tune settings for the MS were as follows: spray voltage was set to 1.8 kV; temperature of the heated transfer capillary was set to 180 °C. Each full MS scan was followed by ten MS/MS scans, in which the ten most abundant peptide molecular ions were dynamically selected, with a dynamic exclusion window set to 90 s. Dependent fragmentation was performed in collision-induced dissociation (CID) mode, with a normalized collision energy of 35, an isolation window of 1.0, an activation Q of 0.250 and a 30-ms activation time. Ions with a + 1 or unidentified charge state in the full MS were omitted from MS/MS analysis.

2.6. Quantitative Analysis of the Proteome

Label-free quantification (LFQ) of proteins was performed as previously described [62]. Acquired spectra were processed using MaxQuant version 1.6.12.0 [63]. For database searches against the Araport 11 database, the precursor mass tolerance was set to 20 ppm for the first search and 4.5 ppm for the main searches. Trypsin/P was chosen as the enzyme with two missed cleavages allowed. Oxidation of methionine and protein N-terminal acetylation were defined as variable modifications, and carbamidomethylation of cysteine was defined as a fixed modification. The minimum peptide length was set to seven amino acids. The LFQ intensities for the detected protein groups were used and zero values adjusted to the lowest LFQ value (> 0) to determine the minimal fold change of abundance. Further details are in the text. For the functional assignment, we used MapMan [64] and TAIR10 [65]. If not otherwise noted, protein localization was extracted from the subcellular localisation database for Arabidopsis proteins (SUBA) [66]. The data for Table 1 and Table 2 were processed with custom R scripts (Supplemental File S1) and manually filtered for proteins localized to chloroplasts (see Supplementary Material). All graphs were processed with SigmaPlot, and further information was extracted from the literature.

3. Results

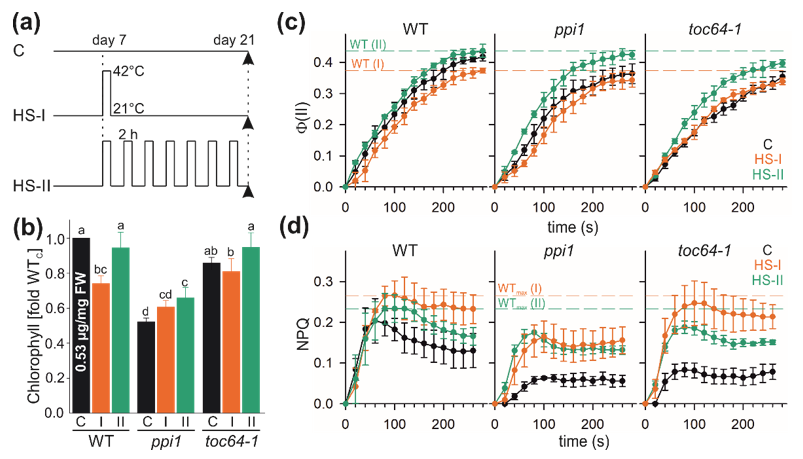
3.1. Heat Stress Alters Chlorophyll Content and Photosynthetic Performance

Previous studies inspecting the impact of heat stress (HS) on the performance of chloroplasts have focused either on a single or repetitive HS treatment [19,26,37,67]. However, considering the current climate change forecasts [55], we designed an experimental set-up where plants, after the initial germination and growth for 7 days, were treated with HS either once (HS-I, Figure 1a) or every alternate day until day 21 (HS-II). All three A. thaliana lines, wild type (A. thaliana Col-0), ppi1, and toc64-III-1 (toc64-1 hereafter) were exposed to these conditions.
As previously established, the wild-type plants grown under control conditions showed the highest chlorophyll content, while ppi1 displayed the lowest (Figure 1b, [43]). The latter is consistent with the pale phenotype of ppi1 [54]. After single HS (HS-I), chlorophyll content in the wild type was significantly reduced when compared to untreated plants (Figure 1b). In contrast, HS-I application yielded no significant change of the chlorophyll content in ppi1 or toc64-1 when compared to control conditions (Figure 1b). Remarkably, the chlorophyll content after the repetitive HS treatment (HS-II) of plants, irrespective of the genotype, was higher relative to HS-I (Figure 1b). In wild-type and toc64-1 plants, the chlorophyll content after the repetitive HS treatment (HS-II) reaches the levels of untreated wild-type plants, while in ppi1 plants it is significantly higher than in untreated plants.
We confirmed that both untreated mutants have a lower effective Photosystem II (PSII) quantum yield (Φ(II)) when compared to untreated wild-type plans (Figure 1c, black symbols). Moreover, we observed a higher quantum yield for all plants exposed to HS-II when compared to the plants exposed to HS-I (Figure 1c). However, in wild-type plants, the quantum yield after HS-II is comparable to the one observed for untreated plants, while, in both mutants, the quantum yield after HS-I is more comparable the one observed for the respective untreated genotype (Figure 1c).
We further analyzed non-photochemical quenching (NPQ) as a measure of the capacity of the plants to regulate and by that to protect photosystems when light absorption exceeds the capacity for light utilization [68]. For wild-type plants grown under normal conditions, NPQ rapidly rises to a maximum of the NPQ (Figure 1d, left, black symbols). Subsequently, the NPQ gradually decreases, which suggests that the photosystem adapts to high light conditions (Figure 1d, left, black symbols). Both mutants show a reduced NPQ, which indicates that the capacity to regulate the photosystems is reduced (Figure 1d, black symbols). After HS, the NPQ is enhanced in wild-type when compared to untreated plants, which can be interpreted as an adaptation to the stress condition (Figure 1d, left green and orange symbols). The two mutant lines also show an enhanced NPQ after HS treatment when compared to the respective genotype without treatment (Figure 1d). This suggests that HS induces the accumulation of protective molecules. However, ppi1 does not reach the maximal levels of the NPQ of wild-type plants after HS-I, while toc64-1 shows a comparable behavior of NPQ to the wild type (Figure 1d, orange symbols). In turn, after HS-II, both mutants do not reach the maximal NPQ level of the wild-type plants, while the steady-state level is comparable (Figure 1d, green symbols). Hence, while the chlorophyll content and the effective PSII quantum yield and the NPQ appear to be enhanced after HS-II in all genotypes, the NPQ in the mutants does not reach the wild-type level after this stress.

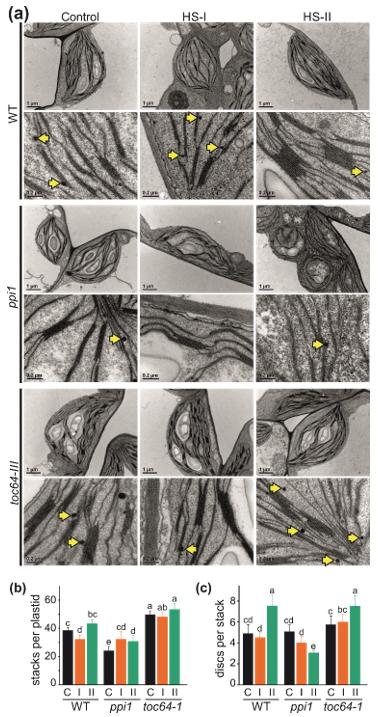
3.2. The Impact of Heat Stress on Chloroplasts Structure

The observed alterations of chlorophyll content and photosynthetic performance prompted the investigation of the ultrastructure of the chloroplasts (Figure 2a). Consistent with the previous studies [54,56], a reduced number of stacks per plastid were observed for ppi1 compared to wild-type plants under control conditions (Figure 2a,b, black bar). In contrast, the number of stacks is significantly higher in chloroplasts of toc64-1 leaves (Figure 2a,b, black bar). When plants were exposed to a single heat stress (HS-I), the number of stacks per chloroplasts is reduced in wild-type, not significantly altered in toc64-1, but enhanced in ppi1 to the number seen in wild-type for the particular condition (Figure 2a,b, orange bar). On the other hand, after repetitive HS treatment (HS-II), the stack number in wild-type and toc64-1 is similar to the chloroplasts from untreated plants, while the number is higher in ppi1 relative to untreated plants but lower than wild-type plants in HS-II (Figure 2a,b, green bar).
The number of stacks per disc is not significantly different between the three genotypes grown under standard conditions as well as HS-I treatment (Figure 2a,c, black and orange bar). After HS-II, we observed an increase of the discs per stack in wild-type and toc64-1, while the number is reduced in ppi1 (Figure 2a,c, green bar). It is further noticeable that the thylakoids of chloroplasts of ppi1 are billowy after application of HS-I (Figure 2a). The same is observed for chloroplasts of toc64-1 grown under control conditions or after HS-I, but not after HS-II (Figure 2a). Moreover, we realized an accumulation of plastoglobuli in this line after HS-II treatment (Figure 2a, yellow arrow).

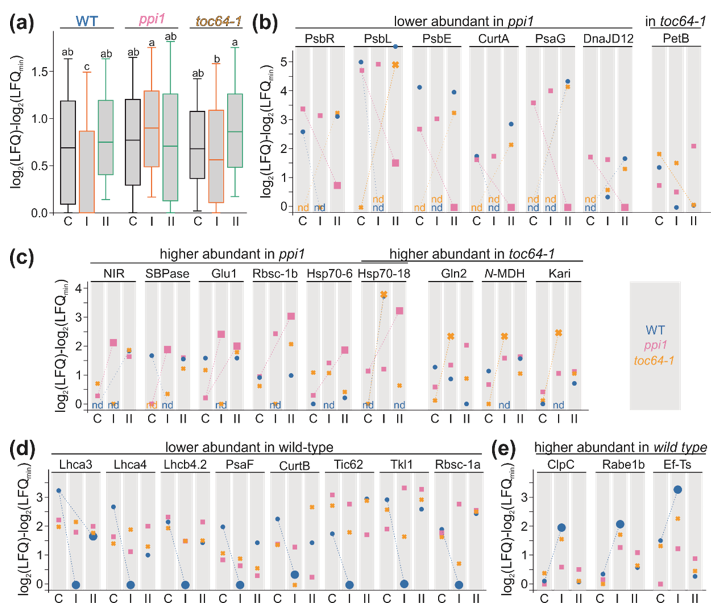
3.3. The Chloroplast Proteome of Wild-Type, ppi1, and toc64-1

Having assessed the physiological and morphological changes of chloroplasts after exposure to different HS regimes (Figure 1 and Figure 2), we analyzed their proteomic regulation. The proteomic analysis of all samples (3 genotypes and 3 growth conditions) yielded a total of about 800 different proteins considering proteins with a label-free quantification (LFQ) value > 0 in at least one condition (Figure 3a, Tables S1 and S2). According to data from SUBA [66], about 60% of the proteins are assigned as plastid localized (Figure 3a). Within the individual chloroplast fractions corresponding to different genotypes and treatments, the number of identified proteins varied between 140 and 440 with the lowest number of identifications in the wild-type background after HS-I (Figure 3a). The discovery of proteins assigned as plastid localized ranges from 90 to 323 (Figure 3a). The wide distribution of the LFQ values in different fractions justified a further analysis (Figure 3b). Only the values for the wild-type chloroplasts after HS-I might be overrated to a certain extent (Figure 3b).
At first, we analyzed the overlap of the untreated samples from different genotypes. We identified 152 proteins represented by 136 protein groups in all three control fractions. In total, 139 proteins (130 protein groups) thereof were assigned as plastid localized. The plastid localized proteins can be categorized as proteins involved in metabolic processes, protein synthesis (including transcription, translation, synthesis, and degradation), photosynthesis (photosystems, light-harvesting complexes (LHCs), photosystem assembly, and regulation) and others (general regulation, membrane proteins, and proteins of unknown functions; Figure 3c). Comparing the proteins found in all three genotypes, only a few exhibited higher (green) or lower abundance (orange) in the mutant lines (Figure 3c, Table 1). In ppi1, we found 18 proteins to be altered at least two-fold in their abundance and in toc64-1, 15 proteins with at least a two-fold change in abundance were detected relative to wild-type plants. The low number of proteins with altered abundance is expected as the ppi1 phenotype is most prevalent in the early growth stages [54,56] and the phenotype of toc64-1 is generally not very strong when plants are grown under standard conditions [41,43,44,45]. Two proteins showed a less abundance in both mutants (Table 1). The 2-Cys PrxB (AT5G06290; Table 1) is involved in the pathway for energy dissipation in photosynthesis and peroxide detoxification in the dark [69], and its functionality is related to the NPQ efficiency [70]. The thioredoxin M-type 1 (Trx-m1, AT1G03680, Table 1), downregulated in ppi1, is discussed to regenerate 2-Cys PrxB in the light [71] and to be involved in the biogenesis of PSII [72]. The second protein less abundant in both mutants is a component of the light-harvesting complex I, LHCa4 (AT3G47470, Table 1). However, LHCa1 (At3g54890) and LHCa2 (AT3G61470) were detected in all three chloroplast fractions as well but without drastic alterations between the mutant plant lines and wild-type plants. Only LHCa3 (AT1G61520) abundance is reduced in chloroplasts isolated from toc64-1 leaves, but not in chloroplasts isolated from the ppi1 background.
Only one protein, a component of the plastidic ribosome, is enhanced in the chloroplasts of the two mutants. Moreover, we found six proteins in toc64-1 and ppi1, but not in the wild type. HHL1 (AT1G67700) is involved in PSII protection from photo-damage [73], and RBD1 (AT1G54500) is required for establishing PSII function [74]. Moreover, Lil3.1 (AT4G17600) is described to be involved in the regulation of late events of chlorophyll biosynthesis [75]. Besides, the nitrite reductase NIR1 (AT2G15620), a protein likely acting as thioredoxin (AT5G03880) and an HSP70 family protein with plastidic localization (AT1G56410) were found in the chloroplasts of the two mutants, but not in wild-type chloroplasts.

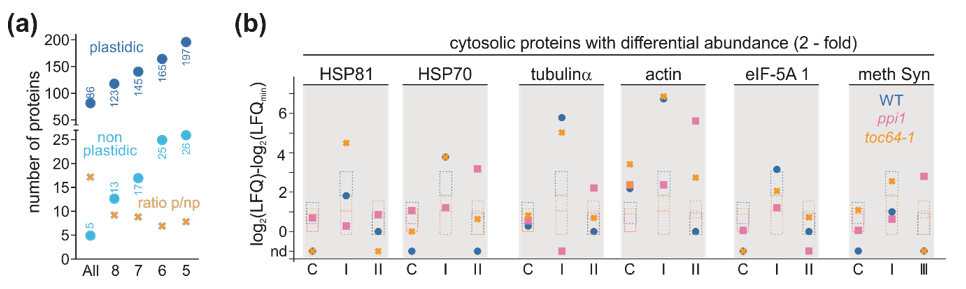
3.4. Proteome Changes in Response to Heat Stress

Focusing on the entire data set, we used only the proteins that were discovered in at least five independent experiments with an LFQ > 0 (Figure 4a). This number considers that proteins might only become abundant and detectable after heat treatment allowing one false negative discovery (FDR). According to the above-formulated criteria, 26 non-plastidic proteins corresponding to 16 protein groups were identified (Figure 4a). Seven of these groups are components of the endomembrane system, including vacuoles and peroxisomes, two are mitochondrial localized proteins, and one is a nuclear protein. These proteins are either highly abundant in cells (e.g., the Catalase 3, AT1G20620; the peroxisomal NAD-malate dehydrogenase 2, AT5G09660 or the lactate/malate dehydrogenase, AT1G53240 and AT3G15020) or integral membrane proteins (e.g., vacuolar ATP synthase subunit A, AT1G78900 or the water and ammonium transporter, AT3G16240). Thus, although it cannot be excluded that these proteins are dual localized, they are most likely contaminations resulting from the isolation procedure.
The remaining six groups constitute cytosolic proteins: HSP81, HSP70, actin, tubulin, methionine synthase, and translation initiation factor protein families. For the analysis of the abundance variation, we compared the abundance of the individual protein groups in one sample to the median of the abundance of all non-plastidic proteins considering that most of them are likely contaminants. HSP70 is accumulated in the chloroplast fraction of toc64-1 plants and wild-type plants after HS-I, and of ppi1 after repetitive HS treatment (HS-II, Figure 4b). Moreover, HSP81 exhibits higher abundance in the chloroplast sample of toc64-1 plants and wild-type plants after HS-I (Figure 4b). Tubulin-α shows a similar distribution as seen for HSP70, while actin appears to be generally more abundant (Figure 4b). In contrast, the identified eukaryotic translation initiation factor 5A-1 (AT1G26630) protein does not show an enrichment, and the methionine synthase (AT5G17920 and AT3G03780) is only higher more abundant than average in chloroplasts of ppi1 plants after HS-II (Figure 4b).
Next, we analyzed the plastidic proteins. To estimate the error of the change, we used all 197 plastidic proteins found in at least five independent discoveries, normalized the log2(LFQ) values for a given protein to the lowest log2(LFQ) value found for that protein and determined the median of the change with a 99% confidence interval value. From all observed values, the median was determined, resulting in 0.85 as the median of all changes and 0.7 as the limit for the 99% confidence of alteration from the median. Thus, for the subsequent analysis, only changes between two samples of at least Δlog2(LFQ) > 1.65 were discussed. Moreover, we determined the distribution of the log2(LFQ)-log2(LFQ)min of the selected proteins for each chloroplast fraction to judge whether the distribution is comparable. Statistical analysis revealed that all samples are comparable except for the wild type and toc64-1 after HS-I, which show significantly lower change values. Hence, for these two samples, a higher false-negative rate is expected, while, in comparison to these two probes, a higher false-positive rate is expected concerning these probes. Nevertheless, this analysis shows that a call for a change of Δlog2(LFQ) > 1.65 is consistent with the distribution.
After realizing that the protein abundance under control conditions is somewhat comparable in the different genotypes (Figure 3), we determined which protein was either decreased or increased by Δlog2(LFQ) > 1.65 in response to HS in a given genotype. In case of no detection, the value was considered to be the average of the value for the same condition in the other genotypes. By the above-described procedure, we detected 28 proteins in 27 protein groups assigned as plastidic in SUBA with altered abundance in response to heat stress. Global assignment revealed that nine are involved in metabolic processes, nine in the photosynthetic processes, seven in processes related to protein synthesis, two in general regulation and one in transport processes.
Three components of photosystem I, a protein involved in thylakoid structure determination (CurtA, AT4G01150 [76]), as well as PsaG and a plastid-targeted DnaJ protein (AT3G51140) are reduced in their abundance in ppi1 after HS-II (Figure 5b). It appears that all proteins except the DnaJ protein are highly abundant in chloroplasts isolated from toc64-1 and the wild type grown after the repetitive heat treatment (HS-II, Figure 5b), but are either not or only at low abundance detected in chloroplasts isolated from toc64-1 plants grown under normal conditions or HS-I (Figure 5b). In contrast, PetB is reduced in its abundance in toc64-1 after HS-II, while it is generally decreased in wild type after HS and even enhanced in ppi1 after HS-II (Figure 5b).
In ppi1, we detected a higher abundance for six proteins in chloroplasts isolated from plants after HS (Figure 5c). Here, the nitrite reductase NIR1 (AT2G15620) and the sedoheptulose-bisphosphatase (SBPase, AT3G55800) were higher abundant after HS-I, and the glutamate synthase (Glu1, AT5G04140) showed higher abundance after HS-I and HS-II. The small subunit of the ribulose bisphosphate carboxylase (Rbsc-1b, AT5G38430) and two HSP70 shown (AT4G24280 [77]) or predicted to be localized in plastids (HSP70-18, AT1G56410) are enhanced in chloroplasts isolated after HS-II application. The latter is enhanced in chloroplasts of toc64-1 plants as well, but only after HS-I (Figure 5c). In addition, we found that dual-targeted glutamine synthetase (Gln2, AT5G35630 [78]), the NADP-dependent malate dehydrogenase (NADP-MDH, AT5G58330 [79]) and ketol-acid reductoisomerase, necessary for amino acid biosynthesis (KARI, AT3G58610), are enhanced in chloroplasts isolated from toc64-1 after HS-I (Figure 5c).
After inspecting the changes in protein abundance in the mutants, we analyzed the changes in the wild type. We detected eight proteins exhibiting lower abundance after HS, mostly after HS-I. While it might be in part due to false-negative discovery (see discussion above, Figure 5a), remarkably, 4/8 proteins correspond to the light-harvesting system or photosystem II (Figure 5d). Further, a reduction of these proteins is consistent with the reduced chlorophyll content and the lower photosynthetic performance after HS-I treatment (Figure 1). These proteins also showed lower abundance after HS-II, although only Lhca3 fulfils the selection criteria (LFQ > 1.65; Figure 5d). Additionally, three components of photosystem I are not detected in wild-type chloroplasts after HS-I, but in chloroplasts isolated from plants without HS (Figure 5b). A similar distribution was found for CurtA, and the other protein of this family, CurtB (AT2G46820 [76]), is found to be reduced under this condition as well (Figure 5d). Moreover, the redox regulation of protein import (Tic62, AT3G18890 [80]), carbon fixation (Rbsc-1a, AT1G67090) or thiamine pyrophosphate synthesis (TKL1, AT3G60750 [81]) are reduced in their abundance in wild-type chloroplasts after HS-I (Figure 5d). Furthermore, we found four proteins with higher abundance in wild-type chloroplasts after HS-I, namely the class I Clp chaperones ClpC (AT3G48870, AT5G50920; Figure 5e) that are required for protein quality control [81], the translation elongation factor Rabe1b (AT4G20360), and its nucleotide exchange factor Ef-Ts (AT4G29060) known to be necessary for the HS response in plastids [82] (Figure 5e). All three protein families are enriched in chloroplasts of toc64-1 and ppi1 after HS-I as well, but not as drastic as in the wild type.

4. Discussion

4.1. The Change of Chloroplast Proteome and Performance in Mutants of the TOC Translocon

The TOC complex is the central entry gate for protein translocation. Toc33 is a component of the TOC core complex involved in the regulation of precursor protein reception and delivery [5,6,9,12,27]. In contrast, TOC64 is only dynamically associated with the Toc complex [40,41,42,43,44,45]. The function in chaperone recognition by its cytosolic exposed TPR motif [43,49,50,51,52] places TOC64 upstream of the core complex. At the same time, an important role in chloroplast quality control is possible as precursor protein recognition by chaperones in cells regulates their abundance in chloroplasts as well [83], as the two proteins are important for chloroplast biogenesis that takes place most rapidly in developing plants. Thus, the majority of the previous studies focused on earlier growth stages [43,54,56,84]. Here, we analyzed the performance of later growth stages that are more likely prone to be exposed to heat stress. Nevertheless, our results for control conditions provide information on the importance of the two components for the steady-state performance of chloroplasts.
Like the early growth stages [43,54,56,84], the absence of functional TOC33 in A. thaliana results in a reduction in the chlorophyll content in ppi1 when compared to the wild type (Figure 1). In contrast, toc64-1 plants lacking a functional TOC64 do not show significant alterations in chlorophyll content (Figure 1). However, consistent with an impact of the function of the two proteins, TOC33 and TOC64, for chloroplast biogenesis [5,27], the photosynthetic performance and the non-photochemical quenching (NPQ) is reduced in both mutants compared to the wild type (Figure 1). The photosynthetic performance is not correlated to the ultrastructure for the thylakoids in the mutants, probably because the chloroplasts of toc64-1 contained more and ppi1 possessed fewer stacks per plastids compared to the wild type, while comparable disc numbers per stack were observed for all three genotypes (Figure 2).
Even in early growth stages, the alteration of the chloroplast proteome in ppi1 was rather moderate [84]. Comparing the previously identified proteins with either lower or higher abundance in 10-day-old ppi1 seedlings with our results, we did not find the proteins enriched after ten days to be enriched at the later growth stage (Table 2); however, some of the proteins with lower abundance in 10-day-old ppi1 plants were enriched in our analysis relative to the wild type (Table 2). Furthermore, we found only ten proteins with two-fold higher and eight proteins with two-fold lesser abundance in ppi1 than the wild type (Figure 3; Table 1). The regulated proteins are centered around a reduced function of PSI or PSII, which is consistent with the reduced photosynthetic performance. Many proteins were identified to show higher abundance are either components of the photosystems (OE33, PsaE1, PsaF, LHCb1.5, LHCa4, PetE2) or involved in its assembly or protection (HHL1, RBD1, Lil3.1, Trx-m1; Figure 6 ppi1; [72,73,74,75,85]). The two exceptions are LHC4a and PsaF, which exhibit lower abundance in ppi1 (Figure 3; Table 1). Remarkably, these two proteins interact in PSI [86], but the reason for the reduction in these two components of the LHC belt remains to be established. The others, mostly lower abundant proteins, are direct targets of ferredoxin (GLU1) or thioredoxins (GapA, GapB; Figure 6; [87,88]).
Summarizing, the mutation of the core TOC subunit in ppi1 has a more substantial impact on the thylakoid architecture than toc64-1, but both mutants show reduced photosynthetic performance. The latter is consistent with the alteration of the proteomic content. However, while, in ppi1 chloroplasts, mainly two PSI components exhibited lower abundance, in toc64-1 chloroplasts, components of both PSI and PSII showed a lower abundance.

4.2. The Response of Chloroplasts to Temperature Elevations

Here, we tested the long-term memory to a single heat stress (HS) event (HS-I) and the adaptation to repetitive heat treatments (HS-II). Wild-type plants showed reduced photosynthetic performance after a single heat stress application (HS-I), but not after repetitive HS (HS-II, Figure 1). The same also holds for the chlorophyll content, which was reduced after HS-I but not after HS-II treatment. However, both treatments yielded a higher degree of NPQ, suggesting a degree of adaptation. Interestingly, the photosynthetic performance after HS-I in wild-type plants was comparable to that before and after the HS-I treatment of the mutant lines (Figure 1). The two mutant lines (ppi1 and toc64-1) did not show a further reduction in the photosynthetic performance after HS-I, but an increase after repetitive heat stress application (HS-II; Figure 1). The NPQ was enhanced after both treatments. In ppi1, however, the chlorophyll content was higher when compared to the control conditions. On the other hand, HS treatment renders a similar NPQ in toc64-1 after HS-I but not after HS-II. When compared to the wild type, the NPQ of ppi1 was found to be lower under all conditions (Figure 1). Like the comparison of the chloroplast from different genotypes grown under control conditions, the changes of the photosynthetic performance after heat stress application do not correlate with the number of stacks per plastid and discs per stack (Figure 2).
TOC64 is required for chaperone association to the chloroplast surface [43,49,50,51,52]. In this context, HSP70 was enriched in the chloroplast fraction of ppi1 plants and HSP81 in the wild type and ppi1 after HS-II when compared to toc64-1 under control conditions (Figure 4), while both these protein groups were highly abundant in chloroplasts of toc64-1 after HS-I application. A specific displacement of chaperones could be masked by the transient nature of the interaction between TOC64 and HSPs and by HSP contaminations of the fraction, as chaperones are generally highly abundant in the cell. In turn, it is worth mentioning that tubulin-α and actin were enriched in chloroplasts of the wild type and toc64-1 after HS-I, wherein actin was found to be enriched in the chloroplast fraction of ppi1 only after HS-II (Figure 4). Whether this suggests a difference in chloroplast anchoring and movement that is discussed to involve actin [93] or stromule formation discussed to involved microtubules [94] remains to be investigated.
For the single HS (HS-I), we noticed a reduction in photosynthetic components and of enzymes involved in the Calvin Benson Cycle in the wild type when compared to the control conditions (Figure 5 and Figure 6, HS-I). This is consistent with the reduction in photosynthetic performance (Figure 1). Moreover, the number of stacks is reduced in wild-type plants, which coincides with a reduction in CurtA and CurtB described to act in thylakoid structure determination [76]. In contrast, the enzymes of the Calvin Benson Cycle showed higher abundance in the chloroplasts of ppi1, but not of toc64-1 when compared to the respective control condition (Figure 5 and Figure 6, HS-I). Remarkably, class I Clp chaperones ClpC [81] were enriched in chloroplasts isolated from wild-type and toc64-1, and the translation elongation factor Rabe1b and its nucleotide exchange factor Ef-Ts known to be necessary for the HS response [82] were enhanced in all three genotypes (Figure 5 and Figure 6, HS-I). Moreover, HSP70-18 is enriched in chloroplasts from wild-type and toc64-1 and HSP70-6 in ppi1 (Figure 5 and Figure 6, HS-I). Thus, the long-term memory of a single heat application appears to be manifested by the upregulation of components of the chaperone and the translation system.
After repetitive HS application (HS-II), the chloroplast proteome of the wild type is somewhat comparable to the control condition. The only exceptions are two LHC components of PSI, which showed lower abundance (Figure 5 and Figure 6, HS-II). This is consistent with the comparable photosynthetic performance for plants grown under control or HS-II condition. In ppi1 plants, we, again, noticed an accumulation of the enzymes of the Calvin Benson Cycle, but a reduction in PSI and PSII components when compared to control conditions (Figure 5 and Figure 6, HS-II). This is remarkable, as PsbL is required for PSII core dimers and PSII-LHCII complex formation [95], PsbR for PsbP assembly to PSII and PSII-LHCII complex formation [96] and PsbE for PSII and PsbB assembly [97,98]. Thus, its lower abundance in chloroplasts after HS-II when compared to control conditions stands somehow in contrast to the higher photosynthetic performance (Figure 1). In turn and consistent with the photosynthetic parameter, these proteins were enhanced in toc64-1 (Figure 1,Figure 5 and Figure 6, HS-II). Alike in ppi1, enzymes of the Calvin Benson Cycle exhibited higher abundance in toc64-1 chloroplasts after HS-II (Figure 5 and Figure 6, HS-II). As the PSII components, the two proteins CurtA and CurtB were reduced in ppi1 but enhanced in toc64-1, which coincides with the alteration of the disc number per thylakoid stack (Figure 2, Figure 5 and Figure 6, HS-II). For the alteration of the abundance of regulatory components, HSP70-18 and HSP70-6 were found to accumulate in ppi1 only, while a protein assigned as DnaJ D12 showed low abundance in ppi1 but higher abundance in the other two genotypes (Figure 5 and Figure 6, HS-II). This is in contrast to the HS-I treatment; thus, it appears that the chloroplasts did not manifest a memory system but have adapted to the new situation on exposure to repetitive heat stress application (HS-II).

Supplementary Materials

The following are available online at https://www.mdpi.com/2073-4425/11/6/650/s1. Table S1: Protein Group output from MaxQuant software for the proteome analysis. The table contains information on the identified protein groups (multiple entries that could not be differentiated based on peptide evidence), the majority protein ID (the leading protein of the protein group; note, in case that multiple majority IDs were identified for one group, each of them is listed separately), the FASTA information for the majority protein, the number of peptides for the majority protein in total and in each experimental application and the identification type, the intensity observed, the LFQ intensity observed, Table S2: Specific information on identified proteins. Given is the majority protein ID; the protein IDs of the proteins found in the same group and the SUBA based localization showing the subcellular localization with the highest confidence score. Subsequently, the FASTA headers/function defines the identified or predicted cellular or molecular function of identified proteins. Finally, the identification mode by which proteins were identified per sample, either by MS/MS or by chromatogram alignment with other samples in which the proteins were directly identified is indicated. Note, all columns except SUBA based localization were extracted from Table S1, and the FASTA function is limited to essential information, Supplemental file S1: R scripts for the statistical analysis performed on Table S1 using R 4.0.0 and the DEP package.

Author Contributions

Conceptualization, E.S.; methodology, P.P., A.M., P.C. and A.G.; validation, P.P., A.M. and P.C.; formal analysis, P.C., M.B. and E.S.; data curation, P.P., A.M., P.C., A.G., M.B. and E.S.; writing—original draft preparation, P.P., M.B. and E.S.; writing—review and editing, ALL; visualization, P.P., A.M. and E.S.; supervision, W.W. and E.S.; funding acquisition, W.W. and E.S. All authors have read and agreed to the published version of the manuscript.

Funding

This research was funded by Marie Curie SPOT-ITN and by Deutsche Forschungsgemeinschaft DFG SCHL585/15-1.

Acknowledgments

We would like to acknowledge the helpful comments and assistance of Klaus-Dieter Scharf, Stefan Simm, Sotirios Fragkostefanakis, and Marion Basoglu.

Conflicts of Interest

The authors declare no conflict of interest. The funders had no role in the design of the study; in the collection, analyses, or interpretation of data; in the writing of the manuscript, or in the decision to publish the results.

References

  1. Williams, B.; Verchot, J.; Dickman, M.B. When supply does not meet demand-ER stress and plant programmed cell death. Front. Plant Sci. 2014, 5, 211. [Google Scholar] [CrossRef] [Green Version]
  2. Hartl, F.U.; Bracher, A.; Hayer-Hartl, M. Molecular chaperones in protein folding and proteostasis. Nature 2011, 475, 324–332. [Google Scholar] [CrossRef]
  3. Hipp, M.S.; Kasturi, P.; Hartl, F.U. The proteostasis network and its decline in ageing. Nat. Rev. Mol. Cell Biol. 2019, 20, 421–435. [Google Scholar] [CrossRef] [PubMed]
  4. Morán Luengo, T.; Mayer, M.P.; Rüdiger, S.G.D. The Hsp70-Hsp90 Chaperone Cascade in Protein Folding. Trends Cell Biol. 2019, 29, 164–177. [Google Scholar] [CrossRef] [PubMed]
  5. Schleiff, E.; Becker, T. Common ground for protein translocation: Access control for mitochondria and chloroplasts. Nat. Rev. Mol. Cell Biol. 2011, 12, 48–59. [Google Scholar] [CrossRef] [PubMed]
  6. Kunze, M.; Berger, J. The similarity between N-terminal targeting signals for protein import into different organelles and its evolutionary relevance. Front. Physiol. 2015, 6, 259. [Google Scholar] [CrossRef] [PubMed] [Green Version]
  7. Mikhaleva, S.; Lemke, E.A. Beyond the Transport Function of Import Receptors: What’s All the FUS about? Cell 2018, 173, 549–553. [Google Scholar] [CrossRef] [PubMed] [Green Version]
  8. Aviram, N.; Schuldiner, M. Targeting and translocation of proteins to the endoplasmic reticulum at a glance. J. Cell Sci. 2017, 130, 4079–4085. [Google Scholar] [CrossRef] [Green Version]
  9. Paul, P.; Simm, S.; Blaumeiser, A.; Scharf, K.-D.; Fragkostefanakis, S.; Mirus, O.; Schleiff, E. The protein translocation systems in plants—Composition and variability on the example of Solanum lycopersicum. BMC Genom. 2013, 14, 189. [Google Scholar] [CrossRef] [Green Version]
  10. Paul, P.; Simm, S.; Mirus, O.; Scharf, K.-D.; Fragkostefanakis, S.; Schleiff, E. The complexity of vesicle transport factors in plants examined by orthology search. PLoS ONE 2014, 9, e97745. [Google Scholar] [CrossRef] [Green Version]
  11. Shanmugabalaji, V.; Kessler, F. CHLORAD: Eradicating Translocon Components from the Outer Membrane of the Chloroplast. Mol. Plant. 2019, 12, 467–469. [Google Scholar] [CrossRef] [PubMed] [Green Version]
  12. Oreb, M.; Tews, I.; Schleiff, E. Policing Tic ’n’ Toc, the doorway to chloroplasts. Trends Cell Biol. 2008, 18, 19–27. [Google Scholar] [CrossRef] [PubMed]
  13. Strasser, R. Protein Quality Control in the Endoplasmic Reticulum of Plants. Annu. Rev. Plant Biol. 2018, 69, 147–172. [Google Scholar] [CrossRef] [PubMed]
  14. Vögtle, F.-N.; Meisinger, C. Sensing mitochondrial homeostasis: The protein import machinery takes control. Dev. Cell 2012, 23, 234–236. [Google Scholar] [CrossRef] [Green Version]
  15. Leister, D. Chloroplast research in the genomic age. Trends Genet. 2003, 19, 47–56. [Google Scholar] [CrossRef]
  16. Kosová, K.; Vítámvás, P.; Prášil, I.T. Proteomics of stress responses in wheat and barley-search for potential protein markers of stress tolerance. Front. Plant Sci. 2014, 5, 711. [Google Scholar] [CrossRef] [Green Version]
  17. Bokszczanin, K.L. Solanaceae Pollen Thermotolerance Initial Training Network (SPOT-ITN) Consortium; Fragkostefanakis, S. Perspectives on deciphering mechanisms underlying plant heat stress response and thermotolerance. Front. Plant Sci. 2013, 4, 315. [Google Scholar] [CrossRef]
  18. Bäurle, I. Plant Heat Adaptation: Priming in response to heat stress. F1000 Res. 2016, 5, F1000. [Google Scholar] [CrossRef]
  19. Hossain, Z.; Nouri, M.Z.; Komatsu, S. Plant cell organelle proteomics in response to abiotic stress. J. Proteome Res. 2012, 11, 37–48. [Google Scholar] [CrossRef]
  20. Rurek, M. Plant mitochondria under a variety of temperature stress conditions. Mitochondrion 2014, 19, 289–294. [Google Scholar] [CrossRef]
  21. Lee, D.-G.; Ahsan, N.; Lee, S.-H.; Kang, K.Y.; Bahk, J.D.; Lee, I.-J.; Lee, B.-H. A proteomic approach in analyzing heat-responsive proteins in rice leaves. Proteomics 2007, 7, 3369–3383. [Google Scholar] [CrossRef]
  22. Ferreira, S.; Hjernø, K.; Larsen, M.; Wingsle, G.; Larsen, P.; Fey, S.; Roepstorff, P.; Salomé Pais, M. Proteome profiling of Populus euphratica Oliv. upon heat stress. Ann. Bot. 2006, 98, 361–377. [Google Scholar] [CrossRef] [PubMed] [Green Version]
  23. Majoul, T.; Bancel, E.; Triboï, E.; Ben Hamida, J.; Branlard, G. Proteomic analysis of the effect of heat stress on hexaploid wheat grain: Characterization of heat-responsive proteins from total endosperm. Proteomics 2003, 3, 175–183. [Google Scholar] [CrossRef] [PubMed]
  24. Laino, P.; Shelton, D.; Finnie, C.; De Leonardis, A.M.; Mastrangelo, A.M.; Svensson, B.; Lafiandra, D.; Masci, S. Comparative proteome analysis of metabolic proteins from seeds of durum wheat (cv. Svevo) subjected to heat stress. Proteomics 2010, 10, 2359–2368. [Google Scholar] [CrossRef] [PubMed] [Green Version]
  25. Xu, C.; Huang, B. Root proteomic responses to heat stress in two Agrostis grass species contrasting in heat tolerance. J. Exp. Bot. 2008, 59, 4183–4194. [Google Scholar] [CrossRef] [Green Version]
  26. Taylor, N.L.; Tan, Y.-F.; Jacoby, R.P.; Millar, A.H. Abiotic environmental stress induced changes in the Arabidopsis thaliana chloroplast, mitochondria and peroxisome proteomes. J. Proteom. 2009, 72, 367–378. [Google Scholar] [CrossRef]
  27. Soll, J.; Schleiff, E. Protein import into chloroplasts. Nat. Rev. Mol. Cell Biol. 2004, 5, 198–208. [Google Scholar] [CrossRef]
  28. Yamori, W.; Hikosaka, K.; Way, D.A. Temperature response of photosynthesis in C3, C4, and CAM plants: Temperature acclimation and temperature adaptation. Photosynth. Res. 2014, 119, 101–117. [Google Scholar] [CrossRef]
  29. Sun, A.Z.; Guo, F.Q. Chloroplast Retrograde Regulation of Heat Stress Responses in Plants. Front. Plant Sci. 2016, 7, 398. [Google Scholar] [CrossRef] [Green Version]
  30. Wang, Q.L.; Chen, J.H.; He, N.Y.; Guo, F.Q. Metabolic Reprogramming in Chloroplasts under Heat Stress in Plants. Int. J. Mol. Sci. 2018, 19, E849. [Google Scholar] [CrossRef] [Green Version]
  31. Sharkey, T.D. Effects of moderate heat stress on photosynthesis: Importance of thylakoid reactions, rubisco deactivation, reactive oxygen species, and thermotolerance provided by isoprene. Plant Cell Environ. 2005, 28, 269–277. [Google Scholar] [CrossRef]
  32. Allakhverdiev, S.I.; Kreslavski, V.D.; Klimov, V.V.; Los, D.A.; Carpentier, R.; Mohanty, P. Heat stress: An overview of molecular responses in photosynthesis. Photosynth. Res. 2008, 98, 541–550. [Google Scholar] [CrossRef]
  33. Law, R.D.; Crafts-Brandner, S.J. Inhibition and acclimation of photosynthesis to heat stress is closely correlated with activation of ribulose-1,5-bisphosphate Carboxylase/Oxygenase. Plant Physiol. 1999, 120, 173–182. [Google Scholar] [CrossRef] [PubMed] [Green Version]
  34. Semenova, G. Structural reorganization of thylakoid systems in response to heat treatment. Photosynthetica 2004, 42, 521–527. [Google Scholar] [CrossRef]
  35. Vani, B.; Pardha Saradhi, P.; Mohanty, P. Alteration in chloroplast structure and thylakoid membrane composition due to in vivo heat treatment of rice seedlings: Correlation with the functional changes. J. Plant Physiol. 2001, 158, 583–592. [Google Scholar] [CrossRef]
  36. Gounaris, K.; Brain, A.R.R.; Quinn, P.J.; Williams, W.P. Structural reorganisation of chloroplast thylakoid membranes in response to heat-stress. Biochim. Biophys. Acta 1984, 766, 198–208. [Google Scholar] [CrossRef]
  37. Dutta, S.; Mohanty, S.; Tripathy, B.C. Role of temperature stress on chloroplast biogenesis and protein import in pea. Plant Physiol. 2009, 150, 1050–1561. [Google Scholar] [CrossRef]
  38. Heckathorn, S.A.; Downs, C.A.; Coleman, J.S. Nuclear-Encoded Chloroplast Proteins Accumulate in the Cytosol during Severe Heat StressNuclear-Encoded Chloroplast Proteins Accumulate in the Cytosol during Severe Heat Stress. Nuclear-Encoded Chloroplast Proteins Accumulate in the Cytosol During Severe Heat Stress Nuclear-Encoded Chloroplast Proteins Accumulate in the Cytosol During Severe Heat StressInt. J. Plant Sci. 1998, 159, 39–45. [Google Scholar]
  39. Flores-Pérez, Ú.; Jarvis, P. Molecular chaperone involvement in chloroplast protein import. Biochim. Biophys. Acta. 2013, 1833, 332–340. [Google Scholar] [CrossRef] [Green Version]
  40. Sohrt, K.; Soll, J. Toc64, a new component of the protein translocon of chloroplasts. J. Cell Biol. 2000, 148, 1213–1221. [Google Scholar] [CrossRef] [Green Version]
  41. Qbadou, S.; Becker, T.; Mirus, O.; Tews, I.; Soll, J.; Schleiff, E. The molecular chaperone Hsp90 delivers precursor proteins to the chloroplast import receptor Toc64. EMBO J. 2006, 25, 1836–1847. [Google Scholar] [CrossRef] [Green Version]
  42. Qbadou, S.; Becker, T.; Bionda, T.; Reger, K.; Ruprecht, M.; Soll, J.; Schleiff, E. Toc64—A preprotein-receptor at the outer membrane with bipartide function. J. Mol. Biol. 2007, 367, 1330–1346. [Google Scholar] [CrossRef] [PubMed]
  43. Sommer, M.; Rudolf, M.; Tillmann, B.; Tripp, J.; Sommer, M.S.; Schleiff, E. Toc33 and Toc64-III cooperate in precursor protein import into the chloroplasts of Arabidopsis thaliana. Plant Cell Environ. 2013, 36, 970–983. [Google Scholar] [CrossRef] [PubMed]
  44. Rosenbaum Hofmann, N.; Theg, S.M. Toc64 is not required for import of proteins into chloroplasts in the moss Physcomitrella patens. Plant J. 2005, 43, 675–687. [Google Scholar] [CrossRef]
  45. Aronsson, H.; Boij, P.; Patel, R.; Wardle, A.; Töpel, M.; Jarvis, P. Toc64/OEP64 is not essential for the efficient import of proteins into chloroplasts in Arabidopsis thaliana. Plant J. 2007, 52, 53–68. [Google Scholar] [CrossRef]
  46. Wang, W.; Vinocur, B.; Shoseyov, O.; Altman, A. Role of plant heat-shock proteins and molecular chaperones in the abiotic stress response. Trends Plant Sci. 2004, 9, 244–252. [Google Scholar] [CrossRef]
  47. Fragkostefanakis, S.; Röth, S.; Schleiff, E.; Scharf, K.D. Prospects of engineering thermotolerance in crops through modulation of heat stress transcription factor and heat shock protein networks. Plant Cell Environ. 2015, 38, 1881–1895. [Google Scholar] [CrossRef]
  48. Driedonks, N.; Xu, J.; Peters, J.L.; Park, S.; Rieu, I. Multi-Level Interactions between Heat Shock Factors, Heat Shock Proteins, and the Redox System Regulate Acclimation to Heat. Front. Plant Sci. 2015, 6, 999. [Google Scholar] [CrossRef] [PubMed] [Green Version]
  49. Schlegel, T.; Mirus, O.; von Haeseler, A.; Schleiff, E. The tetratricopeptide repeats of receptors involved in protein translocation across membranes. Mol. Biol. Evol. 2007, 24, 2763–2774. [Google Scholar] [CrossRef] [PubMed]
  50. Mirus, O.; Bionda, T.; von Haeseler, A.; Schleiff, E. Evolutionarily evolved discriminators in the 3-TPR domain of the Toc64 family involved in protein translocation at the outer membrane of chloroplasts and mitochondria. J. Mol. Model. 2009, 15, 971–982. [Google Scholar] [CrossRef]
  51. Panigrahi, R.; Adina-Zada, A.; Whelan, J.; Vrielink, A. Ligand recognition by the TPR domain of the import factor Toc64 from Arabidopsis thaliana. PLoS ONE 2013, 8, e83461. [Google Scholar] [CrossRef] [PubMed]
  52. Schweiger, R.; Soll, J.; Jung, K.; Heermann, R.; Schwenkert, S. Quantification of interaction strengths between chaperones and tetratricopeptide repeat domain-containing membrane proteins. J. Biol. Chem. 2013, 288, 30614–30625. [Google Scholar] [CrossRef] [PubMed] [Green Version]
  53. Nickel, C.; Horneff, R.; Heermann, R.; Neumann, B.; Jung, K.; Soll, J.; Schwenkert, S. Phosphorylation of the outer membrane mitochondrial protein OM64 influences protein import into mitochondria. Mitochondrion 2019, 44, 93–102. [Google Scholar] [CrossRef]
  54. Jarvis, P.; Chen, L.J.; Li, H.; Peto, C.A.; Fankhauser, C.; Chory, J. An Arabidopsis mutant defective in the plastid general protein import apparatus. Science 1998, 282, 100–103. [Google Scholar] [CrossRef] [PubMed]
  55. Suzuki, N.; Rivero, R.M.; Shulaev, V.; Blumwald, E.; Mittler, R. Abiotic and biotic stress combinations. New Phytol. 2014, 203, 32–43. [Google Scholar] [CrossRef]
  56. Oreb, M.; Zoryan, M.; Vojta, A.; Maier, U.G.; Eichacker, L.A.; Schleiff, E. Phospho-mimicry mutant of atToc33 affects early development of Arabidopsis thaliana. FEBS Lett. 2007, 581, 5945–5951. [Google Scholar] [CrossRef] [PubMed] [Green Version]
  57. Reynolds, E. The use of lead citrate at high pH as an electron-opaque stain in electron microscopy. J. Cell Biol. 1963, 17, 208–212. [Google Scholar] [CrossRef] [PubMed] [Green Version]
  58. Simm, S.; Papasotiriou, D.G.; Ibrahim, M.; Leisegang, M.S.; Müller, B.; Schorge, T.; Karas, M.; Mirus, O.; Sommer, M.S.; Schleiff, E. Defining the core proteome of the chloroplast envelope membranes. Front. Plant Sci. 2013, 4, 11. [Google Scholar] [CrossRef] [PubMed] [Green Version]
  59. Popov, N.; Schmitt, M.; Schulzeck, S.; Matthies, H. Reliable micromethod for determination of the protein content in tissue homogenates. Acta Biol. Med. Ger. 1975, 34, 1441–1446. [Google Scholar]
  60. Chaturvedi, P.; Ischebeck, T.; Egelhofer, V.; Lichtscheidl, I.; Weckwerth, W. Cell-specific analysis of the tomato pollen proteome from pollen mother cell to mature pollen provides evidence for developmental priming. J. Proteome Res. 2013, 12, 4892–4903. [Google Scholar] [CrossRef]
  61. Paul, P.; Chaturvedi, P.; Selymesi, M.; Ghatak, A.; Mesihovic, A.; Scharf, K.-D.; Weckwerth, W.; Simm, S.; Schleiff, E. The membrane proteome of male gametophyte in Solanum lycopersicum. J. Proteom. 2016, 131, 48–60. [Google Scholar] [CrossRef] [PubMed]
  62. Keller, M.; Simm, S.; SPOT-ITN Consortium. The coupling of transcriptome and proteome adaptation during development and heat stress response of tomato pollen. BMC Genom. 2018, 19, 447. [Google Scholar] [CrossRef]
  63. Cox, J.; Mann, M. MaxQuant enables high peptide identification rates, individualized p.P.B.-range mass accuracies and proteome-wide protein quantification. Nat. Biotechnol. 2008, 26, 1367–1372. [Google Scholar] [CrossRef] [PubMed]
  64. Thimm, O.; Bläsing, O.; Gibon, Y.; Nagel, A.; Meyer, S.; Krüger, P.; Selbig, J.; Müller, L.A.; Rhee, S.Y.; Stit, T.M. Mapman: A user-driven tool to display genomics data sets onto diagrams of metabolic pathways and other biological processes. Plant J. 2004, 37, 914–939. [Google Scholar] [CrossRef] [PubMed]
  65. Lamesch, P.; Berardini, T.Z.; Li, D.; Swarbreck, D.; Wilks, C.; Sasidharan, R.; Muller, R.; Dreher, K.; Alexander, D.L.; Garcia-Hernandez, M.; et al. The Arabidopsis Information Resource (TAIR): Improved gene annotation and new tools. Nucleic Acids Res. 2012, 40, D1202–D1210. [Google Scholar] [CrossRef] [PubMed]
  66. Hooper, C.M.; Castleden, I.R.; Tanz, S.K.; Aryamanesh, N.; Millar, A.H. SUBA4: The interactive data analysis centre for Arabidopsis subcellular protein locations. Nucleic Acids Res. 2017, 45, D1064–D1074. [Google Scholar] [CrossRef] [PubMed] [Green Version]
  67. Dias, A.S.; Semedo, J.; Ramalho, J.C.; Lidon, F.C. Bread and Durum Wheat under Heat Stress: A Comparative Study on the Photosynthetic Performance. J. Agron. Crop Sci. 2011, 197, 50–56. [Google Scholar] [CrossRef]
  68. Maxwell, K.; Johnson, G.N. Chlorophyll fluorescence—A practical guide. J. Exp. Bot. 2000, 51, 659–668. [Google Scholar] [CrossRef]
  69. König, J.; Baier, M.; Horling, F.; Kahmann, U.; Harris, G.; Schürmann, P.; Dietz, K.J. The plant-specific function of 2-Cys peroxiredoxin-mediated detoxification of peroxides in the redox-hierarchy of photosynthetic electron flux. Proc. Natl. Acad. Sci. USA 2002, 99, 5738–5743. [Google Scholar] [CrossRef] [Green Version]
  70. Dangoor, I.; Peled-Zehavi, H.; Wittenberg, G.; Danon, A. A chloroplast light-regulated oxidative sensor for moderate light intensity in Arabidopsis. Plant Cell. 2012, 24, 1894–1906. [Google Scholar] [CrossRef] [Green Version]
  71. König, J.; Muthuramalingam, M.; Dietz, K.J. Mechanisms and dynamics in the thiol/disulfide redox regulatory network: Transmitters, sensors and targets. Curr. Opin. Plant Biol. 2012, 15, 261–268. [Google Scholar] [CrossRef] [PubMed]
  72. Wang, P.; Liu, J.; Liu, B.; Feng, D.; Da, Q.; Wang, P.; Shu, S.; Su, J.; Zhang, Y.; Wang, J.; et al. Evidence for a role of chloroplastic m-type thioredoxins in the biogenesis of photosystem II in Arabidopsis. Plant Physiol. 2013, 163, 1710–1728. [Google Scholar] [CrossRef] [PubMed] [Green Version]
  73. Jin, H.; Liu, B.; Luo, L.; Feng, D.; Wang, P.; Liu, J.; Da, Q.; He, Y.; Qi, K.; Wang, J.; et al. HYPERSENSITIVE TO HIGH LIGHT1 interacts with LOW QUANTUM YIELD OF PHOTOSYSTEM II1 and functions in protection of photosystem II from photodamage in Arabidopsis. Plant Cell. 2014, 26, 1213–1229. [Google Scholar] [CrossRef] [PubMed] [Green Version]
  74. Calderon, R.H.; García-Cerdán, J.G.; Malnoë, A.; Cook, R.; Russell, J.J.; Gaw, C.; Dent, R.M.; de Vitry, C.; Niyogi, K.K. A conserved rubredoxin is necessary for photosystem II accumulation in diverse oxygenic photoautotrophs. J. Biol. Chem. 2013, 288, 26688–26696. [Google Scholar] [CrossRef] [Green Version]
  75. Hey, D.; Rothbart, M.; Herbst, J.; Wang, P.; Müller, J.; Wittmann, D.; Gruhl, K.; Grimm, B. LIL3, a Light-Harvesting Complex Protein, Links Terpenoid and Tetrapyrrole Biosynthesis in Arabidopsis thaliana. Plant Physiol. 2017, 174, 1037–1050. [Google Scholar] [CrossRef] [Green Version]
  76. Armbruster, U.; Labs, M.; Pribil, M.; Viola, S.; Xu, W.; Scharfenberg, M.; Hertle, A.P.; Rojahn, U.; Jensen, P.E.; Rappaport, F.; et al. Arabidopsis CURVATURE THYLAKOID1 proteins modify thylakoid architecture by inducing membrane curvature. Plant Cell. 2013, 25, 2661–2678. [Google Scholar] [CrossRef] [Green Version]
  77. Latijnhouwers, M.; Xu, X.M.; Møller, S.G. Arabidopsis stromal 70-kDa heat shock proteins are essential for chloroplast development. Planta 2010, 232, 567–578. [Google Scholar] [CrossRef]
  78. Taira, M.; Valtersson, U.; Burkhardt, B.; Ludwig, R.A. Arabidopsis thaliana GLN2-encoded glutamine synthetase is dual targeted to leaf mitochondria and chloroplasts. Plant Cell. 2004, 16, 2048–2058. [Google Scholar] [CrossRef] [Green Version]
  79. Scheibe, R. Malate valves to balance cellular energy supply. Physiol. Plant. 2004, 120, 21–26. [Google Scholar] [CrossRef]
  80. Khozaei, M.; Fisk, S.; Lawson, T.; Gibon, Y.; Sulpice, R.; Stitt, M.; Lefebvre, S.C.; Raines, C.A. Overexpression of plastid transketolase in tobacco results in a thiamine auxotrophic phenotype. Plant Cell. 2015, 27, 432–447. [Google Scholar] [CrossRef] [Green Version]
  81. Sjögren, L.L.; Tanabe, N.; Lymperopoulos, P.; Khan, N.Z.; Rodermel, S.R.; Aronsson, H.; Clarke, A.K. Quantitative analysis of the chloroplast molecular chaperone ClpC/Hsp93 in Arabidopsis reveals new insights into its localization, interaction with the Clp proteolytic core, and functional importance. J. Biol. Chem. 2014, 289, 11318–11330. [Google Scholar] [CrossRef] [PubMed] [Green Version]
  82. Li, X.; Cai, C.; Wang, Z.; Fan, B.; Zhu, C.; Chen, Z. Plastid Translation Elongation Factor Tu Is Prone to Heat-Induced Aggregation Despite Its Critical Role in Plant Heat Tolerance. Plant Physiol. 2018, 176, 3027–3045. [Google Scholar] [CrossRef] [PubMed] [Green Version]
  83. Tillmann, B.; Röth, S.; Bublak, D.; Sommer, M.; Stelzer, E.H.; Scharf, K.D.; Schleiff, E. Hsp90 is involved in the regulation of cytosolic precursor protein abundance in tomato. Mol. Plant 2015, 8, 228–241. [Google Scholar] [CrossRef] [Green Version]
  84. Kubis, S.; Baldwin, A.; Patel, R.; Razzaq, A.; Dupree, P.; Lilley, K.; Kurth, J.; Leister, D.; Jarvis, P. The Arabidopsis ppi1 mutant is specifically defective in the expression, chloroplast import, and accumulation of photosynthetic proteins. Plant Cell 2003, 15, 1859–1871. [Google Scholar] [CrossRef] [PubMed] [Green Version]
  85. Schubert, M.; Petersson, U.A.; Haas, B.J.; Funk, C.; Schröder, W.P.; Kieselbach, T. Proteome map of the chloroplast lumen of Arabidopsis thaliana. J. Biol. Chem. 2002, 277, 8354–8365. [Google Scholar] [CrossRef] [PubMed] [Green Version]
  86. Amunts, A.; Toporik, H.; Borovikova, A.; Nelson, N. Structure determination and improved model of plant photosystem I. J. Biol. Chem. 2010, 285, 3478–3486. [Google Scholar] [CrossRef] [PubMed] [Green Version]
  87. Michelet, L.; Zaffagnini, M.; Morisse, S.; Sparla, F.; Pérez-Pérez, M.E.; Francia, F.; Danon, A.; Marchand, C.H.; Fermani, S.; Trost, P.; et al. Redox regulation of the Calvin-Benson cycle: Something old, something new. Front. Plant Sci. 2013, 4, 470. [Google Scholar] [CrossRef] [Green Version]
  88. Taniguchi, M.; Miyake, H. Redox-shuttling between chloroplast and cytosol: Integration of intra-chloroplast and extra-chloroplast metabolism. Curr. Opin. Plant Biol. 2012, 15, 252–260. [Google Scholar] [CrossRef]
  89. Fu, A.; He, Z.; Cho, H.S.; Lima, A.; Buchanan, B.B.; Luan, S. A chloroplast cyclophilin functions in the assembly and maintenance of photosystem II in Arabidopsis thaliana. Proc. Natl. Acad. Sci. USA 2007, 104, 15947–15952. [Google Scholar] [CrossRef] [Green Version]
  90. Jurić, S.; Hazler-Pilepić, K.; Tomasić, A.; Lepedus, H.; Jelicić, B.; Puthiyaveetil, S.; Bionda, T.; Vojta, L.; Allen, J.F.; Schleiff, E.; et al. Tethering of ferredoxin:NADP+ oxidoreductase to thylakoid membranes is mediated by novel chloroplast protein TROL. Plant J. 2009, 60, 783–794. [Google Scholar] [CrossRef]
  91. Järvi, S.; Suorsa, M.; Tadini, L.; Ivanauskaite, A.; Rantala, S.; Allahverdiyeva, Y.; Leister, D.; Aro, E.M. Thylakoid-Bound FtsH Proteins Facilitate Proper Biosynthesis of Photosystem I. Plant Physiol. 2016, 171, 1333–1343. [Google Scholar] [PubMed] [Green Version]
  92. Kato, Y.; Hyodo, K.; Sakamoto, W. The Photosystem II Repair Cycle Requires FtsH Turnover through the EngA GTPase. Plant Physiol. 2018, 178, 596–611. [Google Scholar] [CrossRef] [PubMed] [Green Version]
  93. Wada, M.; Kong, S.G. Actin-mediated movement of chloroplasts. J. Cell Sci. 2018, 131, jcs210310. [Google Scholar] [CrossRef] [PubMed] [Green Version]
  94. Kumar, A.S.; Park, E.; Nedo, A.; Alqarni, A.; Ren, L.; Hoban, K.; Modla, S.; McDonald, J.H.; Kambhamettu, C.; Dinesh-Kumar, S.P.; et al. Stromule extension along microtubules coordinated with actin-mediated anchoring guides perinuclear chloroplast movement during innate immunity. Elife 2018, 7, e23625. [Google Scholar] [CrossRef] [PubMed] [Green Version]
  95. Suorsa, M.; Regel, R.E.; Paakkarinen, V.; Battchikova, N.; Herrmann, R.G.; Aro, E.M. Protein assembly of photosystem II and accumulation of subcomplexes in the absence of low molecular mass subunits PsbL and PsbJ. Eur. J. Biochem. 2004, 271, 96–107. [Google Scholar] [CrossRef] [Green Version]
  96. Allahverdiyeva, Y.; Suorsa, M.; Rossi, F.; Pavesi, A.; Kater, M.M.; Antonacci, A.; Tadini, L.; Pribil, M.; Schneider, A.; Wanner, G.; et al. Arabidopsis plants lacking PsbQ and PsbR subunits of the oxygen-evolving complex show altered PSII super-complex organization and short-term adaptive mechanisms. Plant J. 2013, 75, 671–784. [Google Scholar] [CrossRef]
  97. Ido, K.; Kakiuchi, S.; Uno, C.; Nishimura, T.; Fukao, Y.; Noguchi, T.; Sato, F.; Ifuku, K. The conserved His-144 in the PsbP protein is important for the interaction between the PsbP N-terminus and the Cyt b559 subunit of photosystem II. J. Biol. Chem. 2012, 287, 26377–26387. [Google Scholar] [CrossRef] [Green Version]
  98. Morais, F.; Barber, J.; Nixon, P.J. The chloroplast-encoded alpha subunit of cytochrome b-559 is required for assembly of the photosystem two complex in both the light and the dark in Chlamydomonas reinhardtii. J. Biol. Chem. 1998, 273, 29315–29320. [Google Scholar] [CrossRef] [Green Version]
Figure 1. Chlorophyll content and photosynthetic performance after heat stress. (a) Schematic representation of the heat stress (HS) regime. A. thaliana wild type, ppi1, and toc64-1 were grown under short-day conditions and were then either kept under control (c) conditions (21 °C) or submitted to heat stress conditions (42 °C) either only once on day 7 for 2 h (HS-I) or every alternate day (HS-II) until day 21. (b) Chlorophyll content from 21-day-old leaves of wild-type, ppi1, and toc64-1 plants subjected to control (c), HS-I (I), or HS-II (II) treatment as shown in (a). The values shown are the means of at least three measurements (± SD). Statistical analysis (see methods section) was performed (p < 0.05). (c,d) The kinetic of the quantum yield adaptation of photosystem II (c) or the non-photochemical quenching (NPQ; d) from 21-day-old leaves of wild-type (left), ppi1 (middle) or toc64-1 plants (right) after they have been subjected to control (black), HS-I (orange), or HS-II treatment (green) at low light conditions is shown. The maximal Φ(II) and NPQ value for HS-treated wild-type plants is indicated as a horizontal dashed line for comparison.
Genes 11 00650 g001
Figure 2. Chloroplast ultrastructure of heat-stress-treated wild-type, ppi1, and toc64-1 plants. (a) The leaves of 21-day-old plants were analyzed. Representative images of each line and condition are shown in two magnifications (11,500×: complete chloroplast and 66,000×: for stacks). Scale bar for each image shows 1 µm for the 11,500× fold magnification and 0.2 µm for 66,000× fold magnification. Plastoglobules are marked by yellow arrows. (b,c) The number of grana stacks and discs per grana stack was counted for each plant line (at least four chloroplasts per plant line per condition). Significance (p < 0.05; n = 5) determined by statistical analysis (ANOVA with Duncan post hoc test) is indicated.
Genes 11 00650 g002
Figure 3. Proteome analysis of chloroplasts. (a) The number of identified proteins is shown. “Total” indicates all proteins identified in at least one sample; subsequently, the number of proteins discovered in individual samples is shown (black: control, orange: HS-I, green HS-II). The full bar indicates the fraction of plastid localized proteins based on SUBA, and the open segment indicates the fraction of proteins with localization to other cellular sub-compartments. The total number of discovered proteins is indicated on top. (b) The box plot of the log2(LFQ) value distribution with indicated maximal and minimal values is shown for each fraction. (c) The proteins detected in all three genotypes under control conditions are compared. The total number of proteins involved in photosynthesis (PS), metabolism, protein synthesis, and other process is shown, and proteins with lower (red) or higher (green) abundance in the mutants relative to wild-type plants are shown as indicated on the right.
Genes 11 00650 g003
Figure 4. Protein abundance of non-plastidic proteins in chloroplast fractions after heat stress. (a) The number of plastid (p -localized (dark blue) or non-plastidic (np) proteins (light blue; based on SUBA) found in all, or in at least 8, 7, 6 or 5 chloroplast samples is shown. Yellow crosses indicated the ratio between plastid localized proteins and non-plastidic proteins. (b) The log2(LFQ) for the indicated protein group was normalized to the lowest log2(LFQ) value found for the indicated group in any of the samples. The value is plotted for the wild type (blue), ppi1 (magenta) or toc64-1 (yellow). The dotted frames indicate the 99% confidence interval of the median of the log2(LFQ) values normalized to the lowest median (control, HS-I, and HS-II) of all non-plastidic proteins in one sample.
Genes 11 00650 g004
Figure 5. Abundance of plastidic proteins in chloroplast fractions after heat stress. (a) The distribution of the log2(LFQ) values for a protein normalized by subtracting the smallest found value was analyzed for each probe. The box plot presentation is shown. The difference in the distribution was analyzed by ANOVA. (be) The log2(LFQ)-log2(LFQmin) values are plotted for proteins with a difference > 1.65 between control, and one HS-treated sample for at least one genotype. The symbols are colored according to the legend. Enlarged symbols and dashed lines indicate changes (>1.65) after HS. Dotted lines indicated changes (>1.65), assuming that the absence of detection suggests a protein abundance lower or equal to the lowest LFQ value observed for this protein.
Genes 11 00650 g005
Figure 6. Proteomic alterations with respect to the genotype (top) or heat stress application (bottom). The results presented are summarized. On top, green indicates a higher and orange a lower abundance of the named protein in the indicated genotype (Fd: ferredoxin; CBC: Calvin Benson Cycle; for all other abbreviations and references see text). On the bottom, the color coding is according to the genotype (legend right bottom). Large letters indicate changes identified according to the described rule and small letters changes of at least two-fold. Normal letters indicated lower abundance (also indicated by downward arrow) and bold letters accumulation (upward arrow) when compared to the respective control sample. For further discussion, see text.
Genes 11 00650 g006
Table 1. Proteins predicted to be plastidic localized and exhibiting lower or higher abundance in chloroplasts isolated from mutants in comparison to wild-type chloroplasts. The protein name, the process the protein is acting in, the accession number and the obtained label-free quantification (LFQ) values (log2) are shown. The fold change (FC) according to the LFQ values, is presented for toc64-1 and ppi1 in comparison to the wild type; fold-change values >2 or <2 are marked in green or red, respectively.
NameProcessAccessionlog2(LFQ)FC (LFQ)
wttoc64-1ppi1toc64-1ppi1
CYP38photosynthesisAT3G0148020.4421.9621.102.871.59
FNR2photosynthesisAT1G2002021.9823.1322.912.221.91
cpHSP70-1protein synth.AT4G2428019.7120.8219.922.161.16
TROLphotosynthesisAT4G0105021.5722.6722.452.141.84
Rpl15protein synth.AT3G2592018.0119.0819.072.102.08
FTSH5photosynthesisAT5G4227022.1123.1222.932.021.77
LHCb1.5photosynthesisAT2G3442021.3422.1123.951.716.11
Tic62TICAT3G1889021.2722.2222.581.932.48
LOX2JA synth.AT3G4514021.0921.2022.241.072.22
unknown AT3G6187019.6020.0820.751.402.22
PetE2photosynthesisAT1G2034022.1222.1123.270.992.21
PsaE1photosynthesisAT4G2875023.6124.1424.701.452.14
cpATPδphotosynthesisAT4G0965021.7522.1722.841.342.14
OE33photosynthesisAT3G5082022.1523.1023.211.922.08
unknown AT5G3736018.5918.7819.611.142.03
LHCa4photosynthesisAT3G4747024.3523.1623.330.440.49
GAPbmetabolismAT1G4297021.9921.4620.890.690.47
PrxBregulationAT5G0629021.5320.1920.400.390.46
PsaFphotosynthesisAT1G3133025.8424.8924.680.520.45
Ef-Tsprotein synth.AT4G2906019.0219.1317.821.080.44
Trx-M1regulationAT1G0368019.5418.5818.300.520.43
GAPametabolismAT3G2665023.4822.9422.230.680.42
GLU1metabolismAT5G0414020.8120.4019.380.750.37
Psb27photosynthesisAT1G0360022.3021.2622.320.491.01
PsbSphotosynthesisAT1G4457524.2723.2223.530.480.60
PsaLphotosynthesisAT4G1280024.0422.9223.320.460.61
GLN2metabolismAT5G3563022.2621.1421.620.460.64
NADP-MDHmetabolismAT5G5833018.9517.7518.470.440.72
LHCa3photosynthesisAT1G6152025.1923.9424.190.420.50
PsbLphotosynthesisATCG0056021.1216.7520.910.050.86
Table 2. Comparison of protein changes in chloroplasts isolated from young (10 days; [84]) and older plants (21 days; present study). Given are the name, the accession number, the reported fold change for chloroplasts from 10-day old plants (ppi1/wild-type), the LFQ (log2) observed here for the same proteins and the fold change of the LFQ for toc64-1 and ppi1 when compared to the wild type (wt). n.d.: not detected. Fold-change values >1.5 are marked in red.
NameAccessionFC [84]log2(LFQ)FC (LFQ)
wttoc64-1ppi1toc64-1ppi1
HSP90 homologAt2g040302.4/1.819.96n.d.19.97n.d.1.00
Chaperonin 60βAt1g554901.9/1.621.9222.5622.091.571.13
At3g13470n.d.n.d.n.d.n.d.n.d.
HSP70 homologAt4g242801.819.7120.8219.922.161.16
At5g49910n.d.n.d.n.d.n.d.n.d.
PPIaseAt3g620301.821.0620.6720.510.770.68
EF-Tu homologAt4g203601.722.7422.3322.580.750.90
Chaperonin 60αAt2g280001.621.5922.0321.891.361.23
R-5-P isomeraseAt3g047900.6/0.519.37n.d.19.91n.d.1.45
LHCb5At4g103400.625.8225.6526.300.891.39
LHCII type 1At1g299100.625.8525.5826.660.831.74
At1g29920
At1g29930
At2g3442021.3422.1223.951.726.11
OE23At1g066800.624.8225.2725.191.371.29
OE33At3g508200.6/0.522.1523.1123.211.932.08
At5g6657025.0325.6625.881.551.79
SSUAt1g670900.423.6223.3723.480.850.91
The proteome of chloroplasts isolated from toc64-1 plants shows distinct alterations when compared to the wild type and ppi1 (Figure 3 and Figure 6; toc64-1 panel). The observed changes in protein abundance again are centered around PSI or PSII, which is consistent with the reduced photosynthetic performance of the mutant. However, we did not find PS components, but many regulatory factors with higher abundance (HHL1, RBD1, Lil3.1, Trx-m1, Cyp38, FNR, TROL, FTSH5; Figure 6; [72,73,74,75,85,89,90,91,92]). In toc64-1, the five PS components with altered abundance are all reduced (Figure 3; Table 1). As for ppi1, the other mostly downregulated proteins are linked to the action of ferredoxin and FNR: GLN2, MDH, TRX-m1 and PrxB (Figure 6).

