Takeaways from Mobile DNA Barcoding with BentoLab and MinION


Abstract
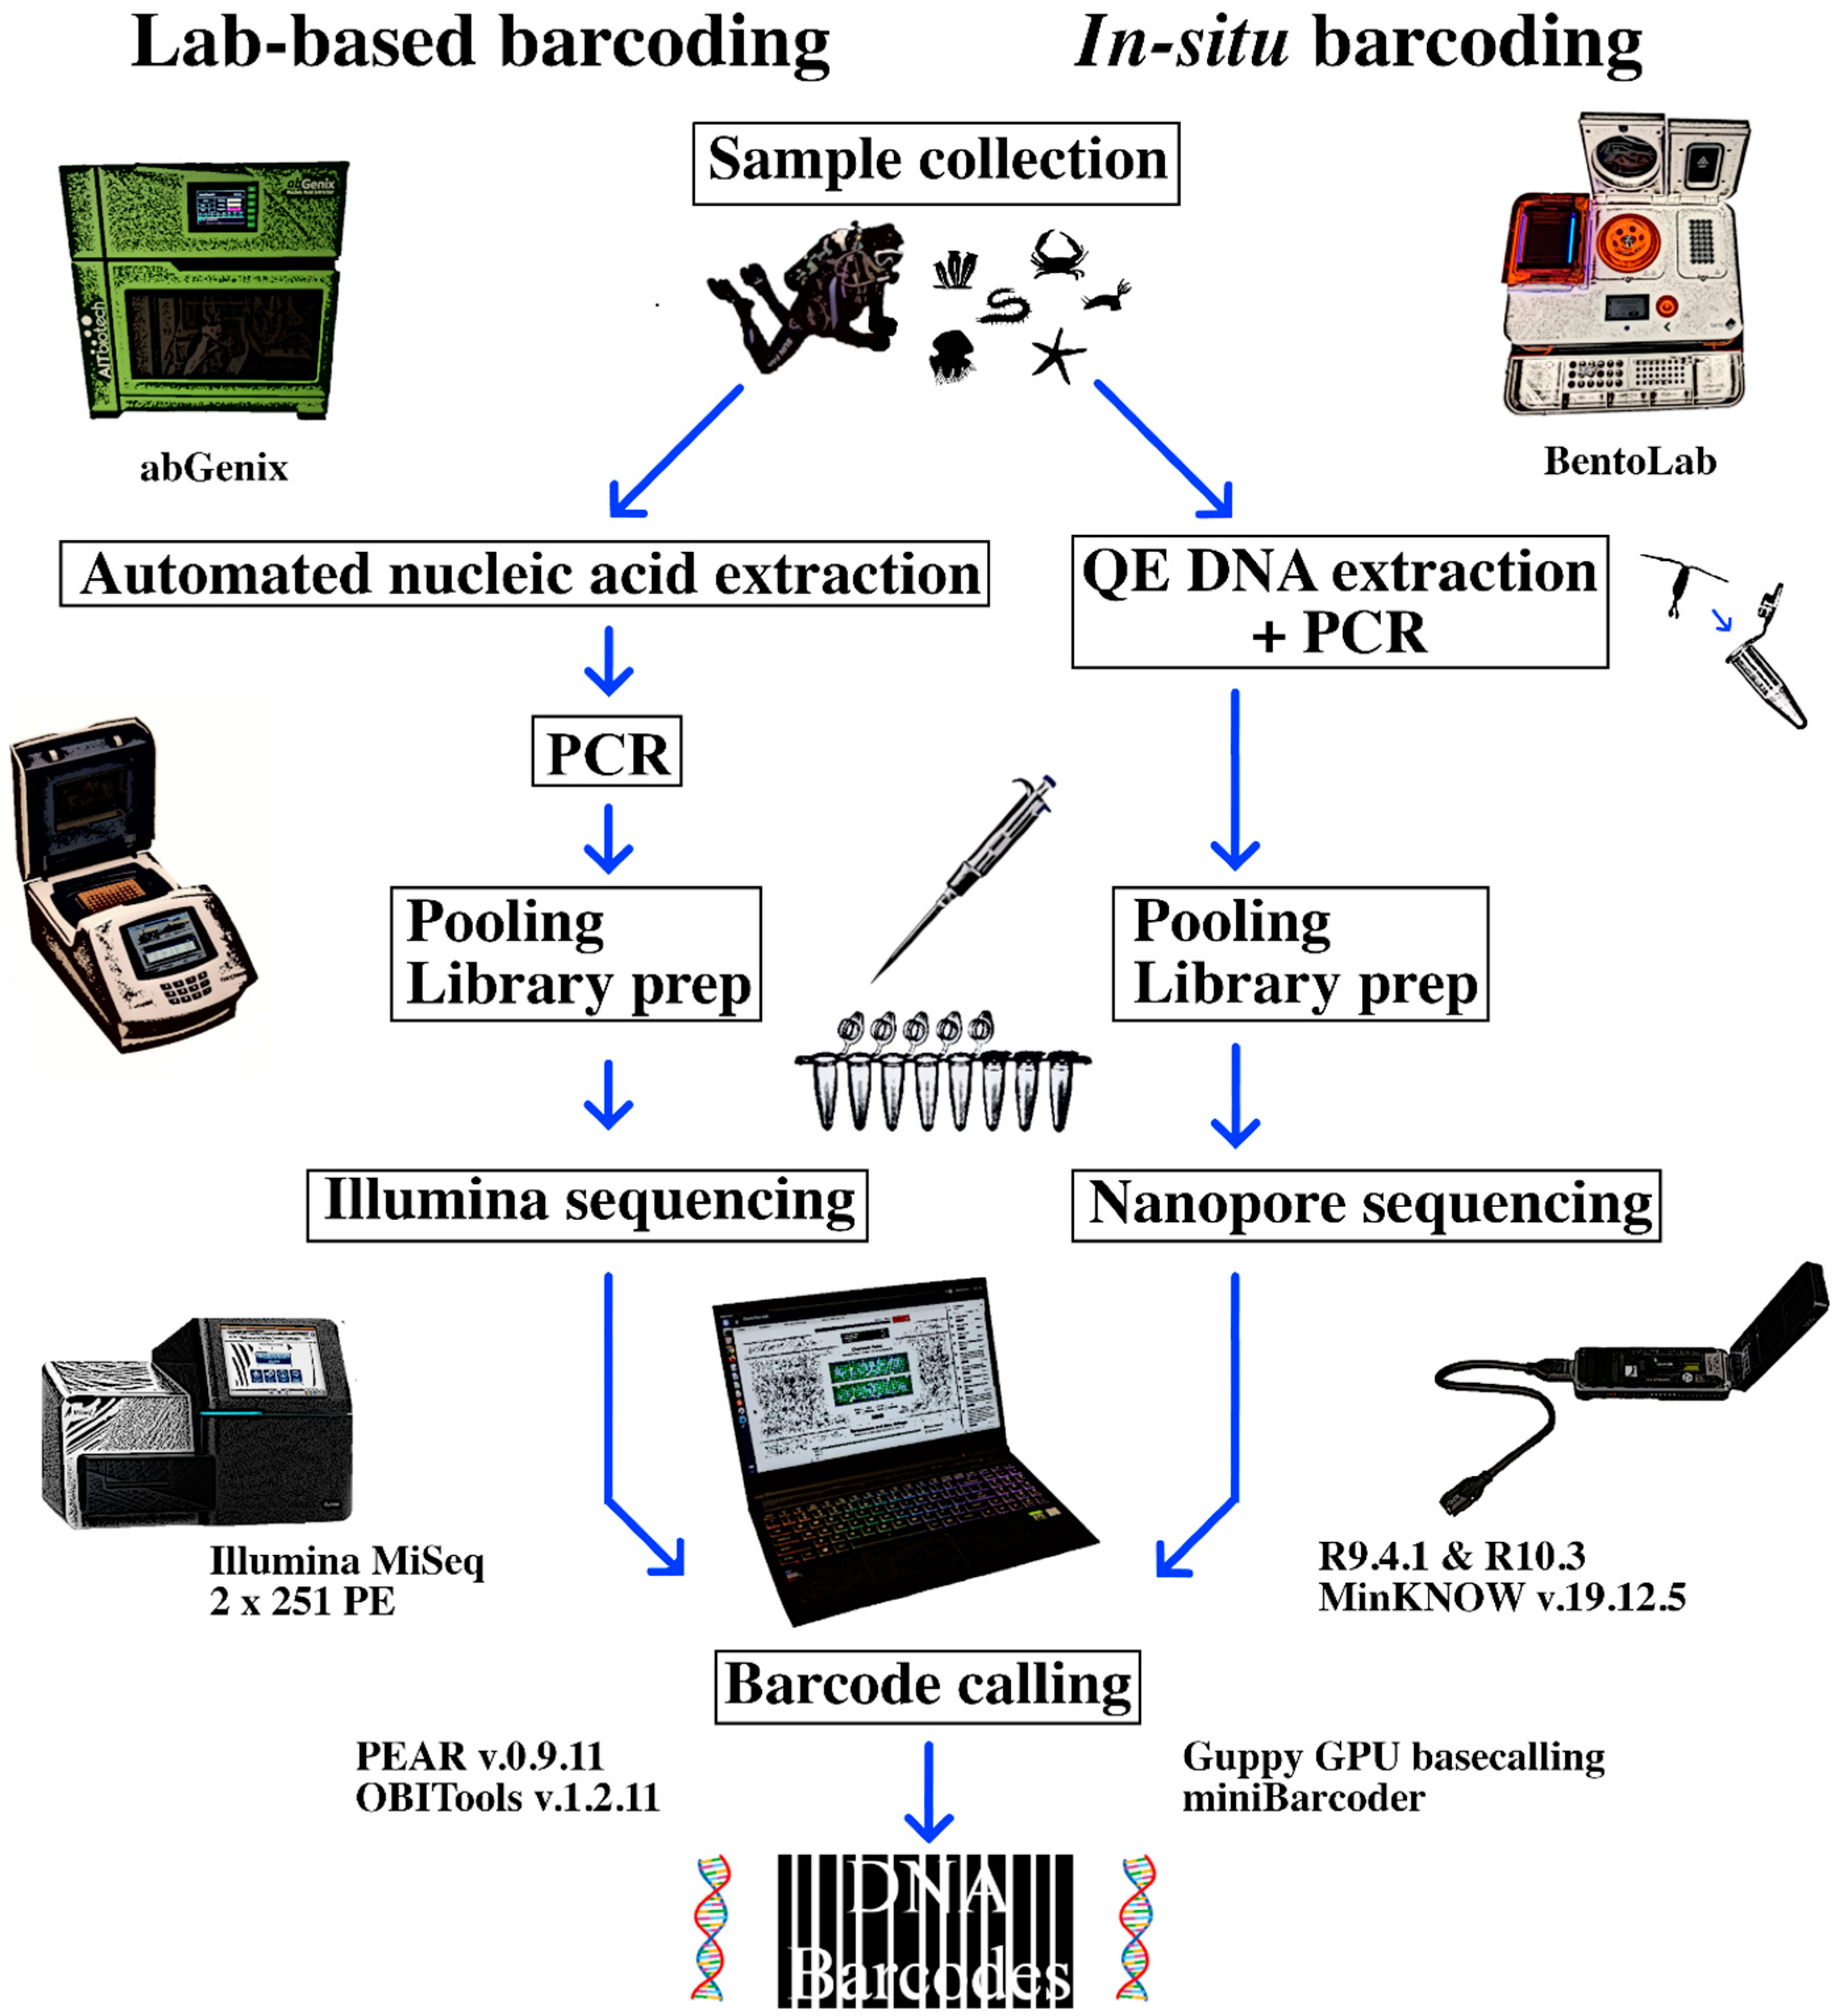
1. Introduction
2. Materials and Methods
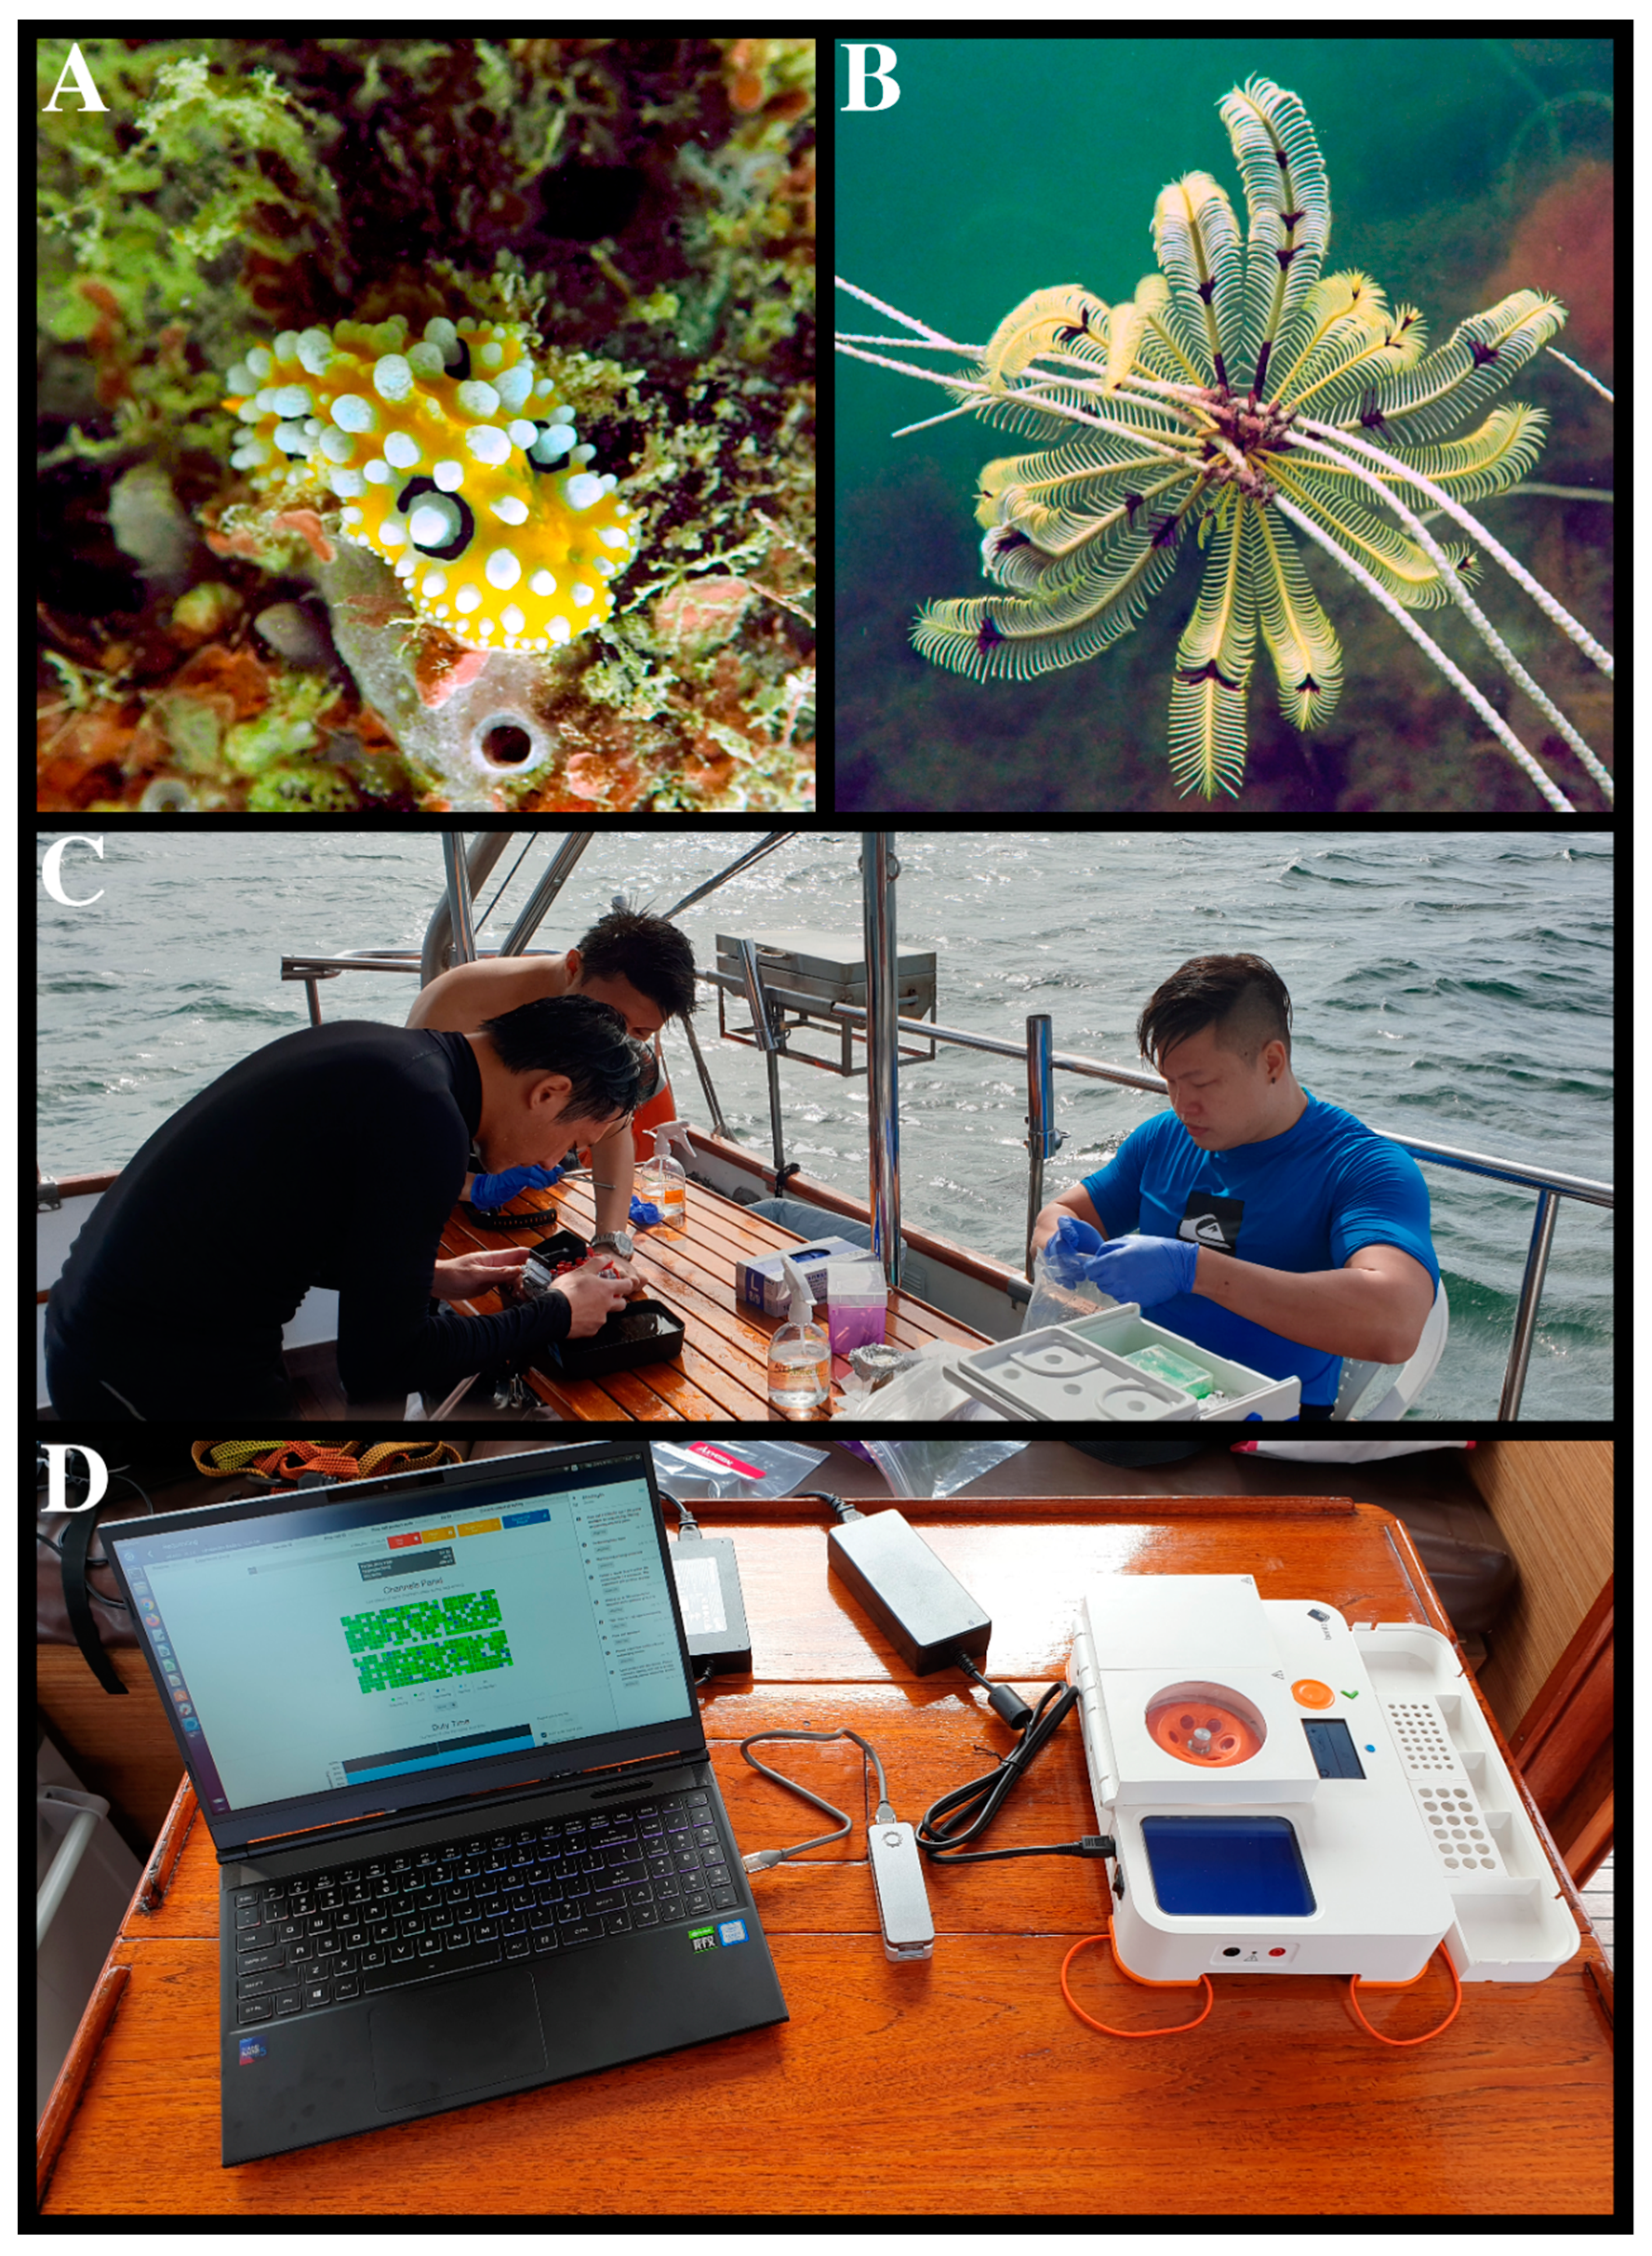
2.1. Sample Collection
2.2. Illumina NGS Barcoding as Reference
2.3. Laboratory BentoLab Extraction and Amplification
2.4. Field Sequencing with BentoLab and MinION
2.5. MinION Bioinformatics
2.6. Assessing MinION Barcode Accuracy and Quality
3. Results
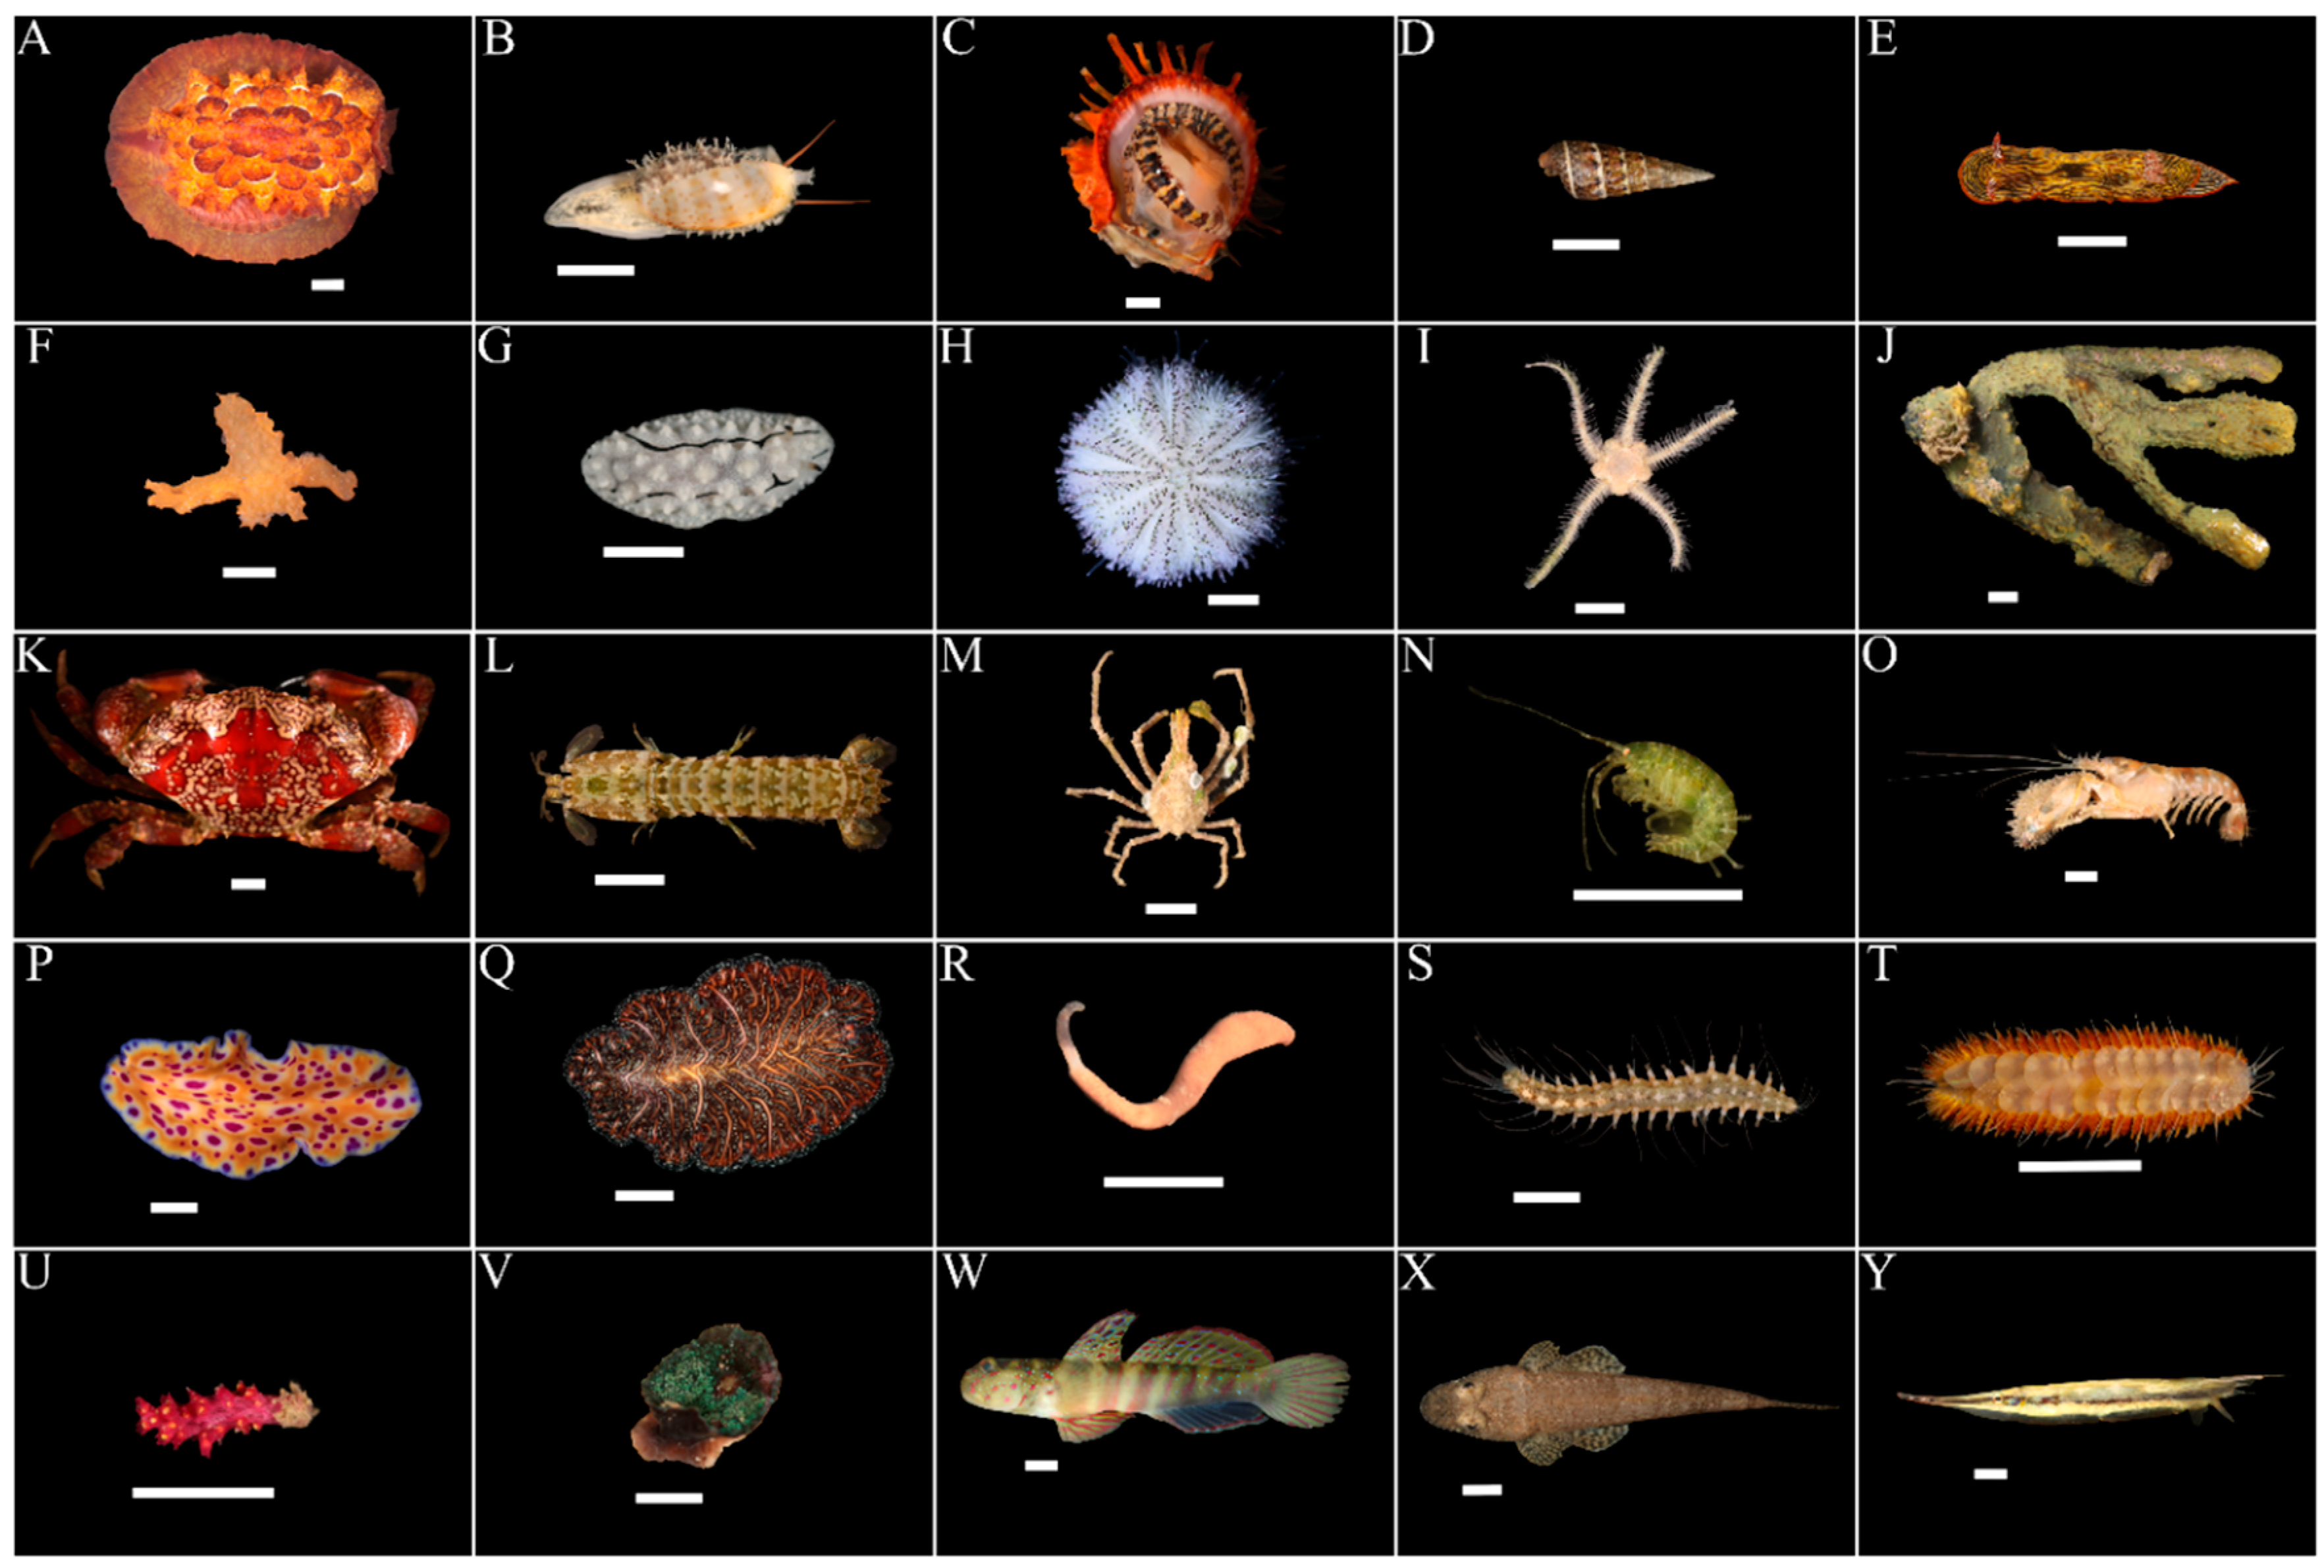
3.1. Marine Faunal Diversity
3.2. Gene Amplification
3.3. Barcode Calling
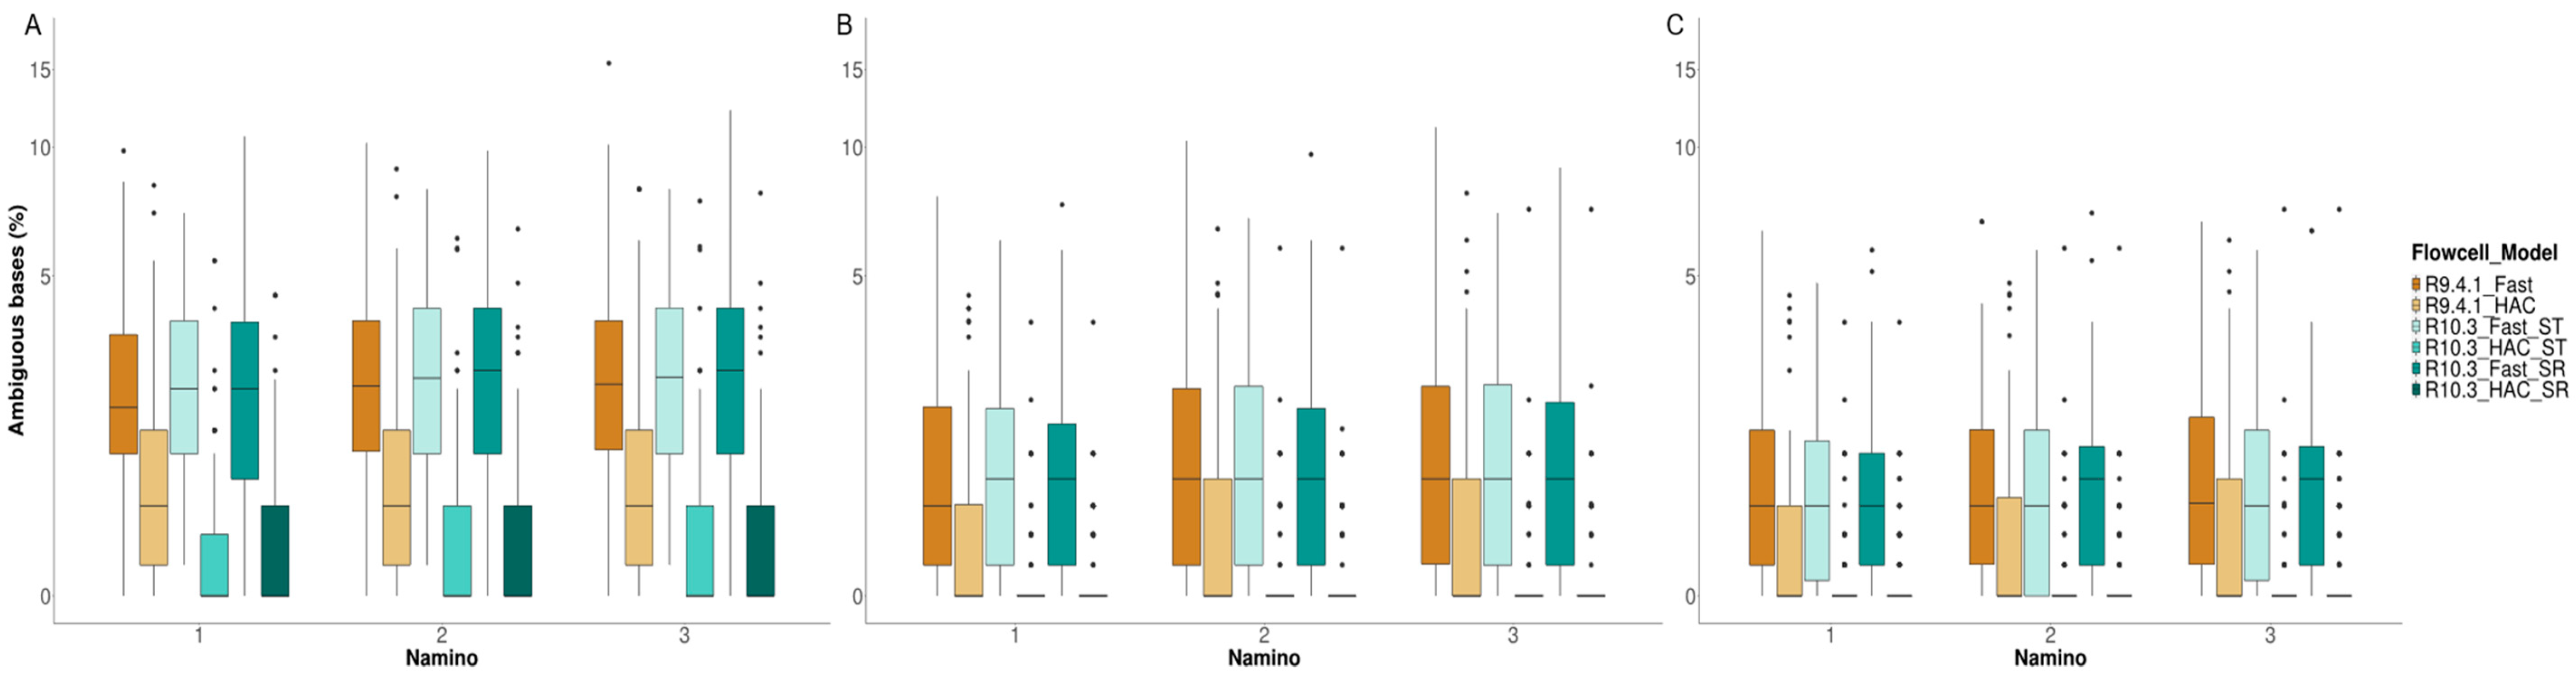
3.4. MinION Barcode Assessment
3.5. DNA Barcodes and Species Diversity
4. Discussion
4.1. Takeaway #1: Portability and Productivity
4.2. Takeaway #2: Operational Costs
4.3. Takeaway #3: Flow Cell Chemistry and Basecalling Model
5. Conclusions
Supplementary Materials
Author Contributions
Funding
Acknowledgments
Conflicts of Interest
References
- Hebert, P.D.N.; Cywinska, A.; Ball, S.L.; deWaard, J.R. Biological identifications through DNA barcodes. Proc. R. Soc. Lond. Ser. B Biol. Sci. 2003, 270, 313–321. [Google Scholar] [CrossRef] [PubMed]
- Hebert, P.D.N.; Ratnasingham, S.; de Waard, J.R. Barcoding animal life: Cytochrome c oxidase subunit 1 divergences among closely related species. Proc. Biol. Sci. 2003, 270, S96–S969. [Google Scholar] [CrossRef] [PubMed]
- Ward, R.D.; Zemlak, T.S.; Innes, B.H.; Last, P.R.; Hebert, P.D.N. DNA barcoding Australia’s fish species. Philos. Trans. R. Soc. B Biol. Sci. 2005, 360, 1847–1857. [Google Scholar] [CrossRef] [PubMed]
- Hebert, P.D.N.; Stoeckle, M.Y.; Zemlak, T.S.; Francis, C.M. Identification of birds through DNA Barcodes. PLoS Biol. 2004, 2, e312. [Google Scholar] [CrossRef] [PubMed]
- Poquita-Du, R.; Ng, C.S.L.; Loo, J.B.; Afiq-Rosli, L.; Tay, Y.C.; Todd, P.; Chou, L.M.; Huang, D. New evidence shows that Pocillopora “damicornis-like” corals in Singapore are actually Pocillopora acuta (Scleractinia: Pocilloporidae). Biodivers. Data J. 2017, 5, e11407. [Google Scholar] [CrossRef]
- Hebert, P.D.N.; Penton, E.H.; Burns, J.M.; Janzen, D.H.; Hallwachs, W. Ten species in one: DNA barcoding reveals cryptic species in the neotropical skipper butterfly Astraptes fulgerator. Proc. Natl. Acad. Sci. USA 2004, 101, 14812–14817. [Google Scholar] [CrossRef]
- Bucklin, A.; Steinke, D.; Blanco-Bercial, L. DNA barcoding of marine metazoa. Ann. Rev. Mar. Sci. 2011, 3, 471–508. [Google Scholar] [CrossRef]
- Hajibabaei, M.; Singer, G.A.C.; Hebert, P.D.N.; Hickey, D.A. DNA barcoding: How it complements taxonomy, molecular phylogenetics and population genetics. Trends Genet. 2007, 23, 167–172. [Google Scholar] [CrossRef]
- Bickford, D.; Lohman, D.J.; Sodhi, N.S.; Ng, P.K.L.; Meier, R.; Winker, K.; Ingram, K.K.; Das, I. Cryptic species as a window on diversity and conservation. Trends Ecol. Evol. 2007, 22, 148–155. [Google Scholar] [CrossRef]
- Chang, J.J.M.; Tay, Y.C.; Ang, H.P.; Tun, K.P.P.; Chou, L.M.; Meier, R.; Huang, D. Molecular and anatomical analyses reveal that Peronia verruculata (Gastropoda: Onchidiidae) is a cryptic species complex. Contrib. Zool. 2018, 87, 149–165. [Google Scholar] [CrossRef]
- Yip, Z.T.; Quek, R.Z.B.; Huang, D. Historical biogeography of the widespread macroalga Sargassum (Fucales, Phaeophyceae). J. Phycol. 2020, 56, 300–309. [Google Scholar] [CrossRef] [PubMed]
- Ng, C.S.L.; Jain, S.S.; Nguyen, N.T.H.; Sam, S.Q.; Kikuzawa, Y.P.; Chou, L.M.; Huang, D. New genus and species record of reef coral Micromussa amakusensis in the southern South China Sea. Mar. Biodivers. Rec. 2019, 12. [Google Scholar] [CrossRef]
- Oh, R.M.; Neo, M.L.; Wei Liang Yap, N.; Jain, S.S.; Tan, R.; Chen, C.A.; Huang, D. Citizen science meets integrated taxonomy to uncover the diversity and distribution of Corallimorpharia in Singapore. Raffles Bull. Zool. 2019, 67, 306–321. [Google Scholar]
- Shokralla, S.; Gibson, J.F.; Nikbakht, H.; Janzen, D.H.; Hallwachs, W.; Hajibabaei, M. Next-generation DNA barcoding: Using next-generation sequencing to enhance and accelerate DNA barcode capture from single specimens. Mol. Ecol. Resour. 2014, 14, 892–901. [Google Scholar] [CrossRef] [PubMed]
- Meier, R.; Wong, W.; Srivathsan, A.; Foo, M. $1 DNA barcodes for reconstructing complex phenomes and finding rare species in specimen-rich samples. Cladistics 2016, 32, 100–110. [Google Scholar] [CrossRef]
- Taberlet, P.; Coissac, E.; Pompanon, F.; Brochmann, C.; Willerslev, E. Towards next-generation biodiversity assessment using DNA metabarcoding. Mol. Ecol. 2012, 21, 2045–2050. [Google Scholar] [CrossRef]
- Cruaud, P.; Rasplus, J.Y.; Rodriguez, L.J.; Cruaud, A. High-throughput sequencing of multiple amplicons for barcoding and integrative taxonomy. Sci. Rep. 2017, 7, 41948. [Google Scholar] [CrossRef]
- Mikheyev, A.S.; Tin, M.M.Y. A first look at the Oxford Nanopore MinION sequencer. Mol. Ecol. Resour. 2014, 14, 1097–1102. [Google Scholar] [CrossRef]
- Gowers, G.O.F.; Vince, O.; Charles, J.H.; Klarenberg, I.; Ellis, T.; Edwards, A. Entirely Off-Grid and Solar-Powered DNA Sequencing of Microbial Communities during an Ice Cap Traverse Expedition. Genes 2019, 10, 902. [Google Scholar] [CrossRef]
- Pomerantz, A.; Peñafiel, N.; Arteaga, A.; Bustamante, L.; Pichardo, F.; Coloma, L.A.; Barrio-Amorós, C.L.; Salazar-Valenzuela, D.; Prost, S. Real-time DNA barcoding in a rainforest using nanopore sequencing: Opportunities for rapid biodiversity assessments and local capacity building. GigaScience 2018, 7. [Google Scholar] [CrossRef]
- Krehenwinkel, H.; Pomerantz, A.; Henderson, J.B.; Kennedy, S.R.; Lim, J.Y.; Swamy, V.; Shoobridge, J.D.; Graham, N.; Patel, N.H.; Gillespie, R.G.; et al. Nanopore sequencing of long ribosomal DNA amplicons enables portable and simple biodiversity assessments with high phylogenetic resolution across broad taxonomic scale. Gigascience 2019, 8. [Google Scholar] [CrossRef] [PubMed]
- Boykin, L.M.; Sseruwagi, P.; Alicai, T.; Ateka, E.; Mohammed, I.U.; Stanton, J.A.L.; Kayuki, C.; Mark, D.; Fute, T.; Erasto, J.; et al. Tree Lab: Portable genomics for Early Detection of Plant Viruses and Pests in Sub-Saharan Africa. Genes 2019, 10, 632. [Google Scholar] [CrossRef] [PubMed]
- Burton, A.S.; Stahl, S.E.; John, K.K.; Jain, M.; Juul, S.; Turner, D.J.; Harrington, E.D.; Stoddart, D.; Paten, B.; Akeson, M.; et al. Off Earth Identification of Bacterial Populations Using 16S rDNA Nanopore Sequencing. Genes 2020, 11, 76. [Google Scholar] [CrossRef] [PubMed]
- Mbala-Kingebeni, P.; Villabona-Arenas, C.J.; Vidal, N.; Likofata, J.; Nsio-Mbeta, J.; Makiala-Mandanda, S.; Mukadi, D.; Mukadi, P.; Kumakamba, C.; Djokolo, B.; et al. Rapid Confirmation of the Zaire Ebola Virus in the Outbreak of the Equateur Province in the Democratic Republic of Congo: Implications for Public Health Interventions. Clin. Infect. Dis. 2019, 68, 330–333. [Google Scholar] [CrossRef] [PubMed]
- Quick, J.; Loman, N.J.; Duraffour, S.; Simpson, J.T.; Severi, E.; Cowley, L.; Bore, J.A.; Koundouno, R.; Dudas, G.; Mikhail, A.; et al. Real-time, portable genome sequencing for Ebola surveillance. Nature 2016, 530, 228–232. [Google Scholar] [CrossRef] [PubMed]
- Hoenen, T.; Groseth, A.; Rosenke, K.; Fischer, R.J.; Hoenen, A.; Judson, S.D.; Martellaro, C.; Falzarano, D.; Marzi, A.; Squires, R.B.; et al. Nanopore Sequencing as a Rapidly Deployable Ebola Outbreak Tool. Emerg. Infect. Dis. 2016, 22, 331–334. [Google Scholar] [CrossRef]
- James, P.; Stoddart, D.; Harrington, E.D.; Beaulaurier, J.; Ly, L.; Reid, S.; Turner, D.J.; Juul, S. LamPORE: Rapid, accurate and highly scalable molecular screening for SARS-CoV-2 infection, based on nanopore sequencing. medRxiv 2020. [Google Scholar] [CrossRef]
- Wang, M.; Fu, A.; Hu, B.; Tong, Y.; Liu, R.; Liu, Z.; Gu, J.; Xiang, B.; Liu, J.; Jiang, W.; et al. Nanopore Targeted Sequencing for the Accurate and Comprehensive Detection of SARS-CoV-2 and Other Respiratory Viruses. Small 2020, 16, e2002169. [Google Scholar] [CrossRef]
- Chan, W.; Ip, J.D.; Chu, A.W.; Yip, C.C.; Lo, L.; Chan, K.; Ng, A.C.; Poon, R.W.; To, W.; Tsang, O.T.; et al. Identification of nsp1 gene as the target of SARS-CoV-2 real-time RT-PCR using nanopore whole-genome sequencing. J. Med Virol. 2020. [Google Scholar] [CrossRef]
- Menegon, M.; Cantaloni, C.; Rodriguez-Prieto, A.; Centomo, C.; Abdelfattah, A.; Rossato, M.; Bernardi, M.; Xumerle, L.; Loader, S.; Delledonne, M. On site DNA barcoding by nanopore sequencing. PLoS ONE 2017, 12, e0184741. [Google Scholar] [CrossRef]
- Maestri, S.; Cosentino, E.; Paterno, M.; Freitag, H.; Garces, J.M.; Marcolungo, L.; Alfano, M.; Njunjić, I.; Schilthuizen, M.; Slik, F.; et al. A Rapid and Accurate MinION-Based Workflow for Tracking Species Biodiversity in the Field. Genes 2019, 10, 468. [Google Scholar] [CrossRef] [PubMed]
- Knot, I.E.; Zouganelis, G.D.; Weedall, G.D.; Wich, S.A.; Rae, R. DNA Barcoding of Nematodes Using the MinION. Front. Ecol. Evol. 2020, 8. [Google Scholar] [CrossRef]
- Bento Lab. Available online: https://www.nature.com/articles/nbt0516-455#rightslink (accessed on 23 September 2020).
- Zaaijer, S.; Gordon, A.; Speyer, D.; Piccone, R.; Groen, S.C.; Erlich, Y. Rapid re-identification of human samples using portable DNA sequencing. Elife 2017, 6. [Google Scholar] [CrossRef]
- Srivathsan, A.; Hartop, E.; Puniamoorthy, J.; Lee, W.T.; Kutty, S.N.; Kurina, O.; Meier, R. Rapid, large-scale species discovery in hyperdiverse taxa using 1D MinION sequencing. BMC Biol. 2019, 17, 96. [Google Scholar] [CrossRef]
- Srivathsan, A.; Baloğlu, B.; Wang, W.; Tan, W.X.; Bertrand, D.; Ng, A.H.Q.; Boey, E.J.H.; Koh, J.J.Y.; Nagarajan, N.; Meier, R. A MinIONTM-based pipeline for fast and cost-effective DNA barcoding. Mol. Ecol. Resour. 2018, 18, 1035–1049. [Google Scholar] [CrossRef] [PubMed]
- Chang, J.J.M.; Ip, Y.C.A.; Bauman, A.G.; Huang, D. MinION-in-ARMS: Nanopore Sequencing to Expedite Barcoding of Specimen-Rich Macrofaunal Samples from Autonomous Reef Monitoring Structures. Front. Mar. Sci. 2020, 7, 448. [Google Scholar] [CrossRef]
- Lim, L.J.W.; Loh, J.B.Y.; Lim, A.J.S.; Tan, B.Y.X.; Ip, Y.C.A.; Neo, M.L.; Tan, R.; Huang, D. Diversity and distribution of intertidal marine species in Singapore. Raffles Bull. Zool. 2020, 68, 396–403. [Google Scholar]
- Ip, Y.C.A.; Tay, Y.C.; Gan, S.X.; Ang, H.P.; Tun, K.; Chou, L.M.; Huang, D.; Meier, R. From marine park to future genomic observatory? Enhancing marine biodiversity assessments using a biocode approach. Biodivers. Data J. 2019, 7, e46833. [Google Scholar] [CrossRef] [PubMed]
- Leray, M.; Yang, J.Y.; Meyer, C.P.; Mills, S.C.; Agudelo, N.; Ranwez, V.; Boehm, J.T.; Machida, R.J. A new versatile primer set targeting a short fragment of the mitochondrial COI region for metabarcoding metazoan diversity: Application for characterizing coral reef fish gut contents. Front. Zool. 2013, 10, 34. [Google Scholar] [CrossRef]
- Lobo, J.; Costa, P.M.; Teixeira, M.A.L.; Ferreira, M.S.G.; Costa, M.H.; Costa, F.O. Enhanced primers for amplification of DNA barcodes from a broad range of marine metazoans. BMC Ecol. 2013, 13, 34. [Google Scholar] [CrossRef]
- Geller, J.; Meyer, C.; Parker, M.; Hawk, H. Redesign of PCR primers for mitochondrial cytochrome c oxidase subunit I for marine invertebrates and application in all-taxa biotic surveys. Mol. Ecol. Resour. 2013, 13, 851–861. [Google Scholar] [CrossRef] [PubMed]
- Sze, Y.; Miranda, L.N.; Sin, T.M.; Huang, D. Characterizing planktonic dinoflagellate diversity in Singapore using DNA metabarcoding. Metabarcoding Metagenom. 2018, 2, e25136. [Google Scholar] [CrossRef]
- Leveque, S.; Afiq-Rosli, L.; Ip, Y.C.A.; Jain, S.S.; Huang, D. Searching for phylogenetic patterns of Symbiodiniaceae community structure among Indo-Pacific Merulinidae corals. PeerJ 2019, 7, e7669. [Google Scholar] [CrossRef] [PubMed]
- Zhang, J.; Kobert, K.; Flouri, T.; Stamatakis, A. PEAR: A fast and accurate Illumina Paired-End reAd mergeR. Bioinformatics 2014, 30, 614–620. [Google Scholar] [CrossRef]
- Boyer, F.; Mercier, C.; Bonin, A.; Le Bras, Y.; Taberlet, P.; Coissac, E. obitools: A unix-inspired software package for DNA metabarcoding. Mol. Ecol. Resour. 2016, 16, 176–182. [Google Scholar] [CrossRef]
- Wang, W.Y.; Srivathsan, A.; Foo, M.; Yamane, S.K.; Meier, R. Sorting specimen-rich invertebrate samples with cost-effective NGS barcodes: Validating a reverse workflow for specimen processing. Mol. Ecol. Resour. 2018, 18, 490–501. [Google Scholar] [CrossRef]
- Kearse, M.; Moir, R.; Wilson, A.; Stones-Havas, S.; Cheung, M.; Sturrock, S.; Buxton, S.; Cooper, A.; Markowitz, S.; Duran, C.; et al. Geneious Basic: An integrated and extendable desktop software platform for the organization and analysis of sequence data. Bioinformatics 2012, 28, 1647–1649. [Google Scholar] [CrossRef]
- Kranzfelder, P.; Ekrem, T.; Stur, E. Trace DNA from insect skins: A comparison of five extraction protocols and direct PCR on chironomid pupal exuviae. Mol. Ecol. Resour. 2016, 16, 353–363. [Google Scholar] [CrossRef]
- Kranzfelder, P.; Ekrem, T.; Stur, E. DNA Barcoding for Species Identification of Insect Skins: A Test on Chironomidae (Diptera) Pupal Exuviae. J. Insect Sci. 2017, 17. [Google Scholar] [CrossRef]
- Ho, J.K.I.; Foo, M.S.; Yeo, D.; Meier, R. The other 99%: Exploring the arthropod species diversity of Bukit Timah Nature Reserve, Singapore. Gard. Bull. Singap. 2019, 71, 391–417. [Google Scholar] [CrossRef]
- Gan, S.X.; Tay, Y.C.; Huang, D. Effects of macroalgal morphology on marine epifaunal diversity. J. Mar. Biol. Assoc. UK 2019, 99, 1697–1707. [Google Scholar] [CrossRef]
- Krehenwinkel, H.; Pomerantz, A.; Prost, S. Genetic Biomonitoring and Biodiversity Assessment Using Portable Sequencing Technologies: Current Uses and Future Directions. Genes 2019, 10, 858. [Google Scholar] [CrossRef] [PubMed]
- Kreader, C.A. Relief of amplification inhibition in PCR with bovine serum albumin or T4 gene 32 protein. Appl. Environ. Microbiol. 1996, 62, 1102–1106. [Google Scholar] [CrossRef] [PubMed]
- Pearson, W.R. Rapid and sensitive sequence comparison with FASTP and FASTA. Methods Enzymol. 1990, 183, 63–98. [Google Scholar] [PubMed]
- Katoh, K.; Standley, D.M. MAFFT multiple sequence alignment software version 7: Improvements in performance and usability. Mol. Biol. Evol. 2013, 30, 772–780. [Google Scholar] [CrossRef] [PubMed]
- Sović, I.; Šikić, M.; Wilm, A.; Fenlon, S.N.; Chen, S.; Nagarajan, N. Fast and sensitive mapping of nanopore sequencing reads with GraphMap. Nat. Commun. 2016, 7, 11307. [Google Scholar] [CrossRef]
- Vaser, R.; Sović, I.; Nagarajan, N.; Šikić, M. Fast and accurate de novo genome assembly from long uncorrected reads. Genome Res. 2017, 27, 737–746. [Google Scholar] [CrossRef]
- Shen, W.; Le, S.; Li, Y.; Hu, F. SeqKit: A Cross-Platform and Ultrafast Toolkit for FASTA/Q File Manipulation. PLoS ONE 2016, 11, e0163962. [Google Scholar] [CrossRef]
- Tange, O. GNG Parallel the command-line power tool. USENIX Mag. 2011, 36, 42–47. [Google Scholar]
- Camacho, C.; Coulouris, G.; Avagyan, V.; Ma, N.; Papadopoulos, J.; Bealer, K.; Madden, T.L. BLAST: Architecture and applications. BMC Bioinform. 2009, 10, 421. [Google Scholar] [CrossRef]
- Srivathsan, A.; Sha, J.C.M.; Vogler, A.P.; Meier, R. Comparing the effectiveness of metagenomics and metabarcoding for diet analysis of a leaf-feeding monkey (Pygathrix nemaeus). Mol. Ecol. Resour. 2015, 15, 250–261. [Google Scholar] [CrossRef] [PubMed]
- Jain, M.; Koren, S.; Miga, K.H.; Quick, J.; Rand, A.C.; Sasani, T.A.; Tyson, J.R.; Beggs, A.D.; Dilthey, A.T.; Fiddes, I.T.; et al. Nanopore sequencing and assembly of a human genome with ultra-long reads. Nat. Biotechnol. 2018, 36, 338–345. [Google Scholar] [CrossRef] [PubMed]
- Cretu Stancu, M.; van Roosmalen, M.J.; Renkens, I.; Nieboer, M.M.; Middelkamp, S.; de Ligt, J.; Pregno, G.; Giachino, D.; Mandrile, G.; Espejo Valle-Inclan, J.; et al. Mapping and phasing of structural variation in patient genomes using nanopore sequencing. Nat. Commun. 2017, 8, 1326. [Google Scholar] [CrossRef] [PubMed]
- Rang, F.J.; Kloosterman, W.P.; de Ridder, J. From squiggle to basepair: Computational approaches for improving nanopore sequencing read accuracy. Genome Biol. 2018, 19, 90. [Google Scholar] [CrossRef] [PubMed]
- Beck, T.F.; Mullikin, J.C. NISC Comparative Sequencing Program. Systematic Evaluation of Sanger Validation of Next-Generation Sequencing Variants. Clin. Chem. 2016, 62, 647–654. [Google Scholar] [CrossRef] [PubMed]
- Baudhuin, L.M.; Lagerstedt, S.A.; Klee, E.W.; Fadra, N.; Oglesbee, D.; Ferber, M.J. Confirming Variants in Next-Generation Sequencing Panel Testing by Sanger Sequencing. J. Mol. Diagn. 2015, 17, 456–461. [Google Scholar] [CrossRef]
- Kurtz, S.; Phillippy, A.; Delcher, A.L.; Smoot, M.; Shumway, M.; Antonescu, C.; Salzberg, S.L. Versatile and open software for comparing large genomes. Genome Biol. 2004, 5, R12. [Google Scholar] [CrossRef]
- Wickham, H. ggplot2: Elegant Graphics for Data Analysis; Springer: New York, NY, USA, 2016; ISBN 9783319242774. [Google Scholar]
- Ho, J.K.I.; Puniamoorthy, J.; Srivathsan, A.; Meier, R. MinION sequencing of seafood in Singapore reveals creatively labelled flatfishes, confused roe, pig DNA in squid balls, and phantom crustaceans. Food Control 2020, 112, 107144. [Google Scholar] [CrossRef]
- Meier, R.; Shiyang, K.; Vaidya, G.; Ng, P.K.L. DNA barcoding and taxonomy in Diptera: A tale of high intraspecific variability and low identification success. Syst. Biol. 2006, 55, 715–728. [Google Scholar] [CrossRef]
- Srivathsan, A.; Meier, R. On the inappropriate use of Kimura-2-parameter (K2P) divergences in the DNA-barcoding literature. Cladistics 2012, 28, 190–194. [Google Scholar] [CrossRef]
- Seah, A.; Lim, M.C.W.; McAloose, D.; Prost, S.; Seimon, T.A. MinION-Based DNA Barcoding of Preserved and Non-Invasively Collected Wildlife Samples. Genes 2020, 11, 445. [Google Scholar] [CrossRef] [PubMed]
- Watsa, M.; Erkenswick, G.A.; Pomerantz, A.; Prost, S. Portable sequencing as a teaching tool in conservation and biodiversity research. PLoS Biol. 2020, 18, e3000667. [Google Scholar] [CrossRef] [PubMed]
- Veldman, S.; Otieno, J.; Gravendeel, B.; van Andel, T.; de Boer, H. Conservation of Endangered Wild Harvested Medicinal Plants: Use of DNA Barcoding. In Novel Plant Bioresources; John Wiley & Sons, Ltd: Hoboken, NZ, USA, 2014; pp. 81–88. [Google Scholar]
- Wainwright, B.J.; Ip, Y.C.A.; Neo, M.L.; Chang, J.J.M.; Gan, C.Z.; Clark-Shen, N.; Huang, D.; Rao, M. DNA barcoding of traded shark fins, meat and mobulid gill plates in Singapore uncovers numerous threatened species. Conserv. Genet. 2018, 19, 1393–1399. [Google Scholar] [CrossRef]
- Collins, R.A.; Armstrong, K.F.; Meier, R.; Yi, Y.; Brown, S.D.J.; Cruickshank, R.H.; Keeling, S.; Johnston, C. Barcoding and border biosecurity: Identifying cyprinid fishes in the aquarium trade. PLoS ONE 2012, 7, e28381. [Google Scholar] [CrossRef] [PubMed]
- Voorhuijzen-Harink, M.M.; Hagelaar, R.; van Dijk, J.P.; Prins, T.W.; Kok, E.J.; Staats, M. Toward on-site food authentication using nanopore sequencing. Food Chem. X 2019, 2, 100035. [Google Scholar] [CrossRef] [PubMed]
- Bhamla, M.S.; Saad Bhamla, M.; Benson, B.; Chai, C.; Katsikis, G.; Johri, A.; Prakash, M. Hand-powered ultralow-cost paper centrifuge. Nat. Biomed. Eng. 2017, 1, 1–7. [Google Scholar] [CrossRef]
- Sule, S.S.; Petsiuk, A.L.; Pearce, J.M. Open Source Completely 3-D Printable Centrifuge. Instruments 2019, 3, 30. [Google Scholar] [CrossRef]
- Byagathvalli, G.; Pomerantz, A.; Sinha, S.; Standeven, J.; Bhamla, M.S. A 3D-printed hand-powered centrifuge for molecular biology. PLoS Biol. 2019, 17, e3000251. [Google Scholar] [CrossRef]
- Egeter, B.; Veríssimo, J.; Lopes-Lima, M.; Chaves, C.; Pinto, J.; Riccardi, N.; Beja, P.; Fonseca, N.A. Speeding up the detection of invasive aquatic species using environmental DNA and nanopore sequencing. bioRxiv 2020. [Google Scholar] [CrossRef]
- Karst, S.M.; Ziels, R.M.; Kirkegaard, R.H.; Sørensen, E.A.; McDonald, D.; Zhu, Q.; Knight, R.; Albertsen, M. Enabling high-accuracy long-read amplicon sequences using unique molecular identifiers with Nanopore or PacBio sequencing. bioRxiv 2020. [Google Scholar] [CrossRef]
- Baloğlu, B.; Chen, Z.; Elbrecht, V.; Braukmann, T.; MacDonald, S.; Steinke, D. A workflow for accurate metabarcoding using nanopore MinION sequencing. bioRxiv 2020. [Google Scholar] [CrossRef]
- Rodríguez-Pérez, H.; Ciuffreda, L.; Flores, C. NanoCLUST: A species-level analysis of 16S rRNA nanopore sequencing data. bioRxiv 2020. [Google Scholar] [CrossRef]


| R9.4.1_Fast | R9.4.1_HAC | R10.3_Fast_ST | R10.3_HAC_ST | R10.3_Fast_SR | R10.3_HAC_SR | |
|---|---|---|---|---|---|---|
| Basecalled reads | 1,056,403 | 1,056,403 | 512,000 | 512,000 | 1,060,000 | 1,060,000 |
| Demultiplexed (%) | 115,833 (11.0) | 161,376 (15.3) | 50,203 (9.8) | 109,955 (21.5) | 121,579 (11.5) | 264,501 (25.0) |
| Read depth per sample | 11–36,925 | 11–49,990 | 10–2517 | 11–5086 | 10–6037 | 10–12,221 |
| MAFFT / <1% Ns-filter | 125/101 | 126/111 | 115/92 | 121/114 | 122/101 | 128/117 |
| RACON | 101 | 111 | 92 | 114 | 101 | 117 |
| MAFFT+AA | 97 | 110 | 90 | 113 | 99 | 115 |
| RACON+AA | 98 | 110 | 91 | 113 | 100 | 115 |
| Consolidated | 86 | 104 | 83 | 111 | 92 | 113 |
| Consolidated (Clean) | 79 | 96 | 75 | 102 | 84 | 103 |
| R9.4.1_Fast | R9.4.1_HAC | R10.3_Fast_ST | R10.3_HAC_ST | R10.3_Fast_SR | R10.3_HAC_SR | |||||||||||||
|---|---|---|---|---|---|---|---|---|---|---|---|---|---|---|---|---|---|---|
| Barcode | N | G | A (%) | N | G | A (%) | N | G | A (%) | N | G | A (%) | N | G | A (%) | N | G | A (%) |
| MAFFT Ns-filter | 65 | 198 | 99.9800 | 74 | 99 | 100.0000 | 62 | 202 | 99.9843 | 76 | 31 | 99.9958 | 69 | 233 | 99.9812 | 77 | 33 | 100.0000 |
| RACON | 65 | 119 | 99.9801 | 74 | 50 | 100.0000 | 62 | 121 | 99.9480 | 76 | 7 | 100.0000 | 69 | 125 | 99.9673 | 77 | 9 | 99.9834 |
| MAFFT+AA (namino1) | 62 | 0 | 99.9428 | 73 | 1 | 99.9516 | 61 | 0 | 99.9315 | 75 | 0 | 99.9914 | 68 | 4 | 99.9149 | 76 | 0 | 99.9916 |
| MAFFT+AA (namino2) | 62 | 0 | 99.9479 | 73 | 1 | 99.9736 | 61 | 0 | 99.9525 | 75 | 0 | 99.9957 | 68 | 2 | 99.9479 | 76 | 0 | 100.0000 |
| MAFFT+AA (namino3) | 62 | 2 | 99.9791 | 73 | 1 | 99.9780 | 61 | 0 | 99.9524 | 75 | 0 | 99.9957 | 68 | 4 | 99.9668 | 76 | 0 | 100.0000 |
| RACON+AA (namino1) | 63 | 1 | 99.9387 | 73 | 0 | 99.9780 | 61 | 4 | 99.8735 | 75 | 0 | 99.9914 | 68 | 0 | 99.9339 | 76 | 0 | 99.9620 |
| RACON+AA (namino2) | 63 | 1 | 99.9488 | 73 | 0 | 99.9912 | 61 | 4 | 99.9101 | 75 | 0 | 100.0000 | 68 | 0 | 99.9479 | 76 | 0 | 99.9831 |
| RACON+AA (namino3) | 63 | 1 | 99.9589 | 73 | 0 | 99.9912 | 61 | 5 | 99.9204 | 75 | 0 | 100.0000 | 68 | 0 | 99.9525 | 76 | 0 | 99.9831 |
| Consolidated (namino1) | 55 | 0 | 99.9532 | 70 | 0 | 99.9679 | 58 | 0 | 99.9003 | 73 | 0 | 99.9912 | 64 | 0 | 99.9599 | 74 | 0 | 99.9913 |
| Consolidated (namino2) | 55 | 0 | 99.9648 | 70 | 0 | 99.9862 | 58 | 0 | 99.9223 | 73 | 0 | 99.9956 | 64 | 0 | 99.9649 | 74 | 0 | 100.0000 |
| Consolidated (namino3) | 55 | 0 | 99.9707 | 70 | 0 | 99.9862 | 58 | 0 | 99.9333 | 73 | 0 | 99.9956 | 64 | 0 | 99.9648 | 74 | 0 | 100.0000 |
© 2020 by the authors. Licensee MDPI, Basel, Switzerland. This article is an open access article distributed under the terms and conditions of the Creative Commons Attribution (CC BY) license (http://creativecommons.org/licenses/by/4.0/).
Share and Cite
Chang, J.J.M.; Ip, Y.C.A.; Ng, C.S.L.; Huang, D. Takeaways from Mobile DNA Barcoding with BentoLab and MinION. Genes 2020, 11, 1121. https://doi.org/10.3390/genes11101121
Chang JJM, Ip YCA, Ng CSL, Huang D. Takeaways from Mobile DNA Barcoding with BentoLab and MinION. Genes. 2020; 11(10):1121. https://doi.org/10.3390/genes11101121
Chicago/Turabian StyleChang, Jia Jin Marc, Yin Cheong Aden Ip, Chin Soon Lionel Ng, and Danwei Huang. 2020. "Takeaways from Mobile DNA Barcoding with BentoLab and MinION" Genes 11, no. 10: 1121. https://doi.org/10.3390/genes11101121
APA StyleChang, J. J. M., Ip, Y. C. A., Ng, C. S. L., & Huang, D. (2020). Takeaways from Mobile DNA Barcoding with BentoLab and MinION. Genes, 11(10), 1121. https://doi.org/10.3390/genes11101121