Article

Predicting miRNA-Disease Associations by Incorporating Projections in Low-Dimensional Space and Local Topological Information

1
School of Computer Science and Technology, Heilongjiang University, Harbin 150080, China
2
School of Mathematical Science, Heilongjiang University, Harbin 150080, China
*
Author to whom correspondence should be addressed.
Genes 2019, 10(9), 685; https://doi.org/10.3390/genes10090685
Submission received: 15 June 2019 / Revised: 31 August 2019 / Accepted: 3 September 2019 / Published: 6 September 2019
(This article belongs to the Special Issue Associations Between Non-Coding RNA and Diseases)

Abstract

:
Predicting the potential microRNA (miRNA) candidates associated with a disease helps in exploring the mechanisms of disease development. Most recent approaches have utilized heterogeneous information about miRNAs and diseases, including miRNA similarities, disease similarities, and miRNA-disease associations. However, these methods do not utilize the projections of miRNAs and diseases in a low-dimensional space. Thus, it is necessary to develop a method that can utilize the effective information in the low-dimensional space to predict potential disease-related miRNA candidates. We proposed a method based on non-negative matrix factorization, named DMAPred, to predict potential miRNA-disease associations. DMAPred exploits the similarities and associations of diseases and miRNAs, and it integrates local topological information of the miRNA network. The likelihood that a miRNA is associated with a disease also depends on their projections in low-dimensional space. Therefore, we project miRNAs and diseases into low-dimensional feature space to yield their low-dimensional and dense feature representations. Moreover, the sparse characteristic of miRNA-disease associations was introduced to make our predictive model more credible. DMAPred achieved superior performance for 15 well-characterized diseases with AUCs (area under the receiver operating characteristic curve) ranging from 0.860 to 0.973 and AUPRs (area under the precision-recall curve) ranging from 0.118 to 0.761. In addition, case studies on breast, prostatic, and lung neoplasms demonstrated the ability of DMAPred to discover potential disease-related miRNAs.

1. Introduction

Several studies have shown that the abnormal expression of microRNAs (miRNAs) is inextricably related to the occurrence and development of diseases [1,2,3,4,5]. As the number of identified miRNAs continues to increase, a large number of disease-related miRNAs (disease miRNAs) are waiting to be identified.
Some of the methods previously used to predict diseases-associated miRNAs can be divided into two categories. The first category includes the use of regulatory relationships between miRNAs and their target genes to predict potential associations between the miRNA and the disease [6]. Since the number of experimentally validated target genes is not sufficient, some predictive algorithms such as PITA [7], TargetScan [8], and MiRanda [9] are needed to extrapolate the existence of target gene-miRNA associations [10,11,12,13]. The likelihood of a miRNA associated with a disease is predicted based on the similarity or interaction between disease-related target genes and miRNA-related target genes. Since the predictions from such methods have higher false positives, these methods have limited applicability.
Another category of methods is based on the notion that miRNAs with similar functions are often associated with similar diseases [14,15,16,17], and thus, these methods do not depend on the interaction between a miRNA and its corresponding target genes. First, the functional similarity between miRNAs was calculated by the miRNA-related diseases [18]. These methods constructed a miRNA network according to the miRNA functional similarity, and conducted random walks on the miRNA network [19,20] or used information from neighboring nodes [21]. However, such methods rely on a group of seed miRNAs associated with the disease and cannot be applied to new diseases. Some methods have been improved in this regard. They established heterogeneous networks by employing disease similarities, miRNA similarities, and known associations between diseases and miRNAs. Global random walks [22,23], matrix completion [16], or matrix factorization methods [24,25,26,27,28] based on heterogeneous networks are used to predict the association score between miRNA and disease. There are some methods that use path-based search algorithms [29,30] and machine learning methods [31,32,33] for association prediction.
In this study, we propose an effective method, DMAPred, based on non-negative matrix factorization to predict miRNA candidates associated with diseases. Functional similarity between miRNAs, similarities between diseases, and association information between miRNAs and diseases are fully utilized in our method. DMAPred not only considers the sparse nature of miRNA-disease association, but also deeply integrates the characteristics of miRNAs and diseases in low-dimensional space and the local topological information of miRNA nodes. Integrating the local topological information of a miRNA node can capture the association of the miRNA and its k most similar neighbors with similar diseases. Experimental results based on cross-validation are superior to several other methods, and the top ranking contains more real miRNA-disease associations. Case studies on breast, prostatic, and lung neoplasms were also carried out to demonstrate the ability of the DMAPred method to discover potential miRNAs.

2. Materials and Methods

Our aim was to predict potential miRNAs associated with diseases using the DMAPred method. First, a dual heterogeneous network composed of nodes, miRNAs, and diseases, was constructed to represent multiple relationships between miRNAs and diseases. Then, a new prediction model based on non-negative matrix factorization was applied to take into account the disease similarities, miRNA similarities, and associations between miRNAs and diseases. Finally, we obtained the final prediction scores for disease and miRNA by iterative optimization formula.

2.1. Dataset

Human miRNA-disease database (HMDD) has collected a great many associations between miRNAs and diseases that have been experimentally confirmed [34]. We got 5088 known associations from HMDD, which involved 490 miRNAs and 326 diseases. Disease terms were obtained from the National Library of Medicine (http://www.ncbi.nlm.nih.gov/mesh) to construct a directed acyclic graph (DAG) of diseases. The disease semantic similarity and phenotypic similarity were obtained from previous work [17].

2.2. Establishment of the miRNA-Disease Dual Heterogeneous Network

The dual heterogeneous network consisted of two types of nodes and three types of networks, which is the similarity network of miRNAs, the similarity network of diseases and the bipartite network between miRNAs and diseases.
Establishment of the miRNA network: The miRNA network (MiNet) was established on the similarity between miRNAs (Figure 1a). If two miRNAs were similar, we put an edge between two corresponding nodes. Every edge has a weight distributed between 0 and 1 to indicate the similarity of the nodes at both ends. Let matrix M = [ M i j ] R N m × N m denote the miRNAs network, where M i j represents the similarity between i t h miRNA m i and j t h miRNA m j and N m is the number of miRNAs. R N m × N m is a real number set of dimensions N m ×   N m .
Two miRNAs that have similar functions are usually associated with similar diseases. Wang et al. [18] successfully calculated the similarity of miRNAs based on the similarity between the diseases that they were associated with. For example, miRNA m i is associated with a group of diseases P i = { d 3 , d 4 , d 6 } , miRNA m j is associated with a group of diseases P j = { d 1 , d 2 , d 4 , d 8 } , the similarity between m i and m j is calculated based on the similarity of P i and P j . The miRNA similarity that we used was calculated by the Wang’s method.
Establishment of the disease network: The disease network is built on the similarity of diseases (Figure 1b). Every node in the disease network indicates a disease. We added an edge between two corresponding nodes when the two diseases were similar. The weight of every edge is the similarity between two diseases at both ends and is a positive number less than 1. The similarity between two diseases was estimated by disease semantic and phenotype [20]. The more common the disease semantic and phenotype, the more similar are the two diseases, and therefore the higher the possibility of associating with similar miRNAs.
The matrix D = [ D i j ] R N d × N d represents the disease network, with D i j symbolizing the similarity between the i t h disease and j t h disease and the values of similarity are distributed between 0 and 1. The number of the diseases in disease network is N d .
Establishment of the miRNA-disease bipartite network: A bipartite network that records the associations between diseases and miRNAs was constructed by adding the edge between two types of nodes (Figure 1c). This network is dissimilar from the other networks in that it contains two types of nodes and each edge connects two different types of nodes. If we identify from known association data that the disease d j is associated with the miRNA m i , we add a side between corresponding nodes, and the weight of the edge is 1. Otherwise, when the associations between disease d j and the miRNA m i has not been discovered or does not exist, there is no edge between the nodes.
The matrix A = [ A i j ] R N m × N d was constructed to record weight information for each edge of the bipartite network. The i t h row of A is denoted as the associations between the miRNA m i and all the diseases, and the j t h column of A is denoted as the associations between the disease d j and all the miRNAs. A i j is 1 when m i are observed to be associated with d j or 0 otherwise.

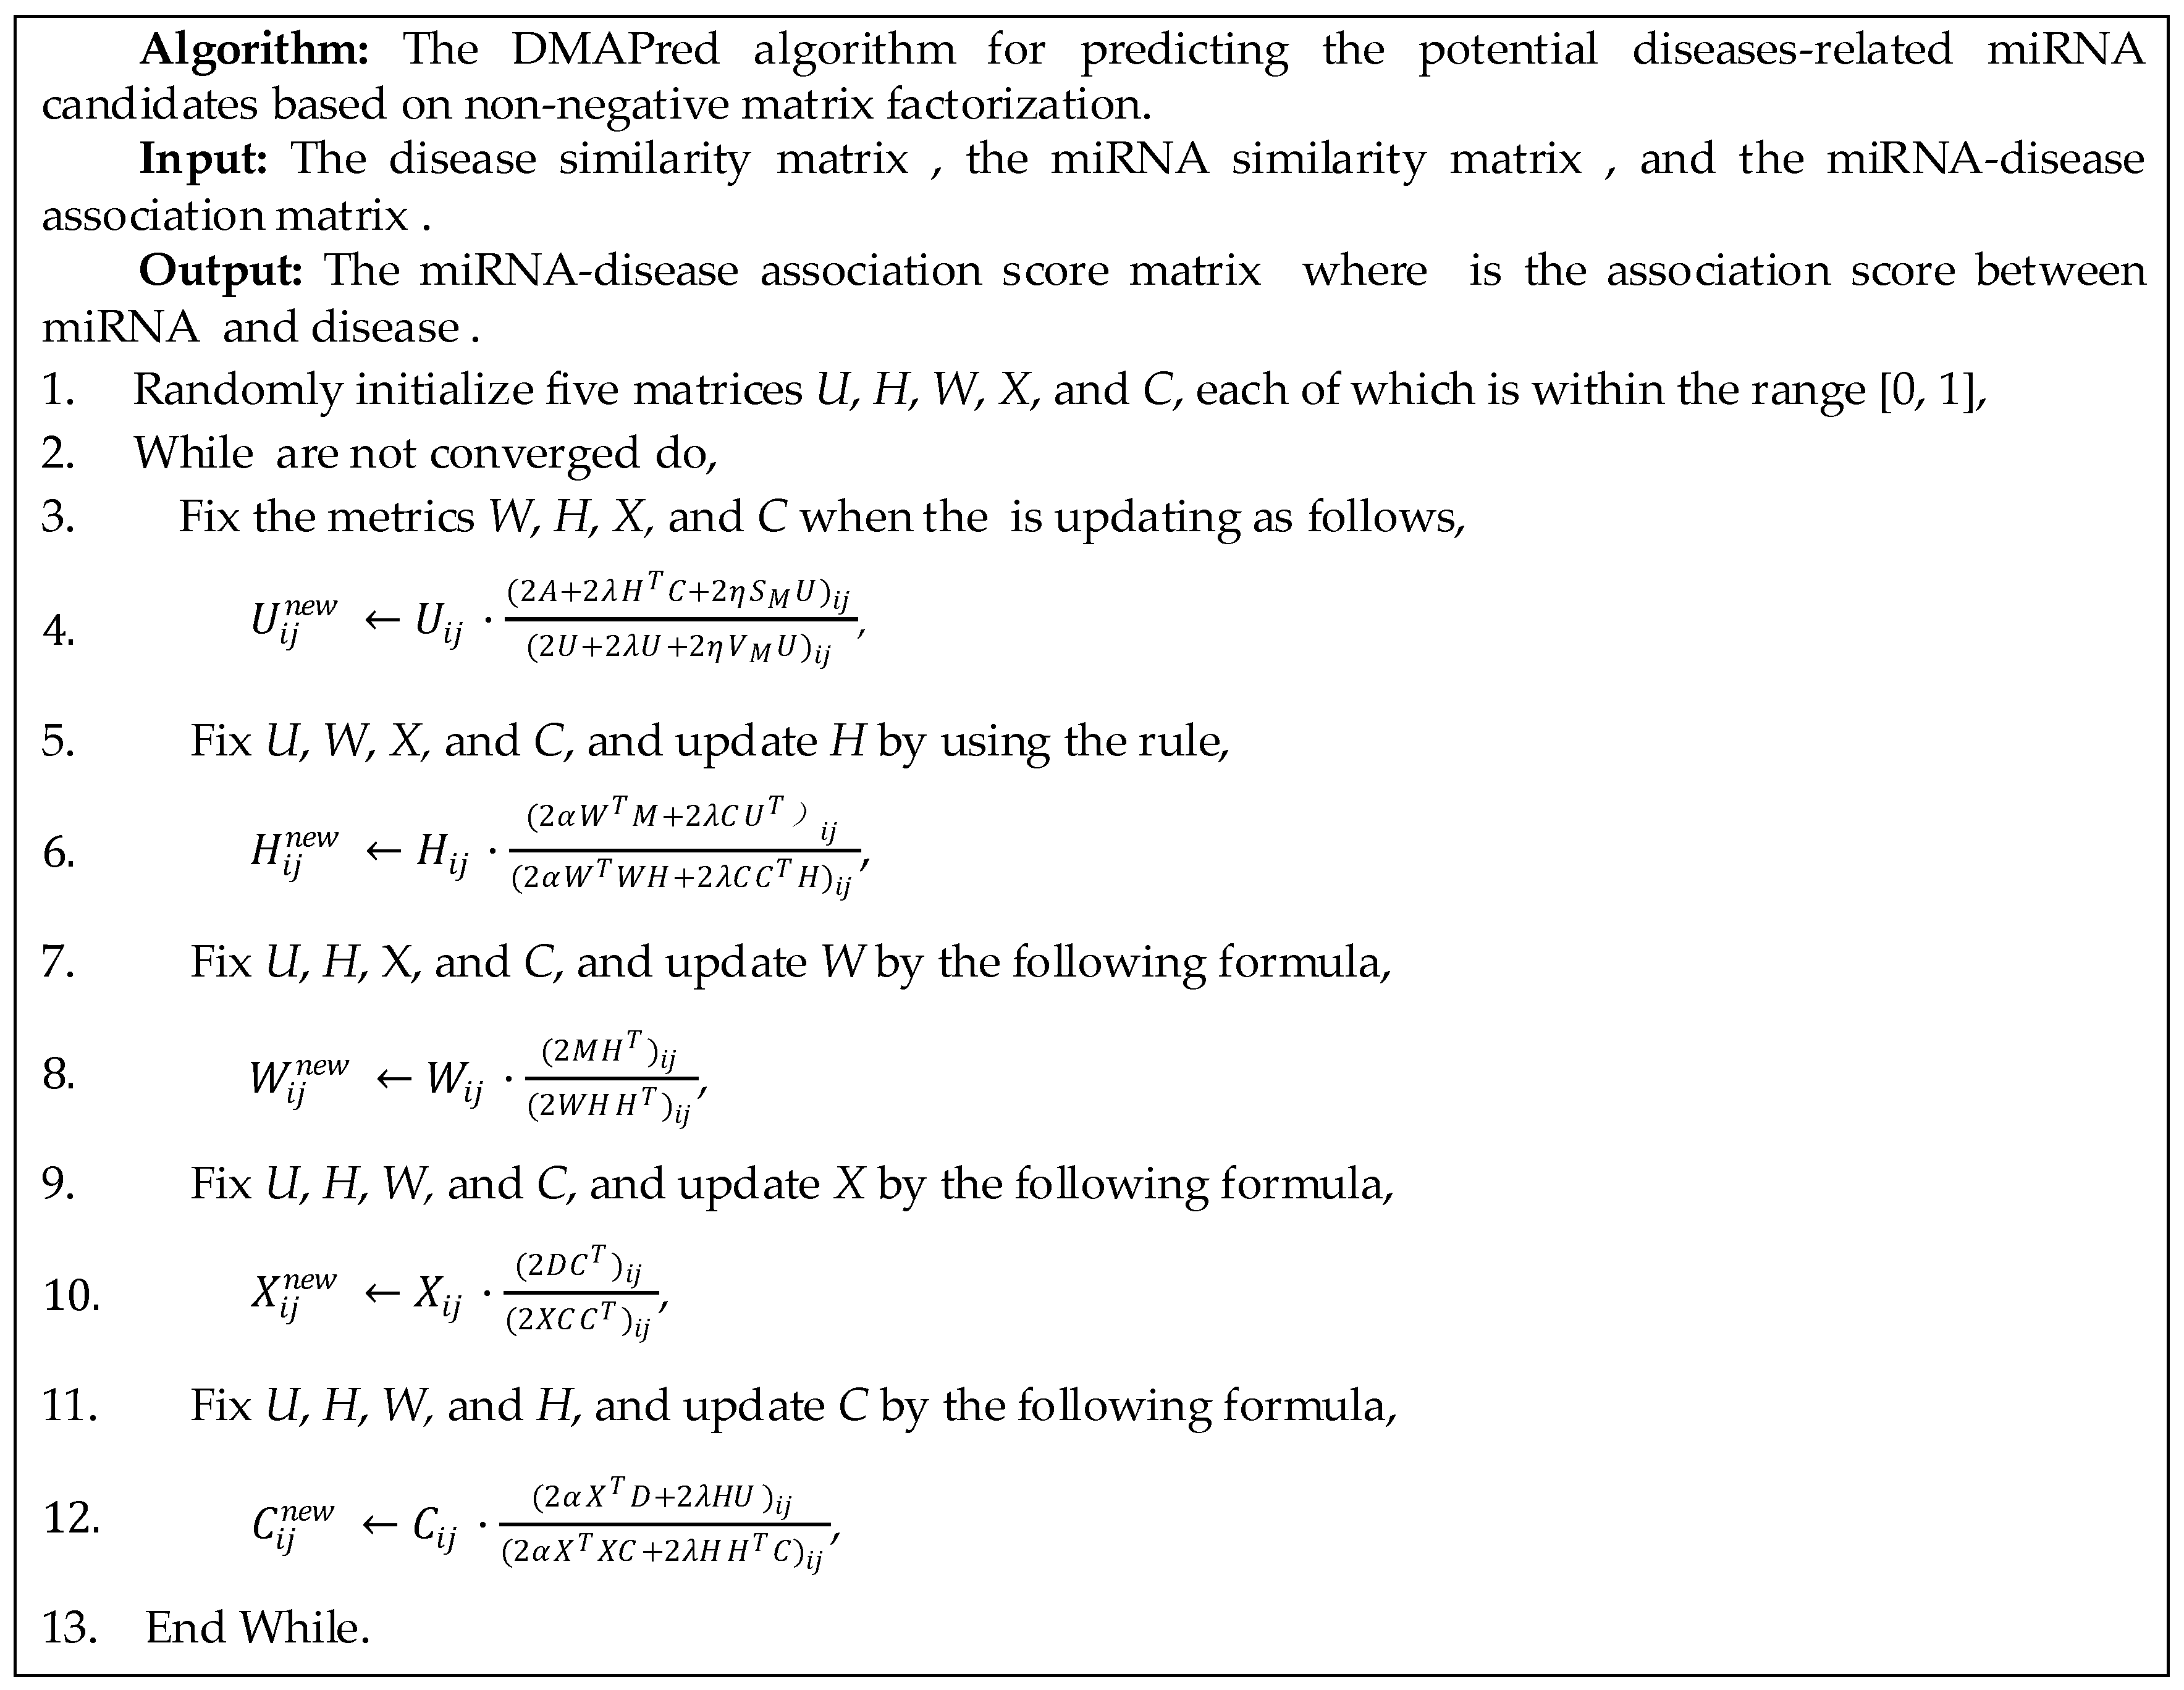
2.3. miRNA-Disease Association Prediction Model

The proposed prediction model for predicting the potential miRNA-disease associations integrated multiple sources from three networks (namely, MiNet, DisNet, and MiDisNet). To make it easier to understand, we introduced a matrix U = [ U i j ] R N m × N d . The matrix U is used to describe the scores of the association possibility between N m miRNAs and N d diseases, where U i j is a non-negative number indicating the association possibility between m i and d j .
Modeling miRNA similarities: Three types of connections in MiDisNet can be used to construct the prediction model. The first type is the similarities between miRNAs in MiNet. Matrix M describes the miRNA similarities, where each row corresponds to the similarity between a miRNA and other miRNAs. For example, the i t h row of M is denoted as the similarity between m i and all the other miRNAs. Data representation often has a large impact on the performance of the model. Projecting high-dimensional information into low-dimensional space contributes to the reduction of the original redundant information, thereby obtaining more dense and low-dimensional feature representations of the data. Therefore, we projected miRNA similarities in low-dimensional space by non-negative matrix factorization. Suppose M = [ M 1 , M 2 , M N m ] R N m × N m is the non-negative N m data represents, where M i is the i t h column of M and represents the N m -dimensional original feature representation of the i t h miRNA. Let W = R N m × k and H = R k × N m be the base matrix and the new representations of data in terms of the basis W and k is the dimension we require:
M W H .
The result of W and H can well approximate the original matrix. Thus, we aimed to minimize the following objective function,
min || M W H || F 2   ,
where · F is the Frobenius norm of the matrix.
Modeling disease similarities: The second type of connection is similarities between diseases. The j t h column of D represents the similarities between d j and all the diseases. We also projected disease similarities into low dimensional space similarly to the miRNAs to receive new representation of the diseases.
Suppose D = [ D 1 , D 2 , , D N d ] R N d × N d is the non-negative N d data matrix where each column is an original feature representation of a disease. Let X R N d × k be the base matrix and C R k × N d be the new data vector of diseases. The disease similarities are projected as follows,
D X C .
Our aim was to find two matrices X and C whose product was closer to the original matrix. To better measure the matrix fitting, we added an item to the loss function,
min || M W H || F 2 + α || D X C || F 2 ,
where α is a hyperparameter used to adjust the contribution of the disease similarity.
Modeling the miRNA-disease associations: The third type of connection is the association between miRNAs and diseases. The miRNA-disease connections are recorded in matrix A in which each 1 represents an observed association. The matrix A was very sparse due to the small number of associations observed. Our model only considered the known associations in this situation. Y = [ Y i j ] R N m × N d was defined as an indicator matrix, and Y i j = 1 if A i j = 1 or 0 otherwise. The predicted scores for associations between N m miRNAs and N d diseases were recorded in U . The estimated association possibilities should be as close as possible to the known associations. As a result, we extended the objective function,
min || M W H || F 2 + α || D X C || F 2 + β || Y ( A U ) || F 2 ,
where is the multiplication of the corresponding elements of the matrix and β is a hyperparameter.
Modeling the characteristics in the low-dimensional space: H R k × N m is the low-dimensional representation matrix of N m miRNAs, where the i t h column is m i . C R k × N d is the low-dimensional feature matrix of N d diseases, in which the j t h column is d j . m i R k and d j R k indicates the feature vectors of the i t h miRNA and the j t h disease, respectively. Our goal was to derive the association score between miRNA and disease by updating U in the model U = H T C . Therefore, the loss function becomes,
m i n || M W H || F 2 + α || D X C || F 2 + β || Y ( A U ) || F 2 + λ || U H T C || F 2 ,
where λ is a hyperparameter.
Considering the sparse characteristic of associations: There are several diseases associated with a miRNA. Hence, the miRNA-disease associations have a sparse characteristic. We used 1-norm to ensure that the matrix U was sparse and added an item to the objective function as follows,
m i n || M W H || F 2 + α || D X C || F 2 + β || Y ( A U ) || F 2 + λ || U H T C || F 2 , + δ || U || 1 .
Therefore, the non-zero elements in the matrix U were sparse.
Modeling local topological information of the miRNAs: A miRNA and its k neighbors are usually associated with similar diseases. First, a graph model S was constructed, based on the similar properties of miRNAs. Each element in S was calculated according to the following formula,
S j l = { 1 if   m l   is   the   k - nearest   neighbor   of   m j 0 otherwise , .
u j and u l are the associations between miRNA m j and m l and all the miRNAs, respectively. Set S j l to 1 when m l is the k-nearest neighbor of m j . Thus, u j and u l should be as consistent as possible. Then, the finally loss function becomes,
m i n || M W H || F 2 + α || D X C || F 2 + β || Y A U || F 2 + λ || U H T C || F 2 , + δ || U || 1 + 1 2 η j , l = 1 N || u j u l || 2 S j l ,
where || || is the 2-norm; δ and η measure the contribution of the corresponding item in the formula.

2.4. Optimization

The objective Function (7) is represented by F, which is a non-convex function. Therefore, it cannot guarantee direct global optimal solution. We proposed an iterative method to optimize the objective Function (7), and divide the problem of solving the objective function F into five sub-problems about the matrix U , W , H , X , and C . Then, the local optimal solution was found for each of the five sub-problems to obtain the global optimal solution. According to the conversion relationship between the trace property and the Frobenius norm of the matrix, F can be written as following,
F = T r ( A A T A U T U A T + U U T ) + α T r ( M M T W H M T M H T W T + W H H T W T ) + β T r ( D D T X C D T D C T X T + X C C T X T ) + δ || U || 1 + λ T r ( U U T U C T H H T C U T + H T C C T H ) + δ B + η Tr ( ( V S ) U + ( V S ) T U ) .
T r ( ) represents the trace of the matrix, which is the sum of the values on the main diagonal of the matrix. Here V R N m × N m is a diagonal matrix where each element is defined as V i i = k = 0 N m 1 S i k ( i = 0 , 1 , 2 , , N m 1 ) . B R N m × N d is a matrix in which each element is 1 .
U sub-problem: When updating U , the other four matrices W , H , X , and C were fixed. The sub-problem about U can be written as,
F ( U ) = T r ( A A T A U T U A T + U U T ) + δ || U || 1 + λ T r ( U U T U C T H H T C U T + H T C C T H ) + δ B + η T r ( ( V S ) U + ( V S ) T U ) .
The derivative of the objective function for U was set to 0. Then there is:
F U = 2 U 2 A + 2 λ ( U H T C ) + 2 η [ ( V S ) U ] = 0 .
After multiplying both sides of the above equation by U i j , the following formula was obtained,
( 2 U 2 A + 2 λ ( U H T C ) + 2 η [ ( V S ) U ] ) i j U i j = 0 .
Finally, according to the gradient descent algorithm, we obtained the local optimal solution of U in the current situation. Updated U was as follows,
U i j n e w U i j ( 2 A + 2 λ H T C + 2 η S M U ) i j ( 2 U + 2 λ U + 2 η V M U ) i j .
H sub-problem: When the matrices U , W , X , and C are fixed, the sub-problem about H can be written as,
F ( H ) = α T r ( M M T W H M T M H T W T + W H H T W T ) + λ T r ( U U T U C T H H T C U T + H T C C T H ) .
Let the derivative of the objective function F to H be 0. Then we have:
F H = 2 α W T W H 2 α W T M + 2 λ C C T H 2 λ C U T = 0 .
Multiply both sides of the equation by A, we obtained:
( 2 α W T W H 2 α W T M + 2 λ C C T H 2 λ C U T ) H i j = 0 .
Finally, we got the update formula of matrix H by gradient descent method as follows,
H i j n e w H i j ( 2 α W T M + 2 λ C U T ) i j ( 2 α W T W H + 2 λ C C T H ) i j .
Then, the same method was used to find the formula to update W , X , and C . The remaining four matrices were fixed when updating a matrix. We obtained three optimization formulas for the other matrices,
W i j n e w W i j ( 2 M H T ) i j ( 2 W H H T ) i j ,
X i j n e w X i j ( 2 D C T ) i j ( 2 X C C T ) i j ,
C i j n e w C i j ( 2 α X T D + 2 λ H U ) i j ( 2 α X T X C + 2 λ H H T C ) i j
The j t h column of the final matrix U represents the association scores between the jth disease and all miRNAs (Figure 2). The miRNAs associated with the disease were not found to be sorted according to the association score in U . In the ordered list, the higher the position of the miRNAs based association score, the more likely it is to be a potential miRNA associated with the disease.

3. Performance Evaluation and Analysis

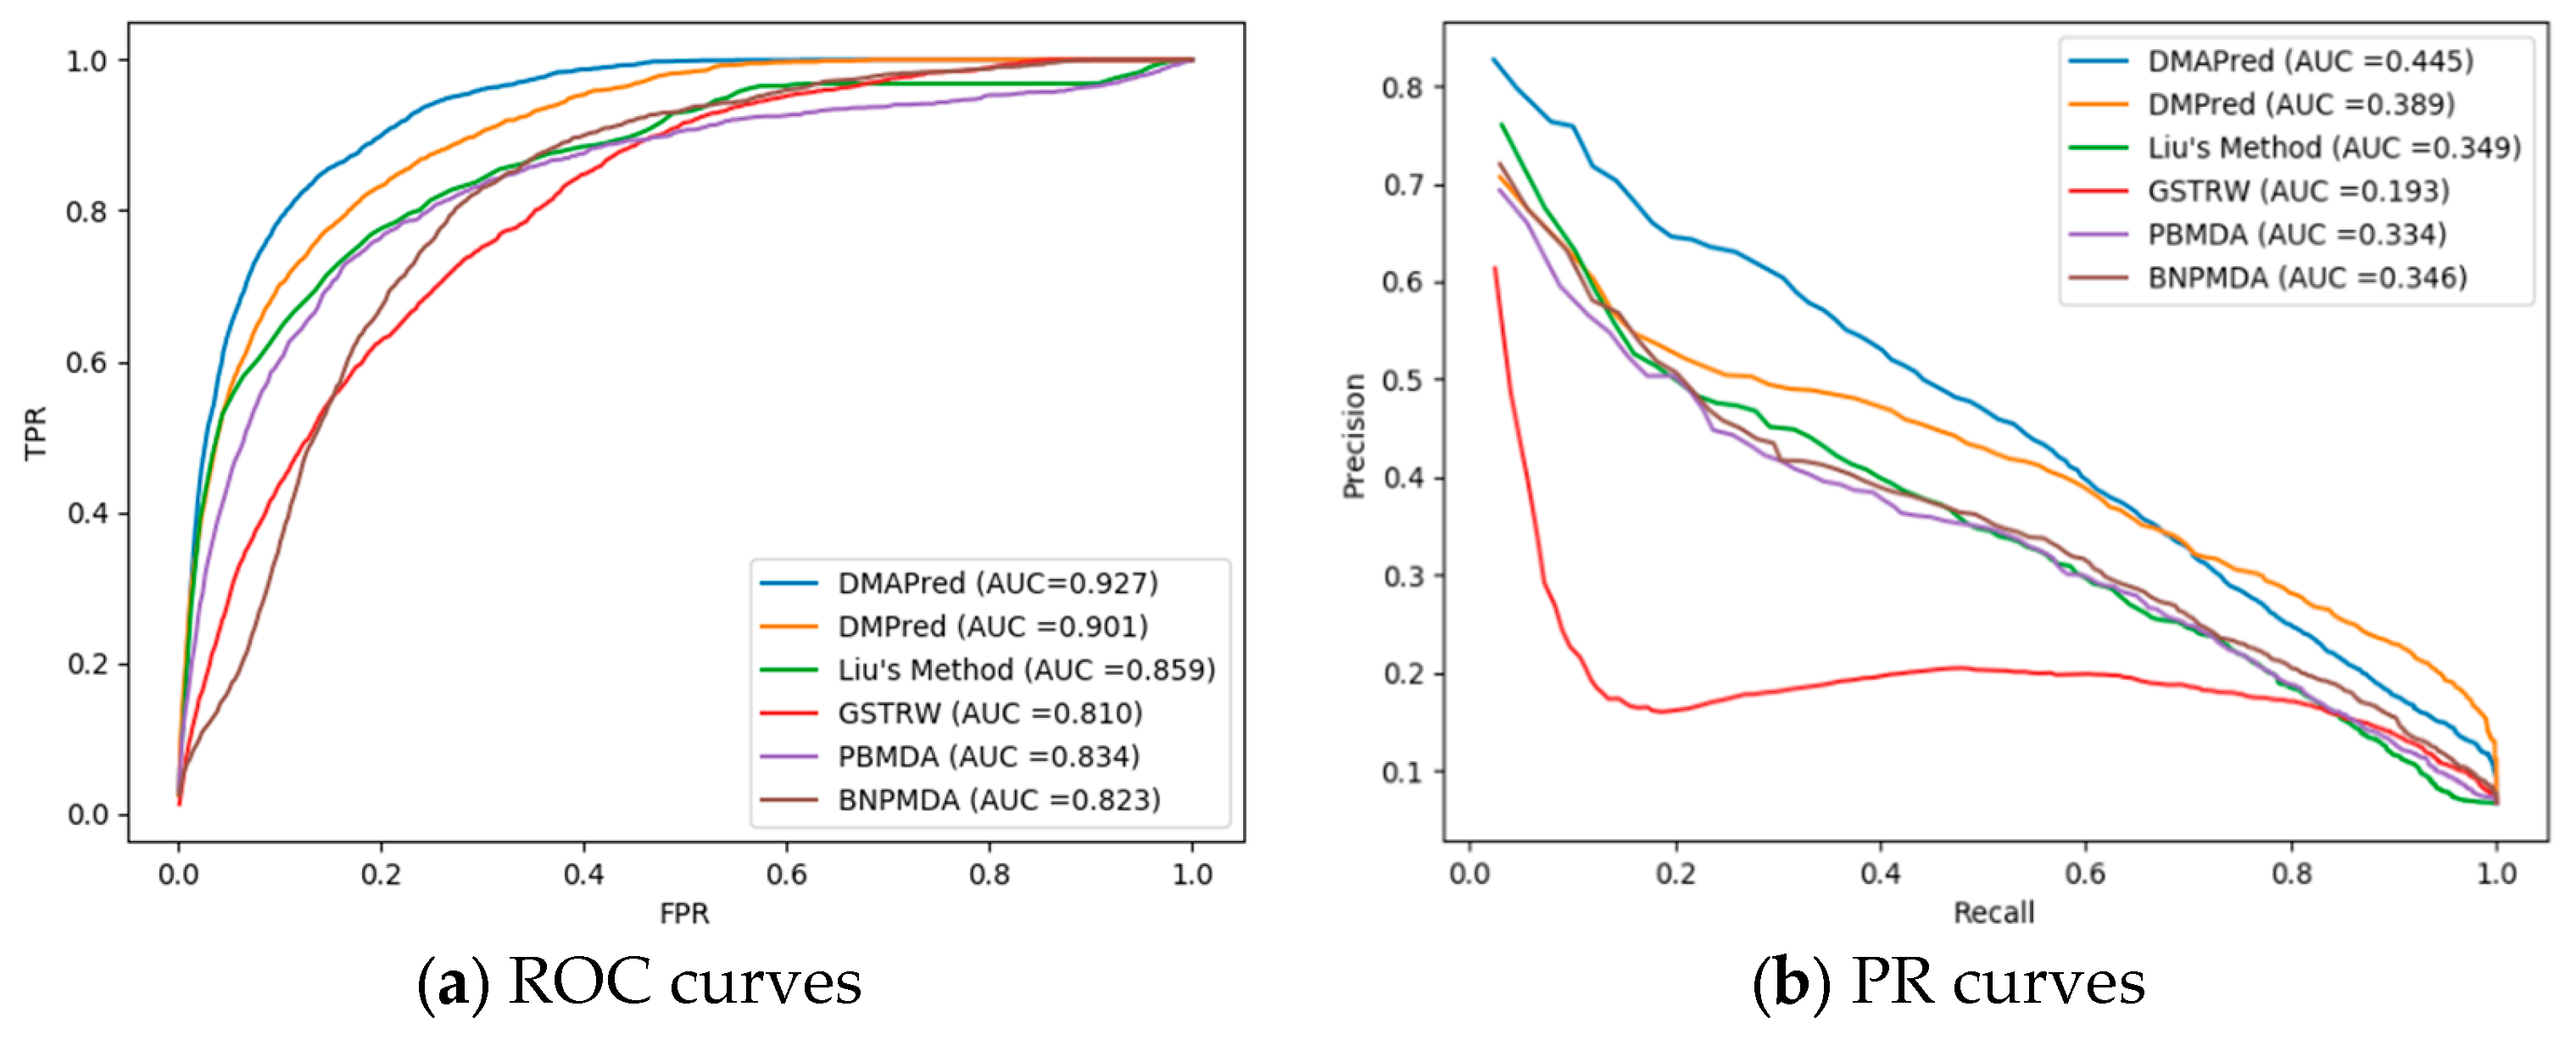
3.1. Performance Evaluation

To evaluate the algorithm performance, we performed fivefold cross validation. In the fivefold cross validation, all known associations between miRNAs and drugs were randomly divided into five subsets. Each time, we used four subsets to train the model, and the remaining one was used as a test set. For a disease d j , miRNAs associated with disease d j are considered positive, and unlabeled miRNAs that were not associated with disease, were considered negative. The higher the positive samples order, the better the prediction performance of the algorithm.
Given a threshold θ , if the associated prediction score was greater than θ , it was judged as a positive example, otherwise it will be judged as negative. The true positive rate (TPR) and false positive rate (FPR) according to the following formulas,
T P R = T P T P + F N   ,   F P R = F P T N + F P ,
where T P and T N represent the number of positive and negative examples, respectively. F N and F P represent the number of predicted errors in positive and negative examples. The TPR and F P R at different thresholds can be used to plot the Receiver Operating Characteristic (ROC) curve. The area under the ROC curve (AUC) can reflect the comprehensive prediction performance of the algorithm. The larger the AUC, the better the comprehensive prediction performance.
In the miRNA-disease association data, the number of known associations was much smaller than the unknown association, which created a serious imbalance between the positive and negative samples. In the case of positive and negative imbalances, precision and recall are more suitable for measuring the performance of the method. The precision P and the recall R are defined as,
P = T P T P + F P   ,   R = T P T P + F N .
P represents how many of the samples predicted to be positive are correct, and R indicates how much of the positive examples are correctly identified by the model. We calculated precision and recall at different thresholds, and used the precision as the vertical axis and the recall as the horizontal axis to obtain the P–R curve. The area under the PR curve (AUPR) indicates the predictive performance of the model in certain aspects. The larger the AUPR, the better the predictive ability of the model.
In the process of biological research, biologists often select the top miRNA candidates for further biological experiments. To identify how many of the positive examples among the top candidates are important for biological research, we computed the recall rate within top k to measure the performance of the prediction model.

3.2. Comparison with Other Methods

To confirm that the proposed method has a superior performance in predicting potential miRNA candidates associated with diseases, we compared DMAPred with Liu’s method [22], DMPred [35], PBMDA [29], GSTRW [36], and BNPDMA [37], which are state-of-the-art prediction methods for miRNA-disease associations. Liu et al. integrated the similarities and associations between miRNAs and diseases to propose a method of random walks with a restart in a heterogeneous miRNA-disease network to predict the association score between a miRNA and a disease. You et al. proposed a method, PBMDA, based on the path to predict the likelihood of a miRNA association with a disease. This method not only integrates the similarity of miRNA functions and the semantic similarity of diseases, but also considers the similarity of the Gaussian interaction spectrum between miRNAs and diseases. Xuan et al. proposed DMPred, based on non-negative matrix factorization, to predict the associations between miRNAs and diseases taking into account the sparse nature of miRNA disease associations. Chen et al. proposed a method, called GSTRW, that calculates the global similarity of a network and predicts the association between a miRNA and a disease by performing random walks in miRNA and disease similarity networks, respectively. BNPDMA uses a bipartite recommendation algorithm to predict potential disease-associated miRNAs by assigning bias ratings to the associations between miRNAs and diseases.
Several hyperparameters in the objective function might impact the performance of the proposed algorithm. By enumerating the sensitivity of each parameter, we selected the values of the parameters α ,   β ,   λ ,   δ ,   η from { 0.1 ,   0.4 ,   0.8 ,   1 , 4 ,   8 } . The contribution of each parameter to the algorithm was measured by varying each parameter to compare the AUC values. Finally, we established the parameters as α = 0.1 ,   β = 0.1 ,   γ = 0.1 ,   and   δ = 1 ,   η = 0.4 by comparing the AUC values for the different parameters.
The predictive performances of the proposed method and Liu’s method, DMPred, GSTRW, PBMDA, and BNPMDA for all the diseases were compared based on different evaluation criteria. Figure 3a shows the average ROC curves for DMAPred and the other five methods for the 326 diseases. The average AUC values obtained with DMAPred, Liu’s method, DMPred, GSTRW, PBMDA, and BNPDMA were 0.927, 0.859, 0.901, 0.810, 0.834, and 0.823, respectively.
The proposed method, DMAPred, achieved the best performance, with the average AUC value being higher than those obtained using the other five methods by 6.8%, 2.6%, 11.7%, 9.3%, and 10.4%, respectively. The faster the TPR values grow versus FPR values, the larger the AUC value for the corresponding ROC curve is. However, the growth rate of TPR is affected by the predicted association scores of positive samples. The larger the predicted score of the positive samples is, the closer our prediction results are to the actual values and the faster the TPR grows. Among the five other methods, the performance of the DMPred method was the second best. This method is based on the matrix factorization, similar to our method, although the calculation of disease similarity and miRNA similarity takes into account factors different from ours. Liu’s method was a little worse than other methods, the main reason being that the calculation of similarity between miRNAs is indirectly measured by genes and LncRNA, and does not take into account the direct relationship between miRNA and disease. The GSTRW method was the worst of the four methods probably because it uses a two-layer random walk. We also list the AUCs for 15 well-characterized diseases associated with at least 80 miRNAs (Table 1). DMAPred achieved the best predictive performance for 10 of the 15 well-characterized diseases.
The PR curve reacts better than the ROC to reflect the predictive performance of different methods when the positive and negative examples in the data set are unbalanced. Figure 3b shows the PR curve for DMAPred and the other five methods with an average AUPR of 0.445, 0.389, 0.349, 0.193, 0.334, and 0.346 for 326 diseases. The performance of DMAPred was evaluated as the best and GSTRW was the worst. DMAPred was 5.6%, 9.6%, 25.2%, 11.3%, and 9.9% higher than the other methods. Table 2 shows the AUPR values of DMAPred and the other five methods for 15 diseases. DMAPred achieved best performance for 10 among the 15 diseases.
The larger the recall value of top k in the ranked list indicates that more positive examples in the top k miRNA candidates are identified (Figure 4). DMAPred performed better than all other methods, with 59.19% in the top 30 candidates, 84.67% in the top 60, and 94.88% in the top 90. DMPred’s performance achieved the second best, with 56.76% in the top 30 candidates, 79.82% in the top 60, and 91.68% in the top 90. Liu’s method was slightly worse, with 50.01% in the top 30 candidates, 70.52% in the top 60, and 81.84% in the top 90. The performance of PBMDA showed with 50.11% in the top 30 candidates, 70.14% in the top 60, and 79.49% in the top 90. GSTRW was the worst, with recalls of 26.90%, 57.79%, and 75.89%, respectively.
In addition, we conducted a t-test to further prove that our method was superior to others in AUC and AUPR. All paired t-test results less than 0.05 means that our method was better than the other methods (Table 3).

3.3. Case Studies on Breast Neoplasms, Prostatic Neoplasms, and Lung Neoplasms

To further demonstrate our approach in identifying potential disease-related miRNAs, we conducted case studies for the top 50 candidates for breast neoplasms, prostate neoplasms, and lung neoplasms. The top 50 candidates related to breast neoplasms are listed for detailed analysis and verification (Table 4).
The databases involved were dbDEMC [44] and PhenomiR [45]. The dbDEMC database contained 807 miRNAs with significant abnormal expression levels in human cancer and has an online public database. The PhenomiR database contains miRNA expression information that is differentially regulated during disease, and its data was extracted from more than 365 scientific articles. Using the dbDEMC database, we found 42 of the 50 candidates were up-regulated or down-regulated in breast neoplasms. Thirty-five of the 50 miRNA candidates were included in PhenomiR. The remaining five miRNAs labeled ‘Literature’ were supported by relevant research literatures.
The top 50 candidates associated with prostate neoplasms are listed in supplementary table ST1. Abnormal expression of 39 candidates in prostate neoplasms was included in the dbDEMC2 database and 36 candidates were included in the PhenomiR database. Three candidates marked ‘Literature’ means that it was supported by the relevant literatures. There were several miRNAs labeled ‘Unconfirm’, which were associated with prostate neoplasms without a relevant database or literature support.
The top 50 candidates associated with lung neoplasms are shown in supplementary table ST2. Abnormal expression of 29 candidates with up-regulation or down-regulation in lung neoplasms was recorded in the dbDEMC2 database, and seven candidates were confirmed by relevant literature. The PhenomiR database included abnormal regulation of 17 candidates in the lung neoplasms. Analysis of breast neoplasms, prostate neoplasms, and lung neoplasms predictions further demonstrates the ability of our methods to predict disease-associated miRNAs.

4. Conclusions

The method based on non-negative matrix factorization, DMAPred, was developed to predict potential miRNAs associated with diseases. DMAPred captures the internal relationships of miRNAs and diseases, including miRNA similarities and disease similarities, and the relationship between miRNAs and diseases, i.e., miRNA-disease associations. Moreover, local topological information for each node in the miRNA network and dense features of miRNAs and diseases in low-dimensional space also contributes for screening of potential disease miRNA candidates. The objective problem was divided into five sub-problems. An iterative algorithm was developed to obtain the final miRNA-disease association scores that could be used to rank the candidate miRNAs for each disease. In our experiment, DMAPred was found to be superior to several other methods, with regard to both AUCs and AUPRs. In addition, DMAPred can help biologists to find candidates they are interested in because the top ranking list contains more true miRNA-disease associations. Case studies on three diseases confirmed that DMAPred is able to discover potential miRNA candidates associated with specific disease.

Supplementary Materials

The following are available online at https://www.mdpi.com/2073-4425/10/9/685/s1. Table ST1: The top 50 candidates for prostatic neoplasms. Table ST2: The top 50 candidates for lung neoplasms. Table ST3: The top 50 potential candidates for 326 diseases. Table ST4: The specific hyperparameters of the five methods and their values.

Author Contributions

P.X. and Y.Z. conceived the prediction method, and Y.Z. wrote the paper. L.L. and L.Z. developed the computer programs. P.X. and T.Z. analyzed the results and revised the paper.

Funding

The work was supported by the Natural Science Foundation of China (61972135), the Natural Science Foundation of Heilongjiang Province (LH2019F049, LH2019A029), the China Postdoctoral Science Foundation (2019M650069), the Heilongjiang Postdoctoral Scientific Research Staring Foundation (BHL-Q18104), the Fundamental Research Foundation of Universities in Heilongjiang Province for Technology Innovation (KJCX201805), the Fundamental Research Foundation of Universities in Heilongjiang Province for Youth Innovation Team (RCYJTD201805), and Heilongjiang university key laboratory jointly built by Heilongjiang province and ministry of education (Heilongjiang university).

Conflicts of Interest

The authors declare no conflict of interest.

References

  1. Calin, G.A.; Croce, C.M. MicroRNA-cancer connection: The beginning of a new tale. Cancer Res. 2006, 66, 7390–7394. [Google Scholar] [CrossRef] [PubMed]
  2. Sayed, D.; Abdellatif, M. MicroRNAs in development and disease. Physiol. Rev. 2011, 91, 827–887. [Google Scholar] [CrossRef] [PubMed]
  3. Meola, N.; Gennarino, V.A.; Banfi, S. microRNAs and genetic diseases. Pathogenetics 2009, 2, 7. [Google Scholar] [CrossRef] [PubMed]
  4. Chen, X.; Xie, D.; Zhao, Q.; You, Z.-H. MicroRNAs and complex diseases: From experimental results to computational models. Brief. Bioinform. 2017, 20, 515–539. [Google Scholar] [CrossRef] [PubMed]
  5. He, L.; Hannon, G.J. MicroRNAs: Small RNAs with a big role in gene regulation. Nat. Rev. Genet. 2004, 5, 522. [Google Scholar] [CrossRef] [PubMed]
  6. Pasquinelli, A.E. MicroRNAs and their targets: Recognition, regulation and an emerging reciprocal relationship. Nat. Rev. Genet. 2012, 13, 271. [Google Scholar] [CrossRef] [PubMed]
  7. Kertesz, M.; Iovino, N.; Unnerstall, U.; Gaul, U.; Segal, E. The role of site accessibility in microRNA target recognition. Nat. Genet. 2007, 39, 1278. [Google Scholar] [CrossRef] [PubMed]
  8. Lewis, B.P.; Shih, I.-H.; Jones-Rhoades, M.W.; Bartel, D.P.; Burge, C.B. Prediction of mammalian microRNA targets. Cell 2003, 115, 787–798. [Google Scholar] [CrossRef]
  9. John, B.; Enright, A.J.; Aravin, A.; Tuschl, T.; Sander, C.; Marks, D.S. Human microRNA targets. PLoS Biol. 2004, 2, e363. [Google Scholar] [CrossRef]
  10. Jiang, Q.; Hao, Y.; Wang, G.; Juan, L.; Zhang, T.; Teng, M.; Liu, Y.; Wang, Y. Prioritization of disease microRNAs through a human phenome-microRNAome network. BMC Syst. Biol. 2010, 4, S2. [Google Scholar] [CrossRef]
  11. Shi, H.; Xu, J.; Zhang, G.; Xu, L.; Li, C.; Wang, L.; Zhao, Z.; Jiang, W.; Guo, Z.; Li, X. Walking the interactome to identify human miRNA-disease associations through the functional link between miRNA targets and disease genes. BMC Syst. Biol. 2013, 7, 101. [Google Scholar] [CrossRef] [PubMed]
  12. Qabaja, A.; Alshalalfa, M.; Bismar, T.A.; Alhajj, R. Protein network-based Lasso regression model for the construction of disease-miRNA functional interactions. EURASIP J. Bioinform. Syst. Biol. 2013, 2013, 3. [Google Scholar] [CrossRef] [PubMed]
  13. Xu, C.; Ping, Y.; Li, X.; Zhao, H.; Wang, L.; Fan, H.; Xiao, Y.; Li, X. Prioritizing candidate disease miRNAs by integrating phenotype associations of multiple diseases with matched miRNA and mRNA expression profiles. Mol. Biosyst. 2014, 10, 2800–2809. [Google Scholar] [CrossRef] [PubMed]
  14. Bandyopadhyay, S.; Mitra, R.; Maulik, U.; Zhang, M.Q. Development of the human cancer microRNA network. Silence 2010, 1, 6. [Google Scholar] [CrossRef] [PubMed]
  15. Chen, X.; Yan, C.C.; Zhang, X.; You, Z.-H.; Deng, L.; Liu, Y.; Zhang, Y.; Dai, Q. WBSMDA: Within and between score for MiRNA-disease association prediction. Sci. Rep. 2016, 6, 21106. [Google Scholar] [CrossRef] [PubMed]
  16. Li, J.-Q.; Rong, Z.-H.; Chen, X.; Yan, G.-Y.; You, Z.-H. MCMDA: Matrix completion for MiRNA-disease association prediction. Oncotarget 2017, 8, 21187. [Google Scholar] [CrossRef] [PubMed]
  17. Lan, W.; Wang, J.; Li, M.; Liu, J.; Wu, F.-X.; Pan, Y. Predicting microRNA-disease associations based on improved microRNA and disease similarities. IEEE/ACM Trans. Comput. Biol. Bioinform. 2018, 15, 1774–1782. [Google Scholar] [CrossRef]
  18. Wang, D.; Wang, J.; Lu, M.; Song, F.; Cui, Q. Inferring the human microRNA functional similarity and functional network based on microRNA-associated diseases. Bioinformatics 2010, 26, 1644–1650. [Google Scholar] [CrossRef] [Green Version]
  19. Chen, X.; Liu, M.-X.; Yan, G.-Y. RWRMDA: Predicting novel human microRNA–disease associations. Mol. Biosyst. 2012, 8, 2792–2798. [Google Scholar] [CrossRef]
  20. Xuan, P.; Han, K.; Guo, Y.; Li, J.; Li, X.; Zhong, Y.; Zhang, Z.; Ding, J. Prediction of potential disease-associated microRNAs based on random walk. Bioinformatics 2015, 31, 1805–1815. [Google Scholar] [CrossRef]
  21. Xuan, P.; Han, K.; Guo, M.; Guo, Y.; Li, J.; Ding, J.; Liu, Y.; Dai, Q.; Li, J.; Teng, Z. Prediction of microRNAs associated with human diseases based on weighted k most similar neighbors. PLoS ONE 2013, 8, e70204. [Google Scholar] [CrossRef] [PubMed]
  22. Liu, Y.; Zeng, X.; He, Z.; Zou, Q. Inferring microRNA-disease associations by random walk on a heterogeneous network with multiple data sources. IEEE/ACM Trans. Comput. Biol. Bioinform. 2016, 14, 905–915. [Google Scholar] [CrossRef] [PubMed]
  23. Luo, J.; Xiao, Q. A novel approach for predicting microRNA-disease associations by unbalanced bi-random walk on heterogeneous network. J. Biomed. Inform. 2017, 66, 194–203. [Google Scholar] [CrossRef] [PubMed]
  24. Xiao, Q.; Luo, J.; Liang, C.; Cai, J.; Ding, P. A graph regularized non-negative matrix factorization method for identifying microRNA-disease associations. Bioinformatics 2017, 34, 239–248. [Google Scholar] [CrossRef] [PubMed]
  25. Chen, X.; Huang, L. LRSSLMDA: Laplacian regularized sparse subspace learning for MiRNA-disease association prediction. PLoS Comput. Biol. 2017, 13, e1005912. [Google Scholar] [CrossRef]
  26. Chen, X.; Wang, L.; Qu, J.; Guan, N.-N.; Li, J.-Q. Predicting miRNA–Disease association based on inductive matrix completion. Bioinformatics 2018, 34, 4256–4265. [Google Scholar] [CrossRef]
  27. Chen, X.; Yin, J.; Qu, J.; Huang, L. MDHGI: Matrix decomposition and heterogeneous graph inference for miRNA-disease association prediction. PLoS Comput. Biol. 2018, 14, e1006418. [Google Scholar] [CrossRef]
  28. Xuan, P.; Shen, T.; Wang, X.; Zhang, T.; Zhang, W. Inferring disease-associated microRNAs in heterogeneous networks with node attributes. IEEE/ACM Trans. Comput. Biol. Bioinform. 2018. [Google Scholar] [CrossRef]
  29. You, Z.-H.; Huang, Z.-A.; Zhu, Z.; Yan, G.-Y.; Li, Z.-W.; Wen, Z.; Chen, X. PBMDA: A novel and effective path-based computational model for miRNA-disease association prediction. PLoS Comput. Biol. 2017, 13, e1005455. [Google Scholar] [CrossRef]
  30. Zhang, X.; Zou, Q.; Rodriguez-Paton, A.; Zeng, X. Meta-path methods for prioritizing candidate disease miRNAs. IEEE/ACM Trans. Comput. Biol. Bioinform. 2019, 16, 283–291. [Google Scholar] [CrossRef]
  31. Xuan, P.; Dong, Y.; Guo, Y.; Zhang, T.; Liu, Y. Dual convolutional neural network based method for predicting disease-related miRNAs. Int. J. Mol. Sci. 2018, 19, 3732. [Google Scholar] [CrossRef] [PubMed]
  32. Chen, X.; Huang, L.; Xie, D.; Zhao, Q. EGBMMDA: Extreme gradient boosting machine for MiRNA-disease association prediction. Cell Death Dis. 2018, 9, 3. [Google Scholar] [CrossRef] [PubMed]
  33. Xuan, P.; Sun, H.; Wang, X.; Zhang, T.; Pan, S. Inferring the disease-associated miRNAs based on network representation learning and convolutional neural networks. Int. J. Mol. Sci. 2019, 20, 3648. [Google Scholar] [CrossRef] [PubMed]
  34. Li, Y.; Qiu, C.; Tu, J.; Geng, B.; Yang, J.; Jiang, T.; Cui, Q. HMDD v2. 0: A database for experimentally supported human microRNA and disease associations. Nucleic Acids Res. 2013, 42, D1070–D1074. [Google Scholar] [CrossRef] [PubMed]
  35. Zhong, Y.; Xuan, P.; Wang, X.; Zhang, T.; Li, J.; Liu, Y.; Zhang, W. A non-negative matrix factorization based method for predicting disease-associated miRNAs in miRNA-disease bilayer network. Bioinformatics 2017, 34, 267–277. [Google Scholar] [CrossRef] [PubMed] [Green Version]
  36. Chen, M.; Liao, B.; Li, Z. Global similarity method based on a two-tier random walk for the prediction of microRNA–disease association. Sci. Rep. 2018, 8, 6481. [Google Scholar] [CrossRef] [PubMed]
  37. Chen, X.; Xie, D.; Wang, L.; Zhao, Q.; You, Z.-H.; Liu, H. BNPMDA: Bipartite network projection for MiRNA–disease association prediction. Bioinformatics 2018, 34, 3178–3186. [Google Scholar] [CrossRef] [PubMed]
  38. Eichner, L.J.; Perry, M.-C.; Dufour, C.R.; Bertos, N.; Park, M.; St-Pierre, J.; Giguère, V. miR-378 mediates metabolic shift in breast cancer cells via the PGC-1β/ERRγ transcriptional pathway. Cell Metab. 2010, 12, 352–361. [Google Scholar] [CrossRef]
  39. Kang, H.; Kim, C.; Lee, H.; Rho, J.; Seo, J.; Nam, J.-W.; Song, W.; Nam, S.; Kim, W.; Lee, E. Downregulation of microRNA-362-3p and microRNA-329 promotes tumor progression in human breast cancer. Cell Death Differ. 2016, 23, 484. [Google Scholar] [CrossRef]
  40. Ma, T.; Yang, L.; Zhang, J. miRNA-542-3p downregulation promotes trastuzumab resistance in breast cancer cells via AKT activation. Oncol. Rep. 2015, 33, 1215–1220. [Google Scholar] [CrossRef] [Green Version]
  41. Zhang, R.; Wang, M.; Sui, P.; Ding, L.; Yang, Q. Upregulation of microRNA-574-3p in a human gastric cancer cell line AGS by TGF-β1. Gene 2017, 605, 63–69. [Google Scholar] [CrossRef] [PubMed]
  42. Ujihira, T.; Ikeda, K.; Suzuki, T.; Yamaga, R.; Sato, W.; Horie-Inoue, K.; Shigekawa, T.; Osaki, A.; Saeki, T.; Okamoto, K. MicroRNA-574-3p, identified by microRNA library-based functional screening, modulates tamoxifen response in breast cancer. Sci. Rep. 2015, 5, 7641. [Google Scholar] [CrossRef] [PubMed] [Green Version]
  43. Eichelser, C.; Stückrath, I.; Müller, V.; Milde-Langosch, K.; Wikman, H.; Pantel, K.; Schwarzenbach, H. Increased serum levels of circulating exosomal microRNA-373 in receptor-negative breast cancer patients. Oncotarget 2014, 5, 9650. [Google Scholar] [CrossRef] [PubMed]
  44. Yang, Z.; Ren, F.; Liu, C.; He, S.; Sun, G.; Gao, Q.; Yao, L.; Zhang, Y.; Miao, R.; Cao, Y. dbDEMC: A database of differentially expressed miRNAs in human cancers. BMC Genomics 2010, 11, S5. [Google Scholar] [CrossRef] [PubMed]
  45. Ruepp, A.; Kowarsch, A.; Schmidl, D.; Buggenthin, F.; Brauner, B.; Dunger, I.; Fobo, G.; Frishman, G.; Montrone, C.; Theis, F.J. PhenomiR: A knowledgebase for microRNA expression in diseases and biological processes. Genome Biol. 2010, 11, R6. [Google Scholar] [CrossRef] [PubMed]
Figure 1. Construction and representation of a microRNA (miRNA)-disease heterogeneous network. (a) Calculate the miRNA similarity based on diseases associated with two miRNAs. (b) Construct the disease similarity by combining their disease phenotypes and phenotype ontologies. (c) Add edges between miRNAs and diseases.
Genes 10 00685 g001
Figure 2. Iterative algorithms for predicting the potential diseases-related miRNA candidates.
Genes 10 00685 g002
Figure 3. Two types of curves for evaluating the predicting performance of DMAPred and other five methods. (a) the Receiver Operating Characteristic (ROC) curves and area under the receiver operating characteristic curve (AUC) values of DMAPred and other five methods; and (b) precision–recall (PR) curves and area under the PR curve (AUPR) values of DMAPred and other five methods.
Genes 10 00685 g003
Figure 4. Average recalls of all the diseases at different top k.
Genes 10 00685 g004
Table 1. AUC values of five methods for all the diseases and 15 common diseases.
Diseases NameAUC
DMAPredGSTRWDMPredPBMDALiu’s MethodBNPMDA
Breast neoplasms0.9660.8220.9380.8520.8630.905
Hepatocellular carcinoma0.9570.7790.9000.8030.8450.853
Renal cell carcinoma0.9260.8160.9030.8130.8320.845
Squamous cell carcinoma0.9420.8170.9080.8810.8900.877
Colorectal neoplasms0.8950.7370.8420.8260.8570.801
Glioblastoma0.9280.8140.9040.8030.8420.817
Heart failure0.965 0.8170.9870.7910.8280.891
Acute myeloid leukemia0.9670.7880.8900.8440.8740.845
Lung neoplasms0.9730.7910.9480.9050.9200.912
Melanoma0.907 0.7890.9130.8360.8600.889
Ovarian neoplasms0.9390.8300.9290.8890.8970.725
Pancreatic neoplasms0.9330.8380.9160.8910.9040.829
Prostatic neoplasms0.9580.8220.9510.8430.8550.894
Stomach neoplasms0.9350.7620.9080.8210.8360.784
Urinary bladder neoplasms0.860 0.8160.9190.8540.8650.901
Average AUC for the 326 diseases0.9270.8100.9010.8340.8590.823
Bold values indicate the higher AUCs.
Table 2. AUPR values of five methods for all the diseases and 15 common diseases.
Disease NameAUPR
DMAPredLiu’s MethodGSTRWDMPredPBMDABNPMDA
Breast neoplasms0.7610.5730.3220.6990.5740.254
Hepatocellular carcinoma0.7190.4980.2790.5010.4540.618
Renal cell carcinoma0.4850.1860.1500.2930.1810.334
Squamous cell carcinoma0.2990.2080.1090.2130.2110.214
Colorectal neoplasms0.340 0.3710.1410.1860.3670.197
Glioblastoma0.5170.2430.1510.2190.2170.227
Heart failure0.7860.1890.1910.7000.1680.178
Acute myeloid leukemia0.3170.2360.1400.2110.1910.190
Lung neoplasms0.7400.5030.1470.5110.5370.547
Melanoma0.342 0.3970.1710.3890.3630.334
Ovarian neoplasms0.4410.3610.1690.4040.3610.357
Pancreatic neoplasms0.303 0.3540.1370.3290.3640.357
Prostatic neoplasms0.5320.2640.1660.4630.2820.345
Stomach neoplasms0.4690.3460.2200.4460.3440.284
Urinary bladder neoplasms0.118 0.2800.1630.3150.2520.242
Average AUPR for the 326 diseases0.4450.3490.1930.3890.3340.346
Bold values indicate the higher AUPRs.
Table 3. Comparison of different methods based on AUC and AUPR with a paired t-test.
DMPredLiu’s MethodGSTRWPBMDABNPMDA
p-value of AUCs0.002475.0135 × 10−72.4835 × 10−92.3143 × 10−69.5824 × 10⁻⁶
p-value of AUPRs0.001680.001993.6475 × 10−60.002890.00182
Table 4. The top 50 candidates related to breast neoplasms.
RankMiRNA NameDescriptionRankMiRNA NameDescription
1hsa-mir-15b dbDEMC2,PhenomiR26hsa-mir-184dbDEMC2,PhenomiR
2hsa-mir-142PhenomiR27hsa-mir-363dbDEMC2
3hsa-mir-192 PhenomiR28hsa-mir-30ePhenomiR
4hsa-mir-378a Literature [38]29hsa-mir-208adbDEMC2,PhenomiR
5hsa-mir-106adbDEMC2,PhenomiR30hsa-mir-449bdbDEMC2
6hsa-mir-99adbDEMC2,PhenomiR31hsa-mir-491PhenomiR
7hsa-mir-130adbDEMC2,PhenomiR32hsa-mir-494dbDEMC2,PhenomiR
8hsa-mir-150dbDEMC2,PhenomiR33hsa-mir-186dbDEMC2,PhenomiR
9hsa-mir-196bdbDEMC2,PhenomiR34hsa-mir-362Literature [39]
10hsa-mir-130bdbDEMC2,PhenomiR35hsa-mir-424dbDEMC2,PhenomiR
11hsa-mir-98dbDEMC2,PhenomiR36hsa-mir-370dbDEMC2,PhenomiR
12hsa-mir-1266dbDEMC237hsa-mir-542Literature [40]
13hsa-mir-92bdbDEMC238hsa-mir-32dbDEMC2,PhenomiR
14hsa-mir-372dbDEMC2,PhenomiR39hsa-mir-181ddbDEMC2,PhenomiR
15hsa-mir-138dbDEMC2,PhenomiR40hsa-mir-483PhenomiR
16hsa-mir-574Literature [41,42]41hsa-mir-302edbDEMC2
17hsa-mir-144dbDEMC2,PhenomiR42hsa-mir-302fdbDEMC2
18hsa-mir-28dbDEMC2,PhenomiR43hsa-mir-208bdbDEMC2
19hsa-mir-212dbDEMC2,PhenomiR44hsa-mir-134d dbDEMC2
20hsa-mir-181cdbDEMC2,PhenomiR45hsa-mir-330dbDEMC2,PhenomiR
21hsa-mir-371a Literature [43]46hsa-mir-381dbDEMC2,PhenomiR
22hsa-mir-449adbDEMC2,PhenomiR47hsa-mir-198dbDEMC2,PhenomiR
23hsa-mir-185dbDEMC2,PhenomiR48hsa-mir-548adbDEMC2
24hsa-mir-211dbDEMC2,PhenomiR49hsa-mir-154dbDEMC2,PhenomiR
25hsa-mir-99bdbDEMC2,PhenomiR50hsa-mir-503dbDEMC2

