Assessing Genetic Diversity for a Pre-Breeding Program in Piaractus mesopotamicus by SNPs and SSRs

 ,
,  ,
, 
Abstract
1. Introduction
2. Materials and Methods
2.1. Ethic Statement
2.2. Experimental Population
2.3. SSR and SNP Analysis
2.4. Statistical Analysis
3. Results
4. Discussion
Supplementary Materials
Author Contributions
Funding
Conflicts of Interest
References
- Resende, E.K. Migratory fishes of the Paraguay-Paraná basin excluding the Upper Paraná River. In Migratory Fishes of South America: Biology, Fisheries and Conservation States; Carolsfeld, J., Harvey, B., Ross, C., Baers, A., Eds.; World Bank: Victoria, BC, Canada, 2003; pp. 99–156. [Google Scholar]
- Ministério da Pesca e Aquicultura. Boletim Estatístico da Pesca e Aquicultura 2011; MPA: Brasília, Brazil, 2011; pp. 29–32. [Google Scholar]
- Instituto Brasileiro de Geografia e Estatística. Produção Pecuária Municipal 2016; IBGE: Rio de Janeiro, Brazil, 2017; Volume 44, pp. 1–51. [Google Scholar]
- Volkoff, H.; Sabioni, R.E.; Coutinho, L.L.; Cyrino, J.E.P. Appetite regulating factors in pacu (Piaractus mesopotamicus): Tissue distribution and effects of food quantity and quality on gene expression. Comp. Biochem. Physiol. Part A 2017, 203, 241–254. [Google Scholar] [CrossRef] [PubMed]
- Honglang, H. Freshwater fish seed resources in China. In Assessment of Freshwater Fish Seed Resources for Sustainable Aquaculture, FAO Fisheries Technical Paper No 501; Bondad-Reantaso, M.G., Ed.; FAO: Rome, Italy, 2007; pp. 185–199. [Google Scholar]
- FAO. The State of World Fisheries and Aquaculture 2010; FAO: Rome, Italy, 2010; pp. 3–87. [Google Scholar]
- Gjedrem, T.; Robinson, N.; Rye, M. The importance of selective breeding in aquaculture to meet future demands for animal protein: A review. Aquaculture 2012, 350–353, 117–129. [Google Scholar] [CrossRef]
- Lind, C.E.; Ponzoni, R.W.; Nguyen, N.H.; Khaw, H.L. Selective breeding in fish and conservation of genetic resources for aquaculture. Reprod. Domest. Anim. 2012, 47, 255–263. [Google Scholar] [CrossRef] [PubMed]
- Ponzoni, R.W. Genetic improvement effective dissemination: Keys to prosperous and sustainable aquaculture industries. In Development of Aquatic Animal Genetic Improvement and Dissemination Programs: Current Status and Action Plans; Ponzoni, R.W., Acosta, B.O., Ponniah, A.G., Eds.; WorldFish Center: Penang, Malásia, 2006; pp. 1–7. [Google Scholar]
- Kincaid, H.L. Inbreeding in fish populations used for aquaculture. Aquaculture 1983, 33, 215–227. [Google Scholar] [CrossRef]
- Li, L.; Lin, H.; Tang, W.; Liu, D.; Baolong, B.; Yang, J. Population genetic structure in wild and aquaculture populations of Hemibarbus maculates inferred from microsatellites markers. Aquac. Fish. 2017, 2, 78–83. [Google Scholar] [CrossRef]
- Xu, L.; Li, Q.; Xu, C.; Yu, H.; Kong, L. Genetic diversity and effective population size in successive mass selected generations of black shell strain Pacific oyster (Crassostrea gigas) based on microsatellites and mtDNA data. Aquaculture 2019, 500, 338–346. [Google Scholar] [CrossRef]
- Beaumont, A.R.; Hoare, K. Genetic considerations in the hatchery. In Biotechnology and Genetics in Fisheries and Aquaculture; Beaumont, A.R., Hoare, K., Eds.; Blackwell Science: Oxford, UK, 2003; pp. 73–90. [Google Scholar]
- Sui, J.; Luan, S.; Yang, G.; Chen, X.; Luo, K.; Gao, Q.; Wang, J.; Hu, H.; Kong, J. Genetic diversity and population structure of a giant freshwater prawn (Macrobrachium rosenbergii) breeding nucleus in China. Aquac. Res. 2018, 49, 2175–2183. [Google Scholar] [CrossRef]
- Iervolino, F.; Resende, E.K.; Hilsdorf, A.W.S. The lack of genetic differentiation of pacu (Piaractus mesopotamicus) populations in the Upper-Paraguay Basin revealed by the mitochondrial DNA D-loop region: Implications for fishery management. Fish. Res. 2010, 101, 27–31. [Google Scholar] [CrossRef]
- Calcagnotto, D.; Russello, M.; DeSalle, R. Isolation and characterization of microsatellite loci in Piaractus mesopotamicus and their applicability in other Serrasalminae fish. Mol. Ecol. Notes 2001, 1, 245–247. [Google Scholar] [CrossRef]
- Calcagnotto, D.; DeSalle, R. Population genetic structuring in pacu (Piaractus mesopotamicus) across the Paraná-Paraguay basin: Evidence from microsatellites. Neotrop. Ichthyol. 2009, 7, 607–616. [Google Scholar] [CrossRef]
- Mastrochirico-Filho, V.A.; Hata, M.E.; Sato, L.S.; Jorge, P.H.; Foresti, F.; Vera, M.; Martínez, P.; Porto-Foresti, F. SNP discovery from liver transcriptome in the fish Piaractus mesopotamicus. Conserv. Genet. Resour. 2016, 8, 109–114. [Google Scholar] [CrossRef]
- Villanova, G.V.; Vera, M.; Diaz, J.; Martinez, P.; Calcaterra, N.; Arranz, S. Isolation and characterization of 20 polymorphic microsatellite loci in the migratory freshwater fish Leporinus obtusidens (Characiformes: Anostomidae) using 454 shotgun pyrosequencing. J. Fish. Biol. 2015, 86, 1209–1217. [Google Scholar] [CrossRef] [PubMed]
- Posner, V. Desarrollo de Herramientas Biotecnológicas para el Cultivo de Pacú (Piaractus mesopotamicus). Bachelor’s Thesis, Universidad Nacional de Rosario, Rosario, Argentina, 2016. [Google Scholar]
- Van Oosterhout, C.; Hutchinson, W.F.; Wills, D.P.M.; Shipley, P. MICRO-CHECKER: Software for identifying and correcting genotyping errors in microsatellite data. Mol. Ecol. Res. 2004, 4, 535–538. [Google Scholar] [CrossRef]
- Kalinowski, S.T.; Taper, M.L.; Marshall, T.C. Revising how the computer program CERVUS accommodates genotyping error increases success in paternity assignment. Mol. Ecol. 2007, 16, 1099–1106. [Google Scholar] [CrossRef] [PubMed]
- Raymond, M.; Rousset, F. GENEPOP (version 1.2): Population genetics software for exact tests and ecumenicism. J. Heredity 1995, 86, 248–249. [Google Scholar] [CrossRef]
- Goudet, J. FSTAT (version 1.2): A computer program to calculate F-statistics. J. Heredity 1995, 86, 485–486. [Google Scholar] [CrossRef]
- Rice, W.R. Analyzing tables of statistical tests. Evolution 1989, 43, 223–225. [Google Scholar] [CrossRef]
- Do, C.; Waples, R.S.; Peel, D.; Macbeth, G.M.; Tillett, B.J.; Ovenden, J.R. NeEstimator V2: Re-implementation of software for the estimation of contemporary effective population size (Ne) from genetic data. Mol. Ecol. Resour. 2014, 14, 209–214. [Google Scholar] [CrossRef]
- Gjedrem, T.; Baranski, M. Selective Breeding in Aquaculture: An Introduction; Springer Science & Business Media: Amsterdam, The Netherlands, 2009; pp. 5–11. [Google Scholar]
- Garza, J.C.; Williamson, E.G. Detection of reduction in population size using data from microsatellite loci. Mol. Ecol. 2001, 10, 305–318. [Google Scholar] [CrossRef]
- Excoffier, L.; Laval, G.; Schneider, S. ARLEQUIN (version 3.0): An integrated software package for population genetics data analysis. Evol. Bioinform. Online 2005, 1, 47–50. [Google Scholar] [CrossRef]
- Evanno, G.; Regnaut, S.; Goudet, J. Detecting the number of clusters of individuals using the software STRUCTURE: A simulation study. Mol. Ecol. 2005, 14, 2611–2620. [Google Scholar] [CrossRef] [PubMed]
- Pritchard, J.; Stephens, M.; Donnelly, P. Inference of population structure using multilocus genotype data. Genetics 2000, 155, 945–959. [Google Scholar] [PubMed]
- Earl, D.A.; vonHoldt, B.M. STRUCTURE HARVESTER: A website and program for visualizing STRUCTURE output and implementing the Evanno method. Conserv. Genet. Resour. 2012, 4, 359–361. [Google Scholar] [CrossRef]
- Jakobsson, M.; Rosenberg, N.A. CLUMPP: A cluster matching and permutation program for dealing with label switching and multimodality in analysis of population structure. Bioinformatics 2007, 23, 1801–1806. [Google Scholar] [CrossRef] [PubMed]
- Wang, J. An estimator for pairwise relatedness using molecular markers. Genetics 2002, 160, 1203–1215. [Google Scholar]
- Wang, J. COANCESTRY: A program for simulating, estimating and analyzing relatedness and inbreeding coefficients. Mol. Ecol. Resour. 2011, 11, 141–145. [Google Scholar] [CrossRef] [PubMed]
- Martínez, P.; Fernández, J. Análisis de parentescos mediante el uso de marcadores moleculares. In Genética y Genómica en Acuicultura; Martínez, P., Figueras, A., Eds.; Publicaciones Científicas y Tecnológicas de la Fundación Observatorio Español de Acuicultura, CSIC: Madrid, Spain, 2009; pp. 241–308. [Google Scholar]
- Gjedrem, T.; Rye, M. Selection response in fish and shellfish: A review. Rev. Aquacult. 2018, 10, 168–179. [Google Scholar] [CrossRef]
- Alarcón, J.A.; Magoulas, A.; Georgakopoulos, T.; Zouros, E.; Alvarez, M.C. Genetic comparison of wild and cultivated European populations of the gilthead sea bream (Sparus aurata). Aquaculture 2004, 230, 65–80. [Google Scholar] [CrossRef]
- Duncan, N.J.; Sonesson, A.K.; Chavanne, H. Principles of finfish broodstock management in aquaculture: Control of reproduction and genetic improvement. In Advances in Aquaculture Hatchery Technology; Allan, G., Burnell, G., Eds.; Woodhead Publishing Limited: Cambridge, UK, 2013; pp. 23–75. [Google Scholar]
- Naish, K.A.; Seamons, T.R.; Dauer, M.B.; Hauser, L.; Quinn, T.P. Relationship between effective population size, inbreeding and adult fitness-related traits in a steelhead (Oncorhynchus mykiss) population released in the wild. Mol. Ecol. 2013, 22, 1295–1309. [Google Scholar] [CrossRef]
- Jorge, P.H.; Mastrochirico-Filho, V.A.; Hata, M.E.; Mendes, N.J.; Ariede, R.B.; Freitas, M.V.; Vera, M.; Porto-Foresti, F.; Hashimoto, D.T. Genetic characterization of the fish Piaractus brachypomus by microsatellites derived from transcriptome sequencing. Front. Genet. 2018, 9, 46. [Google Scholar] [CrossRef]
- Agostinho, A.A.; Pelicice, F.M.; Petry, A.C.; Gomes, L.C.; Júlio, H.F., Jr. Fish diversity in the upper Paraná River basin: Habitats, fisheries, management and conservation. Aquat. Ecosyst. Health 2007, 10, 174–186. [Google Scholar] [CrossRef]
- Vera, M.; Alvarez-Dios, J.A.; Fernandez, C.; Bouza, C.; Vilas, R.; Martinez, P. Development and validation of single nucleotide polymorphisms (SNPs) markers from two transcriptome 454-runs of turbot (Scophthalmus maximus) using high-throughput genotyping. Int. J. Mol. Sci. 2013, 14, 5694–5711. [Google Scholar] [CrossRef] [PubMed]
- Aykanat, T.; Johnston, S.E.; Orell, P.; Niemela, E.; Erkinaro, J.; Primmer, C.R. Low but significant genetic differentiation underlies biologically meaningful phenotypic divergence in a large Atlantic salmon population. Mol. Ecol. 2015, 24, 5158–5174. [Google Scholar] [CrossRef] [PubMed]
- Pocwierz-Kotus, A.; Bernas, R.; Kent, M.P.; Lien, S.; Leliuna, E.; Debowski, P.; Wenne, R. Restitution and genetic differentiation of salmon populations in the southern Baltic genotyped with the Atlantic salmon 7K SNP array. Genet. Sel. Evol. 2015, 47, 39. [Google Scholar] [CrossRef] [PubMed][Green Version]
- Wang, L.; Shi, X.; Su, Y.; Meng, Z.; Lin, H. Loss of genetic diversity in the cultured stocks of the large yellow croaker, Larimichthys crocea, revealed by microsatellites. Int. J. Mol. Sci. 2012, 13, 5584–5597. [Google Scholar] [CrossRef] [PubMed]
- Zhang, H.; Zhao, Z.; Xu, J.; Xu, P.; Bai, Q.; Yang, S.; Jiang, L.; Chen, B. Population genetic analysis of aquaculture salmonid populations in China using a 57K rainbow trout SNP array. PLoS ONE 2018, 13, e0202582. [Google Scholar] [CrossRef] [PubMed]
- Aguiar, J.D.P.; Fazzi-Gomes, P.F.; Hamoy, I.G.; Santos, S.E.B.D.; Schneider, H.; Sampaio, I. Loss of genetic variability in the captive stocks of tambaqui, Colossoma macropomum (Cuvier, 1818), at breeding centres in Brazil, and their divergence from wild populations. Aquac. Res. 2018, 49, 1914–1925. [Google Scholar] [CrossRef]
- Sekino, M.; Sugaya, T.; Hara, M.; Taniguchi, N. Relatedness inferred from microsatellite genotypes as a tool for broodstock management of Japanese flounder Paralichthys olivaceus. Aquaculture 2004, 233, 163–172. [Google Scholar] [CrossRef]
- Porta, J.; Porta, J.M.; Martínez-Rodríguez, G.; Alvarez, M.C. Genetic structure and genetic relatedness of a hatchery stock of Senegal sole (Solea senegalensis) inferred by microsatellites. Aquaculture 2006, 251, 46–55. [Google Scholar] [CrossRef]
- Pino-Querido, A.; Hermida, M.; Vilariño, M.; Bouza, C.; Martínez, P. Statistical properties and performance of pairwise relatedness estimators using turbot (Scophthalmus maximus L.) family data. Aquac. Res. 2010, 41, 528–534. [Google Scholar] [CrossRef]
- Khadher, S.B.; Fontaine, P.; Milla, S.; Agnèse, J.F.; Teletchea, F. Genetic characterization and relatedness of wild and farmed Eurasian perch (Perca fluviatilis): Possible implications for aquaculture practices. Aquac. Rep. 2016, 3, 136–146. [Google Scholar] [CrossRef]
- Koljonen, M.L.; Tähtinen, J.; Säisä, M.; Koskiniemi, J. Maintenance of genetic diversity of Atlantic salmon (Salmo salar) by captive breeding programmes and the geographic distribution of microsatellite variation. Aquaculture 2002, 212, 69–92. [Google Scholar] [CrossRef]
- Seeb, J.E.; Carvalho, G.; Hauser, L.; Naish, K.; Roberts, S. Single-nucleotide polymorphism (SNP) discovery and applications of SNP genotyping in nonmodel organisms. Mol. Ecol. Res. 2011, 11 (Suppl. 1), 1–8. [Google Scholar] [CrossRef] [PubMed]
- Kong, L.; Bai, J.; Li, Q. Comparative assessment of genomic SSR, EST–SSR and EST–SNP markers for evaluation of the genetic diversity of wild and cultured Pacific oyster, Crassostrea gigas Thunberg. Aquaculture 2014, 420–421, S85–S91. [Google Scholar] [CrossRef]


| Samples | SSR | SNP | |||||||||||
|---|---|---|---|---|---|---|---|---|---|---|---|---|---|
| N | Na | Ar | Hobs | Hexp | HW | FIS | N | MAF | Hobs | Hexp | HW | FIS | |
| WILD | 34 | 4.00 ± 1.31 | 3.42 ± 1.01 | 0.441 ± 0.213 | 0.434 ± 0.214 | 0.706 | –0.018 | 34 | 0.275 ± 0.132 | 0.385 ± 0.171 | 0.370 ± 0.130 | 0.293 | 0.056 |
| FF1 | 20 | 3.50 ± 0.93 | 3.33 ± 0.86 | 0.581 ± 0.217 | 0.524 ± 0.155 | 0.009 | –0.113 | 23 | 0.285 ± 0.133 | 0.394 ± 0.194 | 0.382 ± 0.131 | 0.060 | −0.064 |
| FF2 | 22 | 3.88 ± 1.55 | 3.62 ± 1.35 | 0.460 ± 0.254 | 0.534 ± 0.208 | 0.006 | 0.140 | 13 | 0.328 ± 0.114 | 0.431 ± 0.169 | 0.434 ± 0.101 | 0.892 | −0.034 |
| FF3 | 20 | 3.88 ± 1.36 | 3.66 ± 1.27 | 0.500 ± 0.171 | 0.556 ± 0.125 | 0.325 | 0.104 | 22 | 0.269 ± 0.138 | 0.382 ± 0.182 | 0.363 ± 0.146 | 0.998 | −0.025 |
| FF4 | 17 | 4.00 ± 1.07 | 3.81 ± 1.02 | 0.596 ± 0.315 | 0.552 ± 0.204 | 0.000 | –0.081 | 17 | 0.297 ± 0.136 | 0.425 ± 0.186 | 0.394 ± 0.127 | 0.787 | −0.040 |
| FF5 | 17 | 3.50 ± 1.07 | 3.36 ± 1.02 | 0.471 ± 0.206 | 0.479 ± 0.181 | 0.751 | 0.018 | 19 | 0.270 ± 0.150 | 0.370 ± 0.174 | 0.361 ± 0.145 | 0.983 | 0.008 |
| FF6 | 14 | 3.50 ± 0.75 | 3.50 ± 0.76 | 0.438 ± 0.200 | 0.551 ± 0.112 | 0.013 | 0.212 | 19 | 0.273 ± 0.127 | 0.398 ± 0176 | 0.376 ± 0.130 | 0.988 | −0.062 |
| FF7 | 25 | 4.50 ± 1.20 | 3.97 ± 1.19 | 0.530 ± 0.177 | 0.572 ± 0.170 | 0.169 | 0.074 | 26 | 0.270 ± 0.144 | 0.342 ± 0.148 | 0.362 ± 0.147 | 0.947 | −0.082 |
| Samples | SSR | SNP | |||
|---|---|---|---|---|---|
| M-ratio | Ne | ∆F | Ne | ∆F | |
| WILD | 0.31 ± 0.14 | 32.0 (2.8−inf.) | 0.02 | 20.2 (12.7–35.2) | 0.02 |
| FF1 | 0.31 ± 0.16 | 18.1 (18.1–inf.) | 0.03 | 2.3 (1.8–2.9) | 0.22 |
| FF2 | 0.31 ± 0.16 | 7.8 (7.8–inf.) | 0.06 | 3.2 (2.0–10.7) | 0.16 |
| FF3 | 0.30 ± 0.15 | 10.0 (3.3–28.9) | 0.05 | 8.7 (4.6–15.8) | 0.06 |
| FF4 | 0.33 ± 0.17 | 7.0 (2.5–20.9) | 0.07 | 4.3 (2.5–8.9) | 0.12 |
| FF5 | 0.41 ± 0.30 | 21.1 (2.9–inf.) | 0.02 | 12.5 (6.5–28.9) | 0.04 |
| FF6 | 0.38 ± 0.28 | 60.8 (5.3–inf.) | 0.01 | 9.9 (5.7–17.8) | 0.05 |
| FF7 | 0.30 ± 0.14 | 16.1 (5.8–86) | 0.03 | 4.4 (2.7–7.5) | 0.11 |
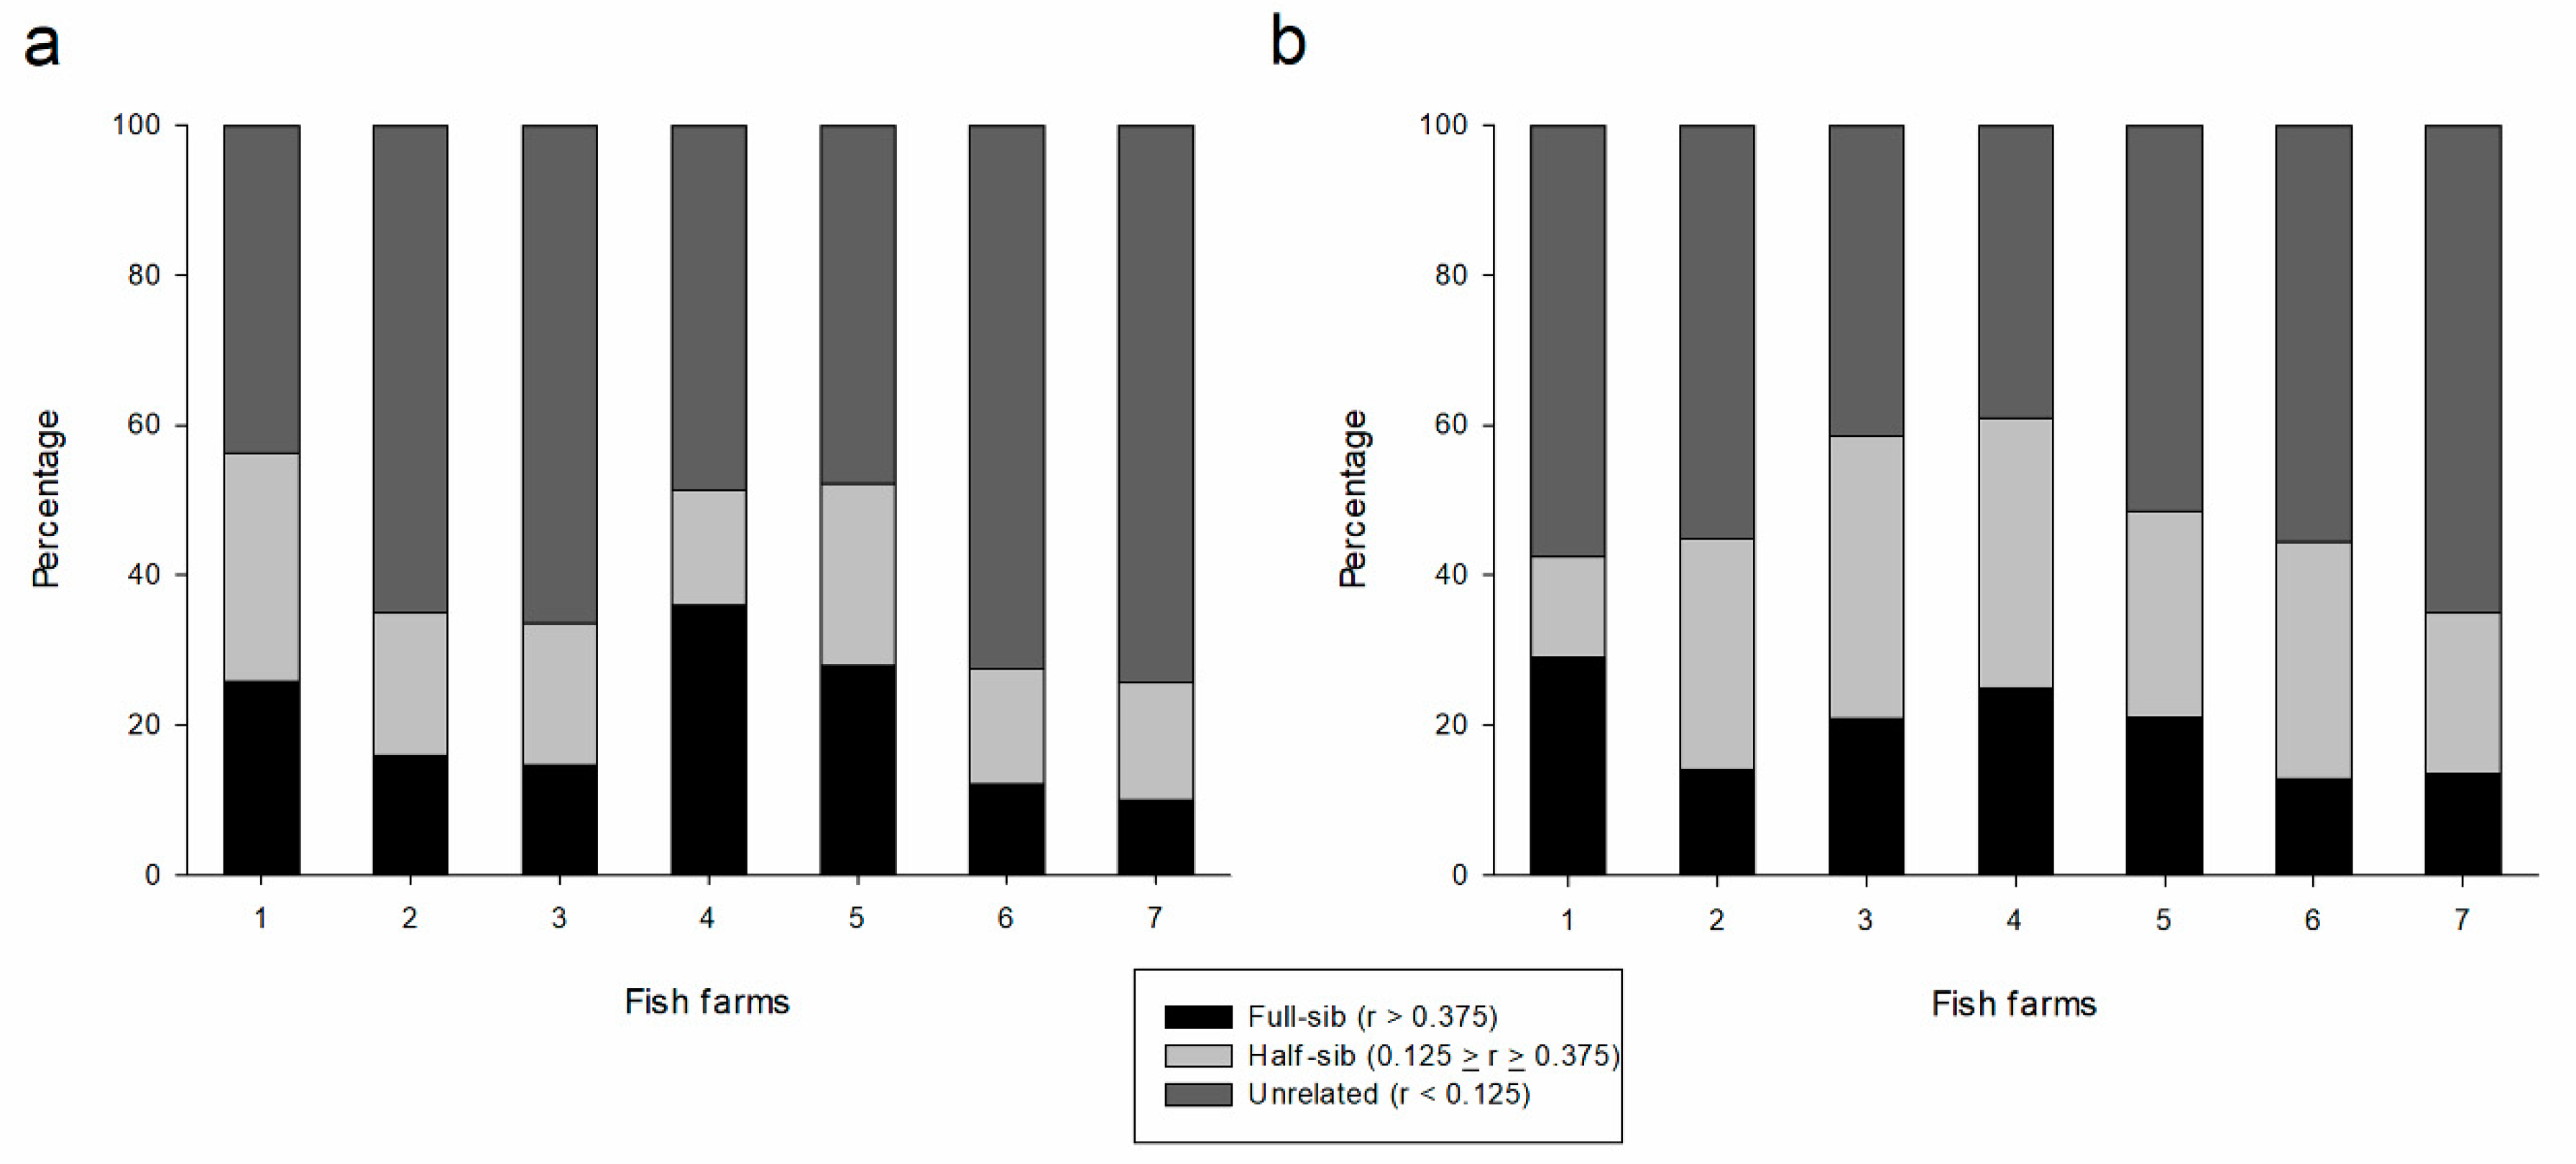
| Fish Farm | SSR | SNP | ||||
|---|---|---|---|---|---|---|
| Unrelated | Half-sib | Full-sib | Unrelated | Half-sib | Full-sib | |
| FF1 | 43.7 | 30.5 | 25.8 | 57.5 | 13.5 | 29.0 |
| FF2 | 64.9 | 19.0 | 16.0 | 55.1 | 30.8 | 14.1 |
| FF3 | 66.3 | 18.9 | 14.7 | 41.5 | 37.7 | 20.8 |
| FF4 | 48.5 | 15.4 | 36.0 | 39.0 | 36.0 | 25.0 |
| FF5 | 47.8 | 24.3 | 27.9 | 51.5 | 27.5 | 21.0 |
| FF6 | 72.5 | 15.4 | 12.1 | 55.6 | 31.5 | 12.9 |
| FF7 | 74.3 | 15.7 | 10.0 | 65.1 | 21.3 | 13.6 |
| FF1 | FF2 | FF3 | FF4 | FF5 | FF6 | FF7 | WILD | |
|---|---|---|---|---|---|---|---|---|
| FF1 | - | 0.096 | 0.057 | 0.066 | 0.085 | 0.081 | 0.041 | 0.052 |
| FF2 | 0.042 | - | 0.067 | 0.146 | 0.104 | 0.042 | 0.092 | 0.053 |
| FF3 | 0.092 | 0.042 | - | 0.136 | 0.095 | 0.054 | 0.051 | 0.051 |
| FF4 | 0.130 | 0.143 | 0.090 | - | 0.089 | 0.093 | 0.067 | 0.094 |
| FF5 | 0.111 | 0.063 | 0.043 | 0.145 | - | 0.068 | 0.063 | 0.070 |
| FF6 | 0.027 | 0.005 | –0.002 | 0.095 | 0.040 | - | 0.052 | 0.036 |
| FF7 | 0.035 | 0.046 | 0.063 | 0.115 | 0.055 | 0.027 | - | 0.032 |
| WILD | 0.033 | 0.039 | 0.120 | 0.204 | 0.115 | 0.041 | 0.081 | - |
© 2019 by the authors. Licensee MDPI, Basel, Switzerland. This article is an open access article distributed under the terms and conditions of the Creative Commons Attribution (CC BY) license (http://creativecommons.org/licenses/by/4.0/).
Share and Cite
Mastrochirico-Filho, V.A.; del Pazo, F.; Hata, M.E.; Villanova, G.V.; Foresti, F.; Vera, M.; Martínez, P.; Porto-Foresti, F.; Hashimoto, D.T. Assessing Genetic Diversity for a Pre-Breeding Program in Piaractus mesopotamicus by SNPs and SSRs. Genes 2019, 10, 668. https://doi.org/10.3390/genes10090668
Mastrochirico-Filho VA, del Pazo F, Hata ME, Villanova GV, Foresti F, Vera M, Martínez P, Porto-Foresti F, Hashimoto DT. Assessing Genetic Diversity for a Pre-Breeding Program in Piaractus mesopotamicus by SNPs and SSRs. Genes. 2019; 10(9):668. https://doi.org/10.3390/genes10090668
Chicago/Turabian StyleMastrochirico-Filho, Vito Antonio, Felipe del Pazo, Milene Elissa Hata, Gabriela Vanina Villanova, Fausto Foresti, Manuel Vera, Paulino Martínez, Fábio Porto-Foresti, and Diogo Teruo Hashimoto. 2019. "Assessing Genetic Diversity for a Pre-Breeding Program in Piaractus mesopotamicus by SNPs and SSRs" Genes 10, no. 9: 668. https://doi.org/10.3390/genes10090668
APA StyleMastrochirico-Filho, V. A., del Pazo, F., Hata, M. E., Villanova, G. V., Foresti, F., Vera, M., Martínez, P., Porto-Foresti, F., & Hashimoto, D. T. (2019). Assessing Genetic Diversity for a Pre-Breeding Program in Piaractus mesopotamicus by SNPs and SSRs. Genes, 10(9), 668. https://doi.org/10.3390/genes10090668