Computational Processing and Quality Control of Hi-C, Capture Hi-C and Capture-C Data

 , , , , and
Abstract
1. Introduction
2. Experimental Protocols: Hi-C, CHC and Capture-C
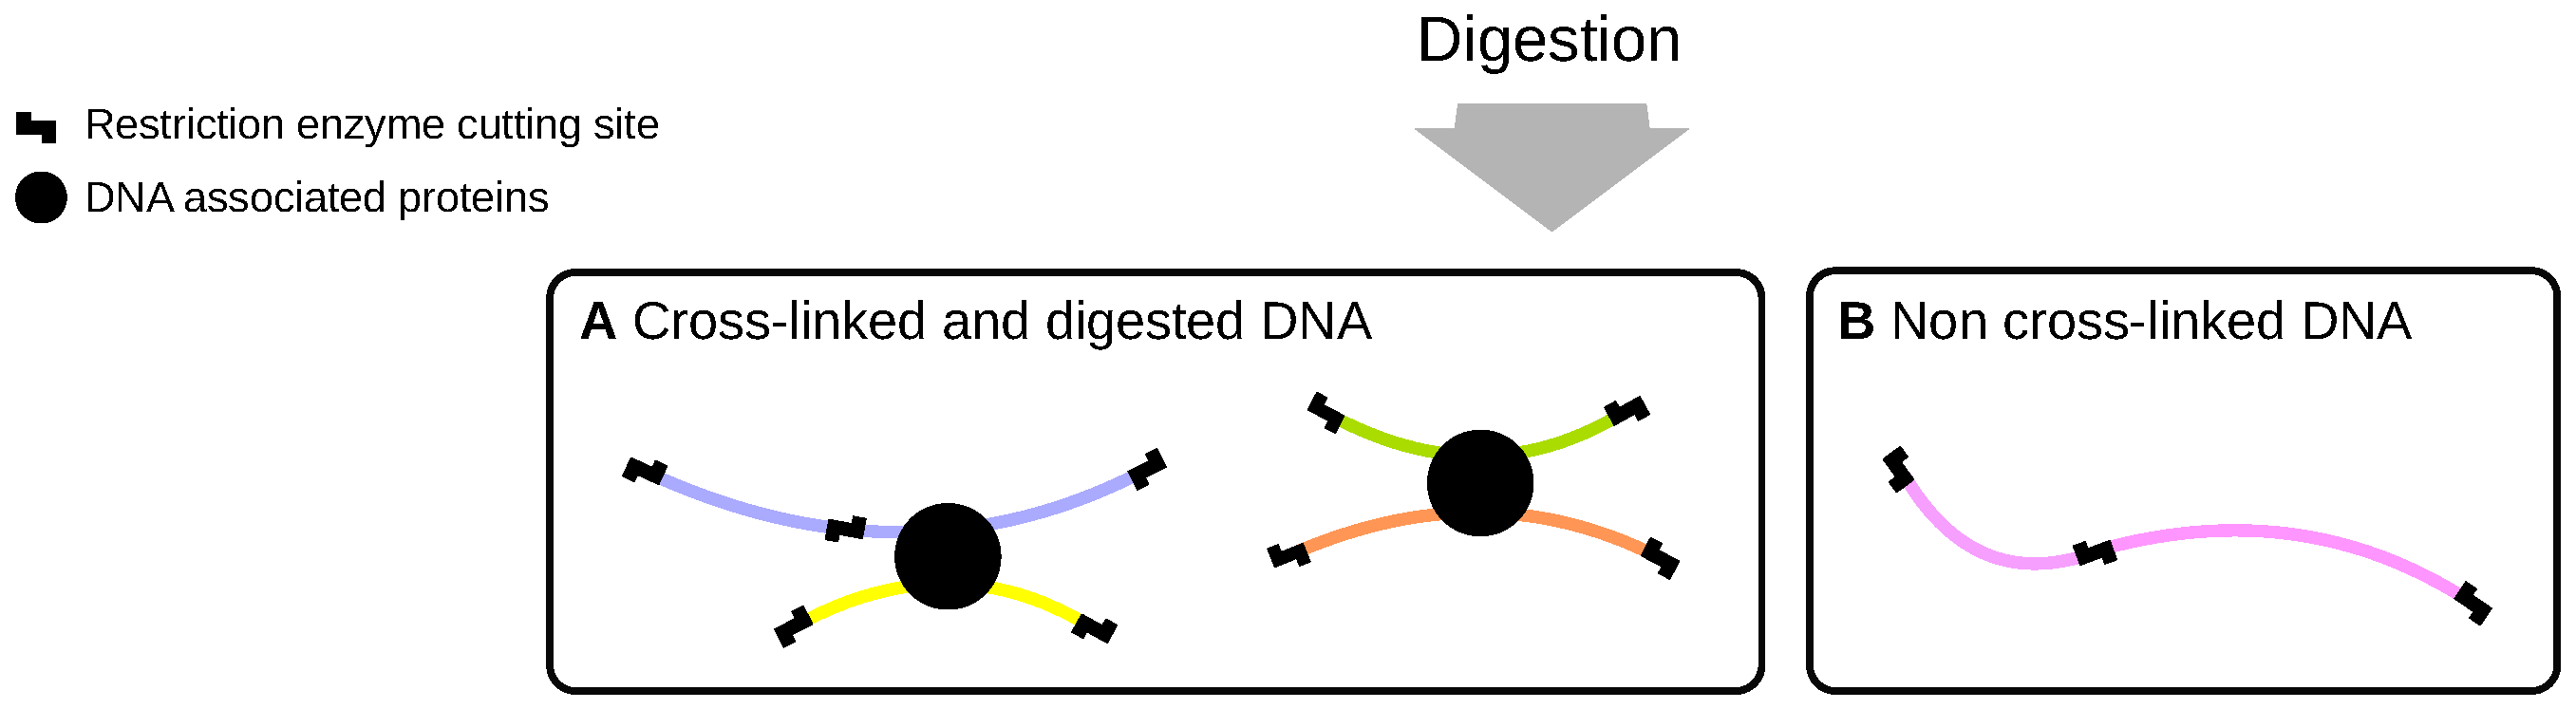
2.1. Cross-Linking and Digestion
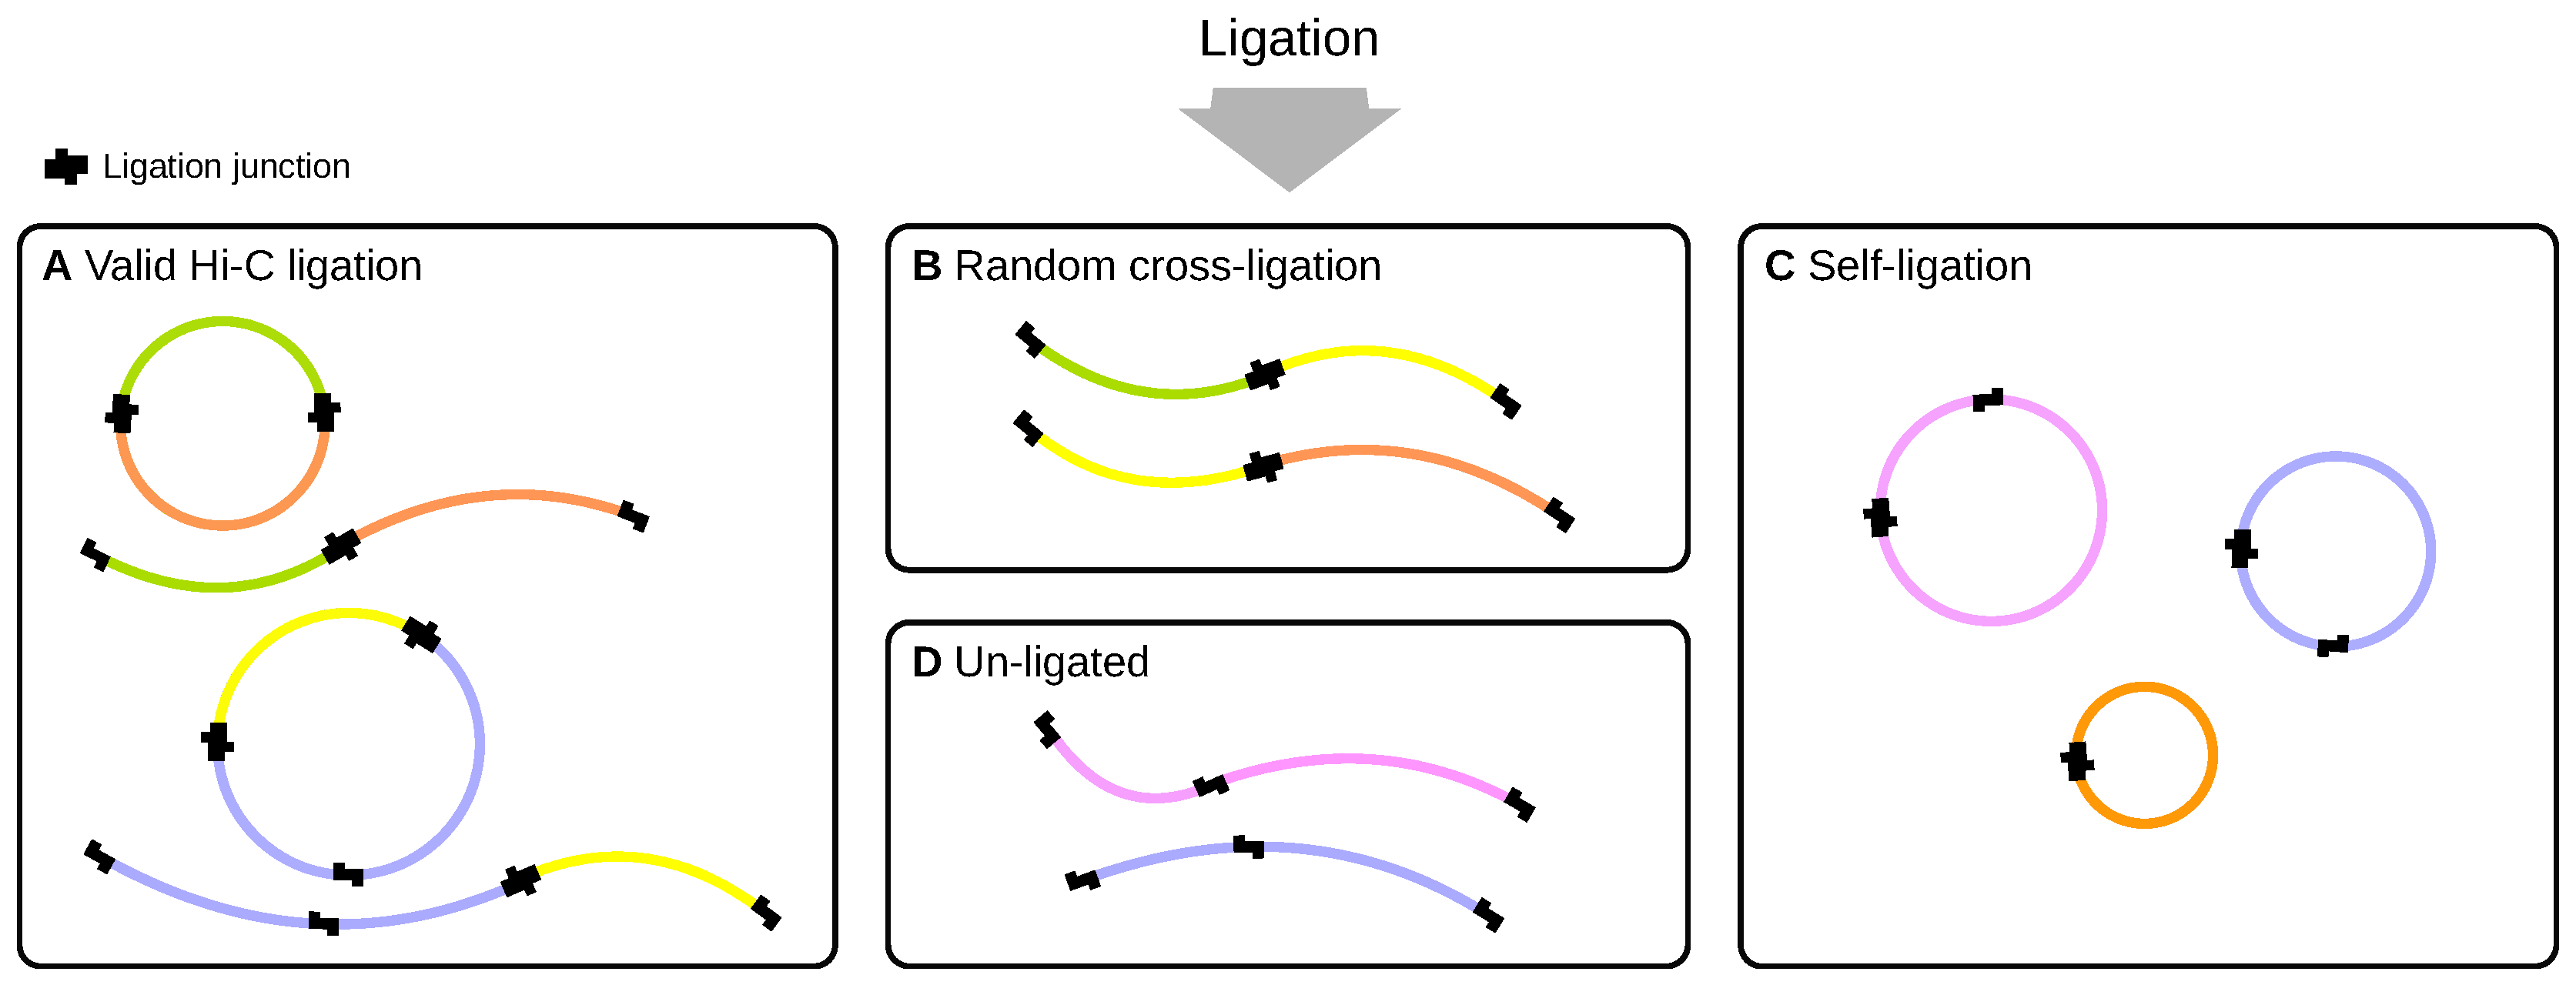
2.2. Ligation
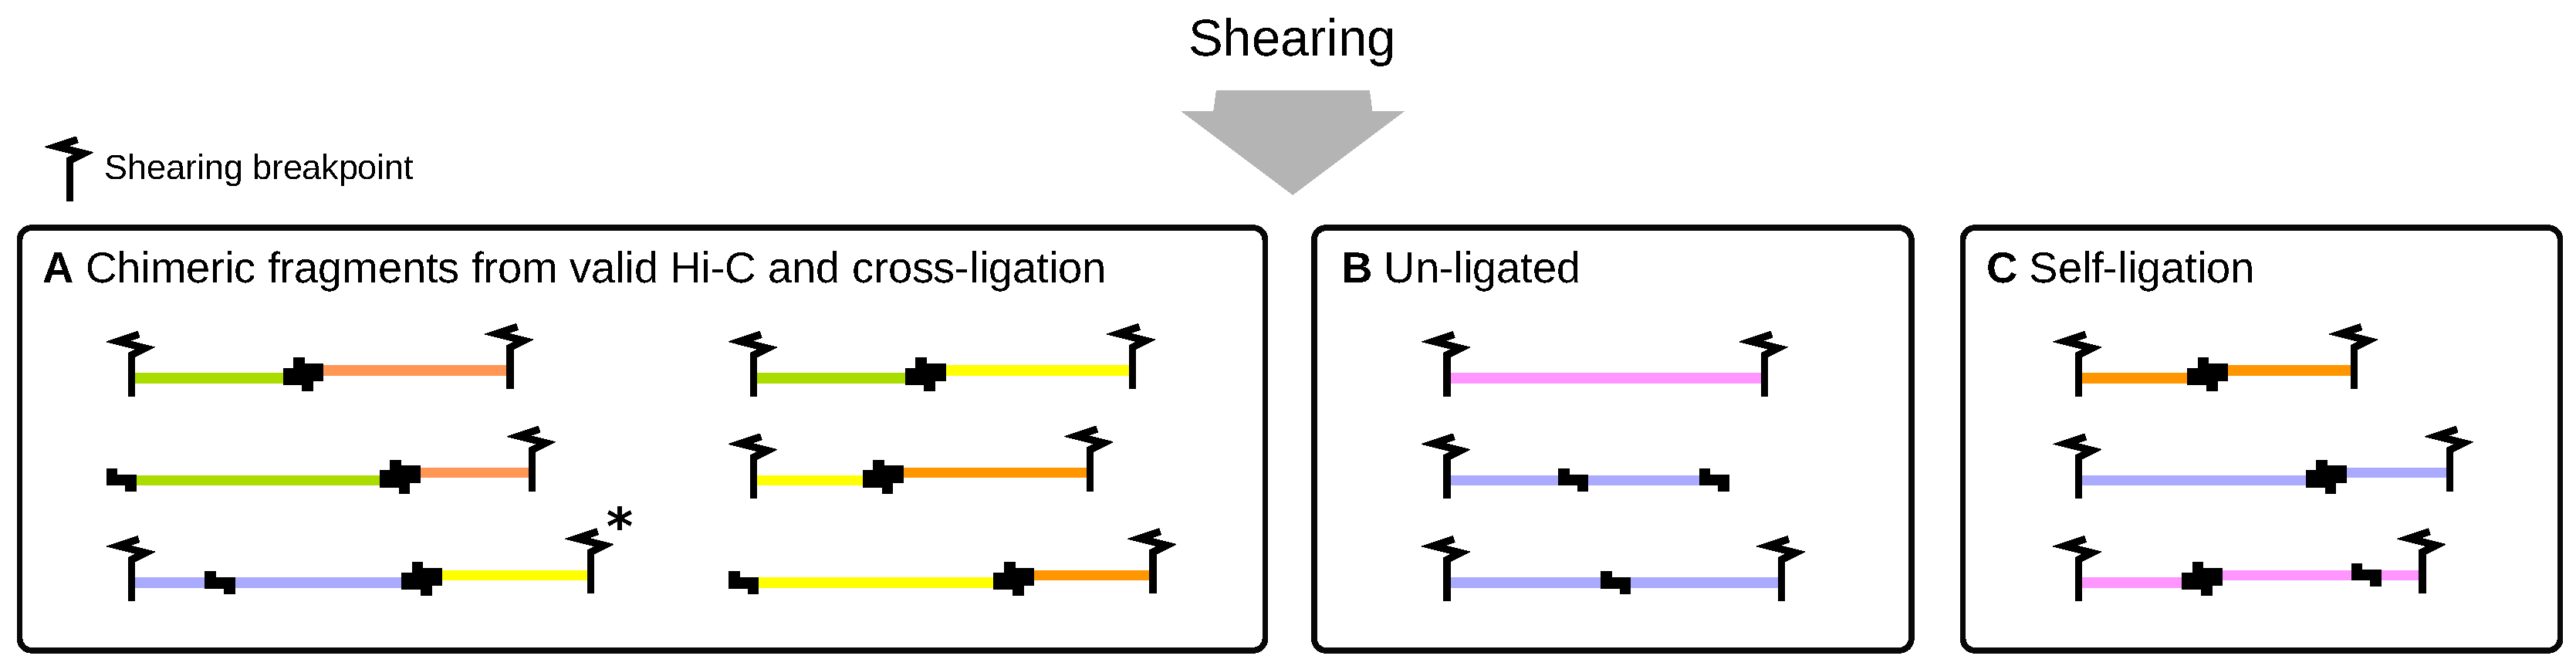
2.3. Shearing by Sonication
2.4. Sequencing and Mapping
2.5. Enrichment of Target Fragments
3. A Processing Pipeline for Read Pair Categorization
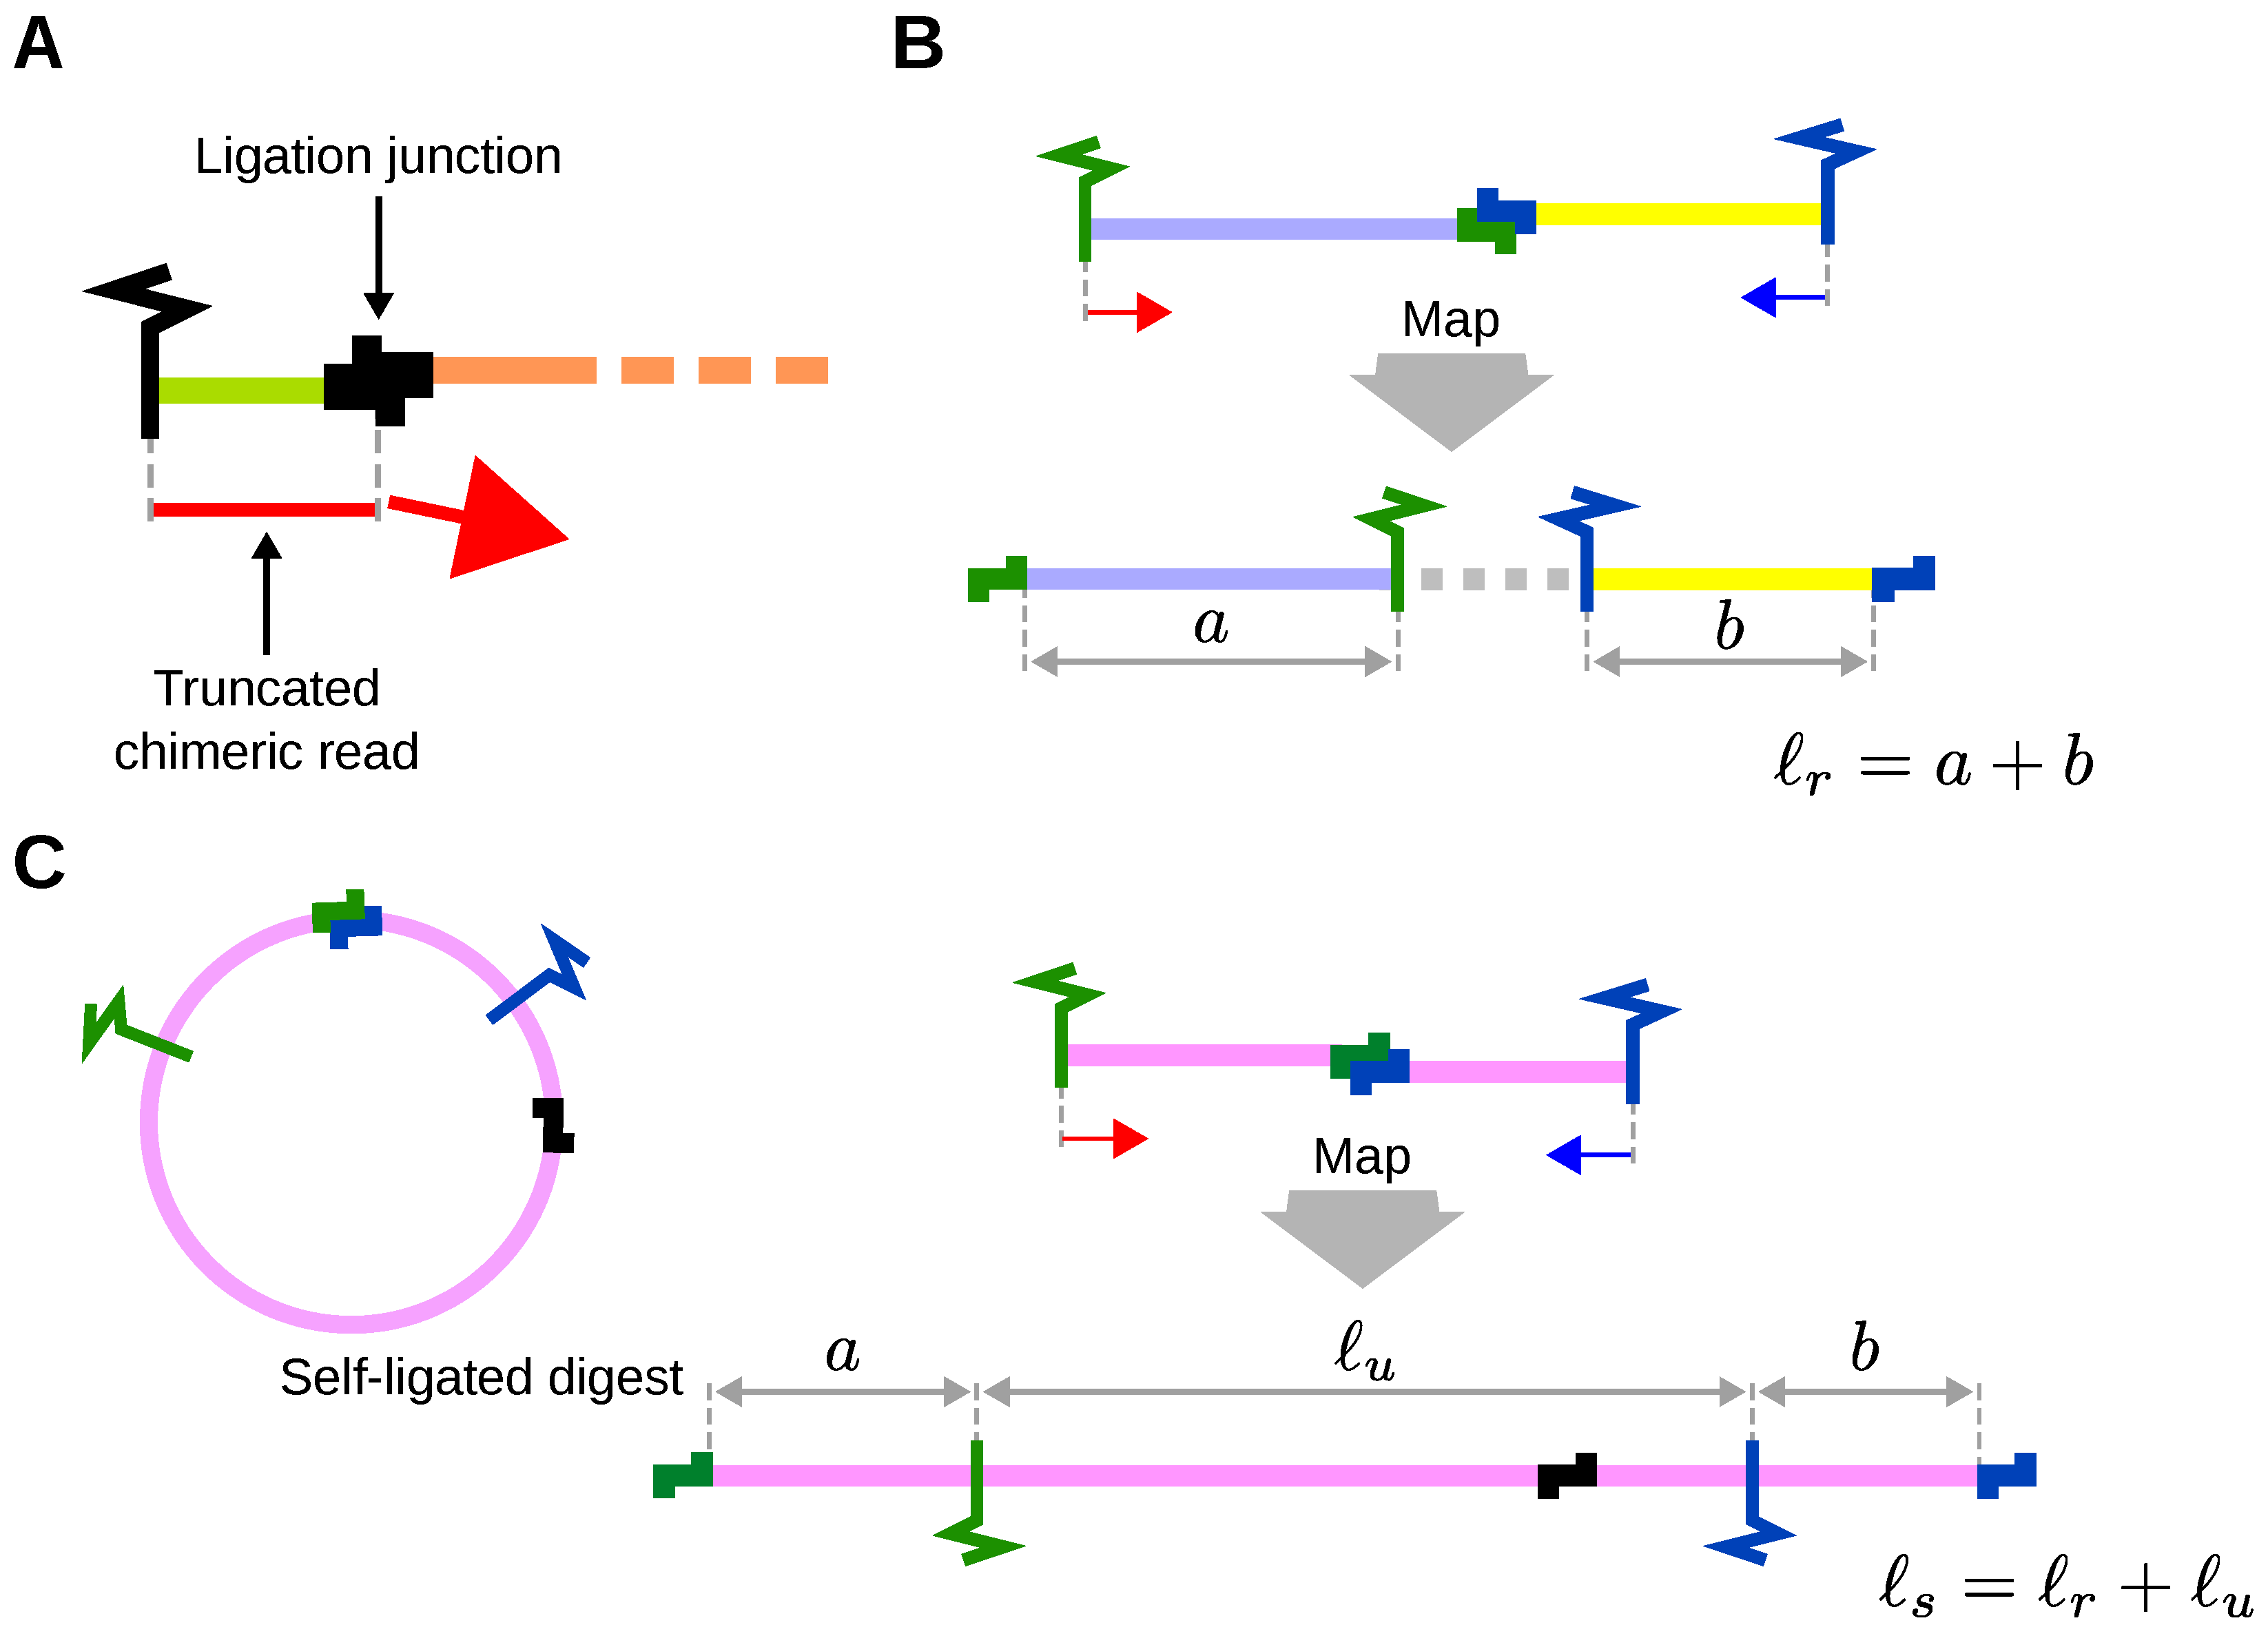
3.1. Truncation of Reads
3.2. Independent Mapping of Reads and Re-Pairing
3.3. Fragment and Digest Size Calculations
3.4. Elimination of Artefactual Read Pairs
3.5. Quality Metrics
4. Computational Tools for Processing Hi-C and Capture Hi-C Data
5. Three Exemplary Datasets
6. Conclusions
7. Methods
7.1. Datasets
7.2. Diachromatic
7.3. Digest Map for Andrey et al. 2016
7.4. Digest Map for Mifsud et al. 2015
Author Contributions
Funding
Conflicts of Interest
References
- Denker, A.; De Laat, W. The second decade of 3C technologies: Detailed insights into nuclear organization. arXiv 2016, arXiv:1011.1669v3. [Google Scholar] [CrossRef] [PubMed]
- Lupiáñez, D.G.; Spielmann, M.; Mundlos, S. Breaking TADs: How alterations of chromatin domains result in disease. Trends Genet. 2016, 32, 225–237. [Google Scholar] [CrossRef] [PubMed]
- Davies, J.O.; Telenius, J.M.; McGowan, S.J.; Roberts, N.A.; Taylor, S.; Higgs, D.R.; Hughes, J.R. Multiplexed analysis of chromosome conformation at vastly improved sensitivity. Nat. Methods 2015, 13, 74–80. [Google Scholar] [CrossRef] [PubMed]
- Lieberman-Aiden, E.; Van Berkum, N.L.; Williams, L.; Imakaev, M.; Ragoczy, T.; Telling, A.; Amit, I.; Lajoie, B.R.; Sabo, P.J.; Dorschner, M.O.; et al. Comprehensive mapping of long-range interactions reveals folding principles of the human genome. Science 2009, 326, 289–293. [Google Scholar] [CrossRef] [PubMed]
- de Wit, E.; de Laat, W. A decade of 3C technologies: Insights into nuclear organization. Genes Dev. 2012, 26, 11–24. [Google Scholar] [CrossRef] [PubMed]
- Schoenfelder, S.; Furlan-Magaril, M.; Mifsud, B.; Tavares-Cadete, F.; Sugar, R.; Javierre, B.M.; Nagano, T.; Katsman, Y.; Sakthidevi, M.; Wingett, S.W.; et al. The pluripotent regulatory circuitry connecting promoters to their long-range interacting elements. Genome Res. 2015, 25, 582–597. [Google Scholar] [CrossRef] [PubMed]
- Hughes, J.R.; Roberts, N.; McGowan, S.; Hay, D.; Giannoulatou, E.; Lynch, M.; De Gobbi, M.; Taylor, S.; Gibbons, R.; Higgs, D.R. Analysis of hundreds of cis-regulatory landscapes at high resolution in a single, high-throughput experiment. Nat. Genet. 2014, 46, 205–212. [Google Scholar] [CrossRef] [PubMed]
- Andrey, G.; Schöpflin, R.; Jerković, I.; Heinrich, V.; Ibrahim, D.M.; Paliou, C.; Hochradel, M.; Timmermann, B.; Haas, S.; Vingron, M.; et al. Characterization of hundreds of regulatory landscapes in developing limbs reveals two regimes of chromatin folding. Genome Res. 2017, 27, 223–233. [Google Scholar] [CrossRef] [PubMed]
- Hansen, P.; Ali, S.; Blau, H.; Danis, D.; Hecht, J.; Kornak, U.; Lupiáñez, D.G.; Mundlos, S.; Steinhaus, R.; Robinson, P.N. GOPHER: Generator of probes for capture Hi-C experiments at high resolution. BMC Genom. 2019, 20. [Google Scholar] [CrossRef]
- Ay, F.; Noble, W.S. Analysis methods for studying the 3D architecture of the genome. Genome Biol. 2015, 16, 183. [Google Scholar] [CrossRef]
- Langmead, B.; Salzberg, S.L. Fast gapped-read alignment with Bowtie 2. Nat. Methods 2012, 9, 357–359. [Google Scholar] [CrossRef] [PubMed]
- Wingett, S.; Ewels, P.; Furlan-Magaril, M.; Nagano, T.; Schoenfelder, S.; Fraser, P.; Andrews, S. HiCUP: Pipeline for mapping and processing Hi-C data. F1000Research 2015, 4, 1310. [Google Scholar] [CrossRef] [PubMed]
- Li, H.; Handsaker, B.; Wysoker, A.; Fennell, T.; Ruan, J.; Homer, N.; Marth, G.; Abecasis, G.; Durbin, R.; Subgroup, G.P.D.P. The sequence alignment/map format and SAMtools. Bioinformatics 2009, 25, 2078–2079. [Google Scholar] [CrossRef] [PubMed]
- Nagano, T.; Várnai, C.; Schoenfelder, S.; Javierre, B.M.; Wingett, S.W.; Fraser, P. Comparison of Hi-C results using in-solution versus in-nucleus ligation. Genome Biol. 2015, 16. [Google Scholar] [CrossRef] [PubMed]
- Servant, N.; Varoquaux, N.; Lajoie, B.R.; Viara, E.; Chen, C.J.; Vert, J.P.; Heard, E.; Dekker, J.; Barillot, E. HiC-Pro: An optimized and flexible pipeline for Hi-C data processing. Genome Biol. 2015, 16, 259. [Google Scholar] [CrossRef] [PubMed]
- Durand, N.C.; Shamim, M.S.; Machol, I.; Rao, S.S.P.; Huntley, M.H.; Lander, E.S.; Aiden, E.L. Juicer provides a one-click system for analyzing loop-resolution Hi-C experiments. Cell Syst. 2016, 3, 95–98. [Google Scholar] [CrossRef] [PubMed]
- Schmid, M.W.; Grob, S.; Grossniklaus, U. HiCdat: A fast and easy-to-use Hi-C data analysis tool. BMC Bioinform. 2015, 16, 277. [Google Scholar] [CrossRef] [PubMed]
- Heinz, S.; Benner, C.; Spann, N.; Bertolino, E.; Lin, Y.C.; Laslo, P.; Cheng, J.X.; Murre, C.; Singh, H.; Glass, C.K. Simple combinations of lineage-determining transcription factors prime cis-regulatory elements required for macrophage and B cell identities. Mol. Cell 2010, 38, 576–589. [Google Scholar] [CrossRef]
- Lazaris, C.; Kelly, S.; Ntziachristos, P.; Aifantis, I.; Tsirigos, A. HiC-bench: Comprehensive and reproducible Hi-C data analysis designed for parameter exploration and benchmarking. BMC Genom. 2017, 18, 22. [Google Scholar] [CrossRef]
- Yaffe, E.; Tanay, A. Probabilistic modeling of Hi-C contact maps eliminates systematic biases to characterize global chromosomal architecture. Nat. Genet 2011, 43, 1059–1065. [Google Scholar] [CrossRef]
- Stansfield, J.C.; Cresswell, K.G.; Vladimirov, V.I.; Dozmorov, M.G. HiCcompare: An R-package for joint normalization and comparison of HI-C datasets. BMC Bioinform. 2018, 19. [Google Scholar] [CrossRef] [PubMed]
- Hu, M.; Deng, K.; Selvaraj, S.; Qin, Z.; Ren, B.; Liu, J.S. HiCNorm: Removing biases in Hi-C data via Poisson regression. Bioinformatics 2012, 28, 3131–3133. [Google Scholar] [CrossRef]
- Carty, M.; Zamparo, L.; Sahin, M.; González, A.; Pelossof, R.; Elemento, O.; Leslie, C.S. An integrated model for detecting significant chromatin interactions from high-resolution Hi-C data. Nat. Commun. 2017, 8, 15454. [Google Scholar] [CrossRef] [PubMed]
- Imakaev, M.; Fudenberg, G.; McCord, R.P.; Naumova, N.; Goloborodko, A.; Lajoie, B.R.; Dekker, J.; Mirny, L.A. Iterative correction of Hi-C data reveals hallmarks of chromosome organization. Nat. Methods 2012, 9, 999–1003. [Google Scholar] [CrossRef] [PubMed]
- Li, W.; Gong, K.; Li, Q.; Alber, F.; Zhou, X.J. Hi-Corrector: A fast, scalable and memory-efficient package for normalizing large-scale Hi-C data. Bioinformatics 2015, 31, 960–962. [Google Scholar] [CrossRef] [PubMed]
- Jin, F.; Li, Y.; Dixon, J.R.; Selvaraj, S.; Ye, Z.; Lee, A.Y.; Yen, C.A.; Schmitt, A.D.; Espinoza, C.A.; Ren, B. A high-resolution map of the three-dimensional chromatin interactome in human cells. Nature 2013, 503, 290–294. [Google Scholar] [CrossRef]
- Lajoie, B.R.; Dekker, J.; Kaplan, N. The Hitchhiker’s guide to Hi-C analysis: practical guidelines. Methods 2015, 72, 65–75. [Google Scholar] [CrossRef]
- Forcato, M.; Nicoletti, C.; Pal, K.; Livi, C.M.; Ferrari, F.; Bicciato, S. Comparison of computational methods for Hi-C data analysis. Nat. Methods 2017, 14. [Google Scholar] [CrossRef]
- Han, Z.; Wei, G. Computational tools for Hi-C data analysis. Quant. Biol. 2017, 5, 215–225. [Google Scholar] [CrossRef]
- Nicoletti, C.; Forcato, M.; Bicciato, S. Computational methods for analyzing genome-wide chromosome conformation capture data. Curr. Opin. Biotechnol. 2018, 54, 98–105. [Google Scholar] [CrossRef]
- Zufferey, M.; Tavernari, D.; Oricchio, E.; Ciriello, G. Comparison of computational methods for the identification of topologically associating domains. Genome Biol. 2018, 19, 217. [Google Scholar] [CrossRef]
- Dali, R.; Blanchette, M. A critical assessment of topologically associating domain prediction tools. Nucleic Acids Res. 2017, 45. [Google Scholar] [CrossRef]
- Cairns, J.; Freire-Pritchett, P.; Wingett, S.W.; Várnai, C.; Dimond, A.; Plagnol, V.; Zerbino, D.; Schoenfelder, S.; Javierre, B.M.; Osborne, C.; et al. CHiCAGO: Robust detection of DNA looping interactions in Capture Hi-C data. Genome Biol. 2016, 17, 127. [Google Scholar] [CrossRef]
- Cairns, J.; Orchard, W.R.; Malysheva, V.; Spivakov, M. Chicdiff: A computational pipeline for detecting differential chromosomal interactions in Capture Hi-C data. Bioinformatics 2019. [Google Scholar] [CrossRef]
- Chakraborty, A.; Ay, F. Identification of copy number variations and translocations in cancer cells from Hi-C data. Bioinformatics 2017. [Google Scholar] [CrossRef]
- Jäger, R.; Migliorini, G.; Henrion, M.; Kandaswamy, R.; Speedy, H.E.; Heindl, A.; Whiffin, N.; Carnicer, M.J.; Broome, L.; Dryden, N.; et al. Capture Hi-C identifies the chromatin interactome of colorectal cancer risk loci. Nat. Commun. 2015, 6, 6178. [Google Scholar] [CrossRef]
- Mifsud, B.; Tavares-Cadete, F.; Young, A.N.; Sugar, R.; Schoenfelder, S.; Ferreira, L.; Wingett, S.W.; Andrews, S.; Grey, W.; Ewels, P.A.; et al. Mapping long-range promoter contacts in human cells with high-resolution capture Hi-C. Nat. Genet. 2015, 47, 598–606. [Google Scholar] [CrossRef]
- Leinonen, R.; Sugawara, H.; Shumway, M. The sequence read archive. Nucleic Acids Res. 2011, 39. [Google Scholar] [CrossRef]


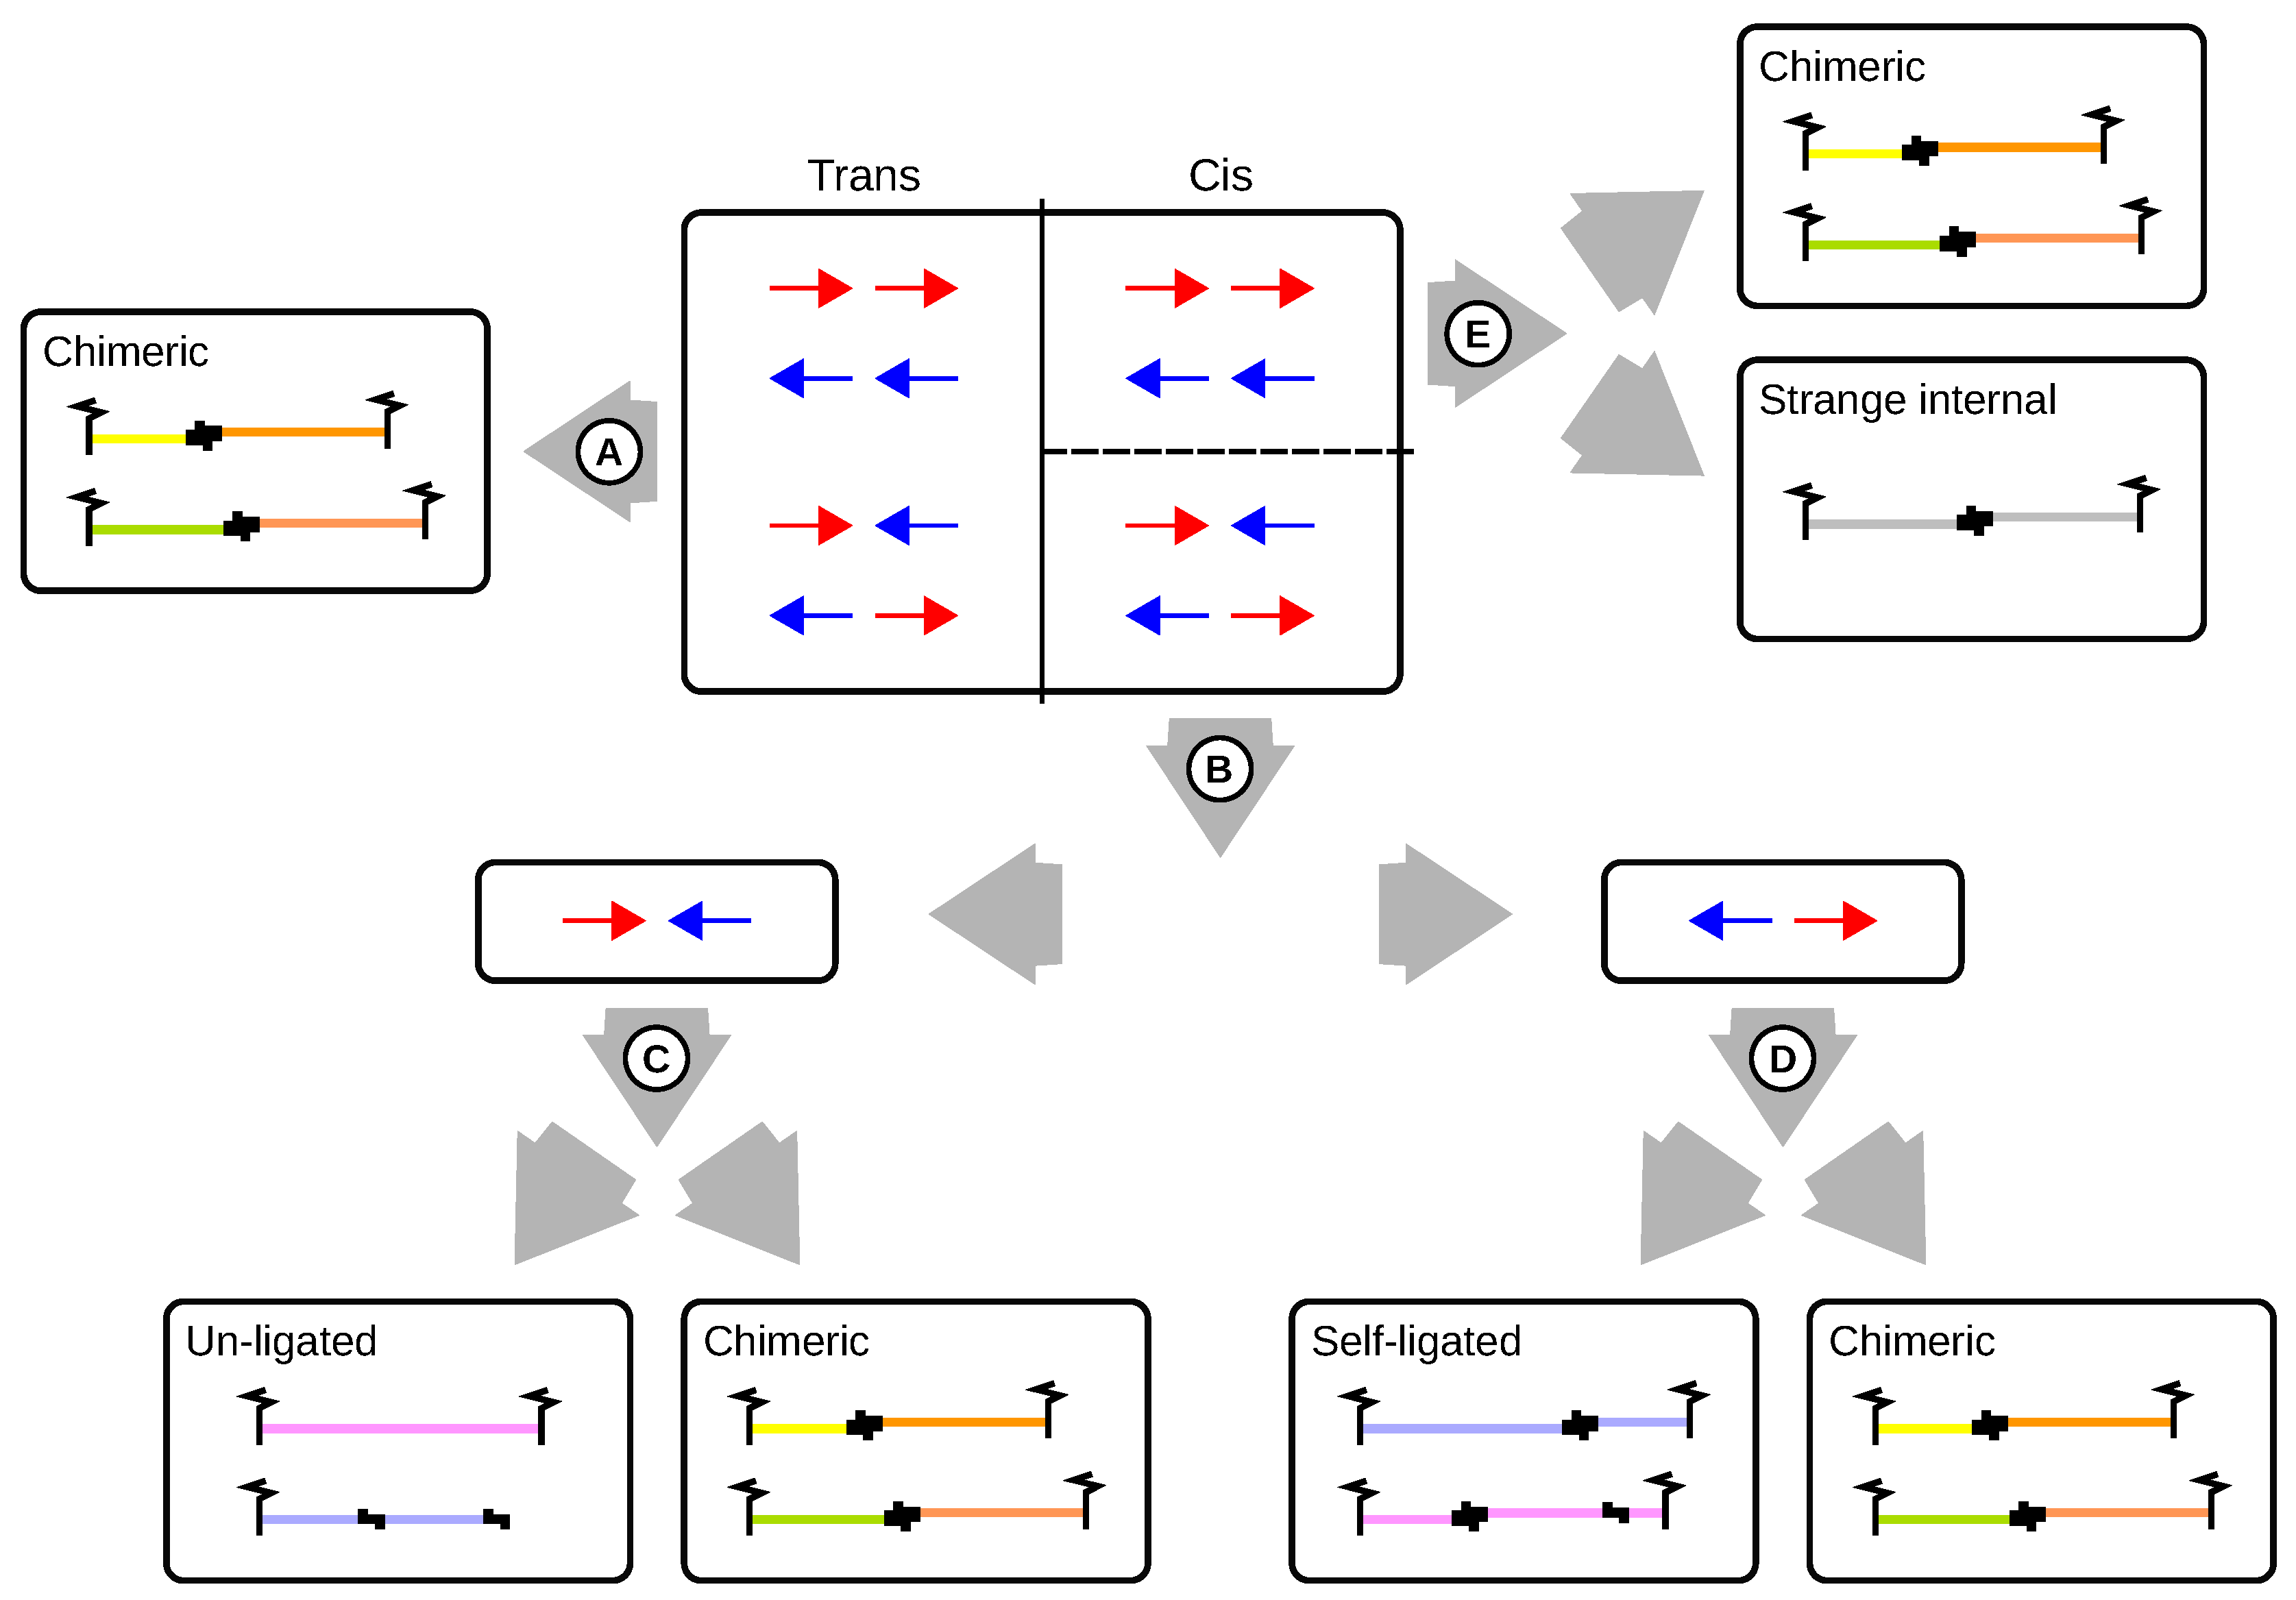
| Truncation, Mapping and Deduplication | |
|---|---|
| Total raw read pairs | Input read pairs in the raw FASTQ (usually ). |
| Removed by truncation | Read pairs removed because at least one of the reads was too short to map following truncation at a ligation sequence. Depends on the specificity of the read sequence at ligation junctions, which is typically higher with longer restriction enzyme recognition sequences and if sticky ends are filled in. |
| Unmapped/multimapped | Read pairs removed because at least one of the reads could not be mapped (or could not be mapped uniquely). |
| Duplicated | Removed duplicated read pairs (one pair is retained for downstream analysis). High duplication rates indicate low library complexity that may be due to low amounts of DNA used for library preparation. |
| Dangling ends | Read pairs at least one of whose 5’ ends coincides with a restriction enzyme cutting site. Dangling ends may correspond to un-ligated digest ends. |
| Remaining pairs | Total read pairs that were not removed in the course of truncation, mapping and deduplication (usually on the order of ). |
| Re-paired read pairs | |
| Un-ligated | Large proportions of un-ligated read pairs indicate inefficient biotin pull down of fragments with ligation junction. For Capture-C, the proportion of un-ligated pairs is much higher because no pull down is performed. |
| Self-ligated | Self-ligation seems to be a rare event. Because fragments arising from self-ligation contain ligation junctions the proportions may be higher for capture Hi-C (CHC) as compared to Capture-C. |
| Strange internal | Number of read pairs for which both reads map to the same strand and restriction digest. Cannot be explained by un-ligated or self-ligated digests. Typically, this category make up only very small proportions (less than 0.1% of re-paired pairs). |
| Chimeric | Read pairs that arise from interactions or random cross-ligations (on the order of ). |
| Chimeric read pairs | |
| Trans | Chimeric read pairs whose reads map to different chromosomes. Large proportions indicate a high degree of random cross-ligation. |
| Cis | Chimeric read pairs whose reads map to the same chromosome. |
| Non-singleton index (NSI) | Number of interactions that consist of more than one read pair. A high proportion of singleton interactions may indicate a high degree of random cross-ligation because random cross-ligations for a given digest pair are unlikely to occur more than once. |
| Global quality metrics | |
| Yield of chimeric pairs (YCP) | Percentage among input read pairs that are classified as chimeric and used for downstream analysis. Low percentages may indicate low overall performance of the protocol. |
| cis:trans ratio | Low percentages of cis read pairs indicate a high degree of random cross-ligation. |
| Yield of non-singleton pairs | Percentage among input read pairs that belong to interactions with more than one read pair. |
| Target enrichment | Percentage of chimeric read pairs for which at least on read is mapped to a target region. Low percentages indicate poor performance of target enrichment. |
| Item | Capture-C | Capture Hi-C | Hi-C |
|---|---|---|---|
| Dataset/N samples | Andrey/12 | Mifsud/9 | Mifsud/2 |
| Truncation, Mapping and Deduplication | |||
| Total raw read pairs | 93,660,130 | 145,385,372 | 175,986,419 |
| Percentage | 100% | 100% | 100% |
| Removed by truncation | 18,260,618 | 3,619,477 | 6,789,444 |
| Percentage | 19.50% | 2.49% | 3.86% |
| Unmapped/multimapped | 10,265,988 | 41,969,433 | 58,468,465 |
| Percentage | 10.96% | 28.87% | 33.22% |
| Duplicated | 28,963,777 | 17,906,644 | 3,467,125 |
| Percentage | 30.92% | 12.32% | 1.97% |
| Remaining pairs | 36,169,746 | 81,889,818 | 107,261,386 |
| Percentage | 38.62% | 56.33% | 60.95% |
| Dangling ends | 1,532,317 | 3,479,723 | 3,248,438 |
| Percentage | 4.24% | 4.25% | 3.03% |
| Categorization of re-paired read pairs | |||
| Un-ligated | 30,847,302 | 9,610,217 | 15,045,042 |
| Percentage | 85.28% | 11.74% | 14.03% |
| Self-ligated | 108,714 | 2,096,818 | 5,290,287 |
| Percentage | 0.30% | 2.26% | 4.93% |
| Strange internal | 1039 | 71,356 | 73,257 |
| Percentage | 0.00% | 0.09% | 0.07% |
| Chimeric | 5,212,691 | 70,111,427 | 86,852,801 |
| Percentage | 14.41% | 85.62% | 80.97% |
| Analysis of chimeric read pairs | |||
| Trans | 2,359,391 | 34,795,199 | 55,458,895 |
| Percentage | 45.26% | 49.63% | 63.85% |
| Cis | 2,853,300 | 35,316,228 | 31,393,906 |
| Percentage | 54.74% | 50.37% | 36.15% |
| Non-singleton index (NSI) | 607,086 | 11,211,773 | 8,413,573 |
| Percentage | 11.65% | 15.99% | 9.69% |
| Global quality metrics | |||
| Yield of chimeric pairs (YCP) | 5.57% | 48.22% | 49.35% |
| cis:trans ratio | 1.21 | 1.01 | 0.57 |
| Yield of non-singleton pairs | 0.65% | 7.71% | 4.78% |
| Target enrichment | 29.91% | 22.44% | n/a |
© 2019 by the authors. Licensee MDPI, Basel, Switzerland. This article is an open access article distributed under the terms and conditions of the Creative Commons Attribution (CC BY) license (http://creativecommons.org/licenses/by/4.0/).
Share and Cite
Hansen, P.; Gargano, M.; Hecht, J.; Ibn-Salem, J.; Karlebach, G.; Roehr, J.T.; Robinson, P.N. Computational Processing and Quality Control of Hi-C, Capture Hi-C and Capture-C Data. Genes 2019, 10, 548. https://doi.org/10.3390/genes10070548
Hansen P, Gargano M, Hecht J, Ibn-Salem J, Karlebach G, Roehr JT, Robinson PN. Computational Processing and Quality Control of Hi-C, Capture Hi-C and Capture-C Data. Genes. 2019; 10(7):548. https://doi.org/10.3390/genes10070548
Chicago/Turabian StyleHansen, Peter, Michael Gargano, Jochen Hecht, Jonas Ibn-Salem, Guy Karlebach, Johannes T. Roehr, and Peter N. Robinson. 2019. "Computational Processing and Quality Control of Hi-C, Capture Hi-C and Capture-C Data" Genes 10, no. 7: 548. https://doi.org/10.3390/genes10070548
APA StyleHansen, P., Gargano, M., Hecht, J., Ibn-Salem, J., Karlebach, G., Roehr, J. T., & Robinson, P. N. (2019). Computational Processing and Quality Control of Hi-C, Capture Hi-C and Capture-C Data. Genes, 10(7), 548. https://doi.org/10.3390/genes10070548