Transcriptome Profiling of Primary Skin Fibroblasts Reveal Distinct Molecular Features Between PLOD1- and FKBP14-Kyphoscoliotic Ehlers–Danlos Syndrome

 , , and
Abstract
1. Introduction
2. Materials and Methods
2.1. Subjects and Cell Culture
2.2. Gene Expression Profiling
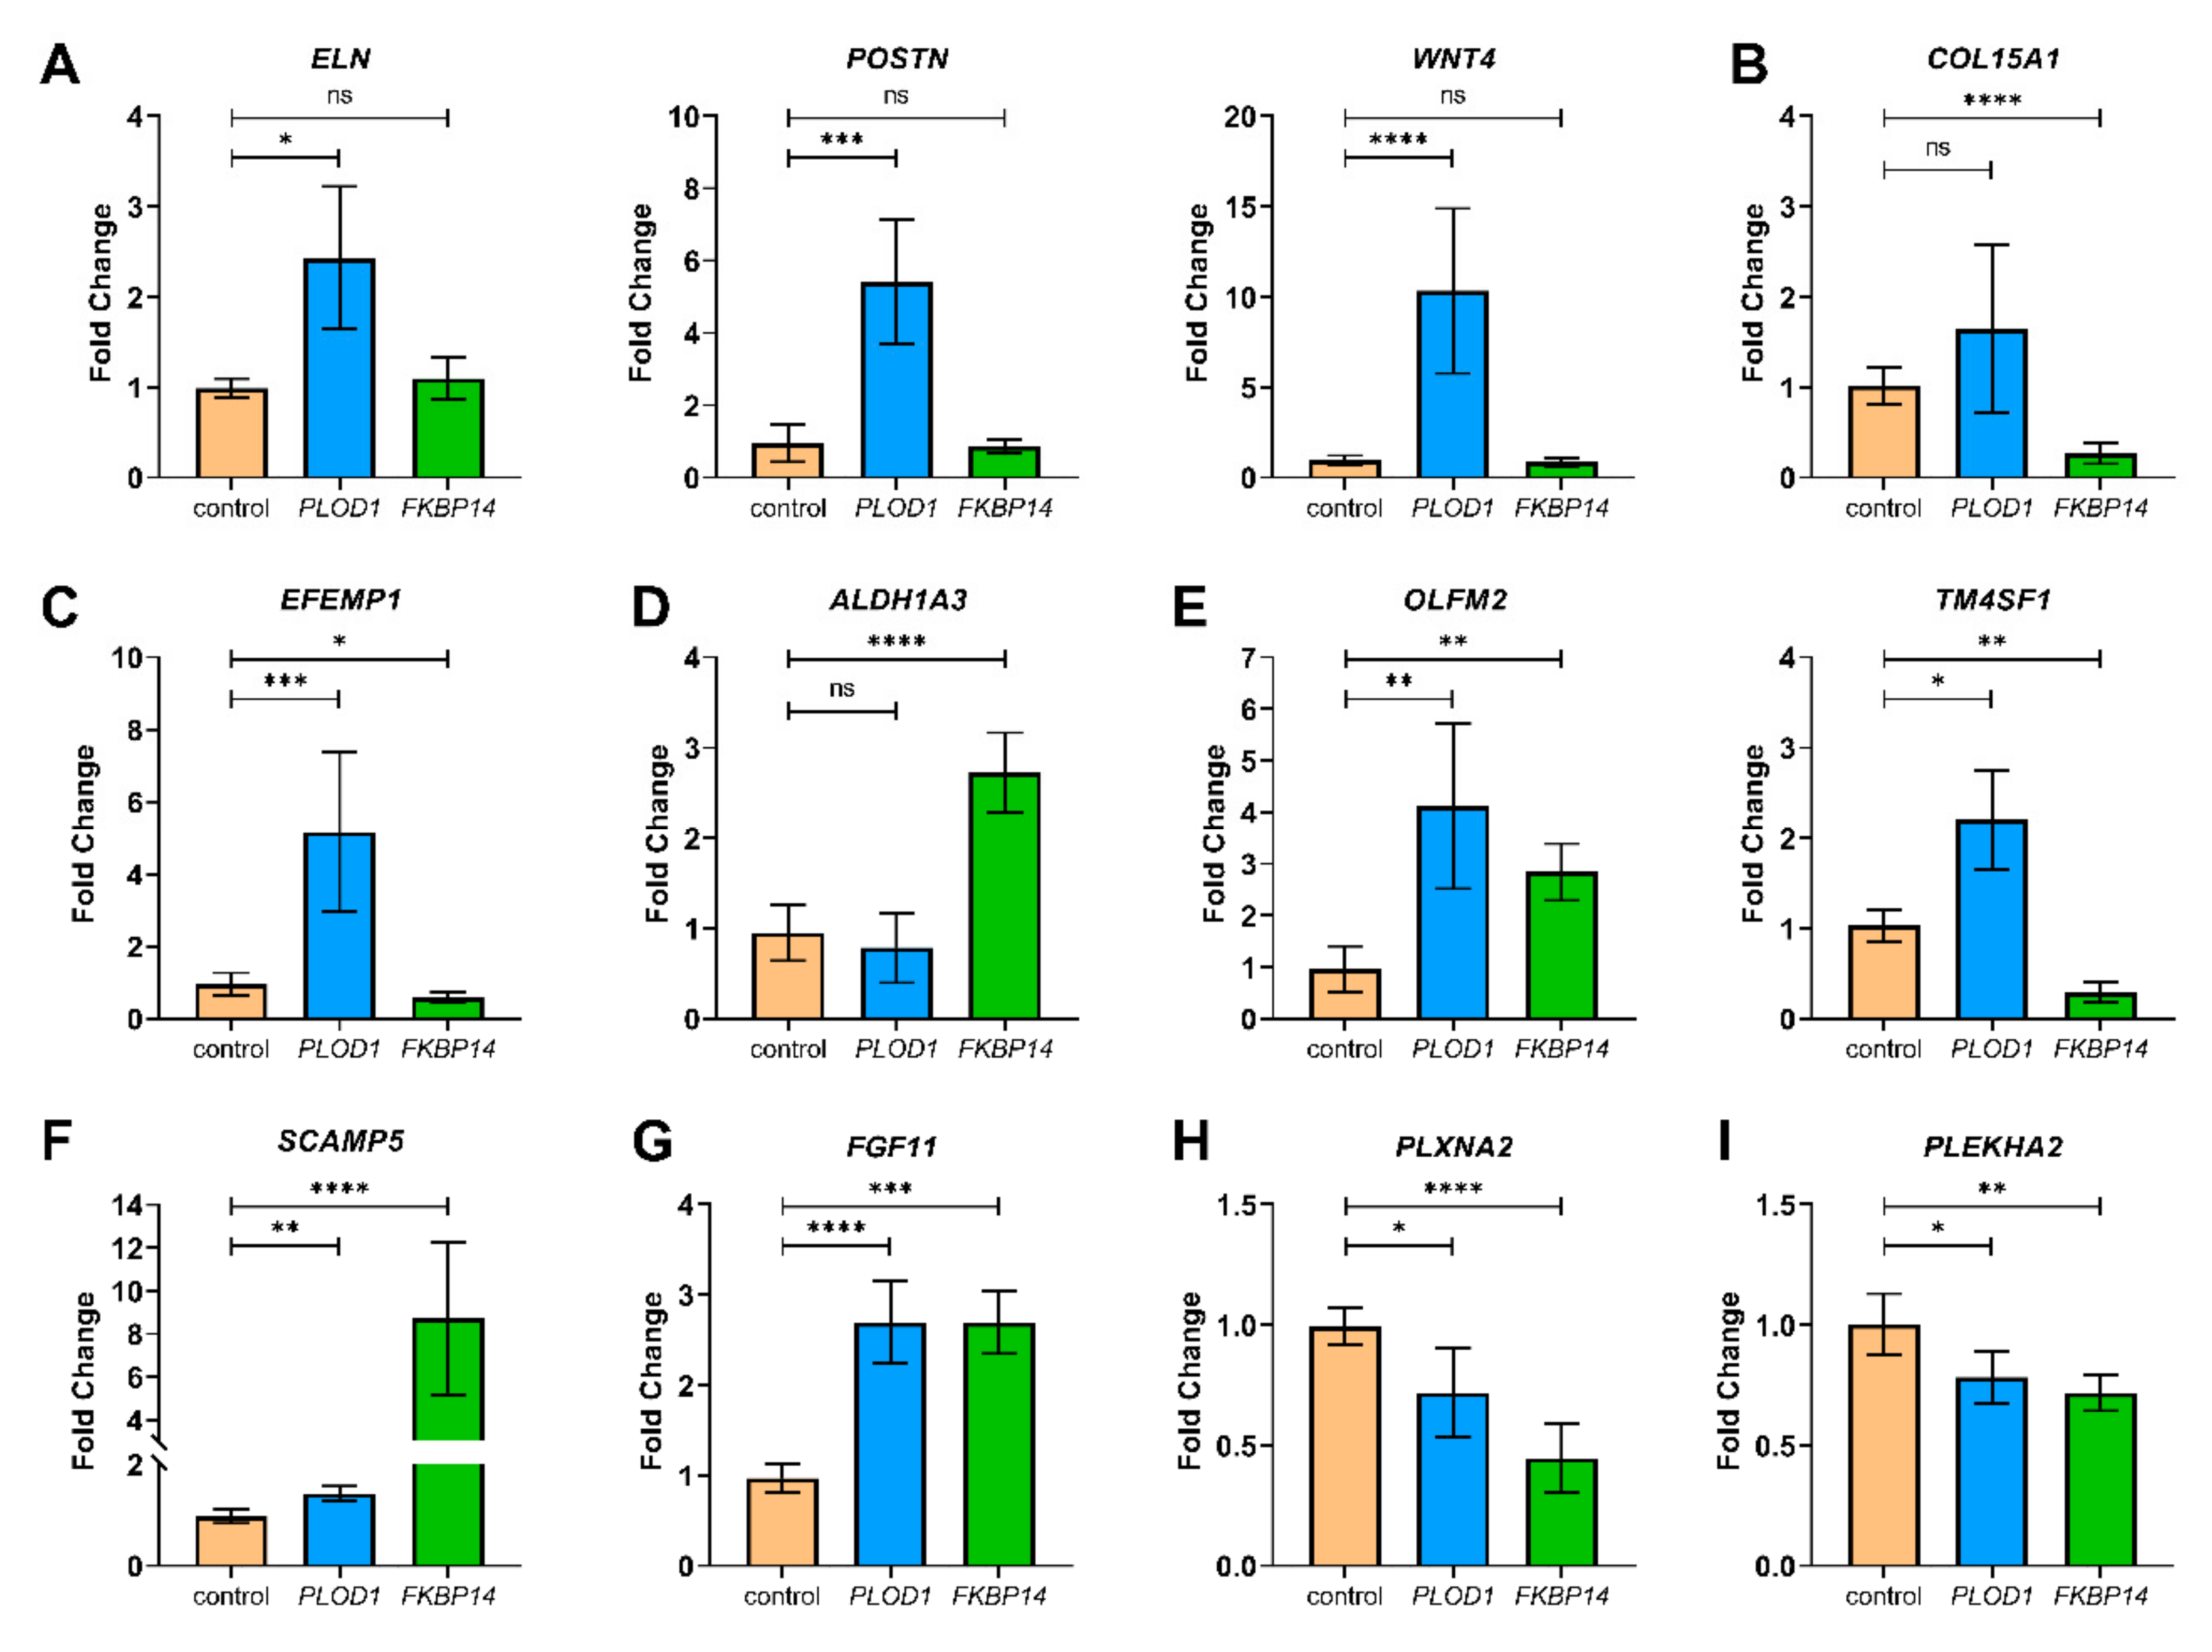
2.3. Quantitative RT-PCR for Validation
3. Results
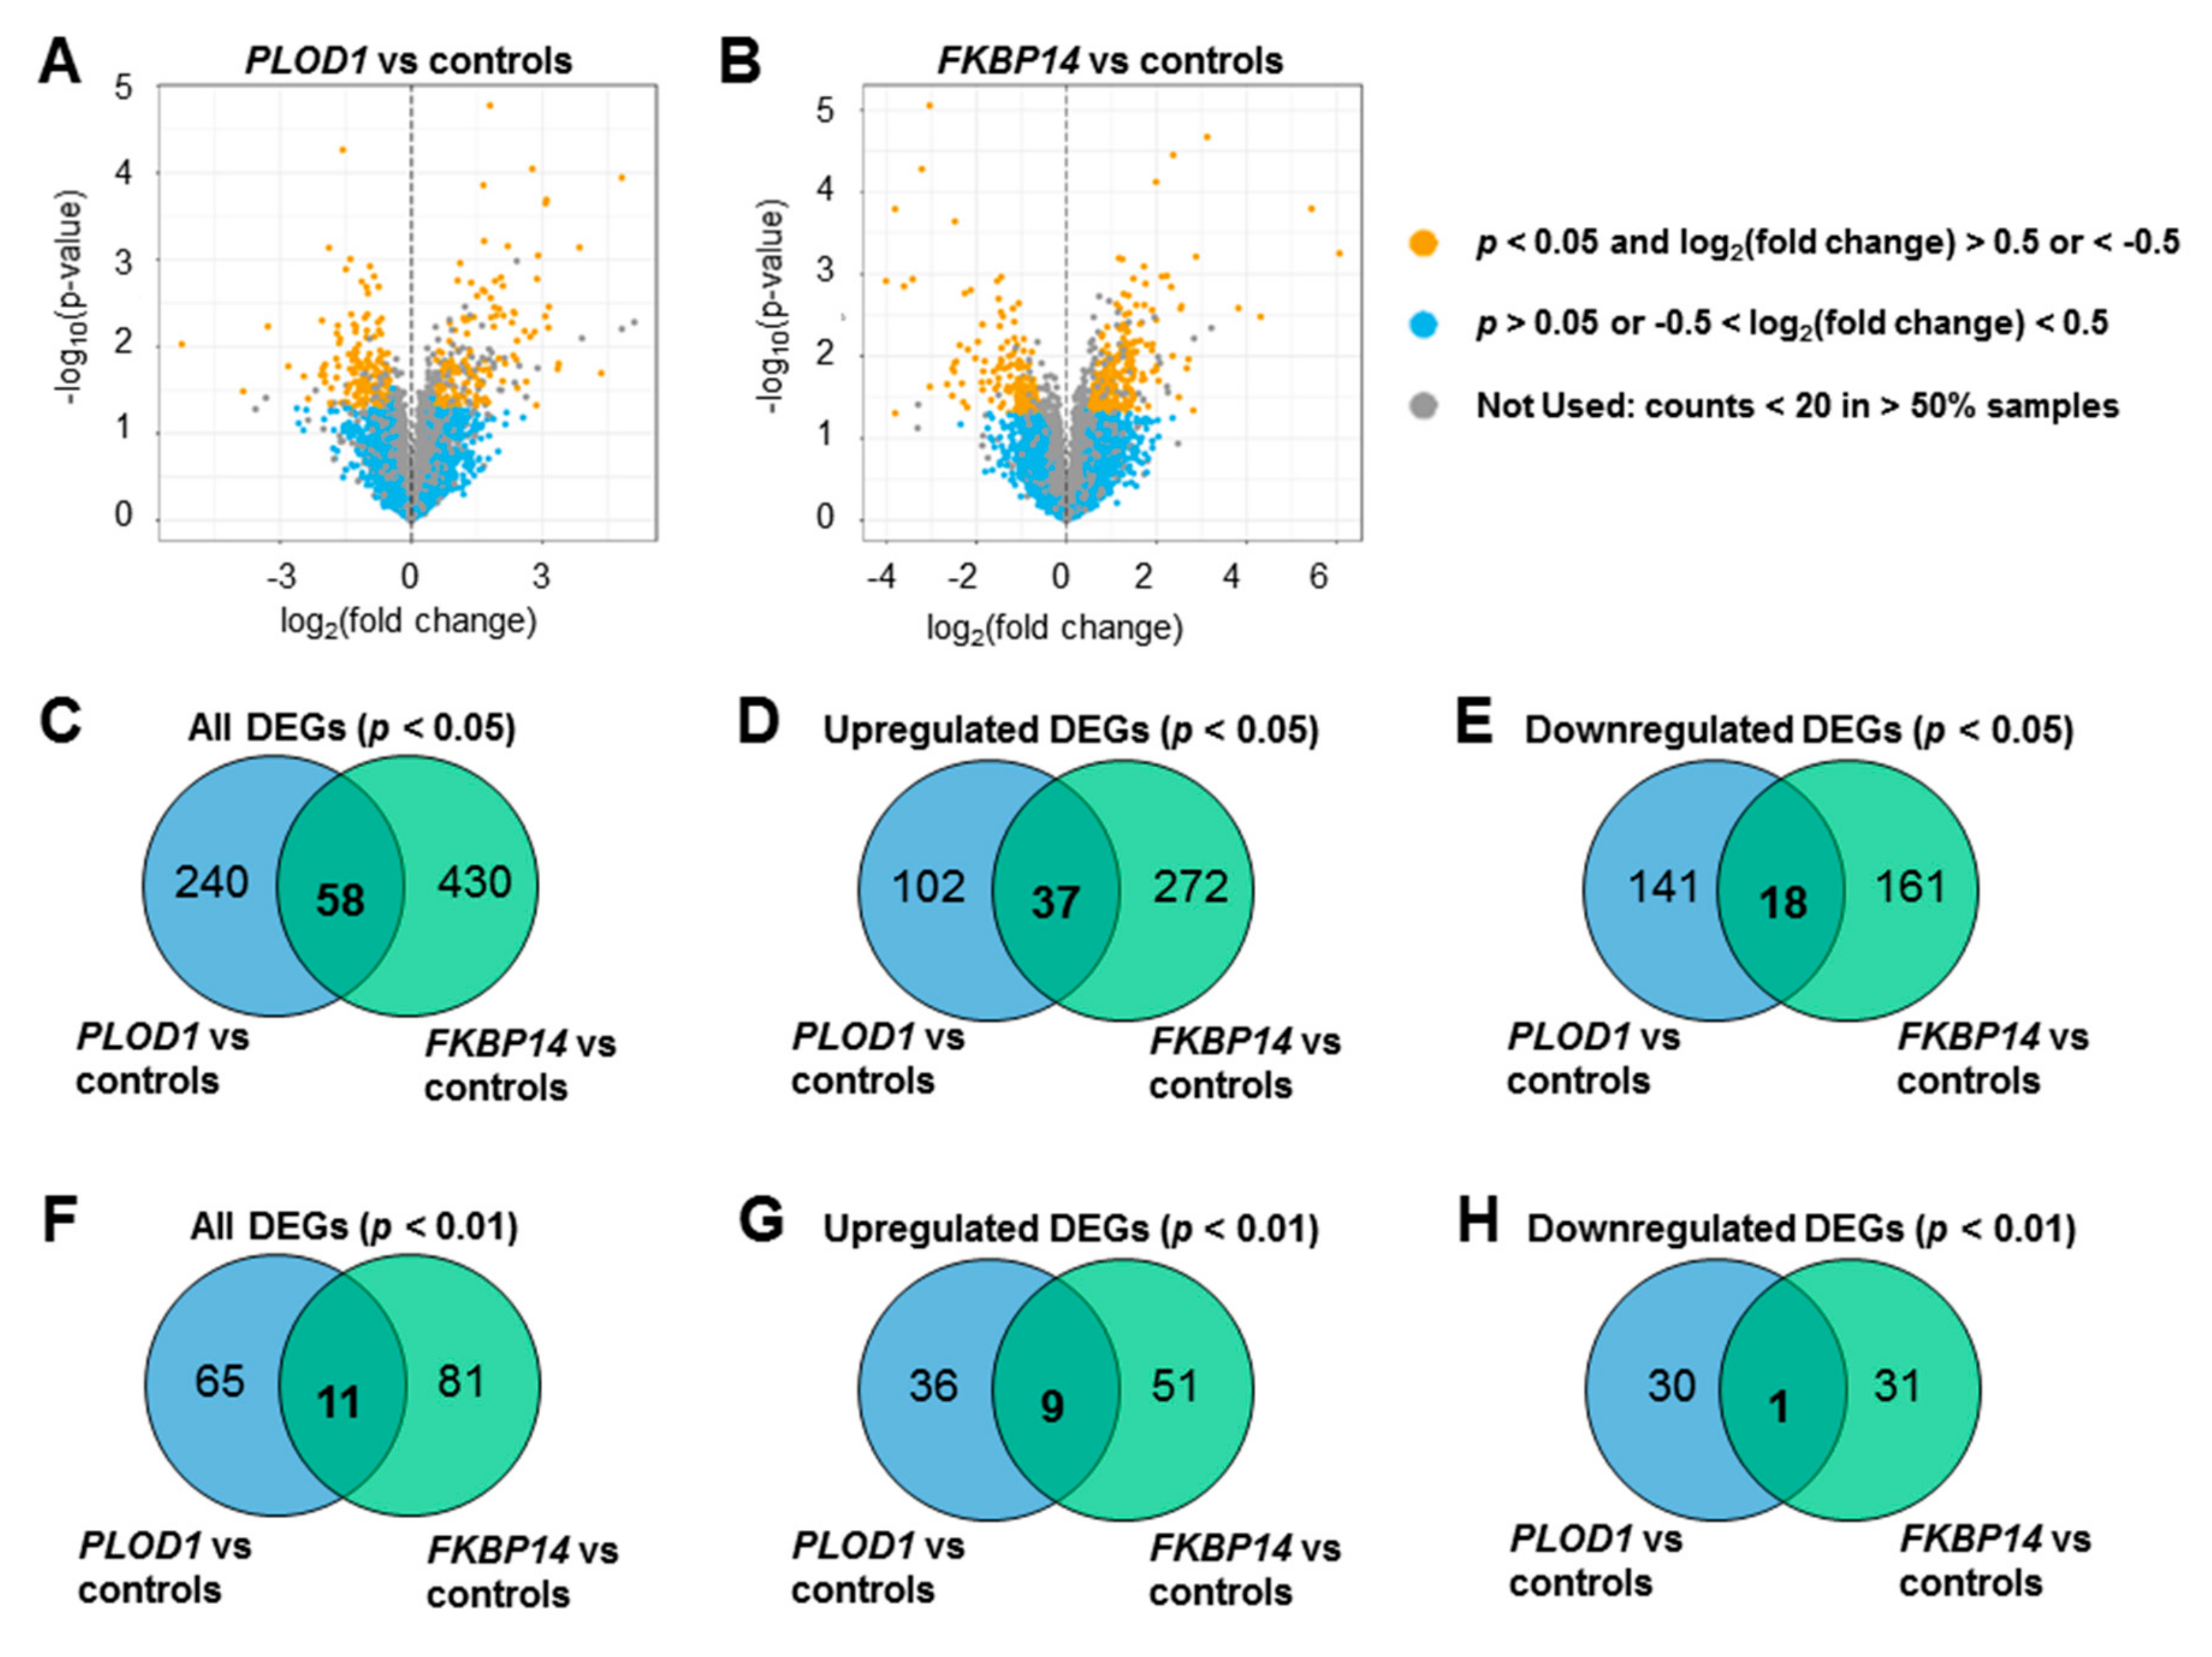
3.1. Transcriptome Profiling and Differential Expression Analysis
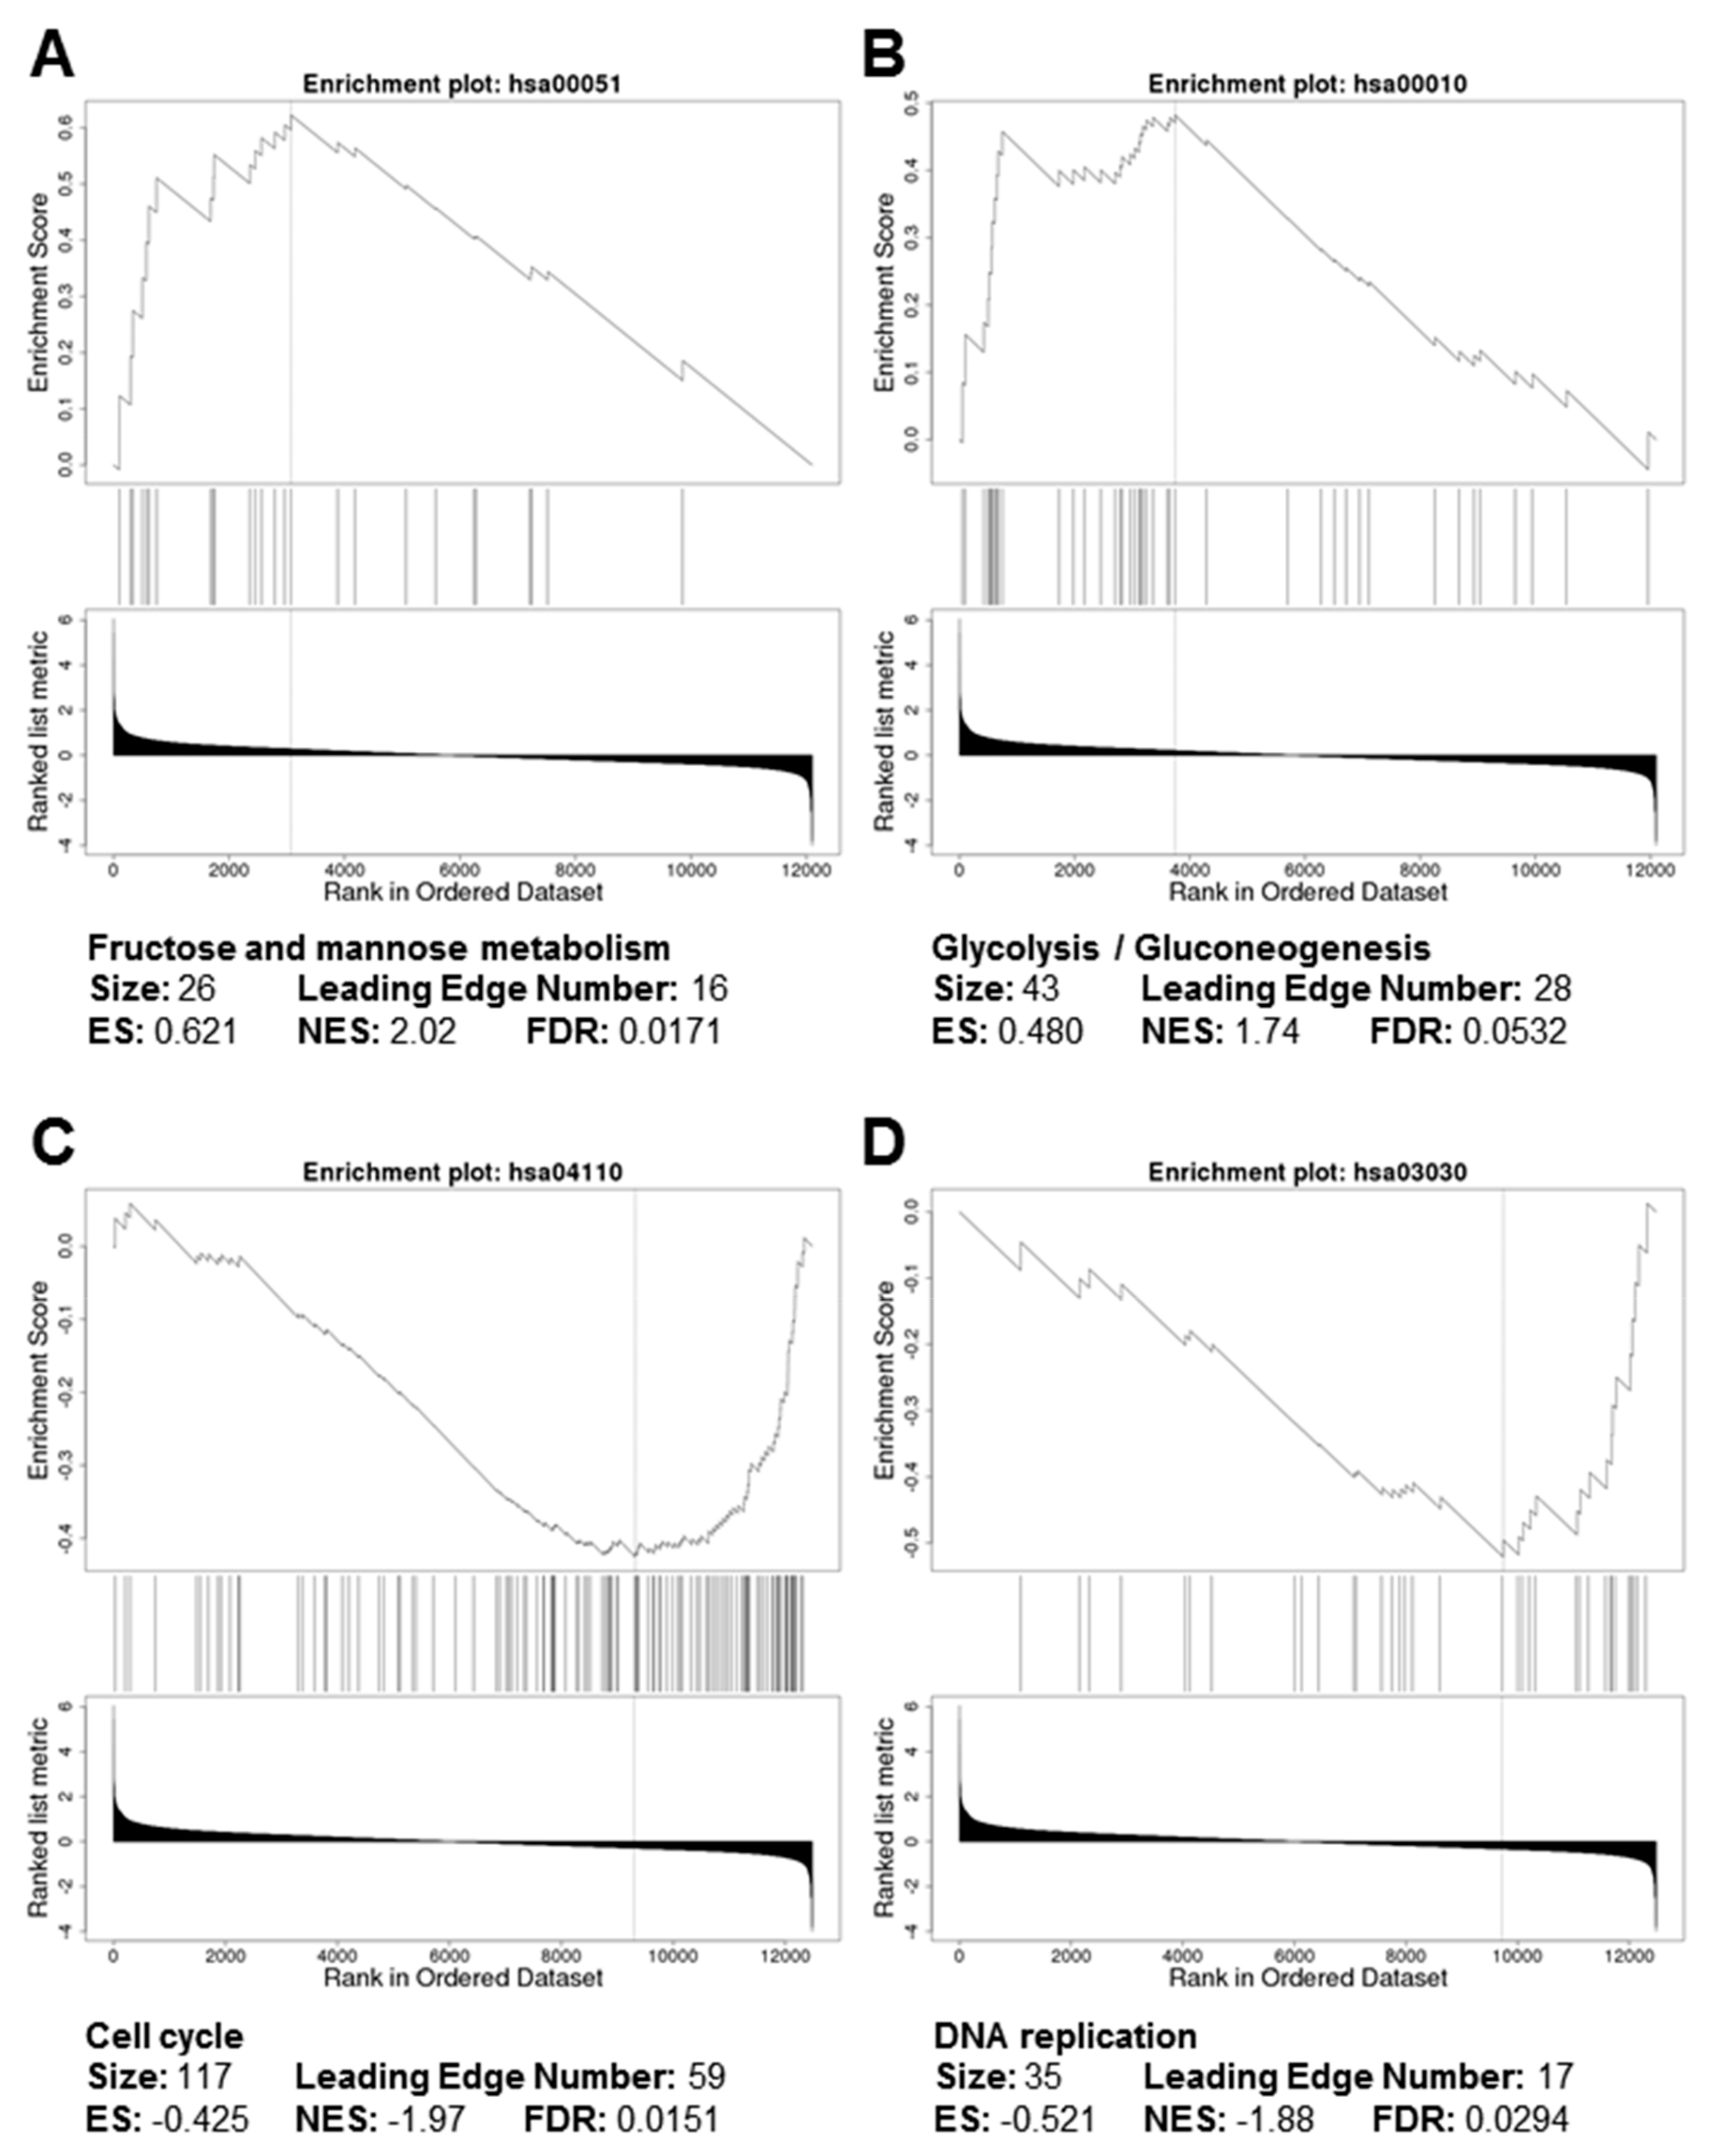
3.2. Gene Ontology and Pathway Analyses
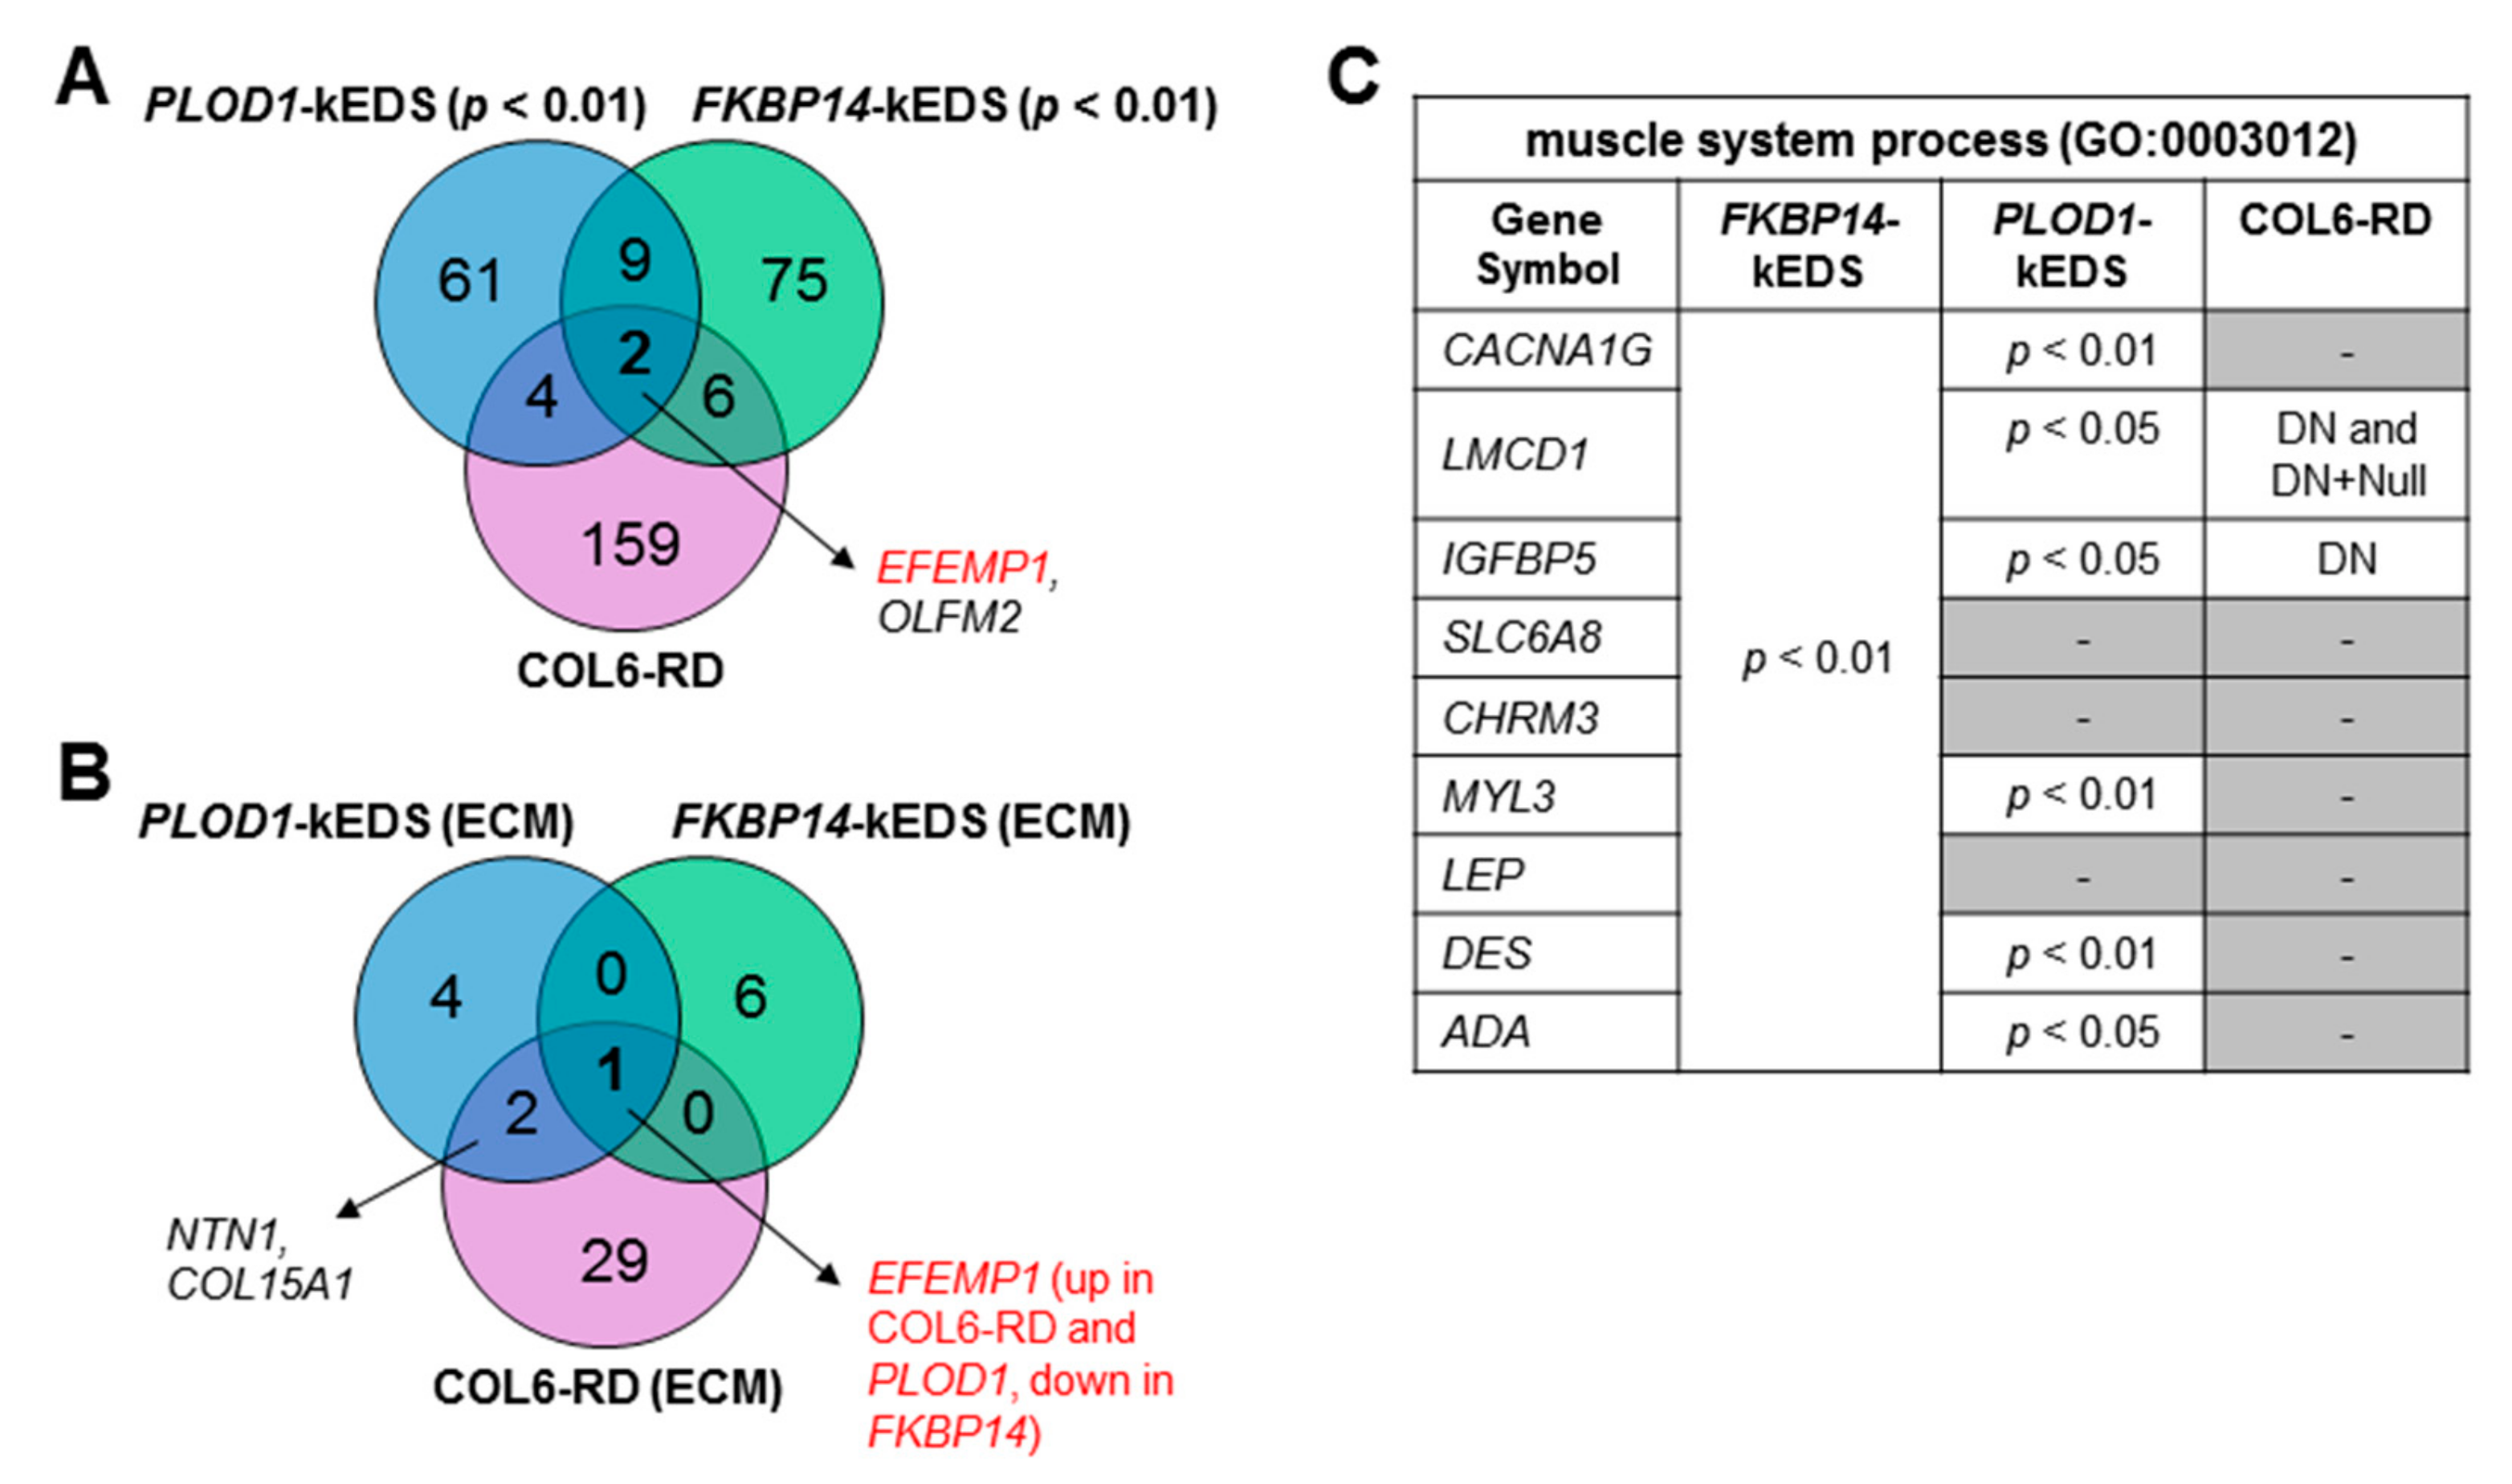
3.3. Comparison of Transcriptome Profiles between kEDS and Collagen VI-Related Muscular Dystrophies
3.4. DEGs with Biological Functions that May Contribute to the Pathogenesis of kEDS
4. Discussion
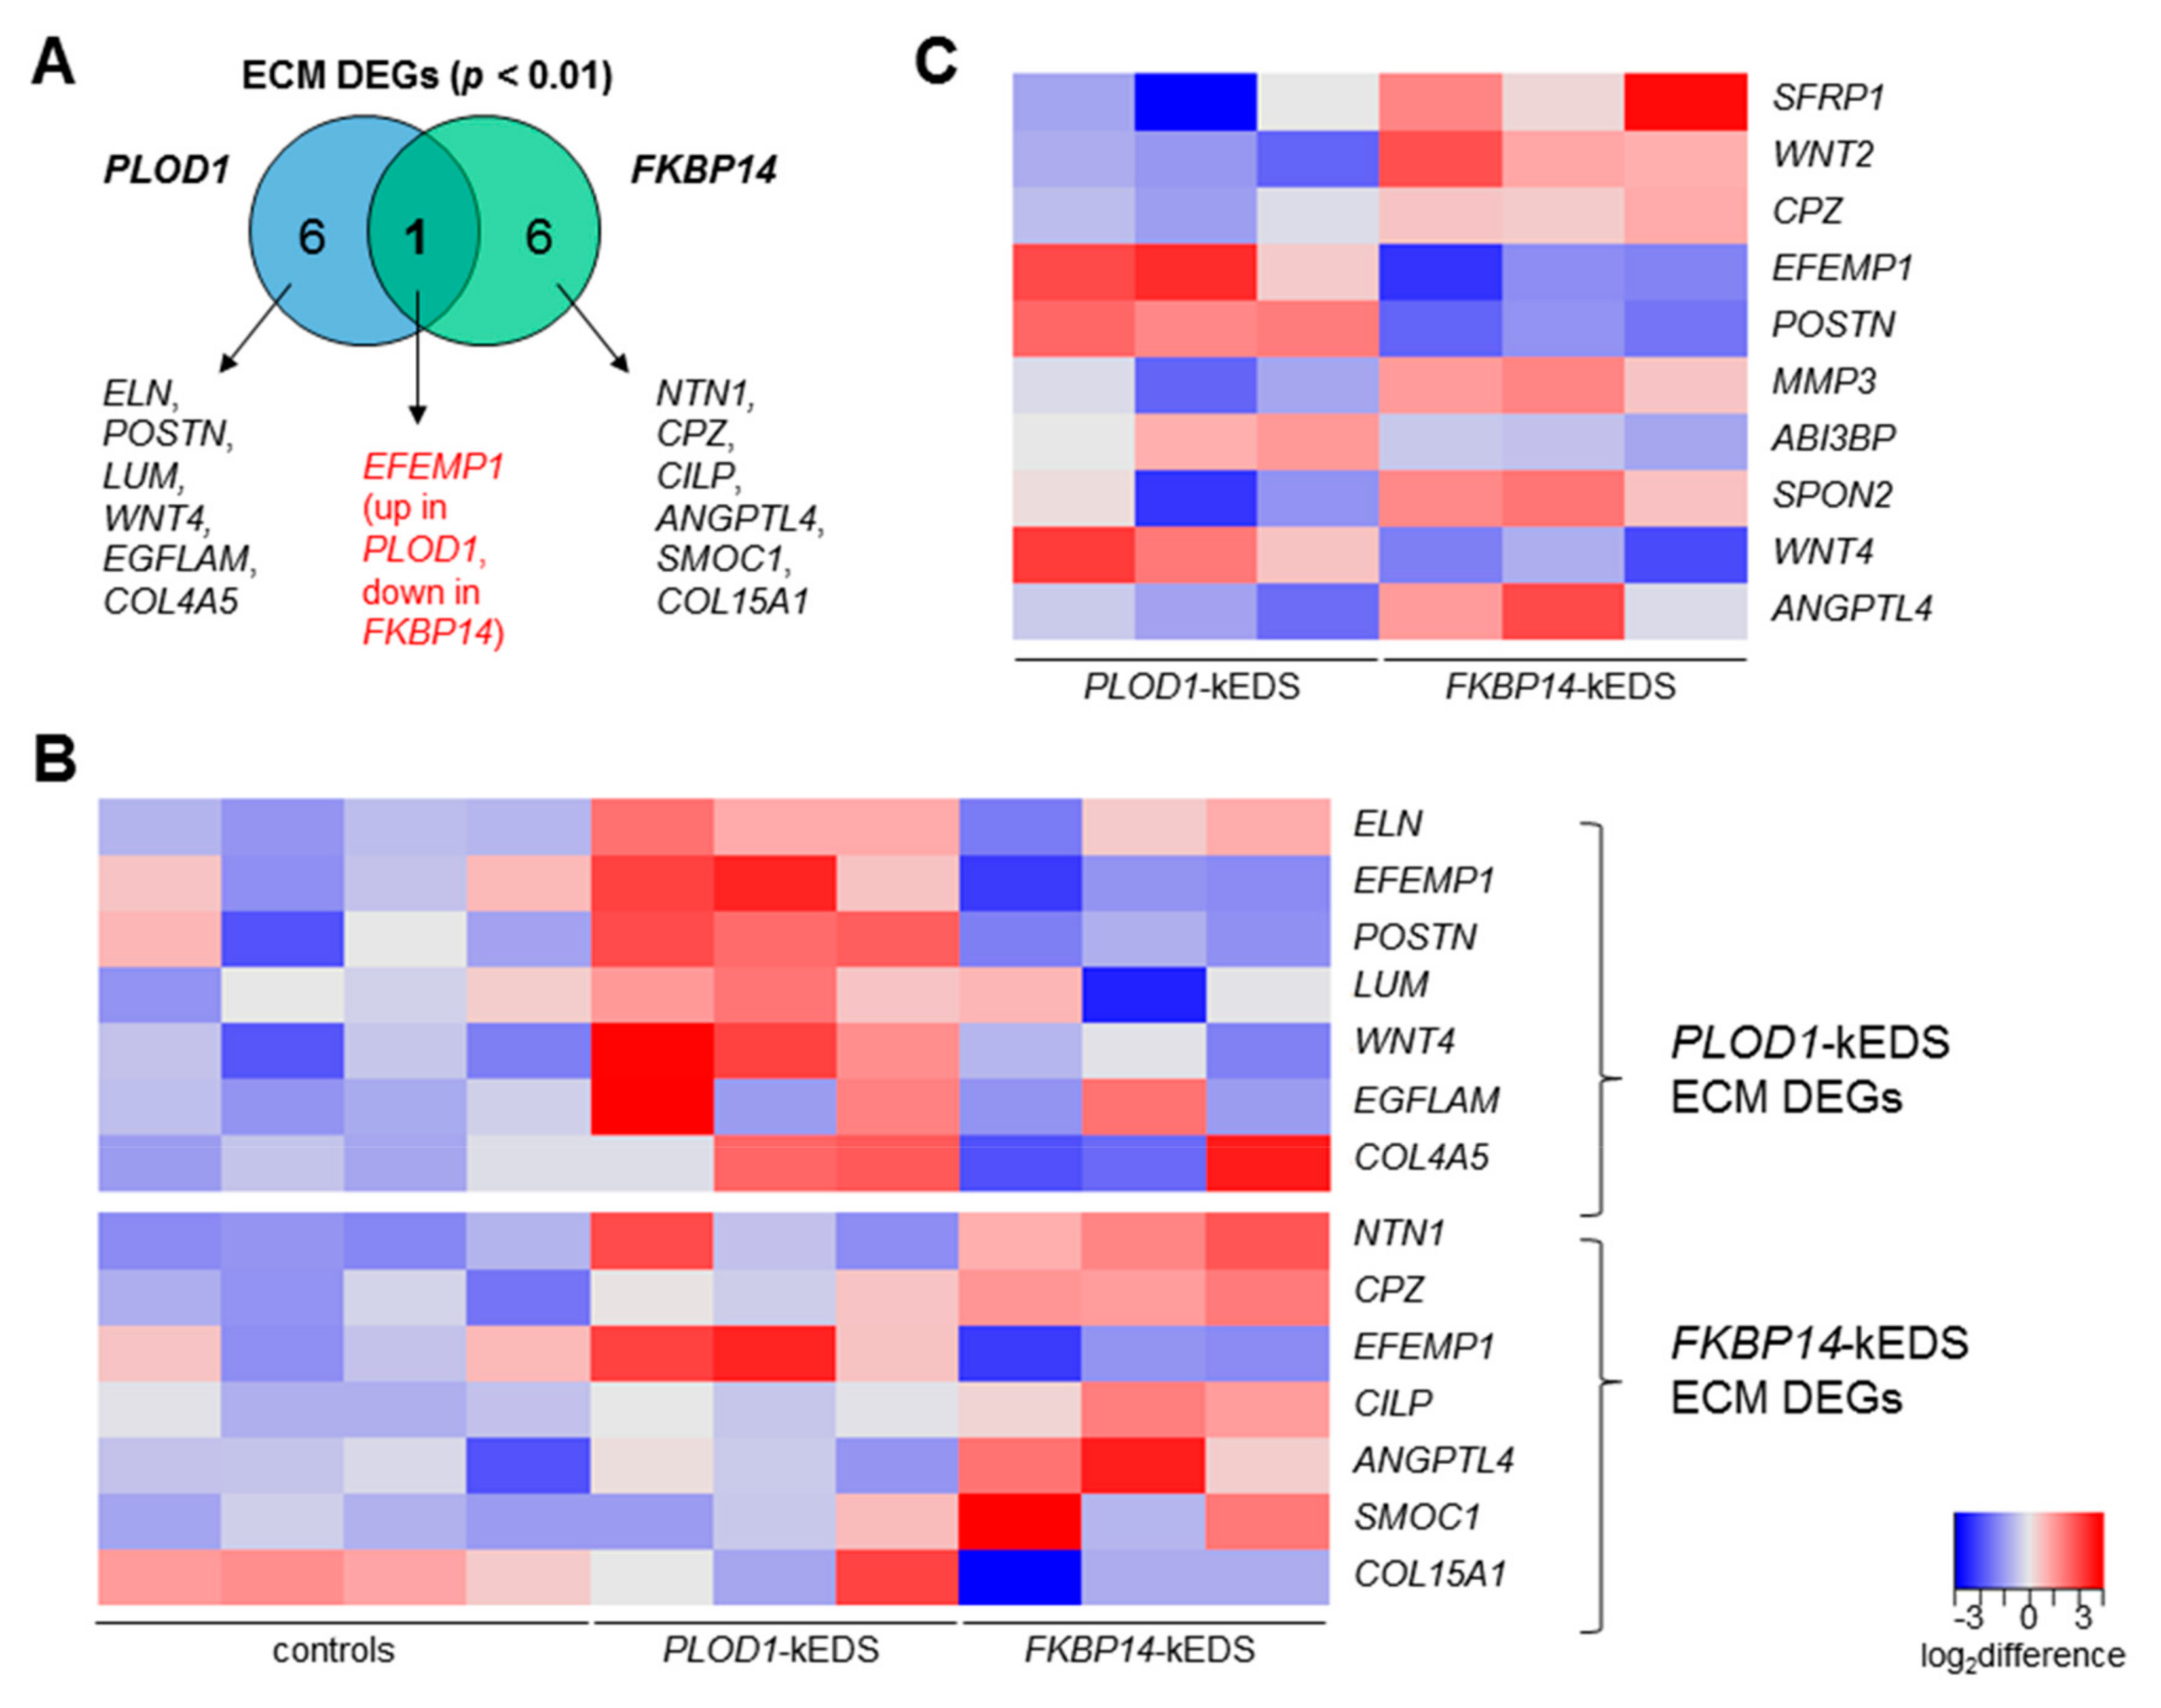
4.1. ECM Components
4.2. Inner Ear Development
4.3. Vasculature Integrity
4.4. Unfolded Protein Response (UPR)
4.5. Bone Remodeling
4.6. Others
5. Conclusions
Supplementary Materials
Author Contributions
Funding
Acknowledgments
Conflicts of Interest
References
- Malfait, F.; Francomano, C.; Byers, P.; Belmont, J.; Berglund, B.; Black, J.; Bloom, L.; Bowen, J.M.; Brady, A.F.; Burrows, N.P.; et al. The 2017 international classification of the Ehlers-Danlos syndromes. Am. J. Med. Genet. Part C Semin. Med. Genet. 2017, 175, 8–26. [Google Scholar] [CrossRef] [PubMed]
- Kivirikko, K.I.; Myllylä, R. Posttranslational Enzymes in the Biosynthesis of Collagen: Intracellular Enzymes. Methods Enzymol. 1982, 82, 245–304. [Google Scholar] [PubMed]
- Giunta, C.; Baumann, M.; Fauth, C.; Lindert, U.; Abdalla, E.M.; Brady, A.F.; Collins, J.; Dastgir, J.; Donkervoort, S.; Ghali, N.; et al. A cohort of 17 patients with kyphoscoliotic Ehlers-Danlos syndrome caused by biallelic mutations in FKBP14: Expansion of the clinical and mutational spectrum and description of the natural history. Genet. Med. 2018, 20, 42–54. [Google Scholar] [CrossRef] [PubMed]
- Baumann, M.; Giunta, C.; Krabichler, B.; Rüschendorf, F.; Zoppi, N.; Colombi, M.; Bittner, R.E.; Quijano-Roy, S.; Muntoni, F.; Cirak, S.; et al. Mutations in FKBP14 cause a variant of Ehlers-Danlos syndrome with progressive kyphoscoliosis, myopathy, and hearing loss. Am. J. Hum. Genet. 2012, 90, 201–216. [Google Scholar] [CrossRef]
- Ishikawa, Y.; Bächinger, H.P. A substrate preference for the rough endoplasmic reticulum resident protein FKBP22 during collagen biosynthesis. J. Biol. Chem. 2014, 289, 18189–18201. [Google Scholar] [CrossRef]
- Bönnemann, C.G. The collagen VI-related myopathies: Muscle meets its matrix. Nat. Rev. Neurol. 2011, 7, 379–390. [Google Scholar] [CrossRef]
- Kirschner, J.; Hausser, I.; Zou, Y.; Schreiber, G.; Christen, H.J.; Brown, S.C.; Anton-Lamprecht, I.; Muntoni, F.; Hanefeld, F.; Bönnemann, C.G. Ullrich congenital muscular dystrophy: Connective tissue abnormalities in the skin support overlap with Ehlers-Danlos syndromes. Am. J. Med. Genet. 2005, 132, 296–301. [Google Scholar] [CrossRef]
- Yiş, U.; Dirik, E.; Chambaz, C.; Steinmann, B.; Giunta, C. Differential diagnosis of muscular hypotonia in infants: The kyphoscoliotic type of Ehlers-Danlos syndrome (EDS VI). Neuromuscul. Disord. 2008, 18, 210–214. [Google Scholar] [CrossRef]
- Giunta, C.; Rohrbach, M.; Fauth, C.; Baumann, M. FKBP14-Kyphoscoliotic Ehlers-Danlos Syndrome; GeneReviews; Adam, M., Ardinger, H., Pagon, R., Eds.; University of Washington: Seattle, WA, USA, 2019. [Google Scholar]
- Butterfield, R.J.; Dunn, D.M.; Hu, Y.; Johnson, K.; Bönnemann, C.G.; Weiss, R.B. Transcriptome profiling identifies regulators of pathogenesis in collagen VI related muscular dystrophy. PLoS ONE 2017, 12, e0189664. [Google Scholar] [CrossRef]
- Giunta, C.; Randolph, A.; Steinmann, B. Mutation analysis of the PLOD1 gene: An efficient multistep approach to the molecular diagnosis of the kyphoscoliotic type of Ehlers-Danlos syndrome (EDS VIA). Mol. Genet. Metab. 2005, 86, 269–276. [Google Scholar] [CrossRef]
- Rohrbach, M.; Vandersteen, A.; Yi, U.; Serdaroglu, G.; Ataman, E.; Chopra, M.; Garcia, S.; Jones, K.; Kariminejad, A.; Kraenzlin, M.; et al. Phenotypic variability of the kyphoscoliotic type of Ehlers-Danlos syndrome (EDS VIA): Clinical, molecular and biochemical delineation. Orphanet J. Rare Dis. 2011, 6, 46. [Google Scholar] [CrossRef] [PubMed]
- Wang, J.; Vasaikar, S.; Shi, Z.; Greer, M.; Zhang, B. WebGestalt 2017: A more comprehensive, powerful, flexible and interactive gene set enrichment analysis toolkit. Nucleic Acids Res. 2017, 45, W130–W137. [Google Scholar] [CrossRef] [PubMed]
- Zhang, B.; Kirov, S.; Snoddy, J. WebGestalt: An integrated system for exploring gene sets in various biological contexts. Nucleic Acids Res. 2005, 33, W741–W748. [Google Scholar] [CrossRef] [PubMed]
- Morris, B.A.; Burkel, B.; Ponik, S.M.; Fan, J.; Condeelis, J.S.; Aguire-Ghiso, J.A.; Castracane, J.; Denu, J.M.; Keely, P.J. Collagen Matrix Density Drives the Metabolic Shift in Breast Cancer Cells. EBioMedicine 2016, 13, 146–156. [Google Scholar] [CrossRef] [PubMed]
- Zhao, X.; Psarianos, P.; Ghoraie, L.S.; Yip, K.; Goldstein, D.; Gilbert, R.; Witterick, I.; Pang, H.; Hussain, A.; Lee, J.H.; et al. Metabolic regulation of dermal fibroblasts contributes to skin extracellular matrix homeostasis and fibrosis. Nat. Metab. 2019, 1, 147–157. [Google Scholar] [CrossRef]
- Maruhashi, T.; Kii, I.; Saito, M.; Kudo, A. Interaction between periostin and BMP-1 promotes proteolytic activation of lysyl oxidase. J. Biol. Chem. 2010, 285, 13294–13303. [Google Scholar] [CrossRef]
- Kii, I.; Nishiyama, T.; Li, M.; Matsumoto, K.I.; Saito, M.; Amizuka, N.; Kudo, A. Incorporation of tenascin-C into the extracellular matrix by periostin underlies an extracellular meshwork architecture. J. Biol. Chem. 2010, 285, 2028–2039. [Google Scholar] [CrossRef]
- Nishiyama, T.; Kii, I.; Kashima, T.G.; Kikuchi, Y.; Ohazama, A.; Shimazaki, M.; Fukayama, M.; Kudo, A. Delayed re-epithelialization in periostin-deficient mice during cutaneous wound healing. PLoS ONE 2011, 6, e18410. [Google Scholar] [CrossRef]
- Elliott, C.G.; Wang, J.; Guo, X.; Xu, S.-W.; Eastwood, M.; Guan, J.; Leask, A.; Conway, S.J.; Hamilton, D.W. Periostin modulates myofibroblast differentiation during full-thickness cutaneous wound repair. J. Cell Sci. 2012, 125, 121–132. [Google Scholar] [CrossRef]
- Ontsuka, K.; Kotobuki, Y.; Shiraishi, H.; Serada, S.; Ohta, S.; Tanemura, A.; Yang, L.; Fujimoto, M.; Arima, K.; Suzuki, S.; et al. Periostin, a matricellular protein, accelerates cutaneous wound repair by activating dermal fibroblasts. Exp. Dermatol. 2012, 21, 331–336. [Google Scholar] [CrossRef]
- Zhou, H.M.; Wang, J.; Elliott, C.; Wen, W.; Hamilton, D.W.; Conway, S.J. Spatiotemporal expression of periostin during skin development and incisional wound healing: Lessons for human fibrotic scar formation. J. Cell Commun. Signal. 2010, 4, 99–107. [Google Scholar] [CrossRef] [PubMed]
- Yang, L.; Serada, S.; Fujimoto, M.; Terao, M.; Kotobuki, Y.; Kitaba, S.; Matsui, S.; Kudo, A.; Naka, T.; Murota, H.; et al. Periostin facilitates skin sclerosis via PI3K/Akt dependent mechanism in a mouse model of scleroderma. PLoS ONE 2012, 7, e41994. [Google Scholar] [CrossRef] [PubMed]
- Yamaguchi, Y.; Ono, J.; Masuoka, M.; Ohta, S.; Izuhara, K.; Ikezawa, Z.; Aihara, M.; Takahashi, K. Serum periostin levels are correlated with progressive skin sclerosis in patients with systemic sclerosis. Br. J. Dermatol. 2013, 168, 717–725. [Google Scholar] [CrossRef] [PubMed]
- Guo, X.; Day, T.F.; Jiang, X.; Garrett-Beal, L.; Topol, L.; Yang, Y. Wnt/β-catenin signaling is sufficient and necessary for synovial joint formation. Genes Dev. 2004, 18, 2404–2417. [Google Scholar] [CrossRef] [PubMed]
- Strochlic, L.; Falk, J.; Goillot, E.; Sigoillot, S.; Bourgeois, F.; Delers, P.; Rouvière, J.; Swain, A.; Castellani, V.; Schaeffer, L.; et al. Wnt4 participates in the formation of vertebrate neuromuscular junction. PLoS ONE 2012, 7, e29976. [Google Scholar] [CrossRef] [PubMed]
- Okuse, T.; Chiba, T.; Katsuumi, I.; Imai, K. Differential expression and localization of WNTs in an animal model of skin wound healing. Wound Repair Regen. 2005, 13, 491–497. [Google Scholar] [CrossRef] [PubMed]
- Prunskaite-Hyyryläinen, R.; Skovorodkin, I.; Xu, Q.; Miinalainen, I.; Shan, J.; Vainio, S.J. Wnt4 coordinates directional cell migration and extension of the müllerian duct essential for ontogenesis of the female reproductive tract. Hum. Mol. Genet. 2015, 25, 1059–1073. [Google Scholar] [CrossRef] [PubMed]
- Kucich, U.; Rosenbloom, J.C.; Abrams, W.R.; Rosenbloom, J. Transforming growth factor-β stabilizes elastin mRNA by a pathway requiring active smads, protein kinase c-δ, and p38. Am. J. Respir. Cell Mol. Biol. 2002, 26, 183–188. [Google Scholar] [CrossRef]
- Colwell, A.S.; Krummel, T.M.; Longaker, M.T.; Lorenz, H.P. Wnt-4 expression is increased in fibroblasts after TGF-beta1 stimulation and during fetal and postnatal wound repair. Plast. Reconstr. Surg. 2006, 117, 2297–2301. [Google Scholar] [CrossRef]
- Chen, G.; Nakamura, I.; Dhanasekaran, R.; Iguchi, E.; Tolosa, E.J.; Romecin, P.A.; Vera, R.E.; Almada, L.L.; Miamen, A.G.; Chaiteerakij, R.; et al. Transcriptional Induction of Periostin by a Sulfatase 2-TGFb1-SMAD Signaling Axis Mediates Tumor Angiogenesis in Hepatocellular Carcinoma. Cancer Res. 2017, 77, 632–645. [Google Scholar] [CrossRef]
- Muona, A.; Eklund, L.; Väisänen, T.; Pihlajaniemi, T. Developmentally regulated expression of type XV collagen correlates with abnormalities in Col15a1-/-mice. Matrix Biol. 2002, 21, 89–102. [Google Scholar] [CrossRef]
- Eklund, L. Lack of type XV collagen causes a skeletal myopathy and cardiovascular defects in mice. Proc. Natl. Acad. Sci. USA 2001, 98, 1194–1199. [Google Scholar] [CrossRef]
- McLaughlin, P.J.; Bakall, B.; Choi, J.; Liu, Z.; Sasaki, T.; Davis, E.C.; Marmorstein, A.D.; Marmorstein, L.Y. Lack of fibulin-3 causes early aging and herniation, but not macular degeneration in mice. Hum. Mol. Genet. 2007, 16, 3059–3070. [Google Scholar] [CrossRef] [PubMed]
- Wakabayashi, T.; Matsumine, A.; Nakazora, S.; Hasegawa, M.; Iino, T.; Ota, H.; Sonoda, H.; Sudo, A.; Uchida, A. Fibulin-3 negatively regulates chondrocyte differentiation. Biochem. Biophys. Res. Commun. 2010, 391, 1116–1121. [Google Scholar] [CrossRef] [PubMed]
- Yao, H.; Hill, S.F.; Skidmore, J.M.; Sperry, E.D.; Swiderski, D.L.; Sanchez, G.J.; Bartels, C.F.; Raphael, Y.; Scacheri, P.C.; Iwase, S.; et al. CHD7 represses the retinoic acid synthesis enzyme ALDH1A3 during inner ear development. JCI Insight 2018, 3, 97440. [Google Scholar] [CrossRef] [PubMed]
- Gok, E.; Goksel, O.S.; Alpagut, U.; Dayioglu, E. Spontaneous brachial pseudo-aneurysm in a 12-year-old with kyphoscoliosis-type ehlers-danlos syndrome. Eur. J. Vasc. Endovasc. Surg. 2012, 44, 482–484. [Google Scholar] [CrossRef]
- Murray, M.L.; Yang, M.; Fauth, C.; Byers, P.H. FKBP14-related Ehlers-Danlos syndrome: Expansion of the phenotype to include vascular complications. Am. J. Med. Genet. Part A 2014, 164, 1750–1755. [Google Scholar] [CrossRef]
- Dordoni, C.; Ciaccio, C.; Venturini, M.; Calzavara-Pinton, P.; Ritelli, M.; Colombi, M. Further delineation of FKBP14-related Ehlers-Danlos syndrome: A patient with early vascular complications and non-progressive kyphoscoliosis, and literature review. Am. J. Med. Genet. Part A 2016, 170, 2031–2038. [Google Scholar] [CrossRef]
- Niiyama, T.; Higuchi, I.; Hashiguchi, T.; Suehara, M.; Uchida, Y.; Horikiri, T.; Shiraishi, T.; Saitou, A.; Hu, J.; Nakagawa, M.; et al. Capillary changes in skeletal muscle of patients with Ullrich’s disease with collagen VI deficiency. Acta Neuropathol. 2003, 106, 137–142. [Google Scholar] [CrossRef]
- Shi, N.; Li, C.X.; Cui, X.B.; Tomarev, S.I.; Chen, S.Y. Olfactomedin 2 Regulates Smooth Muscle Phenotypic Modulation and Vascular Remodeling Through Mediating Runt-Related Transcription Factor 2 Binding to Serum Response Factor. Arterioscler. Thromb. Vasc. Biol. 2017, 37, 446–454. [Google Scholar] [CrossRef]
- Chiarelli, N.; Carini, G.; Zoppi, N.; Ritelli, M.; Colombi, M. Transcriptome analysis of skin fibroblasts with dominant negative COL3A1 mutations provides molecular insights into the etiopathology of vascular Ehlers-Danlos syndrome. PLoS ONE 2018, 13, 1–24. [Google Scholar] [CrossRef] [PubMed]
- Shih, S.C.; Zukauskas, A.; Li, D.; Liu, G.; Ang, L.H.; Nagy, J.A.; Brown, L.F.; Dvorak, H.F. The l6 protein TM4SF1 is critical for endothelial cell function and tumor angiogenesis. Cancer Res. 2009, 69, 3272–3277. [Google Scholar] [CrossRef]
- Lisse, T.S.; Thiele, F.; Fuchs, H.; Hans, W.; Przemeck, G.K.H.; Abe, K.; Rathkolb, B.; Quintanilla-Martinez, L.; Hoelzlwimmer, G.; Helfrich, M.; et al. ER stress-mediated apoptosis in a new mouse model of Osteogenesis imperfecta. PLoS Genet. 2008, 4, e7. [Google Scholar] [CrossRef] [PubMed]
- Chessler, S.D.; Byers, P.H. BiP binds type I procollagen pro?? chains with mutations in the carboxyl-terminal propeptide synthesized by cells from patients with osteogenesis imperfecta. J. Biol. Chem. 1993, 268, 18226–18233. [Google Scholar] [PubMed]
- Wilsoni, R.; Freddi, S.; Chan, D.; Cheah, K.S.E.; Bateman, J.F. Misfolding of collagen X chains harboring schmid metaphyseal chondrodysplasia mutations results in aberrant disulfide bond formation, intracellular retention, and activation of the unfolded protein response. J. Biol. Chem. 2005, 280, 15544–15552. [Google Scholar] [CrossRef] [PubMed]
- Noh, J.Y.; Lee, H.; Song, S.; Kim, N.S.; Im, W.; Kim, M.; Seo, H.; Chung, C.W.; Chang, J.W.; Ferrante, R.J.; et al. SCAMP5 links endoplasmic reticulum stress to the accumulation of expanded polyglutamine protein aggregates via endocytosis inhibition. J. Biol. Chem. 2009, 284, 11318–11325. [Google Scholar] [CrossRef] [PubMed]
- Yang, Y.; Qin, M.; Bao, P.; Xu, W.; Xu, J. Secretory carrier membrane protein 5 is an autophagy inhibitor that promotes the secretion of α-synuclein via exosome. PLoS ONE 2017, 12, e0180892. [Google Scholar] [CrossRef]
- Knowles, H.J. Hypoxia-Induced Fibroblast Growth Factor 11 Stimulates Osteoclast-Mediated Resorption of Bone. Calcif. Tissue Int. 2017, 100, 382–391. [Google Scholar] [CrossRef]
- Mitsogiannis, M.D.; Little, G.E.; Mitchell, K.J. Semaphorin-Plexin signaling influences early ventral telencephalic development and thalamocortical axon guidance. Neural Dev. 2017, 12, 6. [Google Scholar] [CrossRef]
- Kariminejad, A.; Bozorgmehr, B.; Khatami, A.; Kariminejad, M.H.; Giunta, C.; Steinmann, B. Ehlers-Danlos Syndrome Type VI in a 17-Year-Old Iranian Boy with Severe Muscular Weakness—A Diagnostic Challenge? Iran. J. Pediatr. 2010, 20, 358–362. [Google Scholar]
- Marshall, A.J.; Krahn, A.K.; Ma, K.; Duronio, V.; Hou, S. TAPP1 and TAPP2 are targets of phosphatidylinositol 3-kinase signaling in B-cells: Sustained plasma membrane recruitment triggered by the B-cell antigen receptor. Mol. Cell. Biol. 2002, 22, 5479–5491. [Google Scholar] [CrossRef] [PubMed]
- Kimber, W.A.; Trinkle-Mulcahy, L.; Cheung, P.C.F.; Deak, M.; Marsden, L.J.; Kieloch, A.; Watt, S.; Javier, R.T.; Gray, A.; Downes, C.P.; et al. Evidence that the tandem-pleckstrin-homology-domain-containing protein TAPP1 interacts with Ptd(3,4)P2 and the multi-PDZ-domain-containing protein MUPP1 in vivo. Biochem. J. 2002, 361, 525–536. [Google Scholar] [CrossRef] [PubMed]
- Jayachandran, N.; Landego, I.; Hou, S.; Alessi, D.R.; Marshall, A.J. B-cell-intrinsic function of TAPP adaptors in controlling germinal center responses and autoantibody production in mice. Eur. J. Immunol. 2017, 47, 280–290. [Google Scholar] [CrossRef] [PubMed][Green Version]
- Liu, F.; Ye, F.; Guan, Z.; Zhou, Y.; Ji, F.; Zhang, Q.; Zhang, J.; Zhang, T.; Lu, S. The down-regulation of TAPP2 inhibits the migration of esophageal squamous cell carcinoma and predicts favorable outcome. Pathol. Res. Pract. 2017, 213, 1556–1562. [Google Scholar] [CrossRef] [PubMed]
- Li, H.; Hou, S.; Wu, X.; Nandagopal, S.; Lin, F.; Kung, S.; Marshall, A.J. The Tandem PH Domain-Containing Protein 2 (TAPP2) Regulates Chemokine-Induced Cytoskeletal Reorganization and Malignant B Cell Migration. PLoS ONE 2013, 8, e57809. [Google Scholar] [CrossRef] [PubMed]


| Gene Mutations | Clinical Findings | ||||
|---|---|---|---|---|---|
| Hyperextensible Skin | Kyphoscoliosis | Muscle Hypotonia | Joint Hypermobility | Vascular Abnormality | |
| PLOD1 compound heterozygote c.975+975_1755+?dup/c.1362del p.Glu326_Lys585dup/ p.(Tyr455Thrfs*2) (described as P4 in [11]) | + | + (progressive) | + | + | NR |
| PLOD1 p.Glu326_Lys585dup homozygous exon 10-16 duplication (described as P1 in [12]) | – | + | + | + | – |
| PLOD1 Leu85Pro homozygous (described as P2 in [12]) | – | – | – | + | + (rupture of artery) |
| FKBP14 c.362dupC p.(Glu122Argfs*7) homozygous (described as P3 in [4]) | + | + (progressive) | + | + | – (#) |
| FKBP14 c.362dupC p.(Glu122Argfs*7) homozygous (described as P1 in [4]) | + | + (progressive) | + | + | – |
| FKBP14 c.197 + 5_197 + 8del / p.His67* homozygous (described as P4 in [3]) | + | + (progressive) | + | + | NR |
| Gene Symbol | Gene Name | Assay ID |
|---|---|---|
| GAPDH | glyceraldehyde-3-phosphate dehydrogenase | Hs02758991_g1 |
| ELN | elastin | Hs00355783_m1 |
| POSTN | periostin | Hs01566750_m1 |
| WNT4 | Wnt family member 4 | Hs01573505_m1 |
| COL15A1 | collagen type XV alpha 1 | Hs00266332_m1 |
| EFEMP1 | EGF-containing Fibulin-like extracellular matrix protein 1 | Hs00244575_m1 |
| ALDH1A3 | aldehyde dehydrogenase 1 family member A3 | Hs00167476_m1 |
| OLFM2 | olfactomedin 2 | Hs01017934_m1 |
| TM4SF1 | transmembrane 4 L six family member 1 | Hs01547334_m1 |
| SCAMP5 | secretory carrier membrane protein 5 | Hs01547727_m1 |
| FGF11 | fibroblast growth factor 11 | Hs00182803_m1 |
| PLXNA2 | plexin A2 | Hs00300697_m1 |
| PLEKHA2 | Pleckstrin homology domain-containing family A member 2 | Hs00952489_m1 |
| Gene Ontology | Description | Enrichment Ratio | p-value | FDR |
|---|---|---|---|---|
| FKBP14-kEDS: Biological Process | ||||
| GO:0003012 | muscle system process | 5.52 | 3.19 × 10⁻⁵ | 2.42 × 10⁻² |
| GO:0007586 | digestion | 14.1 | 1.74 × 10⁻⁴ | 6.60 × 10⁻² |
| FKBP14-kEDS: Cellular Component | ||||
| GO:0005578 | proteinaceous extracellular matrix | 5.07 | 3.90 × 10⁻⁴ | 5.77 × 10⁻² |
| GO:0043235 | receptor complex | 5.28 | 8.53 × 10⁻⁴ | 6.32 × 10⁻² |
| PLOD1-kEDS: Biological Process | ||||
| GO:0007219 | Notch signaling pathway | 8.86 | 1.26 × 10⁻⁵ | 9.58 × 10⁻³ |
| GO:0007423 | sensory organ development | 4.77 | 3.84 × 10⁻⁵ | 1.46 × 10⁻² |
| GO:0030048 | actin filament-based movement | 10.7 | 9.73 × 10⁻⁵ | 2.02 × 10⁻² |
| GO:0045730 | respiratory burst | 31.2 | 1.07 × 10⁻⁴ | 2.02 × 10⁻⁵ |
| GO:0060326 | cell chemotaxis | 7.34 | 1.56 × 10⁻⁴ | 2.38 × 10⁻² |
| GO:0070098 | chemokine-mediated signaling pathway | 23.0 | 2.77 × 10⁻⁴ | 3.50 × 10⁻² |
| GO:0050920 | regulation of chemotaxis | 6.74 | 8.43 × 10⁻⁴ | 9.16 × 10⁻² |
| GO:0042490 | mechanoreceptor differentiation | 14.6 | 1.10 × 10⁻³ | 9.61 × 10⁻² |
| GO:0001655 | urogenital system development | 4.30 | 1.14 × 10⁻³ | 9.61 × 10⁻² |
| PLOD1-kEDS: Cellular Component | ||||
| GO:0005578 | proteinaceous extracellular matrix | 5.73 | 1.77 × 10⁻⁴ | 2.61 × 10⁻² |
| GO:1990351 | transporter complex | 6.36 | 1.03 × 10⁻³ | 5.96 × 10⁻² |
| GO:0044420 | extracellular matrix component | 7.88 | 1.56 × 10⁻³ | 5.96 × 10⁻² |
| GO:0031594 | neuromuscular junction | 12.7 | 1.61 × 10⁻³ | 5.96 × 10⁻² |
| GO:0043235 | receptor complex | 4.98 | 3.03 × 10⁻³ | 8.97 × 10⁻² |
© 2019 by the authors. Licensee MDPI, Basel, Switzerland. This article is an open access article distributed under the terms and conditions of the Creative Commons Attribution (CC BY) license (http://creativecommons.org/licenses/by/4.0/).
Share and Cite
Lim, P.J.; Lindert, U.; Opitz, L.; Hausser, I.; Rohrbach, M.; Giunta, C. Transcriptome Profiling of Primary Skin Fibroblasts Reveal Distinct Molecular Features Between PLOD1- and FKBP14-Kyphoscoliotic Ehlers–Danlos Syndrome. Genes 2019, 10, 517. https://doi.org/10.3390/genes10070517
Lim PJ, Lindert U, Opitz L, Hausser I, Rohrbach M, Giunta C. Transcriptome Profiling of Primary Skin Fibroblasts Reveal Distinct Molecular Features Between PLOD1- and FKBP14-Kyphoscoliotic Ehlers–Danlos Syndrome. Genes. 2019; 10(7):517. https://doi.org/10.3390/genes10070517
Chicago/Turabian StyleLim, Pei Jin, Uschi Lindert, Lennart Opitz, Ingrid Hausser, Marianne Rohrbach, and Cecilia Giunta. 2019. "Transcriptome Profiling of Primary Skin Fibroblasts Reveal Distinct Molecular Features Between PLOD1- and FKBP14-Kyphoscoliotic Ehlers–Danlos Syndrome" Genes 10, no. 7: 517. https://doi.org/10.3390/genes10070517
APA StyleLim, P. J., Lindert, U., Opitz, L., Hausser, I., Rohrbach, M., & Giunta, C. (2019). Transcriptome Profiling of Primary Skin Fibroblasts Reveal Distinct Molecular Features Between PLOD1- and FKBP14-Kyphoscoliotic Ehlers–Danlos Syndrome. Genes, 10(7), 517. https://doi.org/10.3390/genes10070517