A Humanized Yeast Phenomic Model of Deoxycytidine Kinase to Predict Genetic Buffering of Nucleoside Analog Cytotoxicity

 , ,
, ,
Abstract
:1. Introduction
2. Materials and Methods
2.1. Strains, Media, and Drugs
2.2. Quantitative High Throughput Cell Array Phenotyping (Q-HTCP)
2.3. Quantification of Drug–Gene Interaction
- Di = concentration (dose) of gemcitabine or cytarabine;
- Ri = observed mean growth parameter for parental reference strain at Di;
- Yi = observed growth parameter for the YKO/KD mutant strain at Di;
- Ki = Yi − Ri, the difference in growth parameter between the YKO/KD mutant (Yi) and reference (Ri) at Di;
- K0 = Y0 − R0, the effect of gene KO/KD on the observed phenotype in the absence of gemcitabine or cytarabine—this value is annotated as ‘shift’ and is subtracted from all Ki to obtain Li;
- Li = Ki − K0, the interaction between (specific influence of) the KO/KD mutation on gemcitabine or cytarabine response, at Di;
- (1)
- Compute the average value of the 768 reference cultures (Ri) at each dose (Di):
- (2)
- Assign Yi max (defined above) if growth curve is observed at D0, but not at Di, or if observed Yi is greater than Yi max.
- (3)
- Calculate Ki = Yi − Ri.
- (4)
- Calculate Li = Ki − K0
- (5)
- Fit data by linear regression (least squares): Li = A + B*Di
- (6)
- Compute the interaction value ‘INT’ at the max dose: INT = Li-max = A + B*Dmax
- (7)
- Calculate the mean and standard deviation of interaction scores for reference strains, mean(REFINT) and SD(REFINT); mean(REFINT) is expected to be approximately zero, with SD(REFINT) primarily useful for standardizing against variance (Additional File 1, Tables S2–S5; Additional Files 3–4).
- (8)
- Calculate interaction z-scores:z-score(YKOINT) = (YKOINT − mean(REFINT))/SD(REFINT)z-score(YKOINT) > 2 for L or < −2 for K are referred to as gene deletion enhancers of gemcitabine or cytarabine cytotoxicity, and conversely, L interaction score < −2 or K interaction scores >2 are considered gene deletion suppressors. Due to the fact that the CPP distributions for KD strains were different from the reference strain, we used the mean and standard deviation from the KD plates only as a conservative measure of variance where z-score(KDINT) = (KDINT – mean(KDINT))/SD(KDINT).
2.4. Recursive Expectation-Maximization Clustering (REMc) and Heatmap Generation
2.5. Gene Ontology Term Finder (GTF)
2.6. Gene Ontology Term Averaging (GTA) Analysis
- Calculate the average and SD for interaction values of all genes in a GO term.
- Filter results to obtain terms having GTA value greater than 2 or less than −2.
- Obtain GTA scores defined as |GTA value| - gtaSD; filter for GTA score > 2.
2.7. Prediction of Human Homologs that Influence Tumor Response to Gemcitabine or Cytarabine
3. Results
3.1. Quantitative Phenomic Characterization of Differential Gene–Drug Interaction
3.2. Functional Analysis of Gene Interaction Modules
4. Functions that Respond to Gemcitabine and Cytarabine Similarly
4.1. Genetic Modules that Buffer Cytotoxicity of Both Gemcitabine and Cytarabine
4.2. DNA Integrity Checkpoint and Repair-Related Complexes

| yGene | hGene | H | Drug | Cluster | Tissue | Gem K | Cyt K | Gem L | Cyt L | Ref | Description (Human) |
|---|---|---|---|---|---|---|---|---|---|---|---|
| NAM7 | HELZ | 2 | Cyt | 1-0-14 | L | −6.5 | −16.7 | 1.1 | 13.6 | [66,67,68,69] | helicase with zinc finger |
| NAM7 | HELZ2 | 2 | Cyt | 1-0-14 | A, H | −6.5 | −16.7 | 1.1 | 13.6 | helicase with zinc finger 2 | |
| NAM7 | UPF1 | 2 | Cyt | 1-0-14 | L | −6.5 | −16.7 | 1.1 | 13.6 | [70,71,72] | UPF1, RNA helicase and ATPase |
| PTC1 | PPM1E | 2 | Both | 1-0-14 | L | −8.8 | −12.7 | 7.9 | 15.7 | [73] | protein phosphatase, Mg2+/Mn2+ dependent 1E |
| PTC1 | PPM1L | 2 | Both | 1-0-14 | A, H | −8.8 | −12.7 | 7.9 | 15.7 | [74] | protein phosphatase, Mg2+/Mn2+ dependent 1L |
| RAD24 | RAD17 | 1 | Gem | 1-0-14 | H, L | −7.4 | −27.6 | 14.2 | 8.3 | [75,76,77,78,79] | RAD17 checkpoint clamp loader component |
| SGS1 | RECQL5 | 2 | Cyt | 1-0-14 | L | −8.4 | −33.4 | 3.4 | 19.3 | [61,62] | RecQ like helicase 5 |
| KTI11_2 | DPH3 | 1 | Cyt | 1-0-14 | H | −7.7 | −10.3 | 6.5 | 9.1 | [80,81,82] | diphthamide biosynthesis 3 |
| BIM1_2 | MAPRE2 | 2 | Gem | 1-0-14 | A | −7.7 | −15.4 | 16.0 | 20.0 | [83] | microtubule associated protein RP/EB family member 2 |
| BIM1_2 | MAPRE2 | 2 | Both | 1-0-14 | L | −7.7 | −15.4 | 16.0 | 20.0 | [83] | microtubule associated protein RP/EB family member 2 |
| BIM1_2 | MAPRE3 | 2 | Gem | 1-0-14 | A | −7.7 | −15.4 | 16.0 | 20.0 | [84] | microtubule associated protein RP/EB family member 3 |
| ASF1 | ASF1B | 2 | Cyt | 2-0.16-1 | L | −6.1 | −9.5 | 4.1 | 8.3 | [85] | anti-silencing function 1B histone chaperone |
| AVL9 | AVL9 | 1 | Cyt | 2-0.16-1 | H | −4.3 | −2.5 | 0.2 | 2.9 | [86,87,88] | AVL9 cell migration associated |
| PMR1 | ATP1A1 | 2 | Cyt | 2-0.16-1 | A, H | −3.8 | −9.8 | 3.6 | 10.1 | [89] | ATPase Na+/K+ transporting subunit α 1 |
| PMR1 | ATP1A2 | 2 | Gem | 2-0.16-1 | A | −3.8 | −9.8 | 3.6 | 10.1 | [90] | ATPase Na+/K+ transporting subunit α 2 |
| PMR1 | ATP1A3 | 2 | Cyt | 2-0.16-1 | L | −3.8 | −9.8 | 3.6 | 10.1 | ATPase Na+/K+ transporting subunit α 3 | |
| PMR1 | ATP1A4 | 2 | Gem | 2-0.16-1 | A | −3.8 | −9.8 | 3.6 | 10.1 | ATPase Na+/K+ transporting subunit α 4 | |
| PMR1 | ATP1A4 | 2 | Both | 2-0.16-1 | H | −3.8 | −9.8 | 3.6 | 10.1 | ATPase Na+/K+ transporting subunit α 4 | |
| PMR1 | ATP2C1 | 2 | Cyt | 2-0.16-1 | A | −3.8 | −9.8 | 3.6 | 10.1 | [91,92] | ATPase secretory pathway Ca2+ transporting 1 |
| PMR1 | ATP2C1 | 2 | Both | 2-0.16-1 | H | −3.8 | −9.8 | 3.6 | 10.1 | [91,92] | ATPase secretory pathway Ca2+ transporting 1 |
| TOP3 | TOP3A | 2 | Cyt | 2-0.16-1 | L | −5.2 | −4.0 | 3.3 | 3.4 | [63,64,65] | DNA topoisomerase III α |
| VPS21 | RAB21 | 3 | Cyt | 2-0.16-1 | A, H | −7.2 | −4.1 | −0.4 | 2.4 | [93,94] | RAB21, member RAS oncogene family |
| VPS21 | RAB22A | 3 | Gem | 2-0.16-1 | A | −7.2 | −4.1 | −0.4 | 2.4 | [95,96,97] | RAB22A, member RAS oncogene family |
| ACB1_2 | ACBD4 | 2 | Gem | 2-0.16-1 | H | −5.4 | −4.8 | 4.5 | 0.6 | [98,99] | acyl-CoA binding domain containing 4 |
| ACB1_2 | ACBD5 | 2 | Cyt | 2-0.16-1 | H | −5.4 | −4.8 | 4.5 | 0.6 | [100] | acyl-CoA binding domain containing 5 |
| ACB1_2 | DBI | 2 | Cyt | 2-0.16-1 | A, H | −5.4 | −4.8 | 4.5 | 0.6 | [101,102,103] | diazepam binding inhibitor, acyl-CoA binding protein |
| CPR3 | PPIA | 3 | Cyt | 2-0.8-1 | A, H | 2.1 | 1.6 | −4.1 | −2.8 | [104,105,106] | peptidylprolyl isomerase A |
| CPR3 | RGPD4 | 3 | Gem | 2-0.8-1 | A | 2.1 | 1.6 | −4.1 | −2.8 | RANBP2-like and GRIP domain containing 4 | |
| ELO3 | ELOVL1 | 3 | Both | 2-0.8-1 | L | 2.2 | 1.3 | −3.4 | −4.0 | [107,108] | ELOVL fatty acid elongase 1 |
| ELO3 | ELOVL2 | 3 | Cyt | 2-0.8-1 | H | 2.2 | 1.3 | −3.4 | −4.0 | [109] | ELOVL fatty acid elongase 2 |
| ELO3 | ELOVL4 | 3 | Cyt | 2-0.8-1 | H | 2.2 | 1.3 | −3.4 | −4.0 | ELOVL fatty acid elongase 4 | |
| ELO3 | ELOVL5 | 3 | Cyt | 2-0.8-1 | H | 2.2 | 1.3 | −3.4 | −4.0 | ELOVL fatty acid elongase 5 | |
| ELO3 | ELOVL6 | 3 | Both | 2-0.8-1 | A, L | 2.2 | 1.3 | −3.4 | −4.0 | [110,111] | ELOVL fatty acid elongase 6 |
| MDL2 | ABCB10 | 3 | Gem | 2-0.8-1 | H | 2.5 | 1.5 | −3.0 | −3.0 | [112] | ATP binding cassette subfamily B member 10 |
| MDL2 | TAP1 | 3 | Cyt | 2-0.8-1 | L | 2.5 | 1.5 | −3.0 | −3.0 | transporter 1, ATP binding cassette subfamily B member | |
| PIF1 | PIF1 | 2 | Gem | 2-0.8-1 | A | 2.2 | 1.5 | −4.5 | −3.4 | [113] | PIF1 5’-to-3’ DNA helicase |
| RPS1B | RPS3A | 1 | Both | 2-0.8-1 | A | 2.3 | 0.9 | −3.9 | −2.3 | [114,115] | ribosomal protein S3A |
| SAC3 | MCM3AP | 2 | Gem | 2-0.8-1 | H | 2.2 | 1.5 | −5.2 | −3.8 | [116] | minichromosome maintenance complex component 3 associated protein |
| SAC3 | SAC3D1 | 2 | Cyt | 2-0.8-1 | H | 2.2 | 1.5 | −5.2 | −3.8 | [117,118] | SAC3 domain containing 1 |
| YTA7 | ATAD2 | 2 | Both | 2-0.8-1 | A, H | 1.8 | 1.0 | −6.0 | −3.6 | [119,120,121,122,123,124,125] | ATPase family, AAA domain containing 2 |
| YTA7 | ATAD2B | 2 | Both | 2-0.8-1 | H | 1.8 | 1.0 | −6.0 | −3.6 | ATPase family, AAA domain containing 2B |
4.3. Positive Regulation of DNA-Dependent DNA Replication Initiation
4.4. Endosomal Transport and Related Processes
4.5. ‘Non-GO-enriched’ Homolog Pairs with Corresponding UES and Deletion Enhancement
4.6. Deletion Suppression of Toxicity for Both Nucleosides
5. Gemcitabine-Specific Gene Interaction Modules
5.1. Gemcitabine-Specific Gene Deletion Enhancement
| yGene | hGene | H | Drug | Cluster | Tissue | Gem_K | Cyt_K | Gem_L | Cyt_L | Ref | Description_Human |
|---|---|---|---|---|---|---|---|---|---|---|---|
| CLB5 | CCNA1 | 3 | Gem | 1-0-0 | L | −3.5 | 1.4 | 5.4 | −0.1 | [157] | cyclin A1 |
| HDA1 | HDAC5 | 2 | Cyt | 1-0-0 | L | −6.4 | −2.6 | 5.0 | 2.2 | [158] | histone deacetylase 5 |
| HDA1 | HDAC6 | 2 | Cyt | 1-0-0 | L | −6.4 | −2.6 | 5.0 | 2.2 | [99,159,160,161,162,163,164,165] | histone deacetylase 6 |
| HSE1 | TOM1 | 2 | Gem | 1-0-0 | A | −3.3 | 1.2 | 6.5 | 0.0 | target of myb1 membrane trafficking protein | |
| HSE1 | TOM1L2 | 2 | Gem | 1-0-0 | A | −3.3 | 1.2 | 6.5 | 0.0 | [151] | target of myb1 like 2 membrane trafficking protein |
| NMA1 | NMNAT1 | 3 | Cyt | 1-0-0 | H | −4.6 | −2.0 | 4.2 | 2.5 | [166] | nicotinamide nucleotide adenylyltransferase 1 |
| NMA1 | NMNAT2 | 3 | Both | 1-0-0 | A | −4.6 | −2.0 | 4.2 | 2.5 | [167] | nicotinamide nucleotide adenylyltransferase 2 |
| NMA1 | NMNAT2 | 3 | Cyt | 1-0-0 | L | −4.6 | −2.0 | 4.2 | 2.5 | [167] | nicotinamide nucleotide adenylyltransferase 2 |
| NMA1 | NMNAT3 | 3 | Cyt | 1-0-0 | L | −4.6 | −2.0 | 4.2 | 2.5 | nicotinamide nucleotide adenylyltransferase 3 | |
| RAD54 | ATRX | 2 | Gem | 1-0-0 | L | −4.9 | −0.9 | 4.5 | 3.9 | [168] | ATRX, chromatin remodeler |
| RAD54 | RAD54B | 2 | Cyt | 1-0-0 | L | −4.9 | −0.9 | 4.5 | 3.9 | RAD54 homolog B | |
| RAD54 | RAD54L | 2 | Cyt | 1-0-0 | L | −4.9 | −0.9 | 4.5 | 3.9 | RAD54 like | |
| SCS2 | VAPB | 3 | Gem | 1-0-0 | A, H, L | −4.3 | −0.2 | 3.8 | 1.4 | [100,169] | VAMP associated protein B and C |
| VPS30 | BECN1 | 2 | Gem | 1-0-0 | A | −5.9 | −2.0 | 2.4 | 2.6 | [170] | beclin 1 |
| VPS30 | BECN1 | 2 | Cyt | 1-0-0 | H | −5.9 | −2.0 | 2.4 | 2.6 | [170] | beclin 1 |
| DID4_2 | CHMP2A | 2 | Gem | 1-0-0 | A | −6.1 | −1.2 | 5.2 | 1.8 | [171] | charged multivesicular body protein 2A |
| DID4_2 | CHMP2B | 2 | Gem | 1-0-0 | A, H | −6.1 | −1.2 | 5.2 | 1.8 | [172,173] | charged multivesicular body protein 2B |
| YPT32 | RAB2A | 3 | Gem | 1-0-0 | A | −4.4 | 0.3 | 5.0 | −1.8 | [174] | RAB2A, member RAS oncogene family |
| YPT32 | RAB2B | 3 | Gem | 1-0-0 | L | −4.4 | 0.3 | 5.0 | −1.8 | [175] | RAB2B, member RAS oncogene family |
| KEX2 | PCSK1 | 2 | Gem | 1-0-10 | A, L | −7.8 | −0.3 | 15.4 | −0.9 | [176] | proprotein convertase subtilisin/kexin type 1 |
| KEX2 | PCSK2 | 2 | Gem | 1-0-10 | L | −7.8 | −0.3 | 15.4 | −0.9 | [177] | proprotein convertase subtilisin/kexin type 2 |
| KEX2 | PCSK5 | 2 | Gem | 1-0-10 | A | −7.8 | −0.3 | 15.4 | −0.9 | [177,178] | proprotein convertase subtilisin/kexin type 5 |
| KEX2 | PCSK7 | 2 | Gem | 1-0-10 | A | −7.8 | −0.3 | 15.4 | −0.9 | [177,179] | proprotein convertase subtilisin/kexin type 7 |
| PEP12 | STX12 | 2 | Both | 1-0-10 | A | −8.0 | −16.1 | 13.6 | 5.3 | [180,181] | syntaxin 12 |
| PEP12 | STX12 | 2 | Cyt | 1-0-10 | H | −8.0 | −16.1 | 13.6 | 5.3 | [180,181] | syntaxin 12 |
| VPS27 | WDFY1 | 2 | Gem | 1-0-10 | L | −8.1 | −9.1 | 14.3 | 5.2 | [149,150] | WD repeat and FYVE domain containing 1 |
| VPS41 | VPS41 | 1 | Cyt | 1-0-10 | H | −6.5 | −0.9 | 14.0 | 4.0 | [148] | VPS41, HOPS complex subunit |
| VPS8 | VPS8 | 1 | Gem | 1-0-10 | L | −8.5 | −12.3 | 14.4 | 3.5 | [152] | VPS8, CORVET complex subunit |
| VAM6_2 | VPS39 | 2 | Cyt | 1-0-10 | H | −8.0 | −2.8 | 13.9 | 4.0 | [152] | VPS39, HOPS complex subunit |
| DID4_1 | CHMP2A | 2 | Both | 1-0-10 | A | −8.0 | −12.3 | 14.5 | 8.2 | [171] | charged multivesicular body protein 2A |
| DID4_1 | CHMP2A | 2 | Cyt | 1-0-10 | H | −8.0 | −12.3 | 14.5 | 8.2 | [171] | charged multivesicular body protein 2A |
| DID4_1 | CHMP2B | 2 | Gem | 1-0-10 | A, H | −8.0 | −12.3 | 14.5 | 8.2 | [172,173] | charged multivesicular body protein 2B |
| FKH2 | FOXG1 | 3 | Cyt | 2-0.2-1 | A, L | −9.7 | −2.1 | 19.7 | 5.1 | [134] | forkhead box G1 |
| FKH2 | FOXH1 | 3 | Gem | 2-0.2-1 | H | −9.7 | −2.1 | 19.7 | 5.1 | [137] | forkhead box H1 |
| FKH2 | FOXJ1 | 3 | Cyt | 2-0.2-1 | A, H | −9.7 | −2.1 | 19.7 | 5.1 | [133] | forkhead box J1 |
| FKH2 | FOXJ3 | 3 | Cyt | 2-0.2-1 | L | −9.7 | −2.1 | 19.7 | 5.1 | [135,136] | forkhead box J3 |
| YNK1 | NME3 | 2 | Gem | 2-0.2-1 | H | −9.3 | 1.0 | 20.0 | −4.0 | NME/NM23 nucleoside diphosphate kinase 3 | |
| YNK1 | NME4 | 2 | Cyt | 2-0.2-1 | A, L | −9.3 | 1.0 | 20.0 | −4.0 | NME/NM23 nucleoside diphosphate kinase 4 | |
| YNK1 | NME5 | 2 | Gem | 2-0.2-1 | A | −9.3 | 1.0 | 20.0 | −4.0 | [182] | NME/NM23 family member 5 |
| YNK1 | NME6 | 2 | Cyt | 2-0.2-1 | L | −9.3 | 1.0 | 20.0 | −4.0 | NME/NM23 nucleoside diphosphate kinase 6 | |
| YNK1 | NME7 | 2 | Cyt | 2-0.2-1 | A, H | −9.3 | 1.0 | 20.0 | −4.0 | NME/NM23 family member 7 | |
| ALD6 | ALDH1A1 | 3 | Cyt | 1-0-7 | L | 1.3 | 1.7 | −2.4 | −3.5 | [183,184,185] | aldehyde dehydrogenase 1 family member A1 |
| ALD6 | ALDH1A2 | 3 | Cyt | 1-0-7 | A, H | 1.3 | 1.7 | −2.4 | −3.5 | aldehyde dehydrogenase 1 family member A2 | |
| ALD6 | ALDH1B1 | 3 | Gem | 1-0-7 | L | 1.3 | 1.7 | −2.4 | −3.5 | [185] | aldehyde dehydrogenase 1 family member B1 |
| ALD6 | ALDH7A1 | 3 | Cyt | 1-0-7 | A | 1.3 | 1.7 | −2.4 | −3.5 | [185] | aldehyde dehydrogenase 7 family member A1 |
| CKA2 | CSNK2A1 | 2 | Gem | 1-0-7 | A | 1.2 | −0.2 | −2.5 | −1.5 | [186,187,188,189,190,191,192,193] | casein kinase 2 α 1 |
| CKA2 | CSNK2A2 | 2 | Gem | 1-0-7 | A, L | 1.2 | −0.2 | −2.5 | −1.5 | [186,187,188,189,190,191,192,193] | casein kinase 2 α 2 |
| CLB2 | CCNA2 | 3 | Gem | 1-0-7 | L | 2.0 | 0.4 | −2.2 | 0.6 | [194,195,196,197] | cyclin A2 |
| CLB2 | CCNB1 | 3 | Gem | 1-0-7 | L | 2.0 | 0.4 | −2.2 | 0.6 | [194,195,196,197] | cyclin B1 |
| EFT2 | EEF2 | 3 | Gem | 1-0-7 | A | 0.9 | 0.8 | −2.4 | −1.8 | [198] | eukaryotic translation elongation factor 2 |
| EFT2 | EFTUD2 | 3 | Gem | 1-0-7 | A | 0.9 | 0.8 | −2.4 | −1.8 | [199] | elongation factor Tu GTP binding domain containing 2 |
| OLA1 | OLA1 | 1 | Gem | 1-0-7 | A | 1.0 | 0.8 | −2.6 | −3.0 | [200,201,202] | Obg like ATPase 1 |
| OLA1 | OLA1 | 1 | Cyt | 1-0-7 | H | 1.0 | 0.8 | −2.6 | −3.0 | [200,201,202] | Obg like ATPase 1 |
| RPA49 | POLR1E | 1 | Gem | 1-0-7 | A, L | 1.8 | −0.9 | −2.6 | 0.6 | [203,204,205,206] | RNA polymerase I subunit E |
| SKY1 | SRPK1 | 2 | Gem | 1-0-7 | A, L | 0.8 | −0.6 | −2.1 | −1.3 | [207] | SRSF protein kinase 1 |
| SNC2 | VAMP8 | 3 | Gem | 1-0-7 | L | 1.4 | 0.1 | −2.3 | −0.6 | [208,209] | vesicle associated membrane protein 8 |
| TOP1 | TOP1 | 2 | Gem | 1-0-7 | A, L | 1.3 | 0.3 | −3.1 | −3.9 | [210] | DNA topoisomerase I |
| TOP1 | TOP1MT | 2 | Both | 1-0-7 | A, H, L | 1.3 | 0.3 | −3.1 | −3.9 | DNA topoisomerase I mitochondrial | |
| YPT6 | RAB34 | 2 | Gem | 1-0-7 | A, L | 1.4 | 1.1 | −2.1 | 1.7 | [211,212,213] | RAB34, member RAS oncogene family |
| RPP2B | RPLP2 | 2 | Gem | 2-0.8-0 | A | 1.7 | 0.2 | −5.3 | −2.8 | [214] | ribosomal protein lateral stalk subunit P2 |
| YGR054W | EIF2A | 1 | Gem | 2-0.8-0 | A | 1.8 | 0.2 | −4.1 | −1.0 | [215] | eukaryotic translation initiation factor 2A |
5.2. Autophagy Related Processes
5.3. Histone Modification and Chromatin Remodeling
5.4. Peptidyl–Tyrosine Dephosphorylation
5.5. Elongator Holoenzyme Complex and Protein Urmylation
5.6. Gemcitabine-Buffering by Non-GO-Enriched Yeast-Human Homologs
5.7. Gemcitabine-Specific Gene Deletion Suppression
5.8. Correlation of Gemcitabine-Specific Gene Deletion Suppression with OES in Cancer Cells
6. Cytarabine-Specific Gene Interaction Modules
6.1. Cytarabine-Specific Gene Deletion Enhancement
| yGene | hGene | H | Drug | Cluster | Tissue | Gem_K | Cyt_K | Gem_L | Cyt_L | Ref | Description_Human |
|---|---|---|---|---|---|---|---|---|---|---|---|
| CCH1 | CACNA1A | 2 | Cyt | 1-0-9 | A, L | 0.2 | −4.5 | 0.5 | 5.5 | [274] | calcium voltage-gated channel subunit alpha1 A |
| CCH1 | CACNA1B | 2 | Cyt | 1-0-9 | A, L | 0.2 | −4.5 | 0.5 | 5.5 | [274] | calcium voltage-gated channel subunit alpha1 B |
| CCH1 | CACNA1C | 2 | Cyt | 1-0-9 | A, H, L | 0.2 | −4.5 | 0.5 | 5.5 | [274] | calcium voltage-gated channel subunit alpha1 C |
| CCH1 | CACNA1E | 2 | Cyt | 1-0-9 | A, L | 0.2 | −4.5 | 0.5 | 5.5 | [274] | calcium voltage-gated channel subunit alpha1 E |
| CCH1 | CACNA1F | 2 | Cyt | 1-0-9 | A | 0.2 | −4.5 | 0.5 | 5.5 | [274] | calcium voltage-gated channel subunit alpha1 F |
| CCH1 | NALCN | 2 | Cyt | 1-0-9 | H | 0.2 | −4.5 | 0.5 | 5.5 | sodium leak channel, non-selective | |
| FAT1 | SLC27A2 | 2 | Cyt | 1-0-9 | L | 0.7 | −8.5 | −0.9 | 8.9 | [275] | solute carrier family 27 member 2 |
| FAT1 | SLC27A3 | 2 | Cyt | 1-0-9 | L | 0.7 | −8.5 | −0.9 | 8.9 | [276] | solute carrier family 27 member 3 |
| FOL2 | GCH1 | 1 | Cyt | 1-0-9 | L | −0.9 | −9.4 | 0.7 | 7.1 | [277] | GTP cyclohydrolase 1 |
| HSL1 | BRSK1 | 3 | Cyt | 1-0-9 | A, L | 0.9 | −10.4 | 0.1 | 11.6 | [270,271] | BR serine/threonine kinase 1 |
| HSL1 | BRSK2 | 3 | Cyt | 1-0-9 | A, L | 0.9 | −10.4 | 0.1 | 11.6 | [272] | BR serine/threonine kinase 2 |
| IZH1 | ADIPOR1 | 3 | Cyt | 1-0-9 | H | 1.1 | −5.8 | −0.4 | 7.6 | [278,279] | adiponectin receptor 1 |
| IZH1 | PAQR4 | 3 | Cyt | 1-0-9 | A, L | 1.1 | −5.8 | −0.4 | 7.6 | progestin and adipoQ receptor family member 4 | |
| NAP1 | NAP1L3 | 2 | Cyt | 1-0-9 | A, L | 1.0 | −4.7 | −1.5 | 5.6 | [280] | nucleosome assembly protein 1 like 3 |
| NAP1 | NAP1L4 | 2 | Cyt | 1-0-9 | L | 1.0 | −4.7 | −1.5 | 5.6 | nucleosome assembly protein 1 like 4 | |
| PTM1 | TMEM87B | 3 | Cyt | 1-0-9 | A, H | −0.7 | −3.8 | −0.2 | 5.7 | [281] | transmembrane protein 87B |
6.2. Human Genes that have Deletion Enhancing Yeast Homologs and Confer Cytarabine UES
- (1)
- Ptm1, which is a protein of unknown function that copurifies with late Golgi vesicles containing the v-SNARE, Tlg2p, but interestingly, its human homologs, TMEM87A and TMEM87B, were UES for cytarabine and identified in a study focused on cytarabine efficacy in acute myelogenous leukemia [281].
- (2)
- NAP1/NAP1L3/NAP1L4, which is a nucleosome assembly protein involved in nuclear transport and exchange of histones H2A and H2B and also interacts with Clb2, is phosphorylated by CK2, and has protein abundance that increases in response to DNA replication stress [155]. NAP1L3 is overexpressed in breast cancer [280].
- (3)
- CCH1, which is a voltage-gated high-affinity calcium channel with several homologs that were UES, including: CACNA1A, underexpressed in breast, colorectal, esophageal, gastric, and brain cancers; CACNA1B, underexpressed in breast and brain cancers; CACNA1C, underexpressed in brain, bladder, lung, lymphoma, prostate, and renal cancers; CACNA1E, underexpressed in breast, brain, gastric, leukemia, lung, and prostate cancers; and CACNA1F, underexpressed in lymphoma [274].
- (4)
- (5)
- (6)
- FOL2/GCH1, a GTP-cyclohydrolase that catalyzes the first step in folic acid biosynthesis. Downregulation of GCH1 occurs in esophageal squamous cell carcinoma [277].
7. Discussion
8. Conclusions
Supplementary Materials
Author Contributions
Acknowledgments
Conflicts of Interest
List of Abbreviations and Glossary of Terms
References
- Torti, D.; Trusolino, L. Oncogene addiction as a foundational rationale for targeted anticancer therapy: Promises and perils. EMBO Mol. Med. 2011, 3, 623–636. [Google Scholar] [CrossRef] [PubMed]
- Masui, K.; Gini, B.; Wykosky, J.; Zanca, C.; Mischel, P.S.; Furnari, F.B.; Cavenee, W.K. A tale of two approaches: Complementary mechanisms of cytotoxic and targeted therapy resistance may inform next-generation cancer treatments. Carcinogenesis 2013, 34, 725–738. [Google Scholar] [CrossRef]
- Hartwell, L.H.; Szankasi, P.; Roberts, C.J.; Murray, A.W.; Friend, S.H. Integrating genetic approaches into the discovery of anticancer drugs. Science 1997, 278, 1064–1068. [Google Scholar] [CrossRef] [PubMed]
- Srivas, R.; Shen, J.P.; Yang, C.C.; Sun, S.M.; Li, J.; Gross, A.M.; Jensen, J.; Licon, K.; Bojorquez-Gomez, A.; Klepper, K.; et al. A Network of Conserved Synthetic Lethal Interactions for Exploration of Precision Cancer Therapy. Mol. Cell 2016, 63, 514–525. [Google Scholar] [CrossRef] [PubMed] [Green Version]
- Hartman, J.L., IV; Garvik, B.; Hartwell, L. Principles for the buffering of genetic variation. Science 2001, 291, 1001–1004. [Google Scholar] [CrossRef] [PubMed]
- Hartman, J.L., IV; Tippery, N.P. Systematic quantification of gene interactions by phenotypic array analysis. Genome Biol. 2004, 5, R49. [Google Scholar] [CrossRef]
- Shah, N.A.; Laws, R.J.; Wardman, B.; Zhao, L.P.; Hartman, J.L., IV. Accurate, precise modeling of cell proliferation kinetics from time-lapse imaging and automated image analysis of agar yeast culture arrays. BMC Syst. Biol. 2007, 1, 3. [Google Scholar] [CrossRef] [PubMed]
- Hartman, J.L., IV; Stisher, C.; Outlaw, D.A.; Guo, J.; Shah, N.A.; Tian, D.; Santos, S.M.; Rodgers, J.W.; White, R.A. Yeast Phenomics: An Experimental Approach for Modeling Gene Interaction Networks that Buffer Disease. Genes 2015, 6, 24–45. [Google Scholar] [CrossRef] [Green Version]
- Louie, R.J.; Guo, J.; Rodgers, J.W.; White, R.; Shah, N.; Pagant, S.; Kim, P.; Livstone, M.; Dolinski, K.; McKinney, B.A.; et al. A yeast phenomic model for the gene interaction network modulating CFTR-∆F508 protein biogenesis. Genome Med. 2012, 4, 103. [Google Scholar] [CrossRef] [PubMed]
- Galmarini, C.M.; Mackey, J.R.; Dumontet, C. Nucleoside analogues and nucleobases in cancer treatment. Lancet Oncol. 2002, 3, 415–424. [Google Scholar] [CrossRef]
- Parker, W.B. Enzymology of purine and pyrimidine antimetabolites used in the treatment of cancer. Chem. Rev. 2009, 109, 2880–2893. [Google Scholar] [CrossRef] [PubMed]
- de Sousa Cavalcante, L.; Monteiro, G. Gemcitabine: Metabolism and molecular mechanisms of action, sensitivity and chemoresistance in pancreatic cancer. Eur. J. Pharmacol. 2014, 741, 8–16. [Google Scholar] [CrossRef] [PubMed]
- Hayashi, H.; Kurata, T.; Nakagawa, K. Gemcitabine: Efficacy in the treatment of advanced stage nonsquamous non-small cell lung cancer. Clin. Med. Insights Oncol. 2011, 5, 177–184. [Google Scholar] [CrossRef] [PubMed]
- Raja, F.A.; Counsell, N.; Colombo, N.; Pfisterer, J.; du Bois, A.; Parmar, M.K.; Vergote, I.B.; Gonzalez-Martin, A.; Alberts, D.S.; Plante, M.; et al. Platinum versus platinum-combination chemotherapy in platinum-sensitive recurrent ovarian cancer: A meta-analysis using individual patient data. Ann. Oncol. 2013, 24, 3028–3034. [Google Scholar] [CrossRef] [PubMed]
- Alli, E.; Sharma, V.B.; Hartman, A.R.; Lin, P.S.; McPherson, L.; Ford, J.M. Enhanced sensitivity to cisplatin and gemcitabine in Brca1-deficient murine mammary epithelial cells. BMC Pharmacol. 2011, 11, 7. [Google Scholar] [CrossRef]
- Reese, N.D.; Schiller, G.J. High-dose cytarabine (HD araC) in the treatment of leukemias: A review. Curr. Hematol. Malig. Rep. 2013, 8, 141–148. [Google Scholar] [CrossRef] [PubMed]
- Giovannetti, E.; Del Tacca, M.; Mey, V.; Funel, N.; Nannizzi, S.; Ricci, S.; Orlandini, C.; Boggi, U.; Campani, D.; Del Chiaro, M.; et al. Transcription analysis of human equilibrative nucleoside transporter-1 predicts survival in pancreas cancer patients treated with gemcitabine. Cancer Res. 2006, 66, 3928–3935. [Google Scholar] [CrossRef]
- Skrypek, N.; Duchene, B.; Hebbar, M.; Leteurtre, E.; van Seuningen, I.; Jonckheere, N. The MUC4 mucin mediates gemcitabine resistance of human pancreatic cancer cells via the Concentrative Nucleoside Transporter family. Oncogene 2013, 32, 1714–1723. [Google Scholar] [CrossRef]
- Song, J.H.; Kim, S.H.; Kweon, S.H.; Lee, T.H.; Kim, H.J.; Kim, H.J.; Kim, T.S. Defective expression of deoxycytidine kinase in cytarabine-resistant acute myeloid leukemia cells. Int. J. Oncol. 2009, 34, 1165–1171. [Google Scholar] [Green Version]
- Duxbury, M.S.; Ito, H.; Zinner, M.J.; Ashley, S.W.; Whang, E.E. RNA interference targeting the M2 subunit of ribonucleotide reductase enhances pancreatic adenocarcinoma chemosensitivity to gemcitabine. Oncogene 2004, 23, 1539–1548. [Google Scholar] [CrossRef]
- Davidson, J.D.; Ma, L.; Flagella, M.; Geeganage, S.; Gelbert, L.M.; Slapak, C.A. An increase in the expression of ribonucleotide reductase large subunit 1 is associated with gemcitabine resistance in non-small cell lung cancer cell lines. Cancer Res. 2004, 64, 3761–3766. [Google Scholar] [CrossRef] [PubMed]
- Li, L.; Fridley, B.L.; Kalari, K.; Jenkins, G.; Batzler, A.; Weinshilboum, R.M.; Wang, L. Gemcitabine and arabinosylcytosin pharmacogenomics: Genome-wide association and drug response biomarkers. PLoS ONE 2009, 4, e7765. [Google Scholar] [CrossRef] [PubMed]
- Innocenti, F.; Owzar, K.; Cox, N.L.; Evans, P.; Kubo, M.; Zembutsu, H.; Jiang, C.; Hollis, D.; Mushiroda, T.; Li, L.; et al. A genome-wide association study of overall survival in pancreatic cancer patients treated with gemcitabine in CALGB 80303. Clin. Cancer Res. 2012, 18, 577–584. [Google Scholar] [CrossRef] [PubMed]
- You, L.; Chang, D.; Du, H.Z.; Zhao, Y.P. Genome-wide screen identifies PVT1 as a regulator of Gemcitabine sensitivity in human pancreatic cancer cells. Biochem. Biophys. Res. Commun. 2011, 407, 1–6. [Google Scholar] [CrossRef]
- Bargal, S.A.; Rafiee, R.; Crews, K.R.; Wu, H.; Cao, X.; Rubnitz, J.E.; Ribeiro, R.C.; Downing, J.R.; Pounds, S.B.; Lamba, J.K. Genome-wide association analysis identifies SNPs predictive of in vitro leukemic cell sensitivity to cytarabine in pediatric AML. Oncotarget 2018, 9, 34859–34875. [Google Scholar] [CrossRef] [PubMed] [Green Version]
- Gamazon, E.R.; Lamba, J.K.; Pounds, S.; Stark, A.L.; Wheeler, H.E.; Cao, X.; Im, H.K.; Mitra, A.K.; Rubnitz, J.E.; Ribeiro, R.C.; et al. Comprehensive genetic analysis of cytarabine sensitivity in a cell-based model identifies polymorphisms associated with outcome in AML patients. Blood 2013, 121, 4366–4376. [Google Scholar] [CrossRef] [Green Version]
- Giaever, G.; Chu, A.M.; Ni, L.; Connelly, C.; Riles, L.; Veronneau, S.; Dow, S.; Lucau-Danila, A.; Anderson, K.; Andre, B.; et al. Functional profiling of the Saccharomyces cerevisiae genome. Nature 2002, 418, 387–391. [Google Scholar] [CrossRef]
- Tong, A.H.; Boone, C. Synthetic genetic array analysis in Saccharomyces cerevisiae. Methods Mol. Biol. 2006, 313, 171–192. [Google Scholar]
- Singh, I.; Pass, R.; Togay, S.O.; Rodgers, J.W.; Hartman, J.L., IV. Stringent Mating-Type-Regulated Auxotrophy Increases the Accuracy of Systematic Genetic Interaction Screens with Saccharomyces cerevisiae Mutant Arrays. Genetics 2009, 181, 289–300. [Google Scholar] [CrossRef]
- Yang, W.; Soares, J.; Greninger, P.; Edelman, E.J.; Lightfoot, H.; Forbes, S.; Bindal, N.; Beare, D.; Smith, J.A.; Thompson, I.R.; et al. Genomics of Drug Sensitivity in Cancer (GDSC): A resource for therapeutic biomarker discovery in cancer cells. Nucleic Acids Res. 2013, 41, D955–D961. [Google Scholar] [CrossRef]
- Klijn, C.; Durinck, S.; Stawiski, E.W.; Haverty, P.M.; Jiang, Z.; Liu, H.; Degenhardt, J.; Mayba, O.; Gnad, F.; Liu, J.; et al. A comprehensive transcriptional portrait of human cancer cell lines. Nat. Biotechnol. 2015, 33, 306–312. [Google Scholar] [CrossRef] [PubMed]
- Smirnov, P.; Kofia, V.; Maru, A.; Freeman, M.; Ho, C.; El-Hachem, N.; Adam, G.A.; Ba-Alawi, W.; Safikhani, Z.; Haibe-Kains, B. PharmacoDB: An integrative database for mining in vitro anticancer drug screening studies. Nucleic Acids Res. 2018, 46, D994–D1002. [Google Scholar] [CrossRef] [PubMed]
- Hartman, J.L., IV. Buffering of deoxyribonucleotide pool homeostasis by threonine metabolism. Proc. Natl. Acad. Sci. USA 2007, 104, 11700–11705. [Google Scholar] [CrossRef] [PubMed] [Green Version]
- Belli, G.; Gari, E.; Piedrafita, L.; Aldea, M.; Herrero, E. An activator/repressor dual system allows tight tetracycline-regulated gene expression in budding yeast. Nucleic Acids Res. 1998, 26, 942–947. [Google Scholar] [CrossRef] [PubMed]
- William, D. Charakterisierung der C Terminalen Domäne von Mycobacterium Tuberculosis Protein A; Friedrich-Alexander-Universität Erlangen-Nürnberg: Erlangen, Germany, 2012. [Google Scholar]
- Goldstein, A.L.; McCusker, J.H. Three new dominant drug resistance cassettes for gene disruption in Saccharomyces cerevisiae. Yeast 1999, 15, 1541–1553. [Google Scholar] [CrossRef]
- Rodgers, J.; Guo, J.; Hartman, J.L., IV. Phenomic assessment of genetic buffering by kinetic analysis of cell arrays. Methods Mol. Biol. 2014, 1205, 187–208. [Google Scholar] [CrossRef] [PubMed]
- Mani, R.; St Onge, R.P.; Hartman, J.L., IV; Giaever, G.; Roth, F.P. Defining genetic interaction. Proc. Natl. Acad. Sci. USA 2008, 105, 3461–3466. [Google Scholar] [CrossRef] [PubMed] [Green Version]
- Santos, S.M.; Hartman, J.L., IV. A yeast phenomic model for the influence of Warburg metabolism on genetic buffering of doxorubicin. bioRxiv 2019, 517490. [Google Scholar] [CrossRef] [Green Version]
- Guo, J.; Tian, D.; McKinney, B.A.; Hartman, J.L., IV. Recursive expectation-maximization clustering: A method for identifying buffering mechanisms composed of phenomic modules. Chaos 2010, 20, 026103. [Google Scholar] [CrossRef] [Green Version]
- Boyle, E.I.; Weng, S.; Gollub, J.; Jin, H.; Botstein, D.; Cherry, J.M.; Sherlock, G. GO::TermFinder—Open source software for accessing Gene Ontology information and finding significantly enriched Gene Ontology terms associated with a list of genes. Bioinformatics 2004, 20, 3710–3715. [Google Scholar] [CrossRef] [PubMed]
- Cherry, J.M.; Hong, E.L.; Amundsen, C.; Balakrishnan, R.; Binkley, G.; Chan, E.T.; Christie, K.R.; Costanzo, M.C.; Dwight, S.S.; Engel, S.R.; et al. Saccharomyces Genome Database: The genomics resource of budding yeast. Nucleic Acids Res. 2012, 40, D700–D705. [Google Scholar] [CrossRef] [PubMed]
- Smirnov, P.; Safikhani, Z.; El-Hachem, N.; Wang, D.; She, A.; Olsen, C.; Freeman, M.; Selby, H.; Gendoo, D.M.; Grossmann, P.; et al. PharmacoGx: An R package for analysis of large pharmacogenomic datasets. Bioinformatics 2016, 32, 1244–1246. [Google Scholar] [CrossRef] [PubMed]
- Durinck, S.; Moreau, Y.; Kasprzyk, A.; Davis, S.; De Moor, B.; Brazma, A.; Huber, W. BioMart and Bioconductor: A powerful link between biological databases and microarray data analysis. Bioinformatics 2005, 21, 3439–3440. [Google Scholar] [CrossRef] [PubMed]
- Durinck, S.; Spellman, P.T.; Birney, E.; Huber, W. Mapping identifiers for the integration of genomic datasets with the R/Bioconductor package biomaRt. Nat. Protoc. 2009, 4, 1184–1191. [Google Scholar] [CrossRef] [PubMed] [Green Version]
- Zerbino, D.R.; Achuthan, P.; Akanni, W.; Amode, M.R.; Barrell, D.; Bhai, J.; Billis, K.; Cummins, C.; Gall, A.; Giron, C.G.; et al. Ensembl 2018. Nucleic Acids Res. 2018, 46, D754–D761. [Google Scholar] [CrossRef]
- Heinicke, S.; Livstone, M.S.; Lu, C.; Oughtred, R.; Kang, F.; Angiuoli, S.V.; White, O.; Botstein, D.; Dolinski, K. The Princeton Protein Orthology Database (P-POD): A comparative genomics analysis tool for biologists. PLoS ONE 2007, 2, e766. [Google Scholar] [CrossRef]
- Tong, A.H.; Evangelista, M.; Parsons, A.B.; Xu, H.; Bader, G.D.; Page, N.; Robinson, M.; Raghibizadeh, S.; Hogue, C.W.; Bussey, H.; et al. Systematic genetic analysis with ordered arrays of yeast deletion mutants. Science 2001, 294, 2364–2368. [Google Scholar] [CrossRef]
- Garnett, M.J.; Edelman, E.J.; Heidorn, S.J.; Greenman, C.D.; Dastur, A.; Lau, K.W.; Greninger, P.; Thompson, I.R.; Luo, X.; Soares, J.; et al. Systematic identification of genomic markers of drug sensitivity in cancer cells. Nature 2012, 483, 570–575. [Google Scholar] [CrossRef] [Green Version]
- Haverty, P.M.; Lin, E.; Tan, J.; Yu, Y.; Lam, B.; Lianoglou, S.; Neve, R.M.; Martin, S.; Settleman, J.; Yauch, R.L.; et al. Reproducible pharmacogenomic profiling of cancer cell line panels. Nature 2016, 533, 333–337. [Google Scholar] [CrossRef]
- Hartwell, L.H.; Hopfield, J.J.; Leibler, S.; Murray, A.W. From molecular to modular cell biology. Nature 1999, 402, C47–C52. [Google Scholar] [CrossRef]
- Birrell, G.W.; Brown, J.A.; Wu, H.I.; Giaever, G.; Chu, A.M.; Davis, R.W.; Brown, J.M. Transcriptional response of Saccharomyces cerevisiae to DNA-damaging agents does not identify the genes that protect against these agents. Proc. Natl. Acad. Sci. USA 2002, 99, 8778–8783. [Google Scholar] [CrossRef] [PubMed]
- O’Neil, N.J.; Bailey, M.L.; Hieter, P. Synthetic lethality and cancer. Nat. Rev. Genet. 2017, 18, 613–623. [Google Scholar] [CrossRef] [PubMed]
- McGary, K.L.; Park, T.J.; Woods, J.O.; Cha, H.J.; Wallingford, J.B.; Marcotte, E.M. Systematic discovery of nonobvious human disease models through orthologous phenotypes. Proc. Natl. Acad. Sci. USA 2010, 107, 6544–6549. [Google Scholar] [CrossRef] [PubMed] [Green Version]
- Shen, J.P.; Ideker, T. Synthetic Lethal Networks for Precision Oncology: Promises and Pitfalls. J. Mol. Biol. 2018, 430, 2900–2912. [Google Scholar] [CrossRef] [PubMed]
- Shaheen, M.; Allen, C.; Nickoloff, J.A.; Hromas, R. Synthetic lethality: Exploiting the addiction of cancer to DNA repair. Blood 2011, 117, 6074–6082. [Google Scholar] [CrossRef] [PubMed]
- Shin, S.H.; Bode, A.M.; Dong, Z. Precision medicine: The foundation of future cancer therapeutics. NPJ Precis. Oncol. 2017, 1, 12. [Google Scholar] [CrossRef]
- Shimomura, I.; Yamamoto, Y.; Ochiya, T. Synthetic Lethality in Lung Cancer-From the Perspective of Cancer Genomics. Medicines 2019, 6, 38. [Google Scholar] [CrossRef]
- Chang, M.; Bellaoui, M.; Zhang, C.; Desai, R.; Morozov, P.; Delgado-Cruzata, L.; Rothstein, R.; Freyer, G.A.; Boone, C.; Brown, G.W. RMI1/NCE4, a suppressor of genome instability, encodes a member of the RecQ helicase/Topo III complex. EMBO J. 2005, 24, 2024–2033. [Google Scholar] [CrossRef] [PubMed] [Green Version]
- Cejka, P.; Plank, J.L.; Dombrowski, C.C.; Kowalczykowski, S.C. Decatenation of DNA by the S. cerevisiae Sgs1-Top3-Rmi1 and RPA complex: A mechanism for disentangling chromosomes. Mol. Cell 2012, 47, 886–896. [Google Scholar] [CrossRef]
- Saponaro, M.; Kantidakis, T.; Mitter, R.; Kelly, G.P.; Heron, M.; Williams, H.; Soding, J.; Stewart, A.; Svejstrup, J.Q. RECQL5 controls transcript elongation and suppresses genome instability associated with transcription stress. Cell 2014, 157, 1037–1049. [Google Scholar] [CrossRef]
- Hu, Y.; Raynard, S.; Sehorn, M.G.; Lu, X.; Bussen, W.; Zheng, L.; Stark, J.M.; Barnes, E.L.; Chi, P.; Janscak, P.; et al. RECQL5/Recql5 helicase regulates homologous recombination and suppresses tumor formation via disruption of Rad51 presynaptic filaments. Genes Dev. 2007, 21, 3073–3084. [Google Scholar] [CrossRef] [PubMed] [Green Version]
- Martin, C.A.; Sarlos, K.; Logan, C.V.; Thakur, R.S.; Parry, D.A.; Bizard, A.H.; Leitch, A.; Cleal, L.; Ali, N.S.; Al-Owain, M.A.; et al. Mutations in TOP3A Cause a Bloom Syndrome-like Disorder. Am. J. Hum. Genet. 2018, 103, 221–231. [Google Scholar] [CrossRef] [PubMed] [Green Version]
- Bai, Y.; Li, L.D.; Li, J.; Lu, X. Targeting of topoisomerases for prognosis and drug resistance in ovarian cancer. J. Ovarian Res. 2016, 9, 35. [Google Scholar] [CrossRef] [PubMed] [Green Version]
- Broberg, K.; Huynh, E.; Schlawicke Engstrom, K.; Bjork, J.; Albin, M.; Ingvar, C.; Olsson, H.; Hoglund, M. Association between polymorphisms in RMI1, TOP3A, and BLM and risk of cancer, a case-control study. BMC Cancer 2009, 9, 140. [Google Scholar] [CrossRef] [PubMed]
- Nagai, H.; Yabe, A.; Mine, N.; Mikami, I.; Fujiwara, H.; Terada, Y.; Hirano, A.; Tsuneizumi, M.; Yokota, T.; Emi, M. Down-regulation in human cancers of DRHC, a novel helicase-like gene from 17q25.1 that inhibits cell growth. Cancer Lett. 2003, 193, 41–47. [Google Scholar] [CrossRef] [PubMed]
- Hamamoto, R.; Furukawa, Y.; Morita, M.; Iimura, Y.; Silva, F.P.; Li, M.; Yagyu, R.; Nakamura, Y. SMYD3 encodes a histone methyltransferase involved in the proliferation of cancer cells. Nat. Cell Biol. 2004, 6, 731–740. [Google Scholar] [CrossRef]
- Hasgall, P.A.; Hoogewijs, D.; Faza, M.B.; Panse, V.G.; Wenger, R.H.; Camenisch, G. The putative RNA helicase HELZ promotes cell proliferation, translation initiation and ribosomal protein S6 phosphorylation. PLoS ONE 2011, 6, e22107. [Google Scholar] [CrossRef]
- Schepeler, T.; Holm, A.; Halvey, P.; Nordentoft, I.; Lamy, P.; Riising, E.M.; Christensen, L.L.; Thorsen, K.; Liebler, D.C.; Helin, K.; et al. Attenuation of the β-catenin/TCF4 complex in colorectal cancer cells induces several growth-suppressive microRNAs that target cancer promoting genes. Oncogene 2012, 31, 2750–2760. [Google Scholar] [CrossRef]
- Li, L.; Geng, Y.; Feng, R.; Zhu, Q.; Miao, B.; Cao, J.; Fei, S. The Human RNA Surveillance Factor UPF1 Modulates Gastric Cancer Progression by Targeting Long Non-Coding RNA MALAT1. Cell. Physiol. Biochem. 2017, 42, 2194–2206. [Google Scholar] [CrossRef] [Green Version]
- Chang, L.; Li, C.; Guo, T.; Wang, H.; Ma, W.; Yuan, Y.; Liu, Q.; Ye, Q.; Liu, Z. The human RNA surveillance factor UPF1 regulates tumorigenesis by targeting Smad7 in hepatocellular carcinoma. J. Exp. Clin. Cancer Res. 2016, 35, 8. [Google Scholar] [CrossRef] [Green Version]
- Liu, C.; Karam, R.; Zhou, Y.; Su, F.; Ji, Y.; Li, G.; Xu, G.; Lu, L.; Wang, C.; Song, M.; et al. The UPF1 RNA surveillance gene is commonly mutated in pancreatic adenosquamous carcinoma. Nat. Med. 2014, 20, 596–598. [Google Scholar] [CrossRef] [PubMed] [Green Version]
- Chen, M.B.; Liu, Y.Y.; Cheng, L.B.; Lu, J.W.; Zeng, P.; Lu, P.H. AMPKalpha phosphatase Ppm1E upregulation in human gastric cancer is required for cell proliferation. Oncotarget 2017, 8, 31288–31296. [Google Scholar] [CrossRef] [PubMed]
- Thean, L.F.; Loi, C.; Ho, K.S.; Koh, P.K.; Eu, K.W.; Cheah, P.Y. Genome-wide scan identifies a copy number variable region at 3q26 that regulates PPM1L in APC mutation-negative familial colorectal cancer patients. Genes Chromosomes Cancer 2010, 49, 99–106. [Google Scholar] [CrossRef] [PubMed]
- Kondo, T.; Matsumoto, K.; Sugimoto, K. Role of a complex containing Rad17, Mec3, and Ddc1 in the yeast DNA damage checkpoint pathway. Mol. Cell. Biol. 1999, 19, 1136–1143. [Google Scholar] [CrossRef] [PubMed]
- Paciotti, V.; Lucchini, G.; Plevani, P.; Longhese, M.P. Mec1p is essential for phosphorylation of the yeast DNA damage checkpoint protein Ddc1p, which physically interacts with Mec3p. EMBO J. 1998, 17, 4199–4209. [Google Scholar] [CrossRef] [PubMed] [Green Version]
- Majka, J.; Burgers, P.M. Yeast Rad17/Mec3/Ddc1: A sliding clamp for the DNA damage checkpoint. Proc. Natl. Acad. Sci. USA 2003, 100, 2249–2254. [Google Scholar] [CrossRef] [PubMed] [Green Version]
- Navadgi-Patil, V.M.; Burgers, P.M. The unstructured C-terminal tail of the 9-1-1 clamp subunit Ddc1 activates Mec1/ATR via two distinct mechanisms. Mol. Cell 2009, 36, 743–753. [Google Scholar] [CrossRef] [PubMed]
- Fredebohm, J.; Wolf, J.; Hoheisel, J.D.; Boettcher, M. Depletion of RAD17 sensitizes pancreatic cancer cells to gemcitabine. J. Cell Sci. 2013, 126, 3380–3389. [Google Scholar] [CrossRef] [Green Version]
- Liu, S.; Bachran, C.; Gupta, P.; Miller-Randolph, S.; Wang, H.; Crown, D.; Zhang, Y.; Wein, A.N.; Singh, R.; Fattah, R.; et al. Diphthamide modification on eukaryotic elongation factor 2 is needed to assure fidelity of mRNA translation and mouse development. Proc. Natl. Acad. Sci. USA 2012, 109, 13817–13822. [Google Scholar] [CrossRef] [PubMed] [Green Version]
- Villahermosa, D.; Fleck, O. Elp3 and Dph3 of Schizosaccharomyces pombe mediate cellular stress responses through tRNA(Lys)UUU modifications. Sci. Rep. 2017, 7, 7225. [Google Scholar] [CrossRef]
- Denisova, E.; Heidenreich, B.; Nagore, E.; Rachakonda, P.S.; Hosen, I.; Akrap, I.; Traves, V.; Garcia-Casado, Z.; Lopez-Guerrero, J.A.; Requena, C.; et al. Frequent DPH3 promoter mutations in skin cancers. Oncotarget 2015, 6, 35922–35930. [Google Scholar] [CrossRef] [PubMed]
- Abiatari, I.; Gillen, S.; DeOliveira, T.; Klose, T.; Bo, K.; Giese, N.A.; Friess, H.; Kleeff, J. The microtubule-associated protein MAPRE2 is involved in perineural invasion of pancreatic cancer cells. Int. J. Oncol. 2009, 35, 1111–1116. [Google Scholar] [PubMed] [Green Version]
- Kim, Y.R.; Kim, H.S.; An, C.H.; Kim, S.S.; Yoo, N.J.; Lee, S.H. Frameshift mutation of MAPRE3, a microtubule-related gene, in gastric and colorectal cancers with microsatellite instability. Pathology 2010, 42, 493–496. [Google Scholar] [CrossRef] [PubMed]
- Shah, M.A.; Denton, E.L.; Arrowsmith, C.H.; Lupien, M.; Schapira, M. A global assessment of cancer genomic alterations in epigenetic mechanisms. Epigenet. Chromatin 2014, 7, 29. [Google Scholar] [CrossRef] [PubMed] [Green Version]
- Harsay, E.; Schekman, R. Avl9p, a member of a novel protein superfamily, functions in the late secretory pathway. Mol. Biol. Cell 2007, 18, 1203–1219. [Google Scholar] [CrossRef] [PubMed]
- Li, Y.; Xu, J.; Xiong, H.; Ma, Z.; Wang, Z.; Kipreos, E.T.; Dalton, S.; Zhao, S. Cancer driver candidate genes AVL9, DENND5A and NUPL1 contribute to MDCK cystogenesis. Oncoscience 2014, 1, 854–865. [Google Scholar] [CrossRef]
- Zhang, W.; Wang, J.; Chai, R.; Zhong, G.; Zhang, C.; Cao, W.; Yan, L.; Zhang, X.; Xu, Z. Hypoxia-regulated lncRNA CRPAT4 promotes cell migration via regulating AVL9 in clear cell renal cell carcinomas. Onco Targets Ther. 2018, 11, 4537–4545. [Google Scholar] [CrossRef]
- Zhang, D.; Zhang, P.; Yang, P.; He, Y.; Wang, X.; Yang, Y.; Zhu, H.; Xu, N.; Liang, S. Downregulation of ATP1A1 promotes cancer development in renal cell carcinoma. Clin. Proteom. 2017, 14, 15. [Google Scholar] [CrossRef]
- Bogdanov, A.; Moiseenko, F.; Dubina, M. Abnormal expression of ATP1A1 and ATP1A2 in breast cancer. F1000Res. 2017, 6, 10. [Google Scholar] [CrossRef]
- Cialfi, S.; Le Pera, L.; De Blasio, C.; Mariano, G.; Palermo, R.; Zonfrilli, A.; Uccelletti, D.; Palleschi, C.; Biolcati, G.; Barbieri, L.; et al. The loss of ATP2C1 impairs the DNA damage response and induces altered skin homeostasis: Consequences for epidermal biology in Hailey-Hailey disease. Sci. Rep. 2016, 6, 31567. [Google Scholar] [CrossRef] [Green Version]
- Okunade, G.W.; Miller, M.L.; Azhar, M.; Andringa, A.; Sanford, L.P.; Doetschman, T.; Prasad, V.; Shull, G.E. Loss of the Atp2c1 secretory pathway Ca(2+)-ATPase (SPCA1) in mice causes Golgi stress, apoptosis, and midgestational death in homozygous embryos and squamous cell tumors in adult heterozygotes. J. Biol. Chem. 2007, 282, 26517–26527. [Google Scholar] [CrossRef] [PubMed]
- Ge, J.; Chen, Q.; Liu, B.; Wang, L.; Zhang, S.; Ji, B. Knockdown of Rab21 inhibits proliferation and induces apoptosis in human glioma cells. Cell. Mol. Biol. Lett. 2017, 22, 30. [Google Scholar] [CrossRef]
- Hooper, S.; Gaggioli, C.; Sahai, E. A chemical biology screen reveals a role for Rab21-mediated control of actomyosin contractility in fibroblast-driven cancer invasion. Br. J. Cancer 2010, 102, 392–402. [Google Scholar] [CrossRef] [PubMed]
- Zhou, Y.; Wu, B.; Li, J.H.; Nan, G.; Jiang, J.L.; Chen, Z.N. Rab22a enhances CD147 recycling and is required for lung cancer cell migration and invasion. Exp. Cell Res. 2017, 357, 9–16. [Google Scholar] [CrossRef]
- Wang, T.; Gilkes, D.M.; Takano, N.; Xiang, L.; Luo, W.; Bishop, C.J.; Chaturvedi, P.; Green, J.J.; Semenza, G.L. Hypoxia-inducible factors and RAB22A mediate formation of microvesicles that stimulate breast cancer invasion and metastasis. Proc. Natl. Acad. Sci. USA 2014, 111, E3234–E3242. [Google Scholar] [CrossRef] [Green Version]
- Zhang, Y.; Zhao, F.J.; Chen, L.L.; Wang, L.Q.; Nephew, K.P.; Wu, Y.L.; Zhang, S. MiR-373 targeting of the Rab22a oncogene suppresses tumor invasion and metastasis in ovarian cancer. Oncotarget 2014, 5, 12291–12303. [Google Scholar] [CrossRef] [PubMed] [Green Version]
- Costello, J.L.; Castro, I.G.; Schrader, T.A.; Islinger, M.; Schrader, M. Peroxisomal ACBD4 interacts with VAPB and promotes ER-peroxisome associations. Cell Cycle 2017, 16, 1039–1045. [Google Scholar] [CrossRef] [PubMed]
- Chavez-Blanco, A.; Perez-Plasencia, C.; Perez-Cardenas, E.; Carrasco-Legleu, C.; Rangel-Lopez, E.; Segura-Pacheco, B.; Taja-Chayeb, L.; Trejo-Becerril, C.; Gonzalez-Fierro, A.; Candelaria, M.; et al. Antineoplastic effects of the DNA methylation inhibitor hydralazine and the histone deacetylase inhibitor valproic acid in cancer cell lines. Cancer Cell Int. 2006, 6, 2. [Google Scholar] [CrossRef]
- Hua, R.; Cheng, D.; Coyaud, E.; Freeman, S.; Di Pietro, E.; Wang, Y.; Vissa, A.; Yip, C.M.; Fairn, G.D.; Braverman, N.; et al. VAPs and ACBD5 tether peroxisomes to the ER for peroxisome maintenance and lipid homeostasis. J. Cell Biol. 2017, 216, 367–377. [Google Scholar] [CrossRef]
- Shen, K.; Rice, S.D.; Gingrich, D.A.; Wang, D.; Mi, Z.; Tian, C.; Ding, Z.; Brower, S.L.; Ervin, P.R., Jr.; Gabrin, M.J.; et al. Distinct genes related to drug response identified in ER positive and ER negative breast cancer cell lines. PLoS ONE 2012, 7, e40900. [Google Scholar] [CrossRef]
- Venturini, I.; Zeneroli, M.L.; Corsi, L.; Avallone, R.; Farina, F.; Alho, H.; Baraldi, C.; Ferrarese, C.; Pecora, N.; Frigo, M.; et al. Up-regulation of peripheral benzodiazepine receptor system in hepatocellular carcinoma. Life Sci. 1998, 63, 1269–1280. [Google Scholar] [CrossRef]
- Harris, F.T.; Rahman, S.M.; Hassanein, M.; Qian, J.; Hoeksema, M.D.; Chen, H.; Eisenberg, R.; Chaurand, P.; Caprioli, R.M.; Shiota, M.; et al. Acyl-coenzyme A-binding protein regulates β-oxidation required for growth and survival of non-small cell lung cancer. Cancer Prev. Res. (Phila.) 2014, 7, 748–757. [Google Scholar] [CrossRef] [PubMed]
- Yang, H.; Chen, J.; Yang, J.; Qiao, S.; Zhao, S.; Yu, L. Cyclophilin A is upregulated in small cell lung cancer and activates ERK1/2 signal. Biochem. Biophys. Res. Commun. 2007, 361, 763–767. [Google Scholar] [CrossRef] [PubMed]
- Qi, Y.J.; He, Q.Y.; Ma, Y.F.; Du, Y.W.; Liu, G.C.; Li, Y.J.; Tsao, G.S.; Ngai, S.M.; Chiu, J.F. Proteomic identification of malignant transformation-related proteins in esophageal squamous cell carcinoma. J. Cell. Biochem. 2008, 104, 1625–1635. [Google Scholar] [CrossRef] [PubMed]
- Li, M.; Zhai, Q.; Bharadwaj, U.; Wang, H.; Li, F.; Fisher, W.E.; Chen, C.; Yao, Q. Cyclophilin A is overexpressed in human pancreatic cancer cells and stimulates cell proliferation through CD147. Cancer 2006, 106, 2284–2294. [Google Scholar] [CrossRef]
- Yamashita, Y.; Nishiumi, S.; Kono, S.; Takao, S.; Azuma, T.; Yoshida, M. Differences in elongation of very long chain fatty acids and fatty acid metabolism between triple-negative and hormone receptor-positive breast cancer. BMC Cancer 2017, 17, 589. [Google Scholar] [CrossRef] [PubMed]
- Mika, A.; Kobiela, J.; Czumaj, A.; Chmielewski, M.; Stepnowski, P.; Sledzinski, T. Hyper-Elongation in Colorectal Cancer Tissue—Cerotic Acid is a Potential Novel Serum Metabolic Marker of Colorectal Malignancies. Cell. Physiol. Biochem. 2017, 41, 722–730. [Google Scholar] [CrossRef]
- Zekri, A.R.; Hassan, Z.K.; Bahnassy, A.A.; Sherif, G.M.; ELdahshan, D.; Abouelhoda, M.; Ali, A.; Hafez, M.M. Molecular prognostic profile of Egyptian HCC cases infected with hepatitis C virus. Asian Pac. J. Cancer Prev. 2012, 13, 5433–5438. [Google Scholar] [CrossRef]
- Su, Y.C.; Feng, Y.H.; Wu, H.T.; Huang, Y.S.; Tung, C.L.; Wu, P.; Chang, C.J.; Shiau, A.L.; Wu, C.L. Elovl6 is a negative clinical predictor for liver cancer and knockdown of Elovl6 reduces murine liver cancer progression. Sci. Rep. 2018, 8, 6586. [Google Scholar] [CrossRef]
- Feng, Y.H.; Chen, W.Y.; Kuo, Y.H.; Tung, C.L.; Tsao, C.J.; Shiau, A.L.; Wu, C.L. Elovl6 is a poor prognostic predictor in breast cancer. Oncol. Lett. 2016, 12, 207–212. [Google Scholar] [CrossRef] [Green Version]
- Liang, H.F.; Zhang, X.Z.; Liu, B.G.; Jia, G.T.; Li, W.L. Circular RNA circ-ABCB10 promotes breast cancer proliferation and progression through sponging miR-1271. Am. J. Cancer Res. 2017, 7, 1566–1576. [Google Scholar] [PubMed]
- Gagou, M.E.; Ganesh, A.; Phear, G.; Robinson, D.; Petermann, E.; Cox, A.; Meuth, M. Human PIF1 helicase supports DNA replication and cell growth under oncogenic-stress. Oncotarget 2014, 5, 11381–11398. [Google Scholar] [CrossRef] [PubMed]
- Lim, K.H.; Kim, K.H.; Choi, S.I.; Park, E.S.; Park, S.H.; Ryu, K.; Park, Y.K.; Kwon, S.Y.; Yang, S.I.; Lee, H.C.; et al. RPS3a over-expressed in HBV-associated hepatocellular carcinoma enhances the HBx-induced NF-kappaB signaling via its novel chaperoning function. PLoS ONE 2011, 6, e22258. [Google Scholar] [CrossRef] [PubMed]
- Slizhikova, D.K.; Vinogradova, T.V.; Sverdlov, E.D. The NOLA2 and RPS3A genes as highly informative markers for human squamous cell lung cancer. Bioorg. Khim. 2005, 31, 195–199. [Google Scholar]
- Yang, C.; Zheng, J.; Xue, Y.; Yu, H.; Liu, X.; Ma, J.; Liu, L.; Wang, P.; Li, Z.; Cai, H.; et al. The Effect of MCM3AP-AS1/miR-211/KLF5/AGGF1 Axis Regulating Glioblastoma Angiogenesis. Front. Mol. Neurosci. 2017, 10, 437. [Google Scholar] [CrossRef] [PubMed]
- Tang, X.; Xu, Y.; Lu, L.; Jiao, Y.; Liu, J.; Wang, L.; Zhao, H. Identification of key candidate genes and small molecule drugs in cervical cancer by bioinformatics strategy. Cancer Manag. Res. 2018, 10, 3533–3549. [Google Scholar] [CrossRef]
- Han, M.E.; Kim, J.Y.; Kim, G.H.; Park, S.Y.; Kim, Y.H.; Oh, S.O. SAC3D1: A novel prognostic marker in hepatocellular carcinoma. Sci. Rep. 2018, 8, 15608. [Google Scholar] [CrossRef]
- Zhang, M.; Zhang, C.; Du, W.; Yang, X.; Chen, Z. ATAD2 is overexpressed in gastric cancer and serves as an independent poor prognostic biomarker. Clin. Transl. Oncol. 2016, 18, 776–781. [Google Scholar] [CrossRef]
- Kalashnikova, E.V.; Revenko, A.S.; Gemo, A.T.; Andrews, N.P.; Tepper, C.G.; Zou, J.X.; Cardiff, R.D.; Borowsky, A.D.; Chen, H.W. ANCCA/ATAD2 overexpression identifies breast cancer patients with poor prognosis, acting to drive proliferation and survival of triple-negative cells through control of B-Myb and EZH2. Cancer Res. 2010, 70, 9402–9412. [Google Scholar] [CrossRef]
- Zhang, Y.; Sun, Y.; Li, Y.; Fang, Z.; Wang, R.; Pan, Y.; Hu, H.; Luo, X.; Ye, T.; Li, H.; et al. ANCCA protein expression is a novel independent poor prognostic marker in surgically resected lung adenocarcinoma. Ann. Surg. Oncol. 2013, 20, S577–S582. [Google Scholar] [CrossRef]
- Luo, Y.; Ye, G.Y.; Qin, S.L.; Yu, M.H.; Mu, Y.F.; Zhong, M. ATAD2 Overexpression Identifies Colorectal Cancer Patients with Poor Prognosis and Drives Proliferation of Cancer Cells. Gastroenterol. Res. Pract. 2015, 2015, 936564. [Google Scholar] [CrossRef] [PubMed]
- Hou, M.; Huang, R.; Song, Y.; Feng, D.; Jiang, Y.; Liu, M. ATAD2 overexpression is associated with progression and prognosis in colorectal cancer. Jpn. J. Clin. Oncol. 2016, 46, 222–227. [Google Scholar] [CrossRef] [PubMed] [Green Version]
- Zheng, L.; Li, T.; Zhang, Y.; Guo, Y.; Yao, J.; Dou, L.; Guo, K. Oncogene ATAD2 promotes cell proliferation, invasion and migration in cervical cancer. Oncol. Rep. 2015, 33, 2337–2344. [Google Scholar] [CrossRef]
- Hwang, H.W.; Ha, S.Y.; Bang, H.; Park, C.K. ATAD2 as a Poor Prognostic Marker for Hepatocellular Carcinoma after Curative Resection. Cancer Res. Treat. 2015, 47, 853–861. [Google Scholar] [CrossRef] [PubMed]
- Usui, T.; Ohta, T.; Oshiumi, H.; Tomizawa, J.; Ogawa, H.; Ogawa, T. Complex formation and functional versatility of Mre11 of budding yeast in recombination. Cell 1998, 95, 705–716. [Google Scholar] [CrossRef]
- Ewald, B.; Sampath, D.; Plunkett, W. ATM and the Mre11-Rad50-Nbs1 complex respond to nucleoside analogue-induced stalled replication forks and contribute to drug resistance. Cancer Res. 2008, 68, 7947–7955. [Google Scholar] [CrossRef] [PubMed]
- Karnitz, L.M.; Flatten, K.S.; Wagner, J.M.; Loegering, D.; Hackbarth, J.S.; Arlander, S.J.; Vroman, B.T.; Thomas, M.B.; Baek, Y.U.; Hopkins, K.M.; et al. Gemcitabine-induced activation of checkpoint signaling pathways that affect tumor cell survival. Mol. Pharmacol. 2005, 68, 1636–1644. [Google Scholar] [CrossRef]
- Okazaki, T.; Jiao, L.; Chang, P.; Evans, D.B.; Abbruzzese, J.L.; Li, D. Single-nucleotide polymorphisms of DNA damage response genes are associated with overall survival in patients with pancreatic cancer. Clin. Cancer Res. 2008, 14, 2042–2048. [Google Scholar] [CrossRef]
- Irlbacher, H.; Franke, J.; Manke, T.; Vingron, M.; Ehrenhofer-Murray, A.E. Control of replication initiation and heterochromatin formation in Saccharomyces cerevisiae by a regulator of meiotic gene expression. Genes Dev. 2005, 19, 1811–1822. [Google Scholar] [CrossRef] [Green Version]
- Weber, J.M.; Irlbacher, H.; Ehrenhofer-Murray, A.E. Control of replication initiation by the Sum1/Rfm1/Hst1 histone deacetylase. BMC Mol. Biol. 2008, 9, 100. [Google Scholar] [CrossRef]
- Knott, S.R.; Peace, J.M.; Ostrow, A.Z.; Gan, Y.; Rex, A.E.; Viggiani, C.J.; Tavare, S.; Aparicio, O.M. Forkhead transcription factors establish origin timing and long-range clustering in S. cerevisiae. Cell 2012, 148, 99–111. [Google Scholar] [CrossRef] [PubMed]
- Wang, J.; Cai, X.; Xia, L.; Zhou, J.; Xin, J.; Liu, M.; Shang, X.; Liu, J.; Li, X.; Chen, Z.; et al. Decreased expression of FOXJ1 is a potential prognostic predictor for progression and poor survival of gastric cancer. Ann. Surg. Oncol. 2015, 22, 685–692. [Google Scholar] [CrossRef] [PubMed]
- Li, J.V.; Chien, C.D.; Garee, J.P.; Xu, J.; Wellstein, A.; Riegel, A.T. Transcriptional repression of AIB1 by FoxG1 leads to apoptosis in breast cancer cells. Mol. Endocrinol. 2013, 27, 1113–1127. [Google Scholar] [CrossRef] [PubMed]
- Jin, J.; Zhou, S.; Li, C.; Xu, R.; Zu, L.; You, J.; Zhang, B. MiR-517a-3p accelerates lung cancer cell proliferation and invasion through inhibiting FOXJ3 expression. Life Sci. 2014, 108, 48–53. [Google Scholar] [CrossRef] [PubMed]
- Ma, W.; Yu, Q.; Jiang, J.; Du, X.; Huang, L.; Zhao, L.; Zhou, Q.I. miR-517a is an independent prognostic marker and contributes to cell migration and invasion in human colorectal cancer. Oncol. Lett. 2016, 11, 2583–2589. [Google Scholar] [CrossRef]
- Liu, Y.; Zhang, L.; Meng, Y.; Huang, L. Benzyl isothiocyanate inhibits breast cancer cell tumorigenesis via repression of the FoxH1-Mediated Wnt/β-catenin pathway. Int. J. Clin. Exp. Med. 2015, 8, 17601–17611. [Google Scholar] [PubMed]
- Jin, Y.; Cao, Q.; Chen, C.; Du, X.; Jin, B.; Pan, J. Tenovin-6-mediated inhibition of SIRT1/2 induces apoptosis in acute lymphoblastic leukemia (ALL) cells and eliminates ALL stem/progenitor cells. BMC Cancer 2015, 15, 226. [Google Scholar] [CrossRef]
- Gong, D.J.; Zhang, J.M.; Yu, M.; Zhuang, B.; Guo, Q.Q. Inhibition of SIRT1 combined with gemcitabine therapy for pancreatic carcinoma. Clin. Interv. Aging 2013, 8, 889–897. [Google Scholar] [CrossRef] [Green Version]
- Balderhaar, H.J.; Ungermann, C. CORVET and HOPS tethering complexes—Coordinators of endosome and lysosome fusion. J. Cell Sci. 2013, 126, 1307–1316. [Google Scholar] [CrossRef]
- Solinger, J.A.; Spang, A. Tethering complexes in the endocytic pathway: CORVET and HOPS. FEBS J. 2013, 280, 2743–2757. [Google Scholar] [CrossRef]
- Laidlaw, K.M.E.; MacDonald, C. Endosomal trafficking of yeast membrane proteins. Biochem. Soc. Trans. 2018, 46, 1551–1558. [Google Scholar] [CrossRef] [PubMed]
- Henne, W.M.; Buchkovich, N.J.; Emr, S.D. The ESCRT pathway. Dev. Cell 2011, 21, 77–91. [Google Scholar] [CrossRef] [PubMed]
- Cohen, M.; Stutz, F.; Belgareh, N.; Haguenauer-Tsapis, R.; Dargemont, C. Ubp3 requires a cofactor, Bre5, to specifically de-ubiquitinate the COPII protein, Sec23. Nat. Cell Biol. 2003, 5, 661–667. [Google Scholar] [CrossRef] [PubMed]
- Schuldiner, M.; Collins, S.R.; Thompson, N.J.; Denic, V.; Bhamidipati, A.; Punna, T.; Ihmels, J.; Andrews, B.; Boone, C.; Greenblatt, J.F.; et al. Exploration of the function and organization of the yeast early secretory pathway through an epistatic miniarray profile. Cell 2005, 123, 507–519. [Google Scholar] [CrossRef] [PubMed]
- Schuldiner, M.; Metz, J.; Schmid, V.; Denic, V.; Rakwalska, M.; Schmitt, H.D.; Schwappach, B.; Weissman, J.S. The GET complex mediates insertion of tail-anchored proteins into the ER membrane. Cell 2008, 134, 634–645. [Google Scholar] [CrossRef]
- Beilharz, T.; Egan, B.; Silver, P.A.; Hofmann, K.; Lithgow, T. Bipartite signals mediate subcellular targeting of tail-anchored membrane proteins in Saccharomyces cerevisiae. J. Biol. Chem. 2003, 278, 8219–8223. [Google Scholar] [CrossRef]
- Ibarrola-Villava, M.; Kumar, R.; Nagore, E.; Benfodda, M.; Guedj, M.; Gazal, S.; Hu, H.H.; Guan, J.; Rachkonda, P.S.; Descamps, V.; et al. Genes involved in the WNT and vesicular trafficking pathways are associated with melanoma predisposition. Int. J. Cancer 2015, 136, 2109–2119. [Google Scholar] [CrossRef]
- Dutta, S.; Roy, S.; Polavaram, N.S.; Baretton, G.B.; Muders, M.H.; Batra, S.; Datta, K. NRP2 transcriptionally regulates its downstream effector WDFY1. Sci. Rep. 2016, 6, 23588. [Google Scholar] [CrossRef] [Green Version]
- Dutta, S.; Roy, S.; Polavaram, N.S.; Stanton, M.J.; Zhang, H.; Bhola, T.; Honscheid, P.; Donohue, T.M., Jr.; Band, H.; Batra, S.K.; et al. Neuropilin-2 Regulates Endosome Maturation and EGFR Trafficking to Support Cancer Cell Pathobiology. Cancer Res. 2016, 76, 418–428. [Google Scholar] [CrossRef]
- Girirajan, S.; Hauck, P.M.; Williams, S.; Vlangos, C.N.; Szomju, B.B.; Solaymani-Kohal, S.; Mosier, P.D.; White, K.L., Jr.; McCoy, K.; Elsea, S.H. Tom1l2 hypomorphic mice exhibit increased incidence of infections and tumors and abnormal immunologic response. Mamm. Genome 2008, 19, 246–262. [Google Scholar] [CrossRef]
- Lachmann, J.; Glaubke, E.; Moore, P.S.; Ungermann, C. The Vps39-like TRAP1 is an effector of Rab5 and likely the missing Vps3 subunit of human CORVET. Cell. Logist. 2014, 4, e970840. [Google Scholar] [CrossRef] [PubMed]
- Chabes, A.; Georgieva, B.; Domkin, V.; Zhao, X.; Rothstein, R.; Thelander, L. Survival of DNA damage in yeast directly depends on increased dNTP levels allowed by relaxed feedback inhibition of ribonucleotide reductase. Cell 2003, 112, 391–401. [Google Scholar] [CrossRef]
- Wu, Y.; Li, X.; Yu, J.; Bjorkholm, M.; Xu, D. ASF1a inhibition induces p53-dependent growth arrest and senescence of cancer cells. Cell Death Dis. 2019, 10, 76. [Google Scholar] [CrossRef] [PubMed]
- Tkach, J.M.; Yimit, A.; Lee, A.Y.; Riffle, M.; Costanzo, M.; Jaschob, D.; Hendry, J.A.; Ou, J.; Moffat, J.; Boone, C.; et al. Dissecting DNA damage response pathways by analysing protein localization and abundance changes during DNA replication stress. Nat. Cell Biol. 2012, 14, 966–976. [Google Scholar] [CrossRef] [PubMed] [Green Version]
- Chong, P.S.; Zhou, J.; Cheong, L.L.; Liu, S.C.; Qian, J.; Guo, T.; Sze, S.K.; Zeng, Q.; Chng, W.J. LEO1 is regulated by PRL-3 and mediates its oncogenic properties in acute myelogenous leukemia. Cancer Res. 2014, 74, 3043–3053. [Google Scholar] [CrossRef] [PubMed]
- Yang, B.; Miao, S.; Zhang, L.N.; Sun, H.B.; Xu, Z.N.; Han, C.S. Correlation of CCNA1 promoter methylation with malignant tumors: A meta-analysis introduction. BioMed Res. Int. 2015, 2015, 134027. [Google Scholar] [CrossRef] [PubMed]
- Hendrick, E.; Peixoto, P.; Blomme, A.; Polese, C.; Matheus, N.; Cimino, J.; Frere, A.; Mouithys-Mickalad, A.; Serteyn, D.; Bettendorff, L.; et al. Metabolic inhibitors accentuate the anti-tumoral effect of HDAC5 inhibition. Oncogene 2017, 36, 4859–4874. [Google Scholar] [CrossRef] [PubMed] [Green Version]
- Wang, X.X.; Wan, R.Z.; Liu, Z.P. Recent advances in the discovery of potent and selective HDAC6 inhibitors. Eur. J. Med. Chem. 2018, 143, 1406–1418. [Google Scholar] [CrossRef]
- Xu, X.; Xie, C.; Edwards, H.; Zhou, H.; Buck, S.A.; Ge, Y. Inhibition of histone deacetylases 1 and 6 enhances cytarabine-induced apoptosis in pediatric acute myeloid leukemia cells. PLoS ONE 2011, 6, e17138. [Google Scholar] [CrossRef] [PubMed]
- Iwahashi, S.; Shimada, M.; Utsunomiya, T.; Morine, Y.; Imura, S.; Ikemoto, T.; Mori, H.; Hanaoka, J.; Sugimoto, K.; Saito, Y. Histone deacetylase inhibitor augments anti-tumor effect of gemcitabine and pegylated interferon-α on pancreatic cancer cells. Int. J. Clin. Oncol. 2011, 16, 671–678. [Google Scholar] [CrossRef]
- Arnold, N.B.; Arkus, N.; Gunn, J.; Korc, M. The histone deacetylase inhibitor suberoylanilide hydroxamic acid induces growth inhibition and enhances gemcitabine-induced cell death in pancreatic cancer. Clin. Cancer Res. 2007, 13, 18–26. [Google Scholar] [CrossRef]
- Cai, M.H.; Xu, X.G.; Yan, S.L.; Sun, Z.; Ying, Y.; Wang, B.K.; Tu, Y.X. Depletion of HDAC1, 7 and 8 by Histone Deacetylase Inhibition Confers Elimination of Pancreatic Cancer Stem Cells in Combination with Gemcitabine. Sci. Rep. 2018, 8, 1621. [Google Scholar] [CrossRef] [Green Version]
- Sung, V.; Richard, N.; Brady, H.; Maier, A.; Kelter, G.; Heise, C. Histone deacetylase inhibitor MGCD0103 synergizes with gemcitabine in human pancreatic cells. Cancer Sci. 2011, 102, 1201–1207. [Google Scholar] [CrossRef] [PubMed]
- Ji, M.; Li, Z.; Lin, Z.; Chen, L. Antitumor activity of the novel HDAC inhibitor CUDC-101 combined with gemcitabine in pancreatic cancer. Am. J. Cancer Res. 2018, 8, 2402–2418. [Google Scholar] [PubMed]
- Song, T.; Yang, L.; Kabra, N.; Chen, L.; Koomen, J.; Haura, E.B.; Chen, J. The NAD+ synthesis enzyme nicotinamide mononucleotide adenylyltransferase (NMNAT1) regulates ribosomal RNA transcription. J. Biol. Chem. 2013, 288, 20908–20917. [Google Scholar] [CrossRef]
- Li, H.; Feng, Z.; Wu, W.; Li, J.; Zhang, J.; Xia, T. SIRT3 regulates cell proliferation and apoptosis related to energy metabolism in non-small cell lung cancer cells through deacetylation of NMNAT2. Int. J. Oncol. 2013, 43, 1420–1430. [Google Scholar] [CrossRef] [Green Version]
- Kim, M.M.; Camelo-Piragua, S.; Schipper, M.; Tao, Y.; Normolle, D.; Junck, L.; Mammoser, A.; Betz, B.L.; Cao, Y.; Kim, C.J.; et al. Gemcitabine Plus Radiation Therapy for High-Grade Glioma: Long-Term Results of a Phase 1 Dose-Escalation Study. Int. J. Radiat. Oncol. Biol. Phys. 2016, 94, 305–311. [Google Scholar] [CrossRef] [PubMed]
- Rao, M.; Song, W.; Jiang, A.; Shyr, Y.; Lev, S.; Greenstein, D.; Brantley-Sieders, D.; Chen, J. VAMP-associated protein B (VAPB) promotes breast tumor growth by modulation of Akt activity. PLoS ONE 2012, 7, e46281. [Google Scholar] [CrossRef] [PubMed]
- Yang, M.C.; Wang, H.C.; Hou, Y.C.; Tung, H.L.; Chiu, T.J.; Shan, Y.S. Blockade of autophagy reduces pancreatic cancer stem cell activity and potentiates the tumoricidal effect of gemcitabine. Mol. Cancer 2015, 14, 179. [Google Scholar] [CrossRef]
- Takahashi, Y.; He, H.; Tang, Z.; Hattori, T.; Liu, Y.; Young, M.M.; Serfass, J.M.; Chen, L.; Gebru, M.; Chen, C.; et al. An autophagy assay reveals the ESCRT-III component CHMP2A as a regulator of phagophore closure. Nat. Commun. 2018, 9, 2855. [Google Scholar] [CrossRef]
- D’Arcangelo, D.; Giampietri, C.; Muscio, M.; Scatozza, F.; Facchiano, F.; Facchiano, A. WIPI1, BAG1, and PEX3 Autophagy-Related Genes Are Relevant Melanoma Markers. Oxid. Med. Cell. Longev. 2018, 2018, 1471682. [Google Scholar] [CrossRef] [PubMed]
- Filimonenko, M.; Stuffers, S.; Raiborg, C.; Yamamoto, A.; Malerod, L.; Fisher, E.M.; Isaacs, A.; Brech, A.; Stenmark, H.; Simonsen, A. Functional multivesicular bodies are required for autophagic clearance of protein aggregates associated with neurodegenerative disease. J. Cell Biol. 2007, 179, 485–500. [Google Scholar] [CrossRef] [PubMed]
- Luo, M.L.; Gong, C.; Chen, C.H.; Hu, H.; Huang, P.; Zheng, M.; Yao, Y.; Wei, S.; Wulf, G.; Lieberman, J.; et al. The Rab2A GTPase promotes breast cancer stem cells and tumorigenesis via Erk signaling activation. Cell Rep. 2015, 11, 111–124. [Google Scholar] [CrossRef] [PubMed]
- Jin, J.; Wu, Y.; Zhou, D.; Sun, Q.; Wang, W. miR448 targets Rab2B and is pivotal in the suppression of pancreatic cancer. Oncol. Rep. 2018, 40, 1379–1389. [Google Scholar] [CrossRef] [PubMed]
- Zhang, Y.; Huang, S.; Li, P.; Chen, Q.; Li, Y.; Zhou, Y.; Wang, L.; Kang, M.; Zhang, B.; Yang, B.; et al. Pancreatic cancer-derived exosomes suppress the production of GIP and GLP-1 from STC-1cells in vitro by down-regulating the PCSK1/3. Cancer Lett. 2018, 431, 190–200. [Google Scholar] [CrossRef] [PubMed]
- Demidyuk, I.V.; Shubin, A.V.; Gasanov, E.V.; Kurinov, A.M.; Demkin, V.V.; Vinogradova, T.V.; Zinovyeva, M.V.; Sass, A.V.; Zborovskaya, I.B.; Kostrov, S.V. Alterations in gene expression of proprotein convertases in human lung cancer have a limited number of scenarios. PLoS ONE 2013, 8, e55752. [Google Scholar] [CrossRef] [PubMed]
- Bajikar, S.S.; Wang, C.C.; Borten, M.A.; Pereira, E.J.; Atkins, K.A.; Janes, K.A. Tumor-Suppressor Inactivation of GDF11 Occurs by Precursor Sequestration in Triple-Negative Breast Cancer. Dev. Cell 2017, 43, 418–435. [Google Scholar] [CrossRef] [PubMed]
- Akada, M.; Crnogorac-Jurcevic, T.; Lattimore, S.; Mahon, P.; Lopes, R.; Sunamura, M.; Matsuno, S.; Lemoine, N.R. Intrinsic chemoresistance to gemcitabine is associated with decreased expression of BNIP3 in pancreatic cancer. Clin. Cancer Res. 2005, 11, 3094–3101. [Google Scholar] [CrossRef]
- Kanki, T.; Wang, K.; Baba, M.; Bartholomew, C.R.; Lynch-Day, M.A.; Du, Z.; Geng, J.; Mao, K.; Yang, Z.; Yen, W.L.; et al. A genomic screen for yeast mutants defective in selective mitochondria autophagy. Mol. Biol. Cell 2009, 20, 4730–4738. [Google Scholar] [CrossRef]
- Johnson, I.R.; Parkinson-Lawrence, E.J.; Keegan, H.; Spillane, C.D.; Barry-O’Crowley, J.; Watson, W.R.; Selemidis, S.; Butler, L.M.; O’Leary, J.J.; Brooks, D.A. Endosomal gene expression: A new indicator for prostate cancer patient prognosis? Oncotarget 2015, 6, 37919–37929. [Google Scholar] [CrossRef] [PubMed]
- Li, F.; Hu, G.; Jiang, Z.; Guo, J.; Wang, K.; Ouyang, K.; Wen, D.; Zhu, M.; Liang, J.; Qin, X.; et al. Identification of NME5 as a contributor to innate resistance to gemcitabine in pancreatic cancer cells. FEBS J. 2012, 279, 1261–1273. [Google Scholar] [CrossRef] [PubMed]
- Matsumoto, A.; Arcaroli, J.; Chen, Y.; Gasparetto, M.; Neumeister, V.; Thompson, D.C.; Singh, S.; Smith, C.; Messersmith, W.; Vasiliou, V. Aldehyde dehydrogenase 1B1: A novel immunohistological marker for colorectal cancer. Br. J. Cancer 2017, 117, 1537–1543. [Google Scholar] [CrossRef] [PubMed]
- Singh, S.; Arcaroli, J.J.; Orlicky, D.J.; Chen, Y.; Messersmith, W.A.; Bagby, S.; Purkey, A.; Quackenbush, K.S.; Thompson, D.C.; Vasiliou, V. Aldehyde Dehydrogenase 1B1 as a Modulator of Pancreatic Adenocarcinoma. Pancreas 2016, 45, 117–122. [Google Scholar] [CrossRef] [Green Version]
- Xu, X.; Chai, S.; Wang, P.; Zhang, C.; Yang, Y.; Yang, Y.; Wang, K. Aldehyde dehydrogenases and cancer stem cells. Cancer Lett. 2015, 369, 50–57. [Google Scholar] [CrossRef] [PubMed]
- Bae, J.S.; Park, S.H.; Jamiyandorj, U.; Kim, K.M.; Noh, S.J.; Kim, J.R.; Park, H.J.; Kwon, K.S.; Jung, S.H.; Park, H.S.; et al. CK2alpha/CSNK2A1 Phosphorylates SIRT6 and Is Involved in the Progression of Breast Carcinoma and Predicts Shorter Survival of Diagnosed Patients. Am. J. Pathol. 2016, 186, 3297–3315. [Google Scholar] [CrossRef]
- Xie, Z.C.; Tang, R.X.; Gao, X.; Xie, Q.N.; Lin, J.Y.; Chen, G.; Li, Z.Y. A meta-analysis and bioinformatics exploration of the diagnostic value and molecular mechanism of miR-193a-5p in lung cancer. Oncol. Lett. 2018, 16, 4114–4128. [Google Scholar] [CrossRef] [PubMed]
- Laramas, M.; Pasquier, D.; Filhol, O.; Ringeisen, F.; Descotes, J.L.; Cochet, C. Nuclear localization of protein kinase CK2 catalytic subunit (CK2alpha) is associated with poor prognostic factors in human prostate cancer. Eur. J. Cancer 2007, 43, 928–934. [Google Scholar] [CrossRef]
- Zou, J.; Luo, H.; Zeng, Q.; Dong, Z.; Wu, D.; Liu, L. Protein kinase CK2alpha is overexpressed in colorectal cancer and modulates cell proliferation and invasion via regulating EMT-related genes. J. Transl. Med. 2011, 9, 97. [Google Scholar] [CrossRef]
- Bae, J.S.; Park, S.H.; Kim, K.M.; Kwon, K.S.; Kim, C.Y.; Lee, H.K.; Park, B.H.; Park, H.S.; Lee, H.; Moon, W.S.; et al. CK2alpha phosphorylates DBC1 and is involved in the progression of gastric carcinoma and predicts poor survival of gastric carcinoma patients. Int. J. Cancer 2015, 136, 797–809. [Google Scholar] [CrossRef]
- Trembley, J.H.; Wang, G.; Unger, G.; Slaton, J.; Ahmed, K. Protein kinase CK2 in health and disease: CK2: A key player in cancer biology. Cell. Mol. Life Sci. 2009, 66, 1858–1867. [Google Scholar] [CrossRef]
- Wang, F.; Chang, J.T.; Kao, C.J.; Huang, R.S. High Expression of miR-532-5p, a Tumor Suppressor, Leads to Better Prognosis in Ovarian Cancer Both In Vivo and In Vitro. Mol. Cancer Ther. 2016, 15, 1123–1131. [Google Scholar] [CrossRef] [PubMed]
- Hanif, I.M.; Hanif, I.M.; Shazib, M.A.; Ahmad, K.A.; Pervaiz, S. Casein Kinase II: An attractive target for anticancer drug design. Int. J. Biochem. Cell Biol. 2010, 42, 1602–1605. [Google Scholar] [CrossRef] [PubMed]
- Gan, Y.; Li, Y.; Li, T.; Shu, G.; Yin, G. CCNA2 acts as a novel biomarker in regulating the growth and apoptosis of colorectal cancer. Cancer Manag. Res. 2018, 10, 5113–5124. [Google Scholar] [CrossRef] [PubMed]
- Gao, T.; Han, Y.; Yu, L.; Ao, S.; Li, Z.; Ji, J. CCNA2 is a prognostic biomarker for ER+ breast cancer and tamoxifen resistance. PLoS ONE 2014, 9, e91771. [Google Scholar] [CrossRef] [PubMed]
- Ding, K.; Li, W.; Zou, Z.; Zou, X.; Wang, C. CCNB1 is a prognostic biomarker for ER+ breast cancer. Med. Hypotheses 2014, 83, 359–364. [Google Scholar] [CrossRef] [PubMed]
- Fang, Y.; Yu, H.; Liang, X.; Xu, J.; Cai, X. Chk1-induced CCNB1 overexpression promotes cell proliferation and tumor growth in human colorectal cancer. Cancer Biol. Ther. 2014, 15, 1268–1279. [Google Scholar] [CrossRef] [PubMed] [Green Version]
- Oji, Y.; Tatsumi, N.; Fukuda, M.; Nakatsuka, S.; Aoyagi, S.; Hirata, E.; Nanchi, I.; Fujiki, F.; Nakajima, H.; Yamamoto, Y.; et al. The translation elongation factor eEF2 is a novel tumorassociated antigen overexpressed in various types of cancers. Int. J. Oncol. 2014, 44, 1461–1469. [Google Scholar] [CrossRef]
- Sato, N.; Maeda, M.; Sugiyama, M.; Ito, S.; Hyodo, T.; Masuda, A.; Tsunoda, N.; Kokuryo, T.; Hamaguchi, M.; Nagino, M.; et al. Inhibition of SNW1 association with spliceosomal proteins promotes apoptosis in breast cancer cells. Cancer Med. 2015, 4, 268–277. [Google Scholar] [CrossRef] [PubMed]
- Koller-Eichhorn, R.; Marquardt, T.; Gail, R.; Wittinghofer, A.; Kostrewa, D.; Kutay, U.; Kambach, C. Human OLA1 defines an ATPase subfamily in the Obg family of GTP-binding proteins. J. Biol. Chem. 2007, 282, 19928–19937. [Google Scholar] [CrossRef] [PubMed]
- Becker, M.; Gzyl, K.E.; Altamirano, A.M.; Vuong, A.; Urban, K.; Wieden, H.J. The 70S ribosome modulates the ATPase activity of Escherichia coli YchF. RNA Biol. 2012, 9, 1288–1301. [Google Scholar] [CrossRef]
- Bai, L.; Yu, Z.; Zhang, J.; Yuan, S.; Liao, C.; Jeyabal, P.V.; Rubio, V.; Chen, H.; Li, Y.; Shi, Z.Z. OLA1 contributes to epithelial-mesenchymal transition in lung cancer by modulating the GSK3beta/snail/E-cadherin signaling. Oncotarget 2016, 7, 10402–10413. [Google Scholar] [CrossRef] [PubMed]
- Cornelison, R.; Dobbin, Z.C.; Katre, A.A.; Jeong, D.H.; Zhang, Y.; Chen, D.; Petrova, Y.; Llaneza, D.C.; Steg, A.D.; Parsons, L.; et al. Targeting RNA-Polymerase I in Both Chemosensitive and Chemoresistant Populations in Epithelial Ovarian Cancer. Clin. Cancer Res. 2017, 23, 6529–6540. [Google Scholar] [CrossRef] [PubMed] [Green Version]
- Lee, H.C.; Wang, H.; Baladandayuthapani, V.; Lin, H.; He, J.; Jones, R.J.; Kuiatse, I.; Gu, D.; Wang, Z.; Ma, W.; et al. RNA Polymerase I Inhibition with CX-5461 as a Novel Therapeutic Strategy to Target MYC in Multiple Myeloma. Br. J. Haematol. 2017, 177, 80–94. [Google Scholar] [CrossRef] [PubMed]
- Rossetti, S.; Wierzbicki, A.J.; Sacchi, N. Undermining ribosomal RNA transcription in both the nucleolus and mitochondrion: An offbeat approach to target MYC-driven cancer. Oncotarget 2018, 9, 5016–5031. [Google Scholar] [CrossRef] [PubMed]
- Linden, M.; Segersten, U.; Runeson, M.; Wester, K.; Busch, C.; Pettersson, U.; Lind, S.B.; Malmstrom, P.U. Tumour expression of bladder cancer-associated urinary proteins. BJU Int. 2013, 112, 407–415. [Google Scholar] [CrossRef] [PubMed]
- Bullock, N.; Oltean, S. The many faces of SRPK1. J. Pathol. 2017, 241, 437–440. [Google Scholar] [CrossRef] [PubMed] [Green Version]
- Chen, Y.; Meng, D.; Wang, H.; Sun, R.; Wang, D.; Wang, S.; Fan, J.; Zhao, Y.; Wang, J.; Yang, S.; et al. VAMP8 facilitates cellular proliferation and temozolomide resistance in human glioma cells. Neuro Oncol. 2015, 17, 407–418. [Google Scholar] [CrossRef] [PubMed]
- Yuan, M.; Liao, J.; Luo, J.; Cui, M.; Jin, F. Significance of Vesicle-Associated Membrane Protein 8 Expression in Predicting Survival in Breast Cancer. J. Breast Cancer 2018, 21, 399–405. [Google Scholar] [CrossRef] [PubMed]
- Grunnet, M.; Calatayud, D.; Schultz, N.A.; Hasselby, J.P.; Mau-Sorensen, M.; Brunner, N.; Stenvang, J. TOP1 gene copy numbers are increased in cancers of the bile duct and pancreas. Scand. J. Gastroenterol. 2015, 50, 485–494. [Google Scholar] [CrossRef] [PubMed]
- Sun, L.; Xu, X.; Chen, Y.; Zhou, Y.; Tan, R.; Qiu, H.; Jin, L.; Zhang, W.; Fan, R.; Hong, W.; et al. Rab34 regulates adhesion, migration, and invasion of breast cancer cells. Oncogene 2018, 37, 3698–3714. [Google Scholar] [CrossRef] [PubMed]
- Wu, J.; Lu, Y.; Qin, A.; Qiao, Z.; Jiang, X. Overexpression of RAB34 correlates with poor prognosis and tumor progression in hepatocellular carcinoma. Oncol. Rep. 2017, 38, 2967–2974. [Google Scholar] [CrossRef] [PubMed]
- Wang, H.J.; Gao, Y.; Chen, L.; Li, Y.L.; Jiang, C.L. RAB34 was a progression- and prognosis-associated biomarker in gliomas. Tumour Biol. 2015, 36, 1573–1578. [Google Scholar] [CrossRef] [PubMed]
- Artero-Castro, A.; Castellvi, J.; Garcia, A.; Hernandez, J.; Ramon y Cajal, S.; Lleonart, M.E. Expression of the ribosomal proteins Rplp0, Rplp1, and Rplp2 in gynecologic tumors. Hum. Pathol. 2011, 42, 194–203. [Google Scholar] [CrossRef] [PubMed]
- Sendoel, A.; Dunn, J.G.; Rodriguez, E.H.; Naik, S.; Gomez, N.C.; Hurwitz, B.; Levorse, J.; Dill, B.D.; Schramek, D.; Molina, H.; et al. Translation from unconventional 5′ start sites drives tumour initiation. Nature 2017, 541, 494–499. [Google Scholar] [CrossRef] [PubMed]
- Neklesa, T.K.; Davis, R.W. A genome-wide screen for regulators of TORC1 in response to amino acid starvation reveals a conserved Npr2/3 complex. PLoS Genet. 2009, 5, e1000515. [Google Scholar] [CrossRef] [PubMed]
- Wu, X.; Tu, B.P. Selective regulation of autophagy by the Iml1-Npr2-Npr3 complex in the absence of nitrogen starvation. Mol. Biol. Cell 2011, 22, 4124–4133. [Google Scholar] [CrossRef] [PubMed]
- Smardon, A.M.; Tarsio, M.; Kane, P.M. The RAVE complex is essential for stable assembly of the yeast V-ATPase. J. Biol. Chem. 2002, 277, 13831–13839. [Google Scholar] [CrossRef] [PubMed]
- Seol, J.H.; Shevchenko, A.; Shevchenko, A.; Deshaies, R.J. Skp1 forms multiple protein complexes, including RAVE, a regulator of V-ATPase assembly. Nat. Cell Biol. 2001, 3, 384–391. [Google Scholar] [CrossRef] [PubMed]
- Nakamura, N.; Matsuura, A.; Wada, Y.; Ohsumi, Y. Acidification of vacuoles is required for autophagic degradation in the yeast, Saccharomyces cerevisiae. J. Biochem. 1997, 121, 338–344. [Google Scholar] [CrossRef] [PubMed]
- Yang, Z.; Geng, J.; Yen, W.L.; Wang, K.; Klionsky, D.J. Positive or negative roles of different cyclin-dependent kinase Pho85-cyclin complexes orchestrate induction of autophagy in Saccharomyces cerevisiae. Mol. Cell 2010, 38, 250–264. [Google Scholar] [CrossRef] [PubMed]
- Wollert, T.; Wunder, C.; Lippincott-Schwartz, J.; Hurley, J.H. Membrane scission by the ESCRT-III complex. Nature 2009, 458, 172–177. [Google Scholar] [CrossRef] [PubMed]
- Richter, C.M.; West, M.; Odorizzi, G. Doa4 function in ILV budding is restricted through its interaction with the Vps20 subunit of ESCRT-III. J. Cell Sci. 2013, 126, 1881–1890. [Google Scholar] [CrossRef] [PubMed] [Green Version]
- Mukubou, H.; Tsujimura, T.; Sasaki, R.; Ku, Y. The role of autophagy in the treatment of pancreatic cancer with gemcitabine and ionizing radiation. Int. J. Oncol. 2010, 37, 821–828. [Google Scholar] [PubMed] [Green Version]
- Hashimoto, D.; Blauer, M.; Hirota, M.; Ikonen, N.H.; Sand, J.; Laukkarinen, J. Autophagy is needed for the growth of pancreatic adenocarcinoma and has a cytoprotective effect against anticancer drugs. Eur. J. Cancer 2014, 50, 1382–1390. [Google Scholar] [CrossRef] [PubMed]
- Chen, M.; He, M.; Song, Y.; Chen, L.; Xiao, P.; Wan, X.; Dai, F.; Shen, P. The cytoprotective role of gemcitabine-induced autophagy associated with apoptosis inhibition in triple-negative MDA-MB-231 breast cancer cells. Int. J. Mol. Med. 2014, 34, 276–282. [Google Scholar] [CrossRef] [PubMed]
- Beilharz, T.H.; Harrison, P.F.; Miles, D.M.; See, M.M.; Le, U.M.; Kalanon, M.; Curtis, M.J.; Hasan, Q.; Saksouk, J.; Margaritis, T.; et al. Coordination of Cell Cycle Progression and Mitotic Spindle Assembly Involves Histone H3 Lysine 4 Methylation by Set1/COMPASS. Genetics 2017, 205, 185–199. [Google Scholar] [CrossRef] [Green Version]
- Miller, T.; Krogan, N.J.; Dover, J.; Erdjument-Bromage, H.; Tempst, P.; Johnston, M.; Greenblatt, J.F.; Shilatifard, A. COMPASS: A complex of proteins associated with a trithorax-related SET domain protein. Proc. Natl. Acad. Sci. USA 2001, 98, 12902–12907. [Google Scholar] [CrossRef] [PubMed] [Green Version]
- Shilatifard, A. The COMPASS family of histone H3K4 methylases: Mechanisms of regulation in development and disease pathogenesis. Annu. Rev. Biochem. 2012, 81, 65–95. [Google Scholar] [CrossRef] [PubMed]
- Greer, E.L.; Shi, Y. Histone methylation: A dynamic mark in health, disease and inheritance. Nat. Rev. Genet. 2012, 13, 343–357. [Google Scholar] [CrossRef]
- Dehe, P.M.; Dichtl, B.; Schaft, D.; Roguev, A.; Pamblanco, M.; Lebrun, R.; Rodriguez-Gil, A.; Mkandawire, M.; Landsberg, K.; Shevchenko, A.; et al. Protein interactions within the Set1 complex and their roles in the regulation of histone 3 lysine 4 methylation. J. Biol. Chem. 2006, 281, 35404–35412. [Google Scholar] [CrossRef] [PubMed]
- Alvarado, A.G.; Thiagarajan, P.S.; Mulkearns-Hubert, E.E.; Silver, D.J.; Hale, J.S.; Alban, T.J.; Turaga, S.M.; Jarrar, A.; Reizes, O.; Longworth, M.S.; et al. Glioblastoma Cancer Stem Cells Evade Innate Immune Suppression of Self-Renewal through Reduced TLR4 Expression. Cell Stem Cell 2017, 20, 450–461. [Google Scholar] [CrossRef] [PubMed]
- Lu, C.; Yang, D.; Sabbatini, M.E.; Colby, A.H.; Grinstaff, M.W.; Oberlies, N.H.; Pearce, C.; Liu, K. Contrasting roles of H3K4me3 and H3K9me3 in regulation of apoptosis and gemcitabine resistance in human pancreatic cancer cells. BMC Cancer 2018, 18, 149. [Google Scholar] [CrossRef] [PubMed]
- Li, D.; Sun, H.; Sun, W.J.; Bao, H.B.; Si, S.H.; Fan, J.L.; Lin, P.; Cui, R.J.; Pan, Y.J.; Wen, S.M.; et al. Role of RbBP5 and H3K4me3 in the vicinity of Snail transcription start site during epithelial-mesenchymal transition in prostate cancer cell. Oncotarget 2016, 7, 65553–65567. [Google Scholar] [CrossRef] [PubMed] [Green Version]
- Zhou, H.; Bao, J.; Zhu, X.; Dai, G.; Jiang, X.; Jiao, X.; Sheng, H.; Huang, J.; Yu, H. Retinoblastoma Binding Protein 5 Correlates with the Progression in Hepatocellular Carcinoma. BioMed Res. Int. 2018, 2018, 1073432. [Google Scholar] [CrossRef]
- Telles, E.; Seto, E. Modulation of cell cycle regulators by HDACs. Front. Biosci. (Sch. Ed.) 2012, 4, 831–839. [Google Scholar]
- Seto, E.; Yoshida, M. Erasers of histone acetylation: The histone deacetylase enzymes. Cold Spring Harb. Perspect. Biol. 2014, 6, a018713. [Google Scholar] [CrossRef]
- Wu, J.; Carmen, A.A.; Kobayashi, R.; Suka, N.; Grunstein, M. HDA2 and HDA3 are related proteins that interact with and are essential for the activity of the yeast histone deacetylase HDA1. Proc. Natl. Acad. Sci. USA 2001, 98, 4391–4396. [Google Scholar] [CrossRef] [PubMed] [Green Version]
- Alic, N.; Higgins, V.J.; Dawes, I.W. Identification of a Saccharomyces cerevisiae gene that is required for G1 arrest in response to the lipid oxidation product linoleic acid hydroperoxide. Mol. Biol. Cell 2001, 12, 1801–1810. [Google Scholar] [CrossRef]
- Alic, N.; Higgins, V.J.; Pichova, A.; Breitenbach, M.; Dawes, I.W. Lipid hydroperoxides activate the mitogen-activated protein kinase Mpk1p in Saccharomyces cerevisiae. J. Biol. Chem. 2003, 278, 41849–41855. [Google Scholar] [CrossRef]
- Addinall, S.G.; Downey, M.; Yu, M.; Zubko, M.K.; Dewar, J.; Leake, A.; Hallinan, J.; Shaw, O.; James, K.; Wilkinson, D.J.; et al. A genomewide suppressor and enhancer analysis of cdc13-1 reveals varied cellular processes influencing telomere capping in Saccharomyces cerevisiae. Genetics 2008, 180, 2251–2266. [Google Scholar] [CrossRef]
- van der Veen, A.G.; Ploegh, H.L. Ubiquitin-like proteins. Annu. Rev. Biochem. 2012, 81, 323–357. [Google Scholar] [CrossRef] [PubMed]
- Judes, A.; Bruch, A.; Klassen, R.; Helm, M.; Schaffrath, R. Sulfur transfer and activation by ubiquitin-like modifier system Uba4*Urm1 link protein urmylation and tRNA thiolation in yeast. Microb. Cell 2016, 3, 554–564. [Google Scholar] [CrossRef] [PubMed]
- Nakai, Y.; Nakai, M.; Hayashi, H. Thio-modification of yeast cytosolic tRNA requires a ubiquitin-related system that resembles bacterial sulfur transfer systems. J. Biol. Chem. 2008, 283, 27469–27476. [Google Scholar] [CrossRef] [PubMed]
- Noma, A.; Sakaguchi, Y.; Suzuki, T. Mechanistic characterization of the sulfur-relay system for eukaryotic 2-thiouridine biogenesis at tRNA wobble positions. Nucleic Acids Res. 2009, 37, 1335–1352. [Google Scholar] [CrossRef] [PubMed] [Green Version]
- Hawer, H.; Hammermeister, A.; Ravichandran, K.E.; Glatt, S.; Schaffrath, R.; Klassen, R. Roles of Elongator Dependent tRNA Modification Pathways in Neurodegeneration and Cancer. Genes 2018, 10, 19. [Google Scholar] [CrossRef] [PubMed]
- Rapino, F.; Delaunay, S.; Rambow, F.; Zhou, Z.; Tharun, L.; De Tullio, P.; Sin, O.; Shostak, K.; Schmitz, S.; Piepers, J.; et al. Codon-specific translation reprogramming promotes resistance to targeted therapy. Nature 2018, 558, 605–609. [Google Scholar] [CrossRef] [PubMed]
- Plunkett, W.; Huang, P.; Searcy, C.E.; Gandhi, V. Gemcitabine: Preclinical pharmacology and mechanisms of action. Semin Oncol. 1996, 23, 3–15. [Google Scholar] [PubMed]
- Wong, A.; Soo, R.A.; Yong, W.P.; Innocenti, F. Clinical pharmacology and pharmacogenetics of gemcitabine. Drug Metab. Rev. 2009, 41, 77–88. [Google Scholar] [CrossRef]
- Krishnan, P.; Fu, Q.; Lam, W.; Liou, J.Y.; Dutschman, G.; Cheng, Y.C. Phosphorylation of pyrimidine deoxynucleoside analog diphosphates: Selective phosphorylation of L-nucleoside analog diphosphates by 3-phosphoglycerate kinase. J. Biol. Chem. 2002, 277, 5453–5459. [Google Scholar] [CrossRef]
- Flentie, K.; Gonzalez, C.; Kocher, B.; Wang, Y.; Zhu, H.; Marasa, J.; Piwnica-Worms, D. Nucleoside Diphosphate Kinase-3 (NME3) Enhances TLR5-Induced NFkappaB Activation. Mol. Cancer Res. 2018, 16, 986–999. [Google Scholar] [CrossRef]
- O’Kane, G.M.; Connor, A.A.; Gallinger, S. Characterization, Detection, and Treatment Approaches for Homologous Recombination Deficiency in Cancer. Trends Mol. Med. 2017, 23, 1121–1137. [Google Scholar] [CrossRef] [PubMed]
- Jackson, J.C.; Lopes, J.M. The yeast UME6 gene is required for both negative and positive transcriptional regulation of phospholipid biosynthetic gene expression. Nucleic Acids Res. 1996, 24, 1322–1329. [Google Scholar] [CrossRef] [PubMed]
- Bae-Lee, M.S.; Carman, G.M. Phosphatidylserine synthesis in Saccharomyces cerevisiae. Purification and characterization of membrane-associated phosphatidylserine synthase. J. Biol. Chem. 1984, 259, 10857–10862. [Google Scholar]
- Madeo, F.; Frohlich, E.; Frohlich, K.U. A yeast mutant showing diagnostic markers of early and late apoptosis. J. Cell Biol. 1997, 139, 729–734. [Google Scholar] [CrossRef] [PubMed]
- Modrak, D.E.; Cardillo, T.M.; Newsome, G.A.; Goldenberg, D.M.; Gold, D.V. Synergistic interaction between sphingomyelin and gemcitabine potentiates ceramide-mediated apoptosis in pancreatic cancer. Cancer Res. 2004, 64, 8405–8410. [Google Scholar] [CrossRef]
- Modrak, D.E.; Leon, E.; Goldenberg, D.M.; Gold, D.V. Ceramide regulates gemcitabine-induced senescence and apoptosis in human pancreatic cancer cell lines. Mol. Cancer Res. 2009, 7, 890–896. [Google Scholar] [CrossRef]
- Frohlich, F.; Petit, C.; Kory, N.; Christiano, R.; Hannibal-Bach, H.K.; Graham, M.; Liu, X.; Ejsing, C.S.; Farese, R.V.; Walther, T.C. The GARP complex is required for cellular sphingolipid homeostasis. Elife 2015, 4, e08712. [Google Scholar] [CrossRef]
- Hua, Z.; Fatheddin, P.; Graham, T.R. An essential subfamily of Drs2p-related P-type ATPases is required for protein trafficking between Golgi complex and endosomal/vacuolar system. Mol. Biol. Cell 2002, 13, 3162–3177. [Google Scholar] [CrossRef]
- Pomorski, T.; Lombardi, R.; Riezman, H.; Devaux, P.F.; van Meer, G.; Holthuis, J.C. Drs2p-related P-type ATPases Dnf1p and Dnf2p are required for phospholipid translocation across the yeast plasma membrane and serve a role in endocytosis. Mol. Biol. Cell 2003, 14, 1240–1254. [Google Scholar] [CrossRef]
- Nakano, K.; Yamamoto, T.; Kishimoto, T.; Noji, T.; Tanaka, K. Protein kinases Fpk1p and Fpk2p are novel regulators of phospholipid asymmetry. Mol. Biol. Cell 2008, 19, 1783–1797. [Google Scholar] [CrossRef]
- Bastide, A.; David, A. The ribosome, (slow) beating heart of cancer (stem) cell. Oncogenesis 2018, 7, 34. [Google Scholar] [CrossRef]
- Manfrini, N.; Gobbini, E.; Baldo, V.; Trovesi, C.; Lucchini, G.; Longhese, M.P. G(1)/S and G(2)/M cyclin-dependent kinase activities commit cells to death in the absence of the S-phase checkpoint. Mol. Cell. Biol. 2012, 32, 4971–4985. [Google Scholar] [CrossRef] [PubMed]
- Hu, X.; Lu, Z.; Yu, S.; Reilly, J.; Liu, F.; Jia, D.; Qin, Y.; Han, S.; Liu, X.; Qu, Z.; et al. CERKL regulates autophagy via the NAD-dependent deacetylase SIRT1. Autophagy 2019, 15, 453–465. [Google Scholar] [CrossRef] [PubMed]
- Sun, F.; Xiong, Y.; Zhou, X.H.; Li, Q.; Xiao, L.; Long, P.; Li, L.J.; Cai, M.Y.; Wei, Y.X.; Ma, Y.L.; et al. Acylglycerol kinase is over-expressed in early-stage cervical squamous cell cancer and predicts poor prognosis. Tumour Biol. 2016, 37, 6729–6736. [Google Scholar] [CrossRef] [PubMed]
- Liu, N.; Wang, Z.; Cheng, Y.; Zhang, P.; Wang, X.; Yang, H.; Liu, H.; Zhang, Y.; Tu, Y. Acylglycerol kinase functions as an oncogene and an unfavorable prognostic marker of human gliomas. Hum. Pathol. 2016, 58, 105–112. [Google Scholar] [CrossRef] [PubMed]
- Cui, Y.; Lin, C.; Wu, Z.; Liu, A.; Zhang, X.; Zhu, J.; Wu, G.; Wu, J.; Li, M.; Li, J.; et al. AGK enhances angiogenesis and inhibits apoptosis via activation of the NF-kappaB signaling pathway in hepatocellular carcinoma. Oncotarget 2014, 5, 12057–12069. [Google Scholar] [CrossRef] [PubMed]
- Wang, X.; Lin, C.; Zhao, X.; Liu, A.; Zhu, J.; Li, X.; Song, L. Acylglycerol kinase promotes cell proliferation and tumorigenicity in breast cancer via suppression of the FOXO1 transcription factor. Mol. Cancer 2014, 13, 106. [Google Scholar] [CrossRef]
- Kang, H.; Tsygankov, D.; Lew, D.J. Sensing a bud in the yeast morphogenesis checkpoint: A role for Elm1. Mol. Biol. Cell 2016, 27, 1764–1775. [Google Scholar] [CrossRef] [PubMed]
- Choi, E.J.; Yoo, N.J.; Kim, M.S.; An, C.H.; Lee, S.H. Putative Tumor Suppressor Genes EGR1 and BRSK1 Are Mutated in Gastric and Colorectal Cancers. Oncology 2016, 91, 289–294. [Google Scholar] [CrossRef]
- Wang, H.; Liu, X.B.; Chen, J.H.; Wang, Q.Q.; Chen, J.P.; Xu, J.F.; Sheng, C.Y.; Ni, Q.C. Decreased expression and prognostic role of cytoplasmic BRSK1 in human breast carcinoma: Correlation with Jab1 stability and PI3K/Akt pathway. Exp. Mol. Pathol. 2014, 97, 191–201. [Google Scholar] [CrossRef]
- Saiyin, H.; Na, N.; Han, X.; Fang, Y.; Wu, Y.; Lou, W.; Yang, X. BRSK2 induced by nutrient deprivation promotes Akt activity in pancreatic cancer via downregulation of mTOR activity. Oncotarget 2017, 8, 44669–44681. [Google Scholar] [CrossRef] [PubMed] [Green Version]
- Ye, Y.; Gu, B.; Wang, Y.; Shen, S.; Huang, W. E2F1-mediated MNX1-AS1-miR-218-5p-SEC61A1 feedback loop contributes to the progression of colon adenocarcinoma. J. Cell. Biochem. 2019, 120, 6145–6153. [Google Scholar] [CrossRef]
- Phan, N.N.; Wang, C.Y.; Chen, C.F.; Sun, Z.; Lai, M.D.; Lin, Y.C. Voltage-gated calcium channels: Novel targets for cancer therapy. Oncol. Lett. 2017, 14, 2059–2074. [Google Scholar] [CrossRef] [PubMed]
- Liu, K.T.; Yeh, I.J.; Chou, S.K.; Yen, M.C.; Kuo, P.L. Regulatory mechanism of fatty acidCoA metabolic enzymes under endoplasmic reticulum stress in lung cancer. Oncol. Rep. 2018, 40, 2674–2682. [Google Scholar] [CrossRef] [PubMed]
- Furuta, J.; Nobeyama, Y.; Umebayashi, Y.; Otsuka, F.; Kikuchi, K.; Ushijima, T. Silencing of Peroxiredoxin 2 and aberrant methylation of 33 CpG islands in putative promoter regions in human malignant melanomas. Cancer Res. 2006, 66, 6080–6086. [Google Scholar] [CrossRef] [PubMed]
- Gao, Y.; Wang, W.; Cao, J.; Wang, F.; Geng, Y.; Cao, J.; Xu, X.; Zhou, J.; Liu, P.; Zhang, S. Upregulation of AUF1 is involved in the proliferation of esophageal squamous cell carcinoma through GCH1. Int. J. Oncol. 2016, 49, 2001–2010. [Google Scholar] [CrossRef]
- Mocino-Rodriguez, M.D.; Santillan-Benitez, J.G.; Dozal-Dominguez, D.S.; Hernandez-Navarro, M.D.; Flores-Merino, M.V.; Sandoval-Cabrera, A.; Garcia Vazquez, F.J. Expression of AdipoR1 and AdipoR2 Receptors as Leptin-Breast Cancer Regulation Mechanisms. Dis. Markers 2017, 2017, 4862016. [Google Scholar] [CrossRef] [PubMed]
- Wang, L.; Collings, C.K.; Zhao, Z.; Cozzolino, K.A.; Ma, Q.; Liang, K.; Marshall, S.A.; Sze, C.C.; Hashizume, R.; Savas, J.N.; et al. A cytoplasmic COMPASS is necessary for cell survival and triple-negative breast cancer pathogenesis by regulating metabolism. Genes Dev. 2017, 31, 2056–2066. [Google Scholar] [CrossRef]
- Ross, J.B.; Huh, D.; Noble, L.B.; Tavazoie, S.F. Identification of molecular determinants of primary and metastatic tumour re-initiation in breast cancer. Nat. Cell Biol. 2015, 17, 651–664. [Google Scholar] [CrossRef] [Green Version]
- Bhise, N.S.; Chauhan, L.; Shin, M.; Cao, X.; Pounds, S.; Lamba, V.; Lamba, J.K. MicroRNA-mRNA Pairs Associated with Outcome in AML: From In Vitro Cell-Based Studies to AML Patients. Front. Pharmacol. 2015, 6, 324. [Google Scholar] [CrossRef]
- Tenreiro, S.; Outeiro, T.F. Simple is good: Yeast models of neurodegeneration. FEMS Yeast Res. 2010, 10, 970–979. [Google Scholar] [CrossRef] [PubMed]
- Billant, O.; Blondel, M.; Voisset, C. p53, p63 and p73 in the wonderland of S. cerevisiae. Oncotarget 2017, 8, 57855–57869. [Google Scholar] [CrossRef] [PubMed]
- Rodriguez-Escudero, I.; Roelants, F.M.; Thorner, J.; Nombela, C.; Molina, M.; Cid, V.J. Reconstitution of the mammalian PI3K/PTEN/Akt pathway in yeast. Biochem. J. 2005, 390, 613–623. [Google Scholar] [CrossRef] [PubMed] [Green Version]
- Hamza, A.; Tammpere, E.; Kofoed, M.; Keong, C.; Chiang, J.; Giaever, G.; Nislow, C.; Hieter, P. Complementation of Yeast Genes with Human Genes as an Experimental Platform for Functional Testing of Human Genetic Variants. Genetics 2015, 201, 1263–1274. [Google Scholar] [CrossRef] [PubMed] [Green Version]
- Sun, S.; Yang, F.; Tan, G.; Costanzo, M.; Oughtred, R.; Hirschman, J.; Theesfeld, C.L.; Bansal, P.; Sahni, N.; Yi, S.; et al. An extended set of yeast-based functional assays accurately identifies human disease mutations. Genome Res. 2016, 26, 670–680. [Google Scholar] [CrossRef] [PubMed] [Green Version]
- Kachroo, A.H.; Laurent, J.M.; Yellman, C.M.; Meyer, A.G.; Wilke, C.O.; Marcotte, E.M. Evolution. Systematic humanization of yeast genes reveals conserved functions and genetic modularity. Science 2015, 348, 921–925. [Google Scholar] [CrossRef]
- Tardiff, D.F.; Khurana, V.; Chung, C.Y.; Lindquist, S. From yeast to patient neurons and back again: Powerful new discovery platform. Mov. Disord. 2014, 29, 1231–1240. [Google Scholar] [CrossRef]
- Veit, G.; Oliver, K.; Apaja, P.M.; Perdomo, D.; Bidaud-Meynard, A.; Lin, S.T.; Guo, J.; Icyuz, M.; Sorscher, E.J.; Hartman, J.L., IV; et al. Ribosomal Stalk Protein Silencing Partially Corrects the DeltaF508-CFTR Functional Expression Defect. PLoS Biol. 2016, 14, e1002462. [Google Scholar] [CrossRef]
- Costanzo, M.; Kuzmin, E.; van Leeuwen, J.; Mair, B.; Moffat, J.; Boone, C.; Andrews, B. Global Genetic Networks and the Genotype-to-Phenotype Relationship. Cell 2019, 177, 85–100. [Google Scholar] [CrossRef] [Green Version]
- Ferreira, M.A.; Gamazon, E.R.; Al-Ejeh, F.; Aittomaki, K.; Andrulis, I.L.; Anton-Culver, H.; Arason, A.; Arndt, V.; Aronson, K.J.; Arun, B.K.; et al. Genome-wide association and transcriptome studies identify target genes and risk loci for breast cancer. Nat. Commun. 2019, 10, 1741. [Google Scholar] [CrossRef]
- Breslow, D.K.; Cameron, D.M.; Collins, S.R.; Schuldiner, M.; Stewart-Ornstein, J.; Newman, H.W.; Braun, S.; Madhani, H.D.; Krogan, N.J.; Weissman, J.S. A comprehensive strategy enabling high-resolution functional analysis of the yeast genome. Nat. Methods 2008, 5, 711–718. [Google Scholar] [CrossRef] [PubMed] [Green Version]
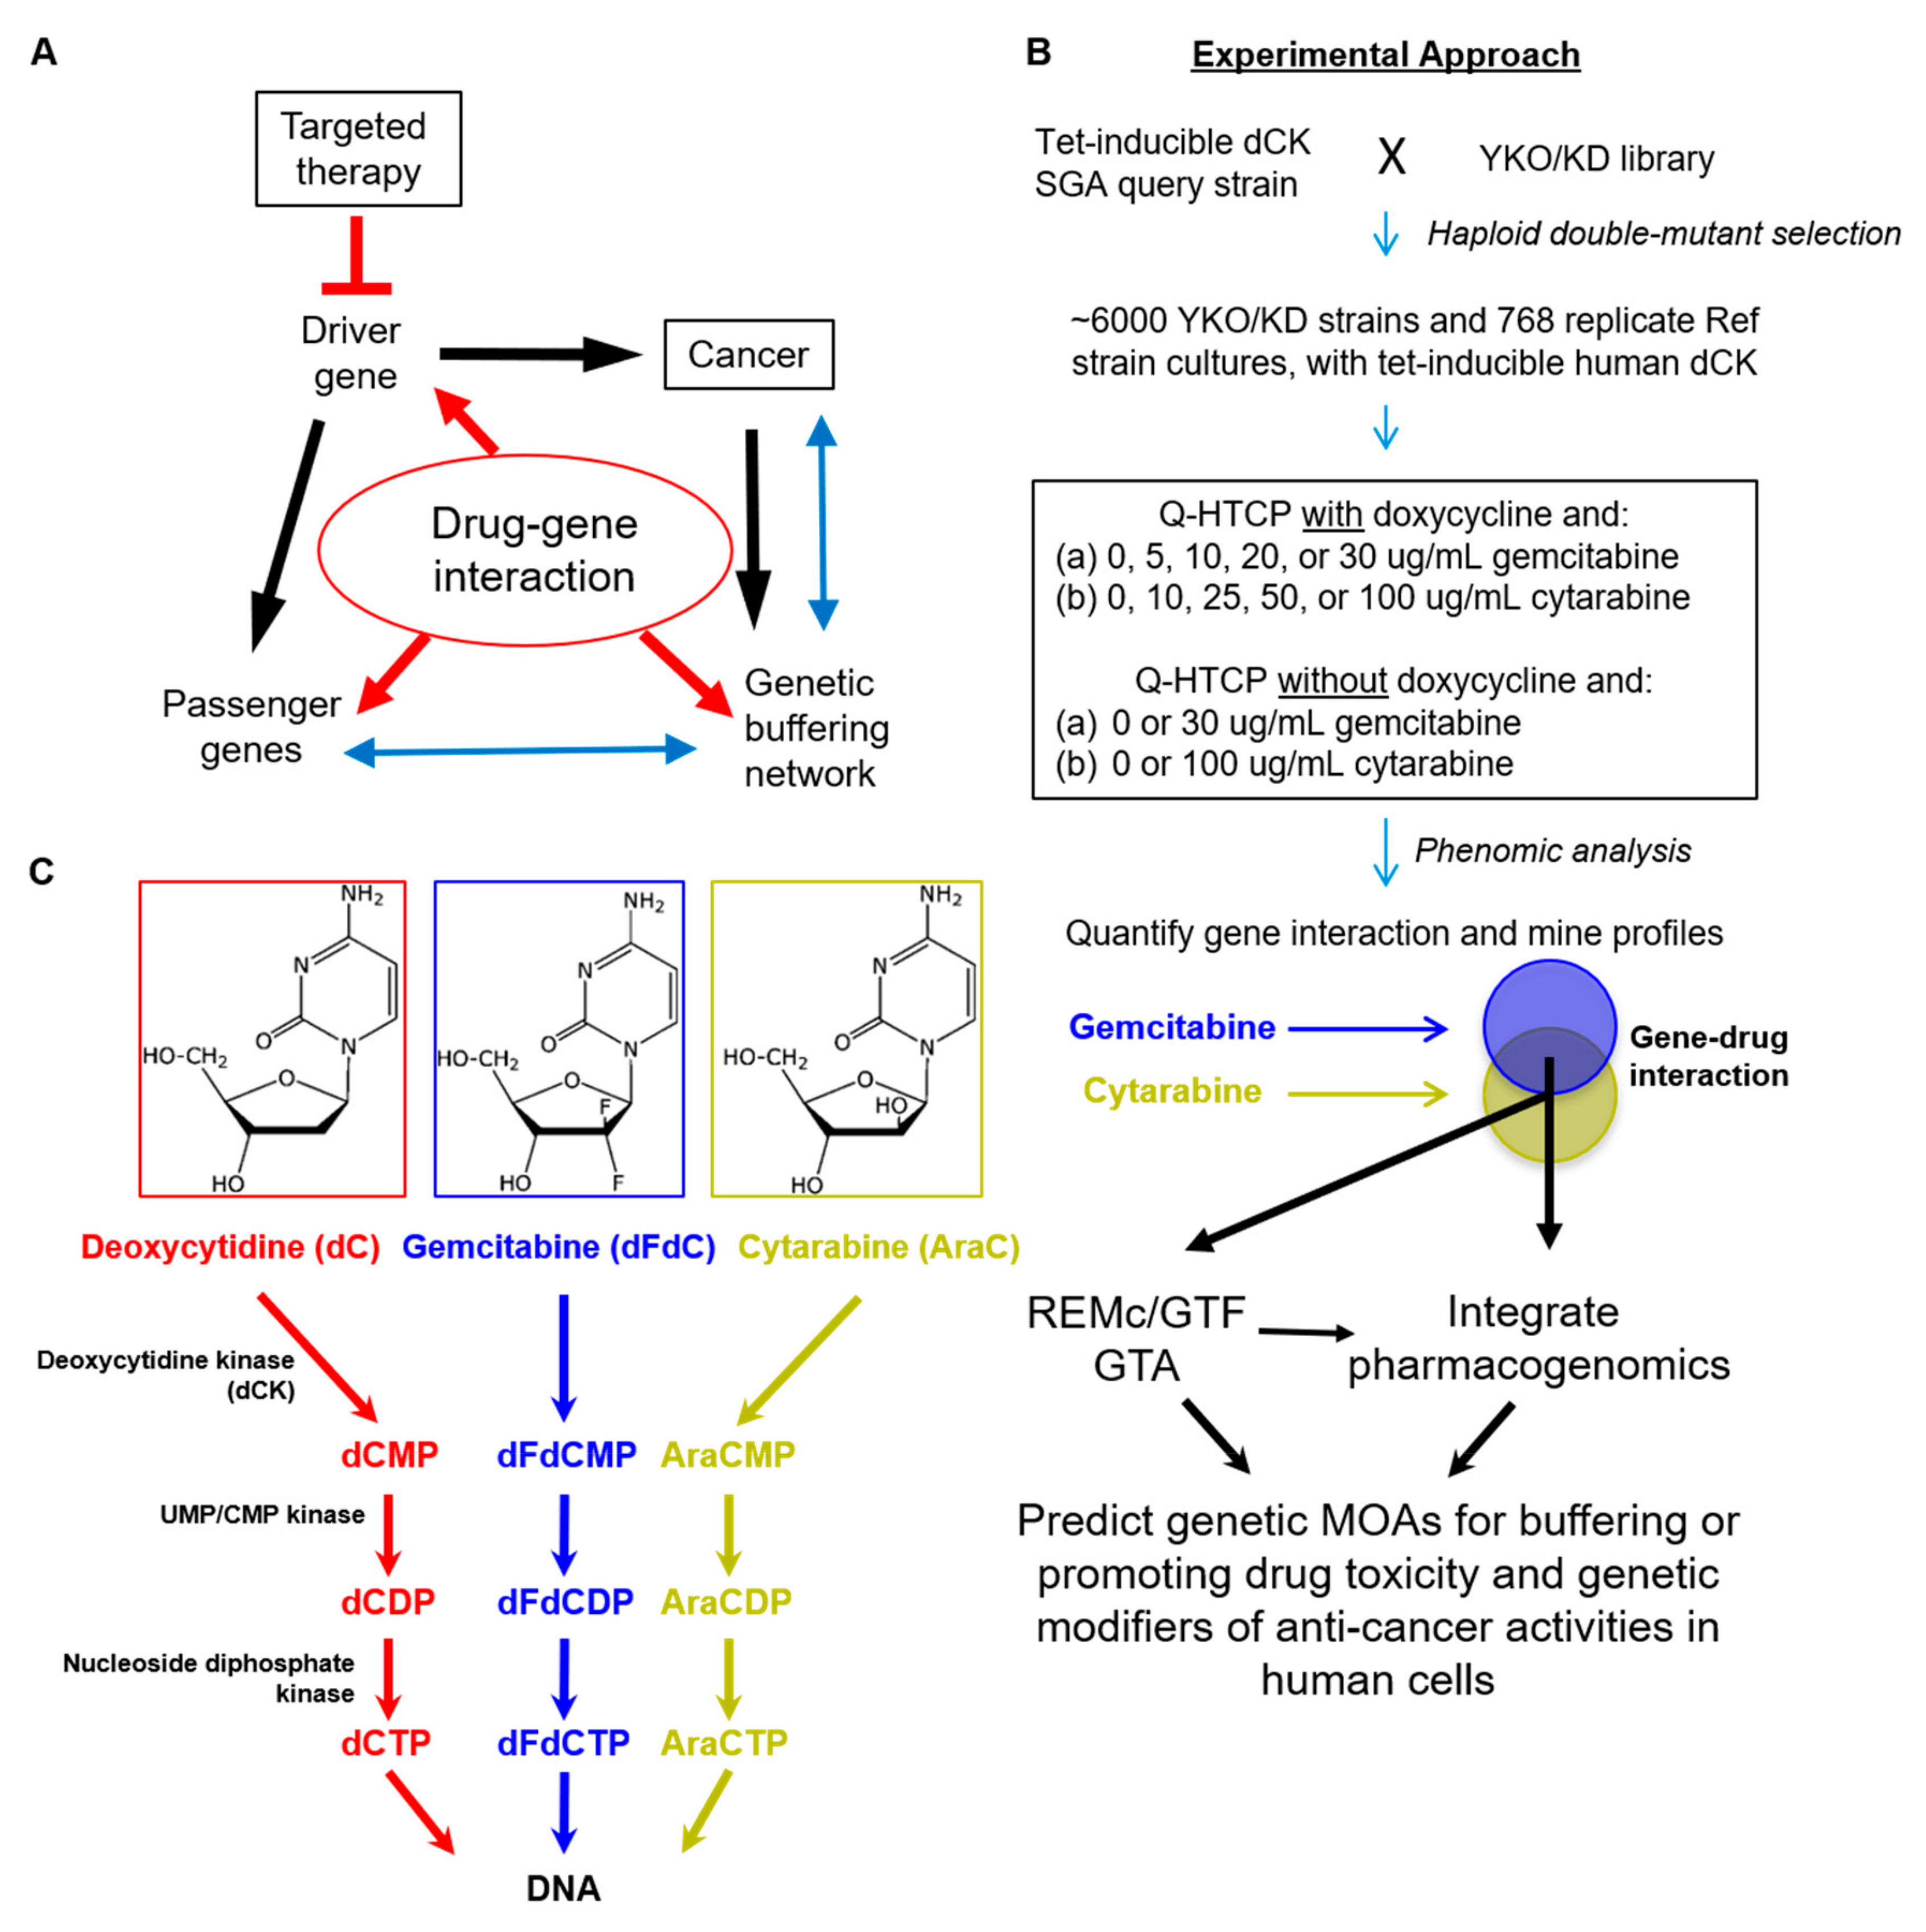
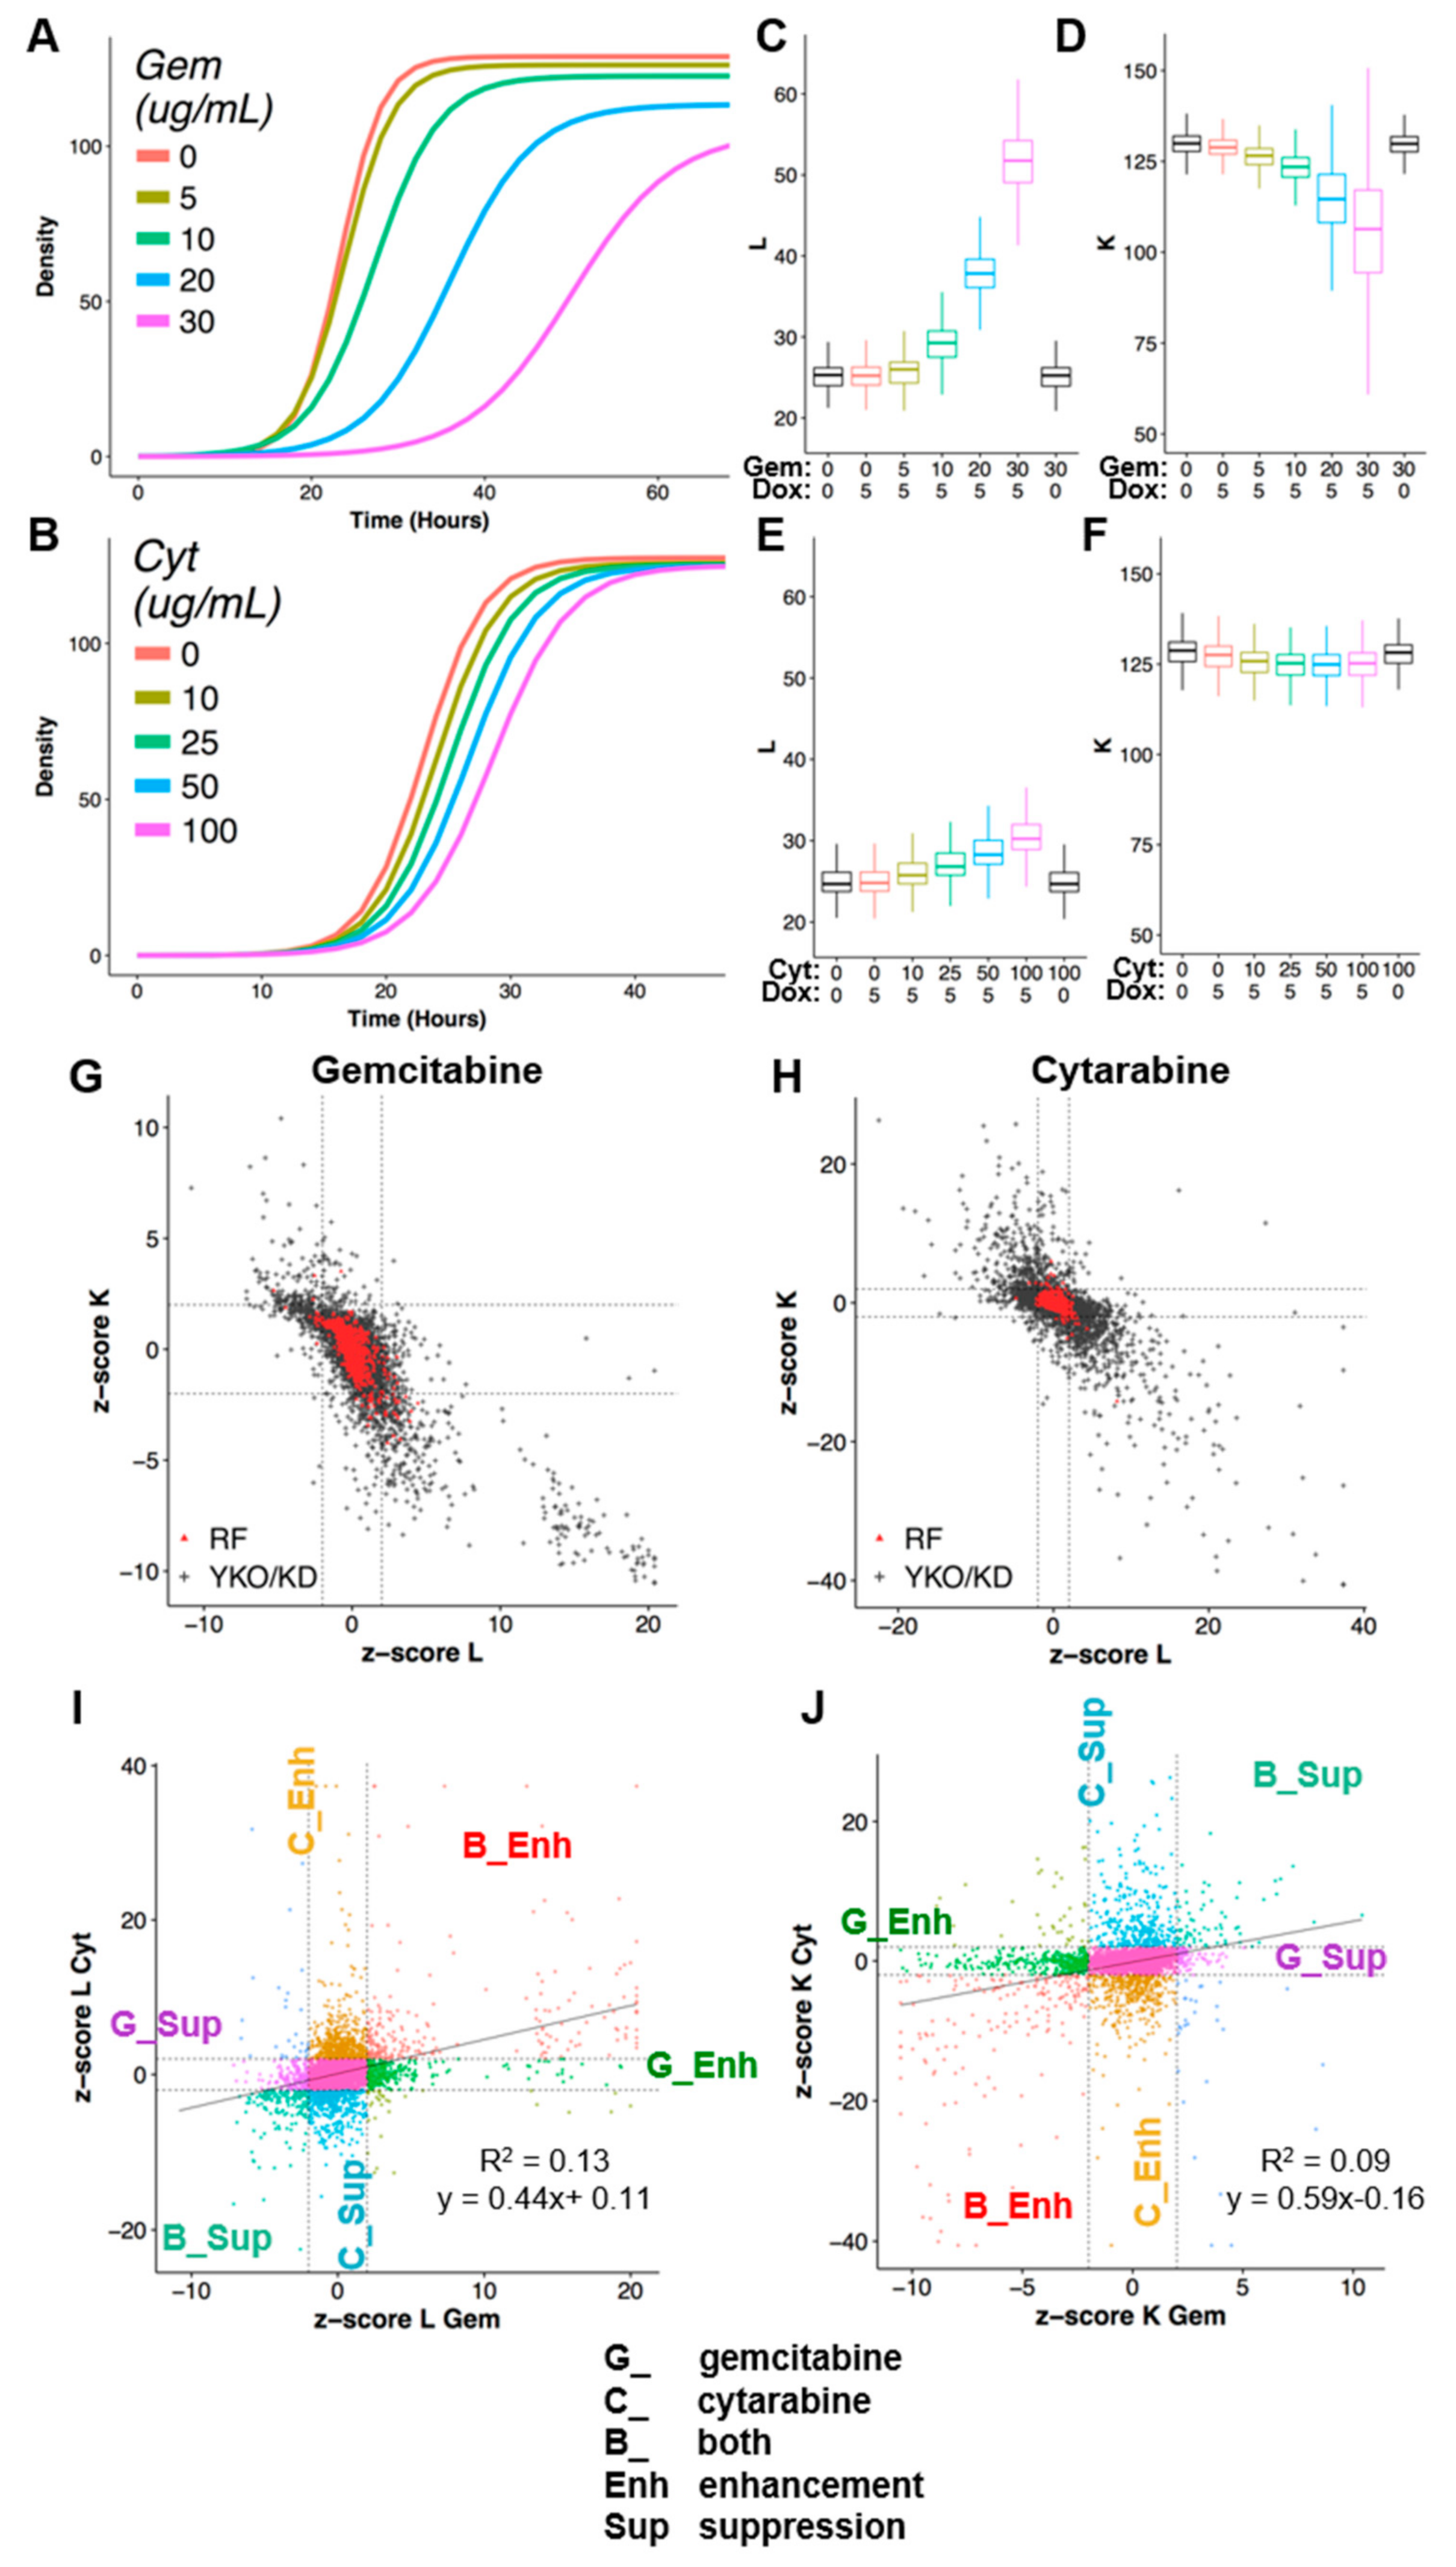
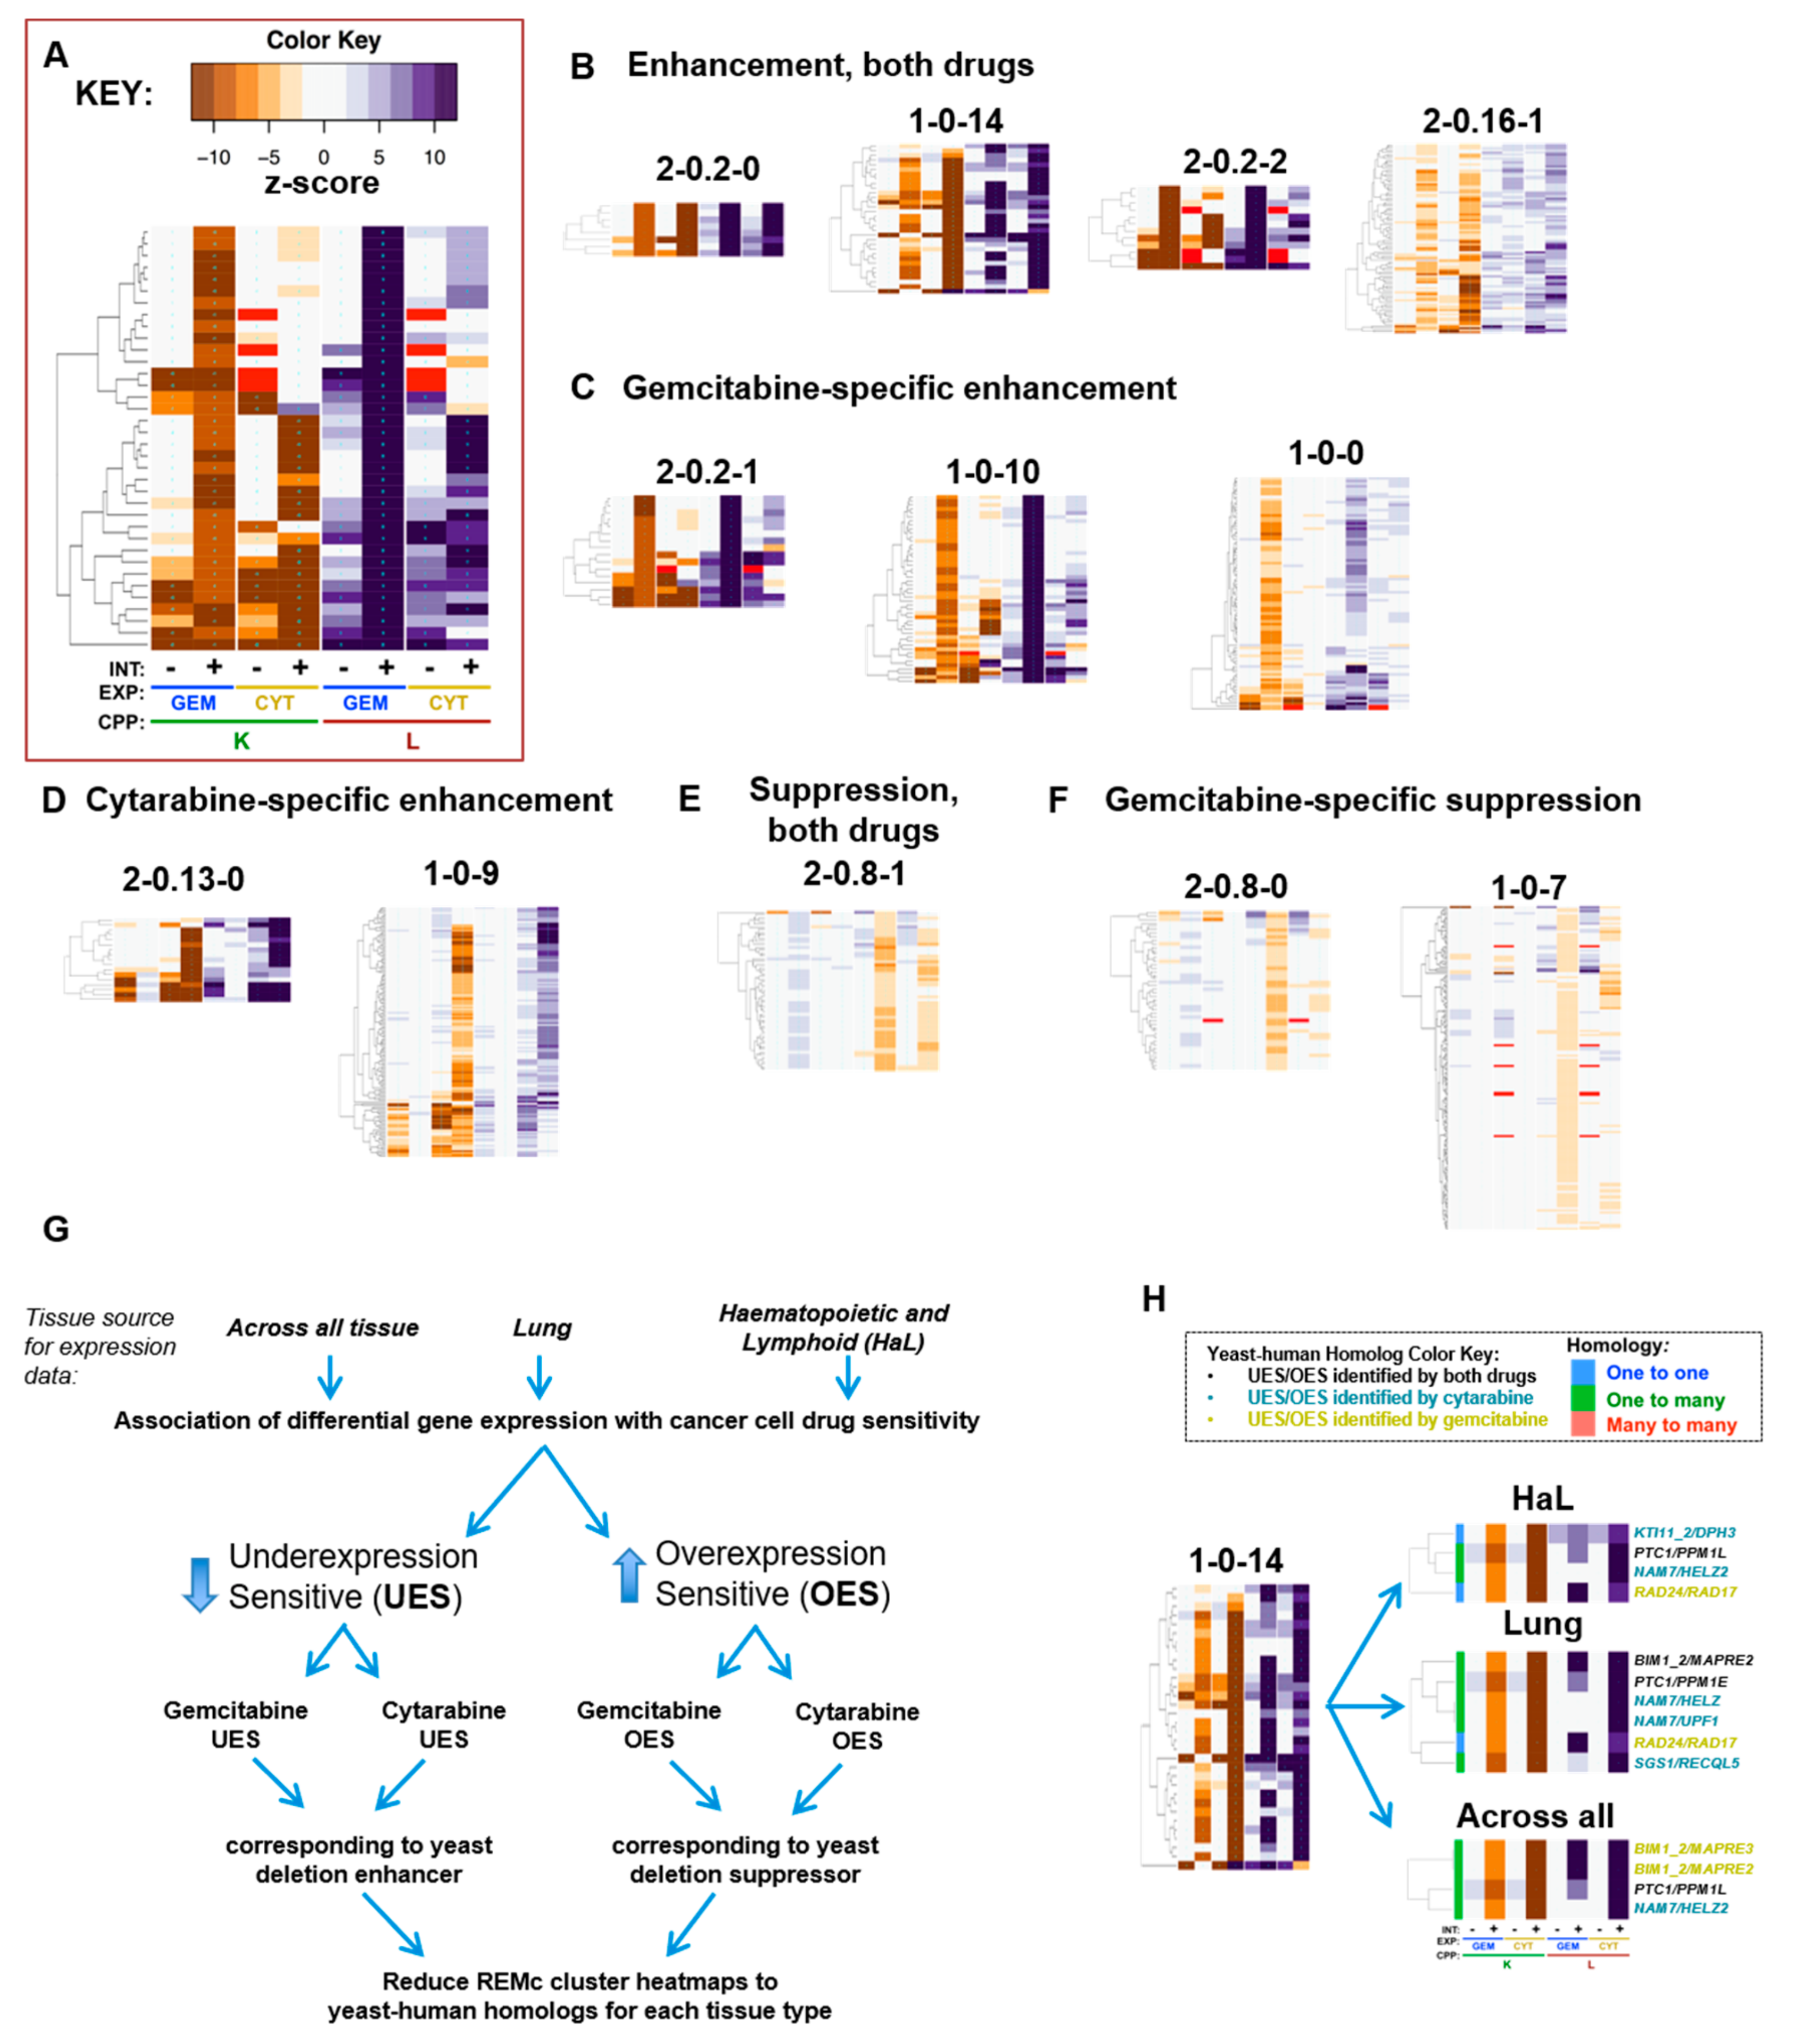
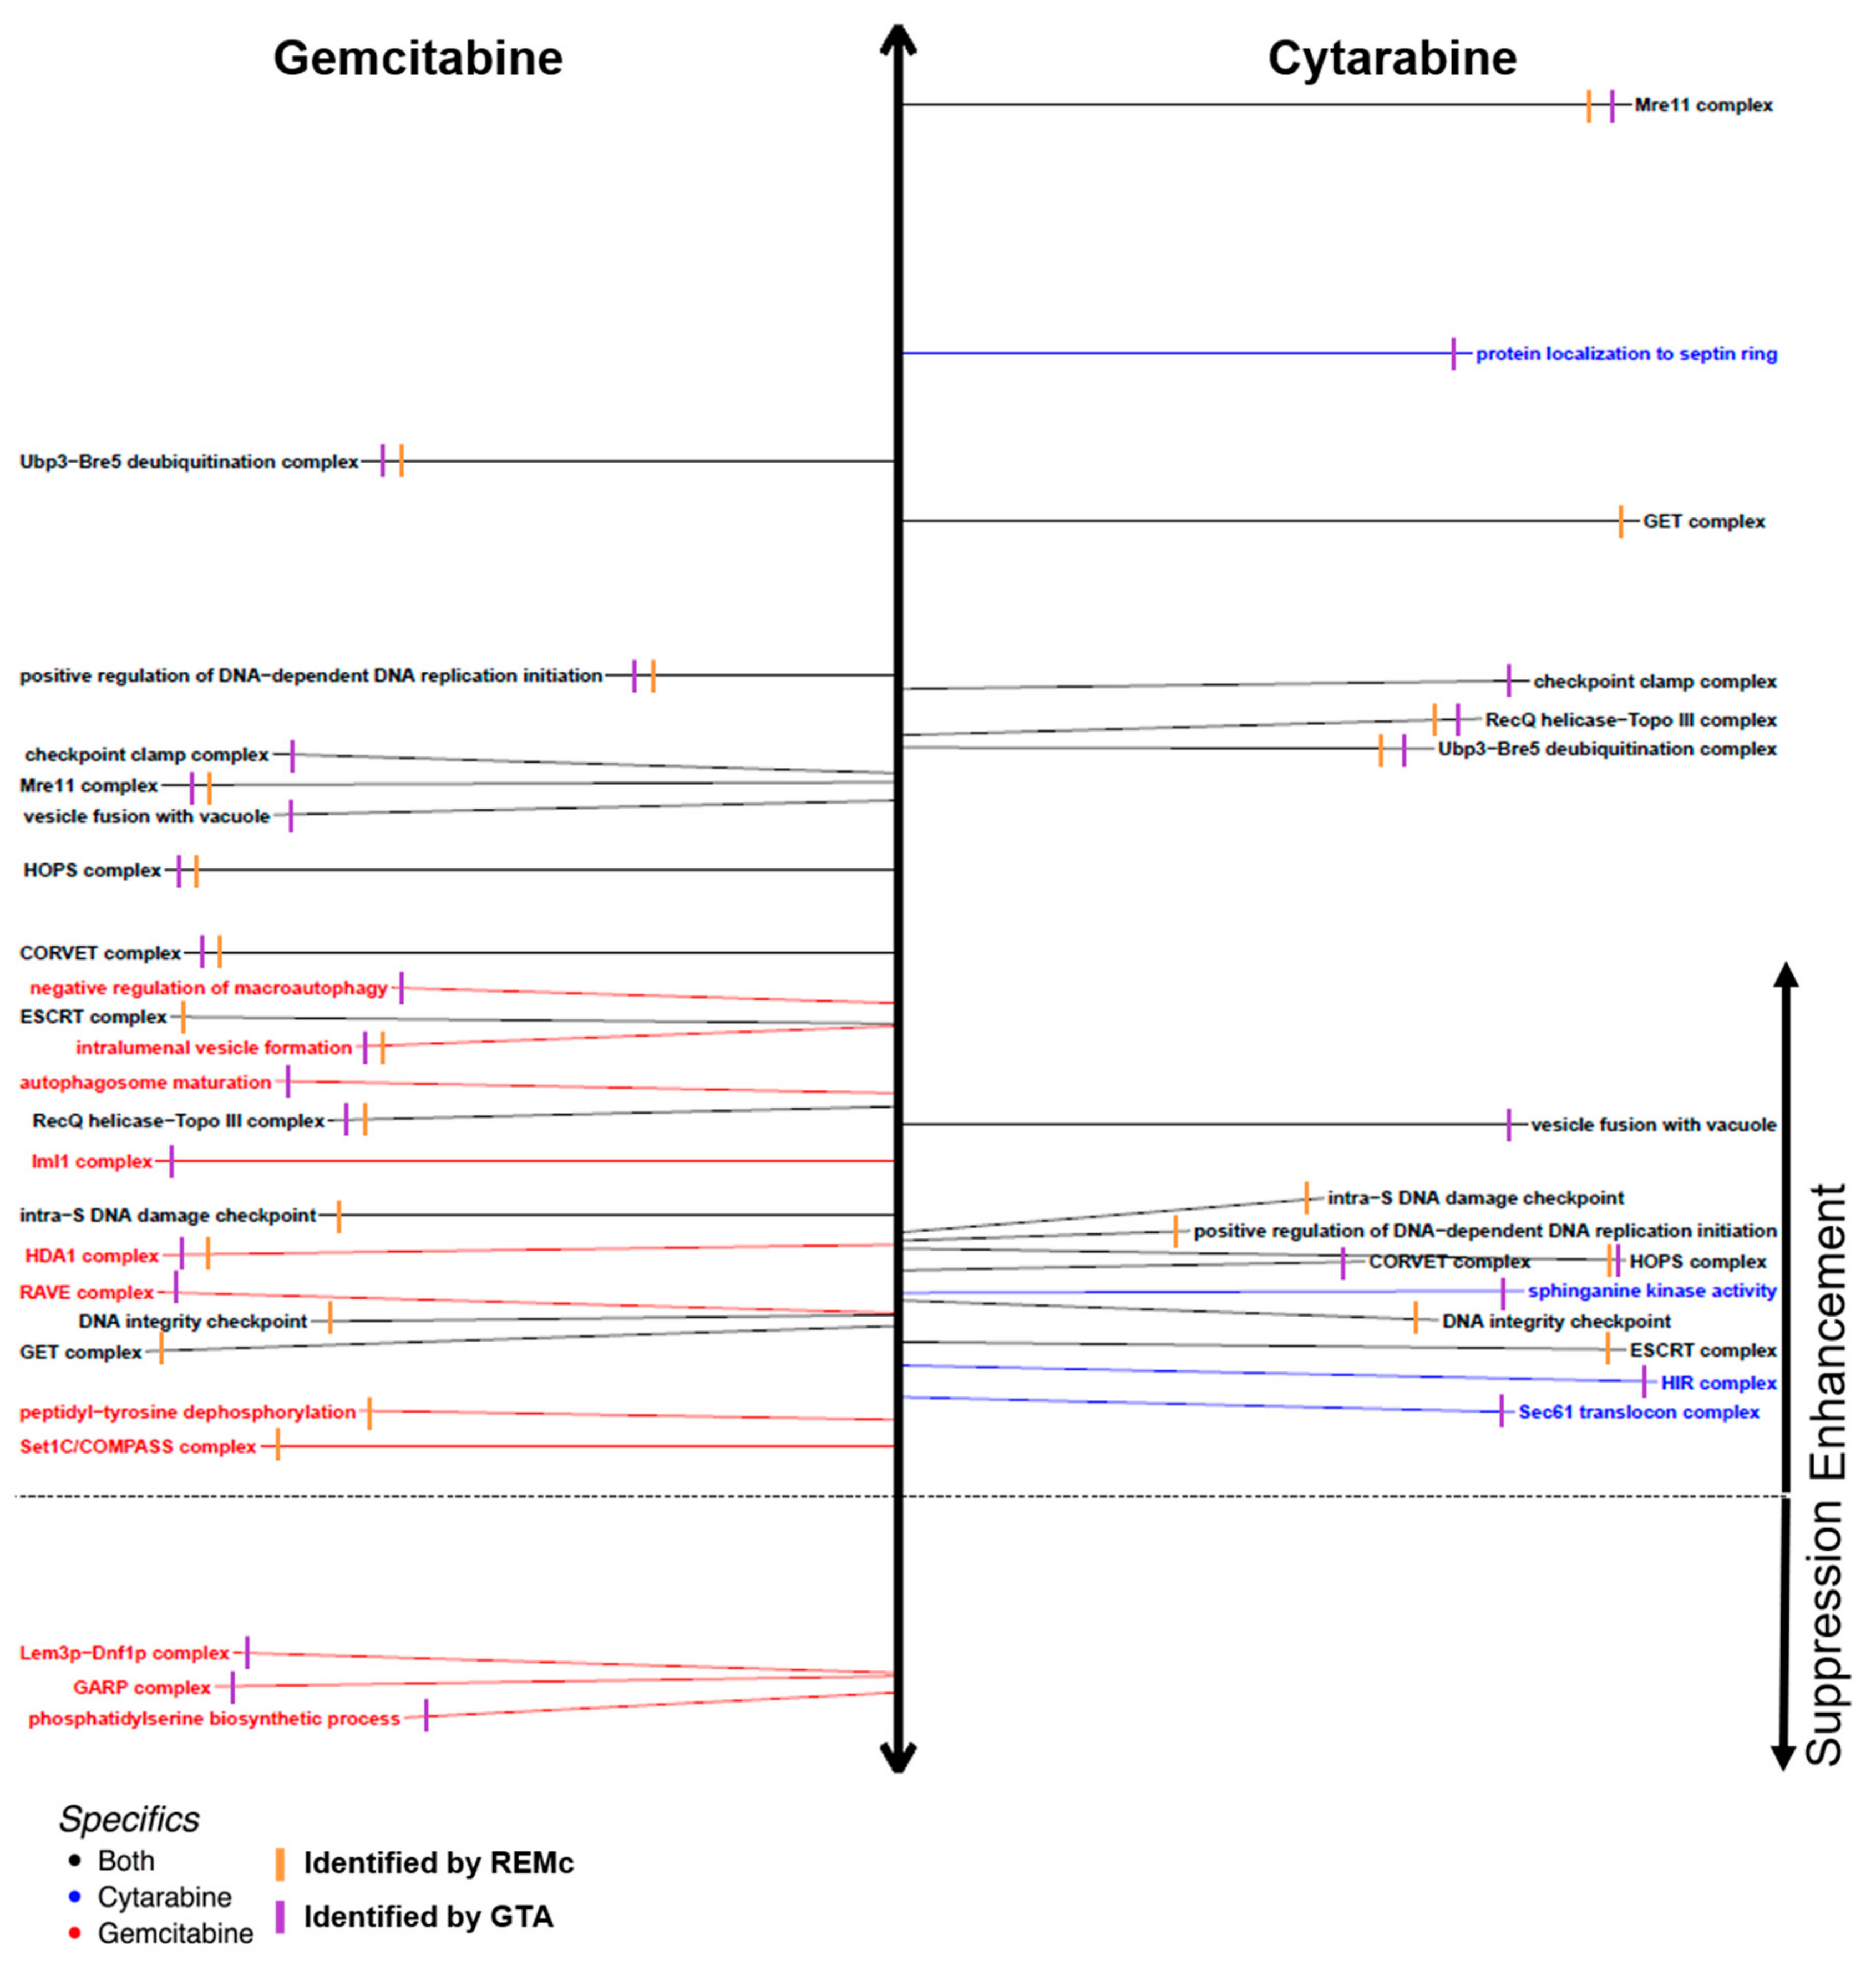
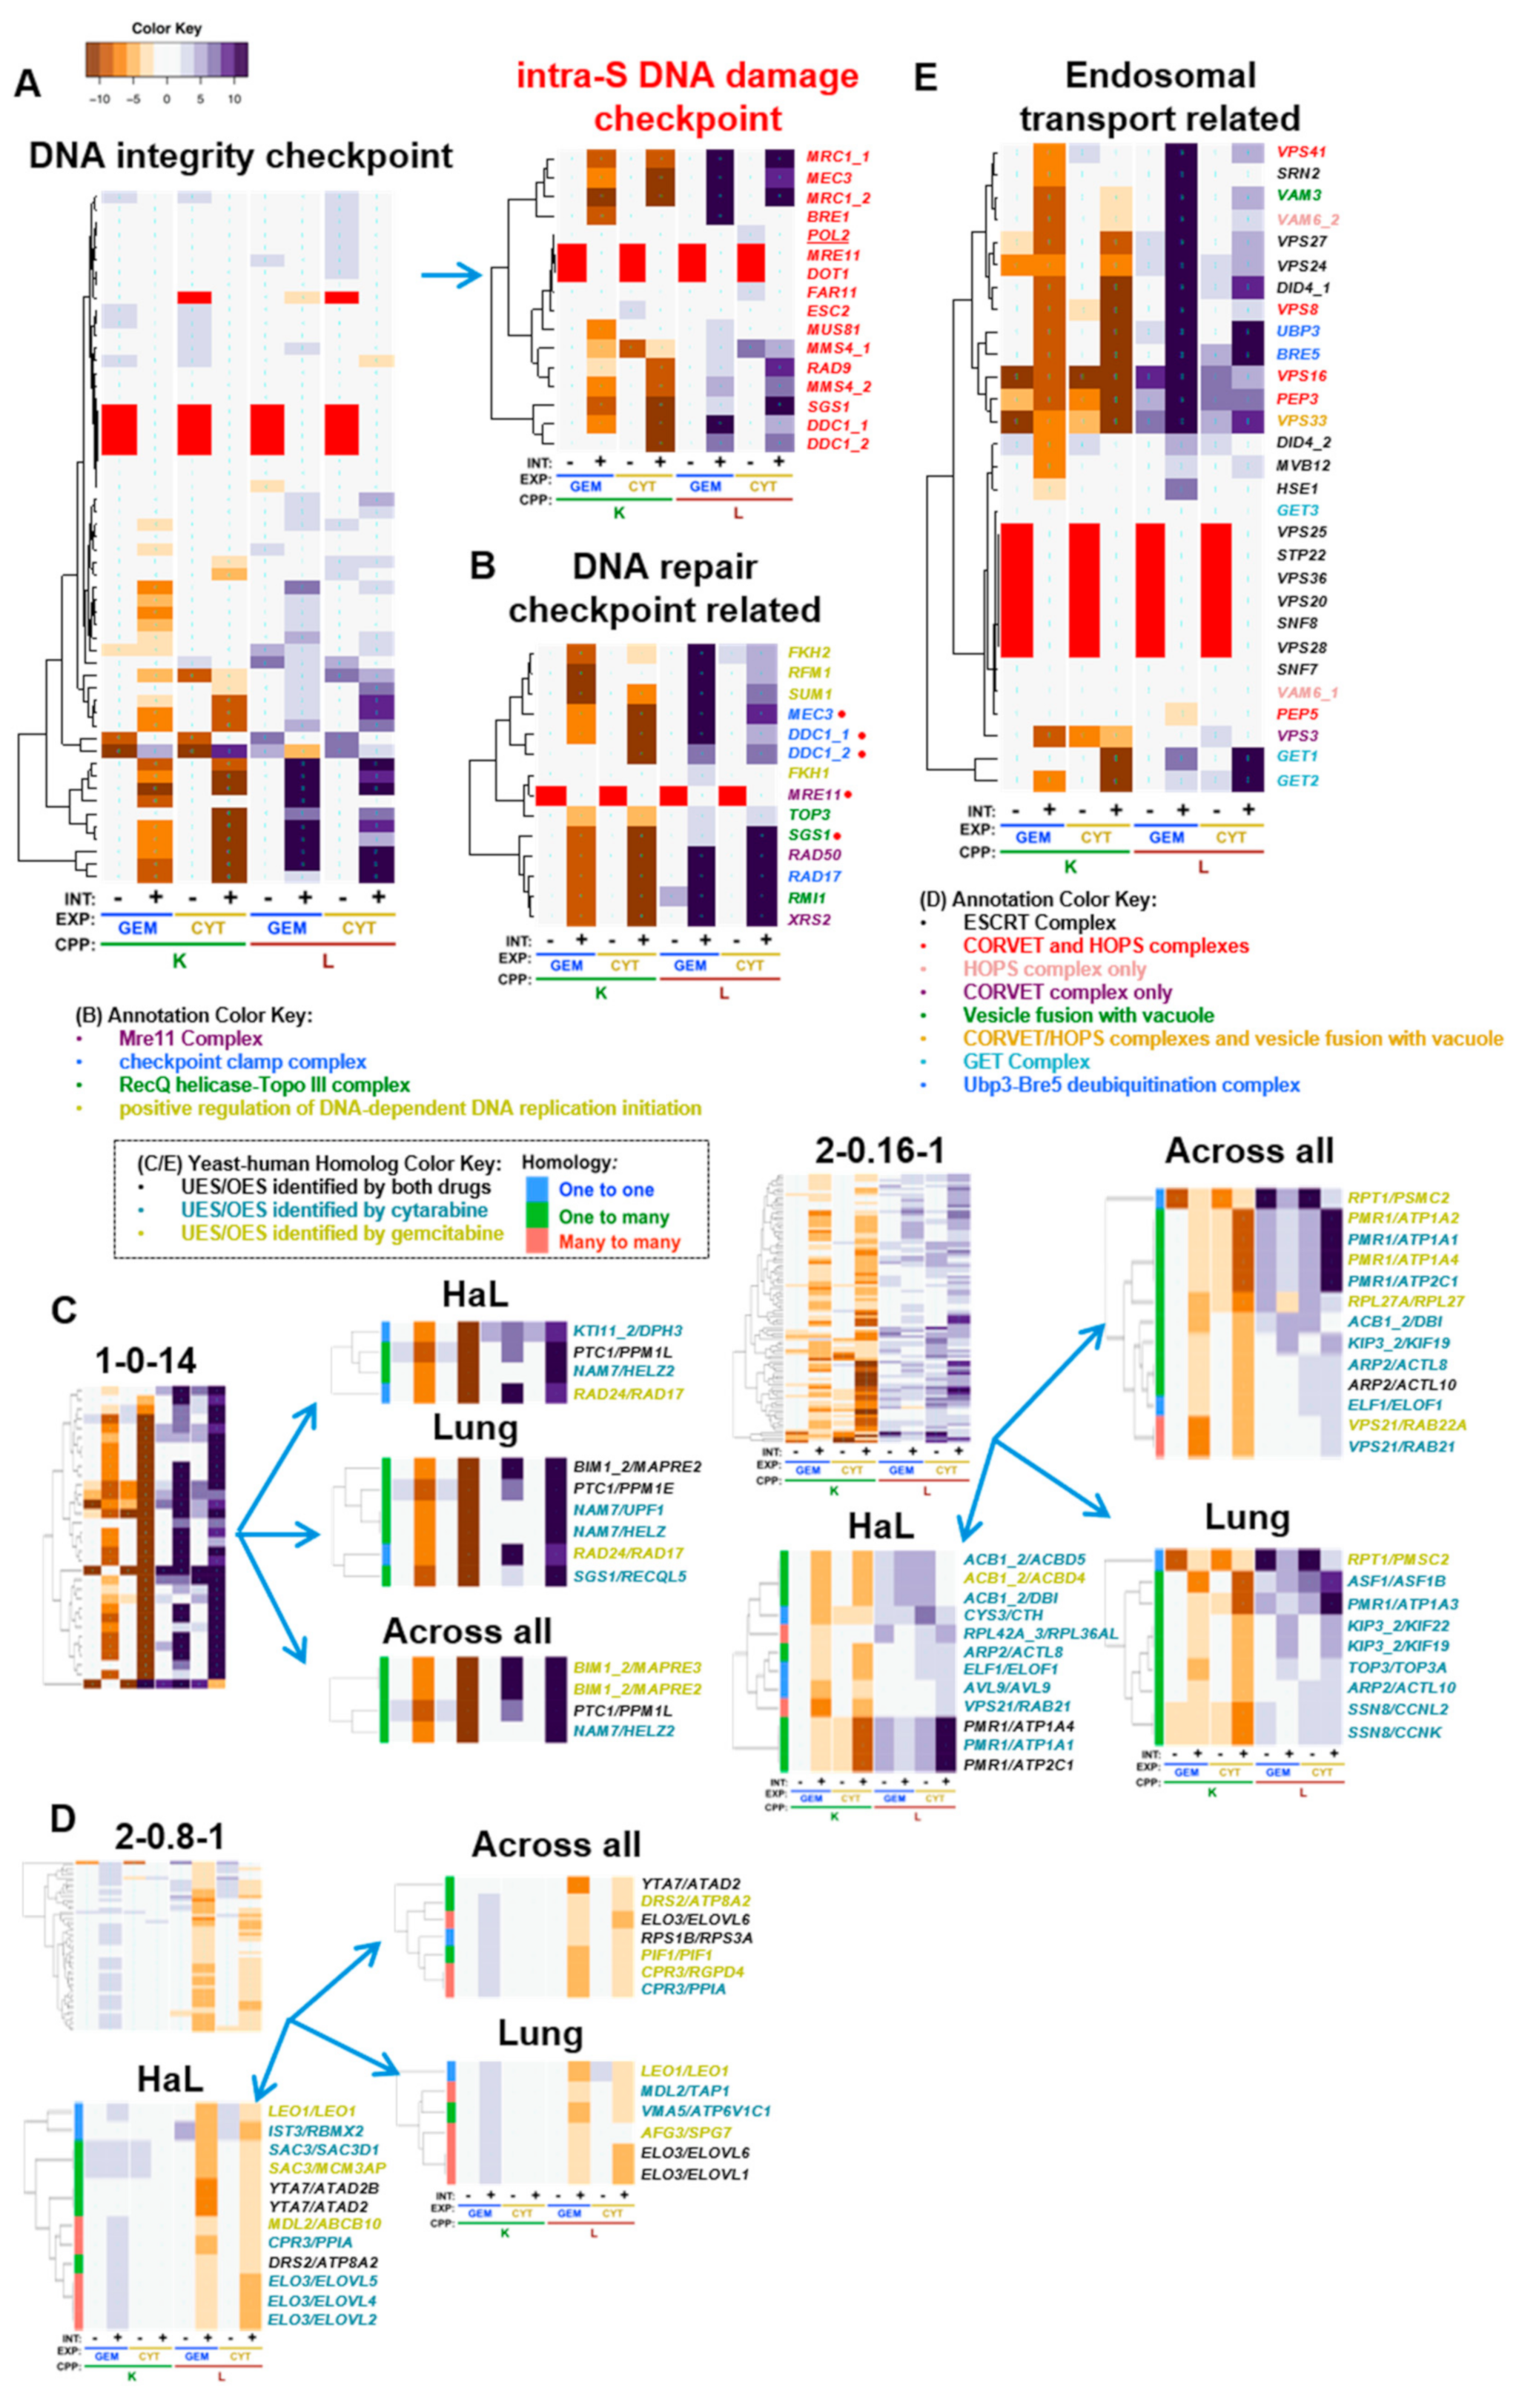
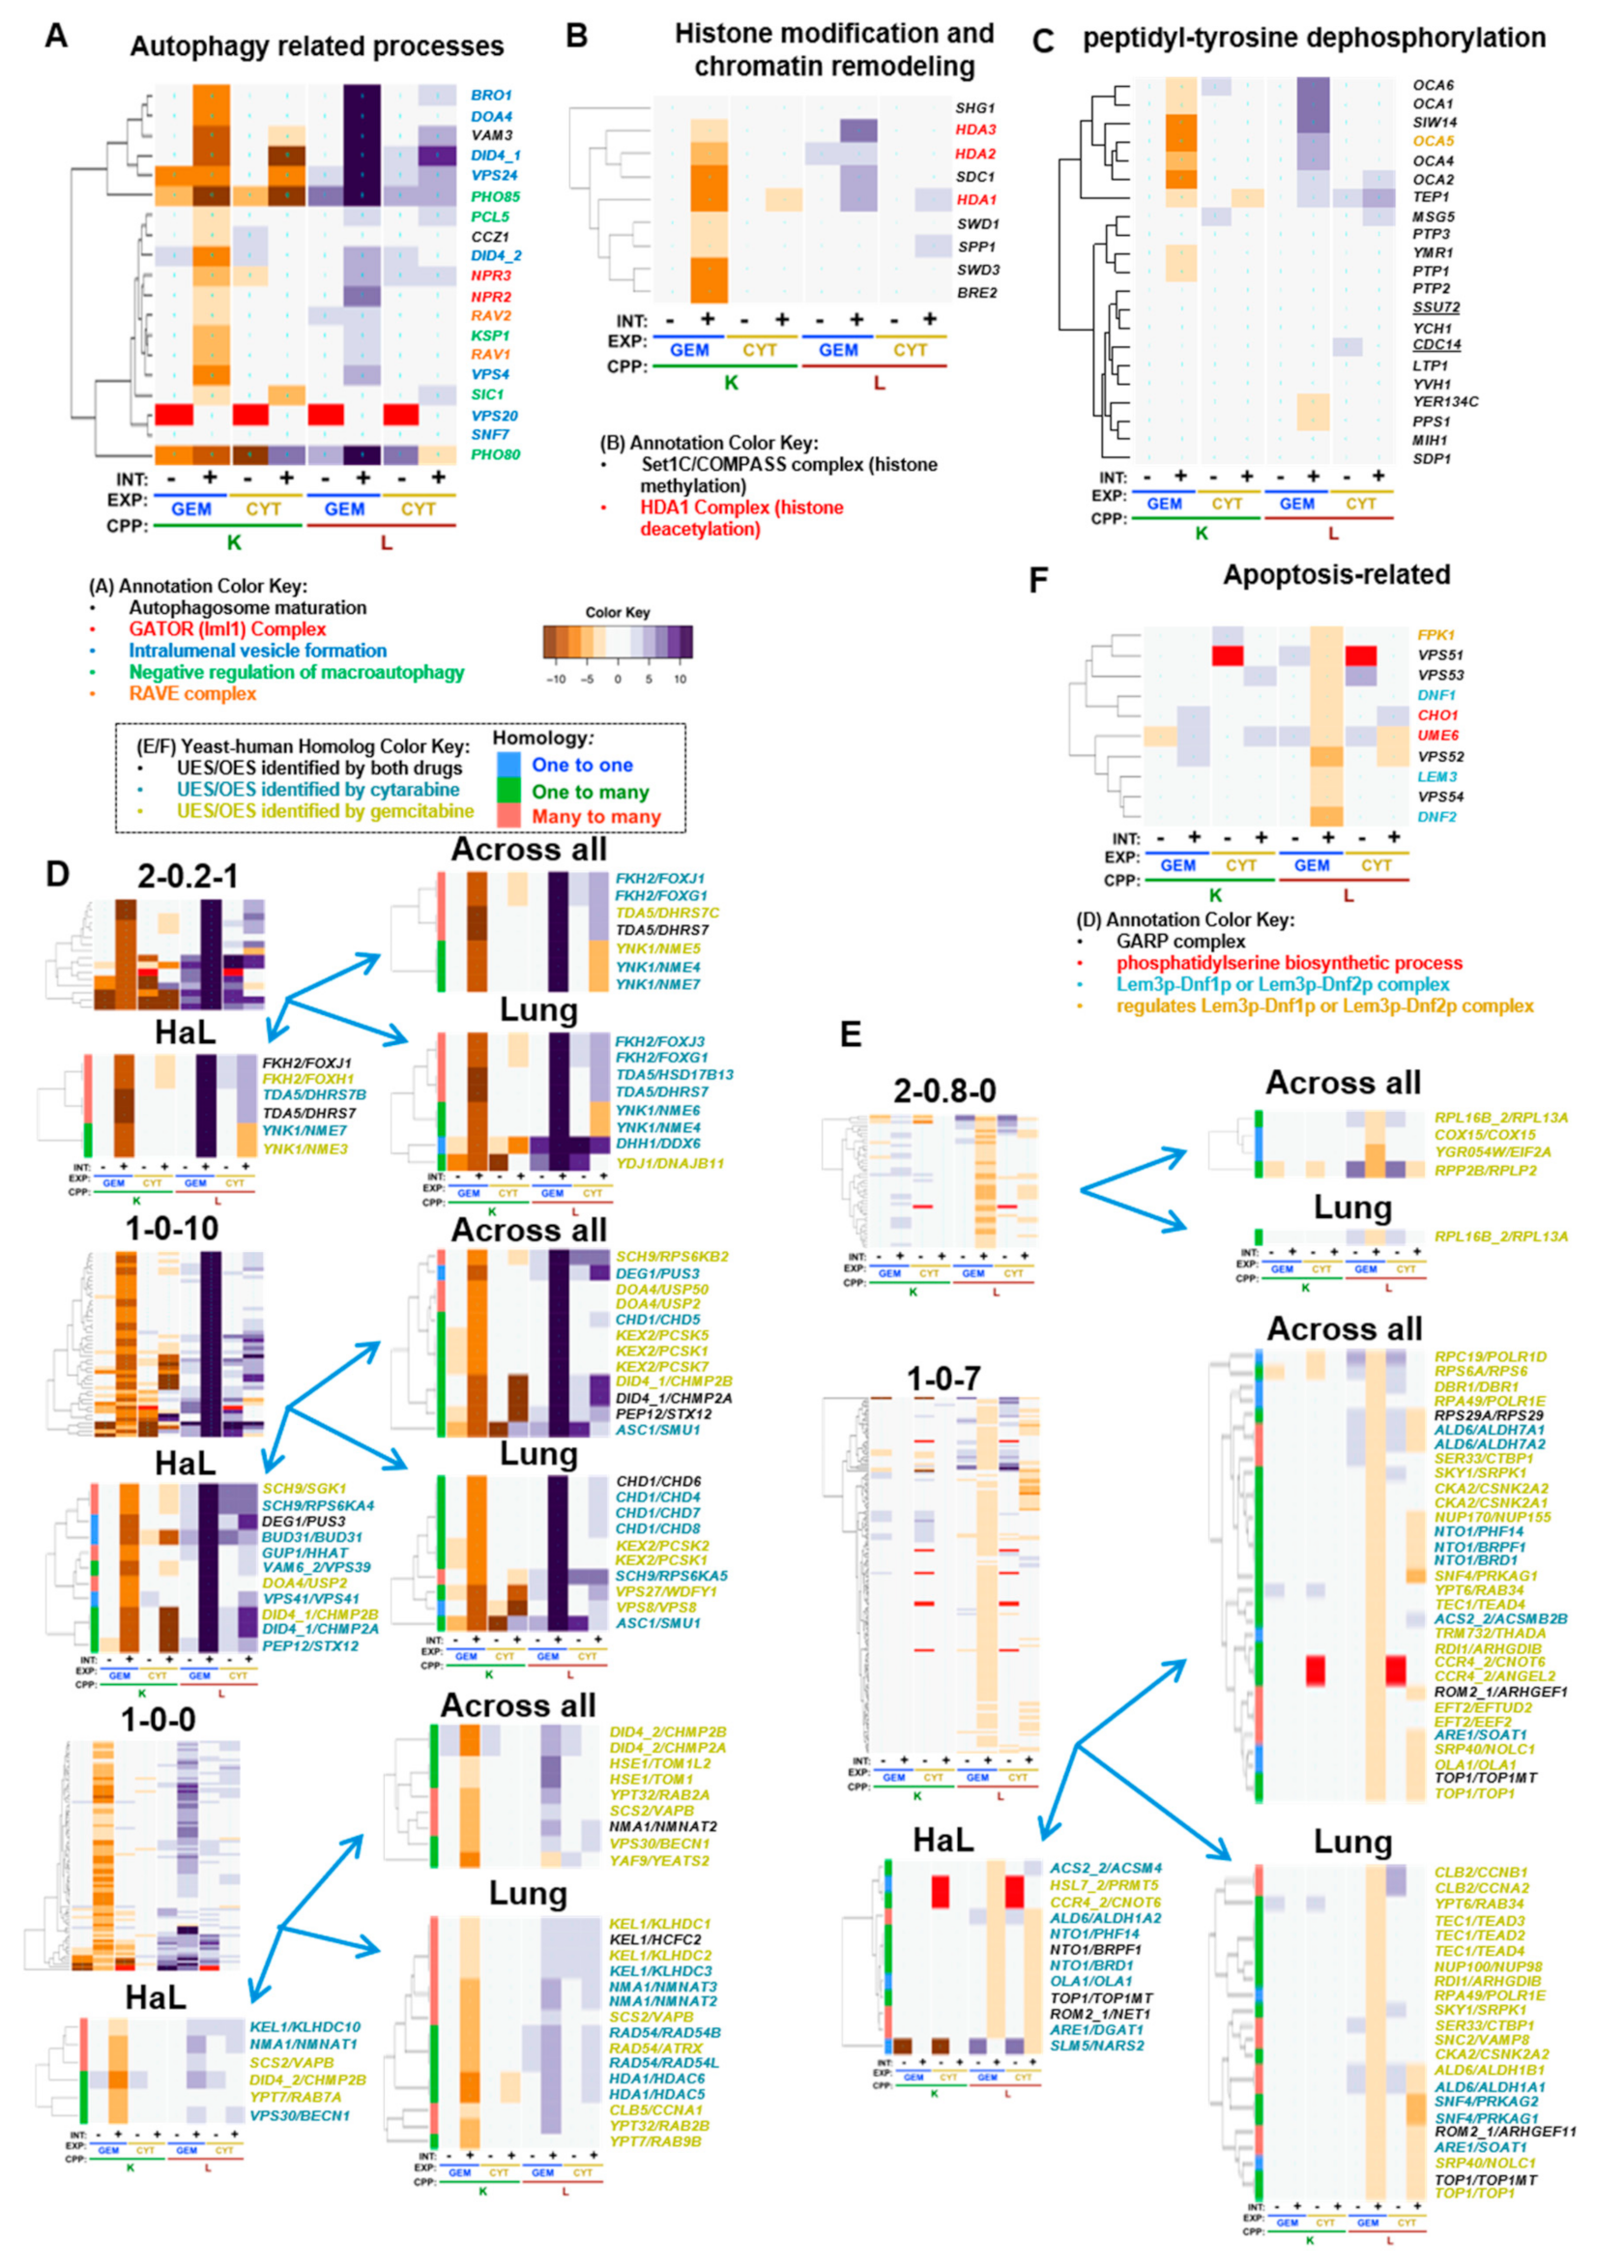
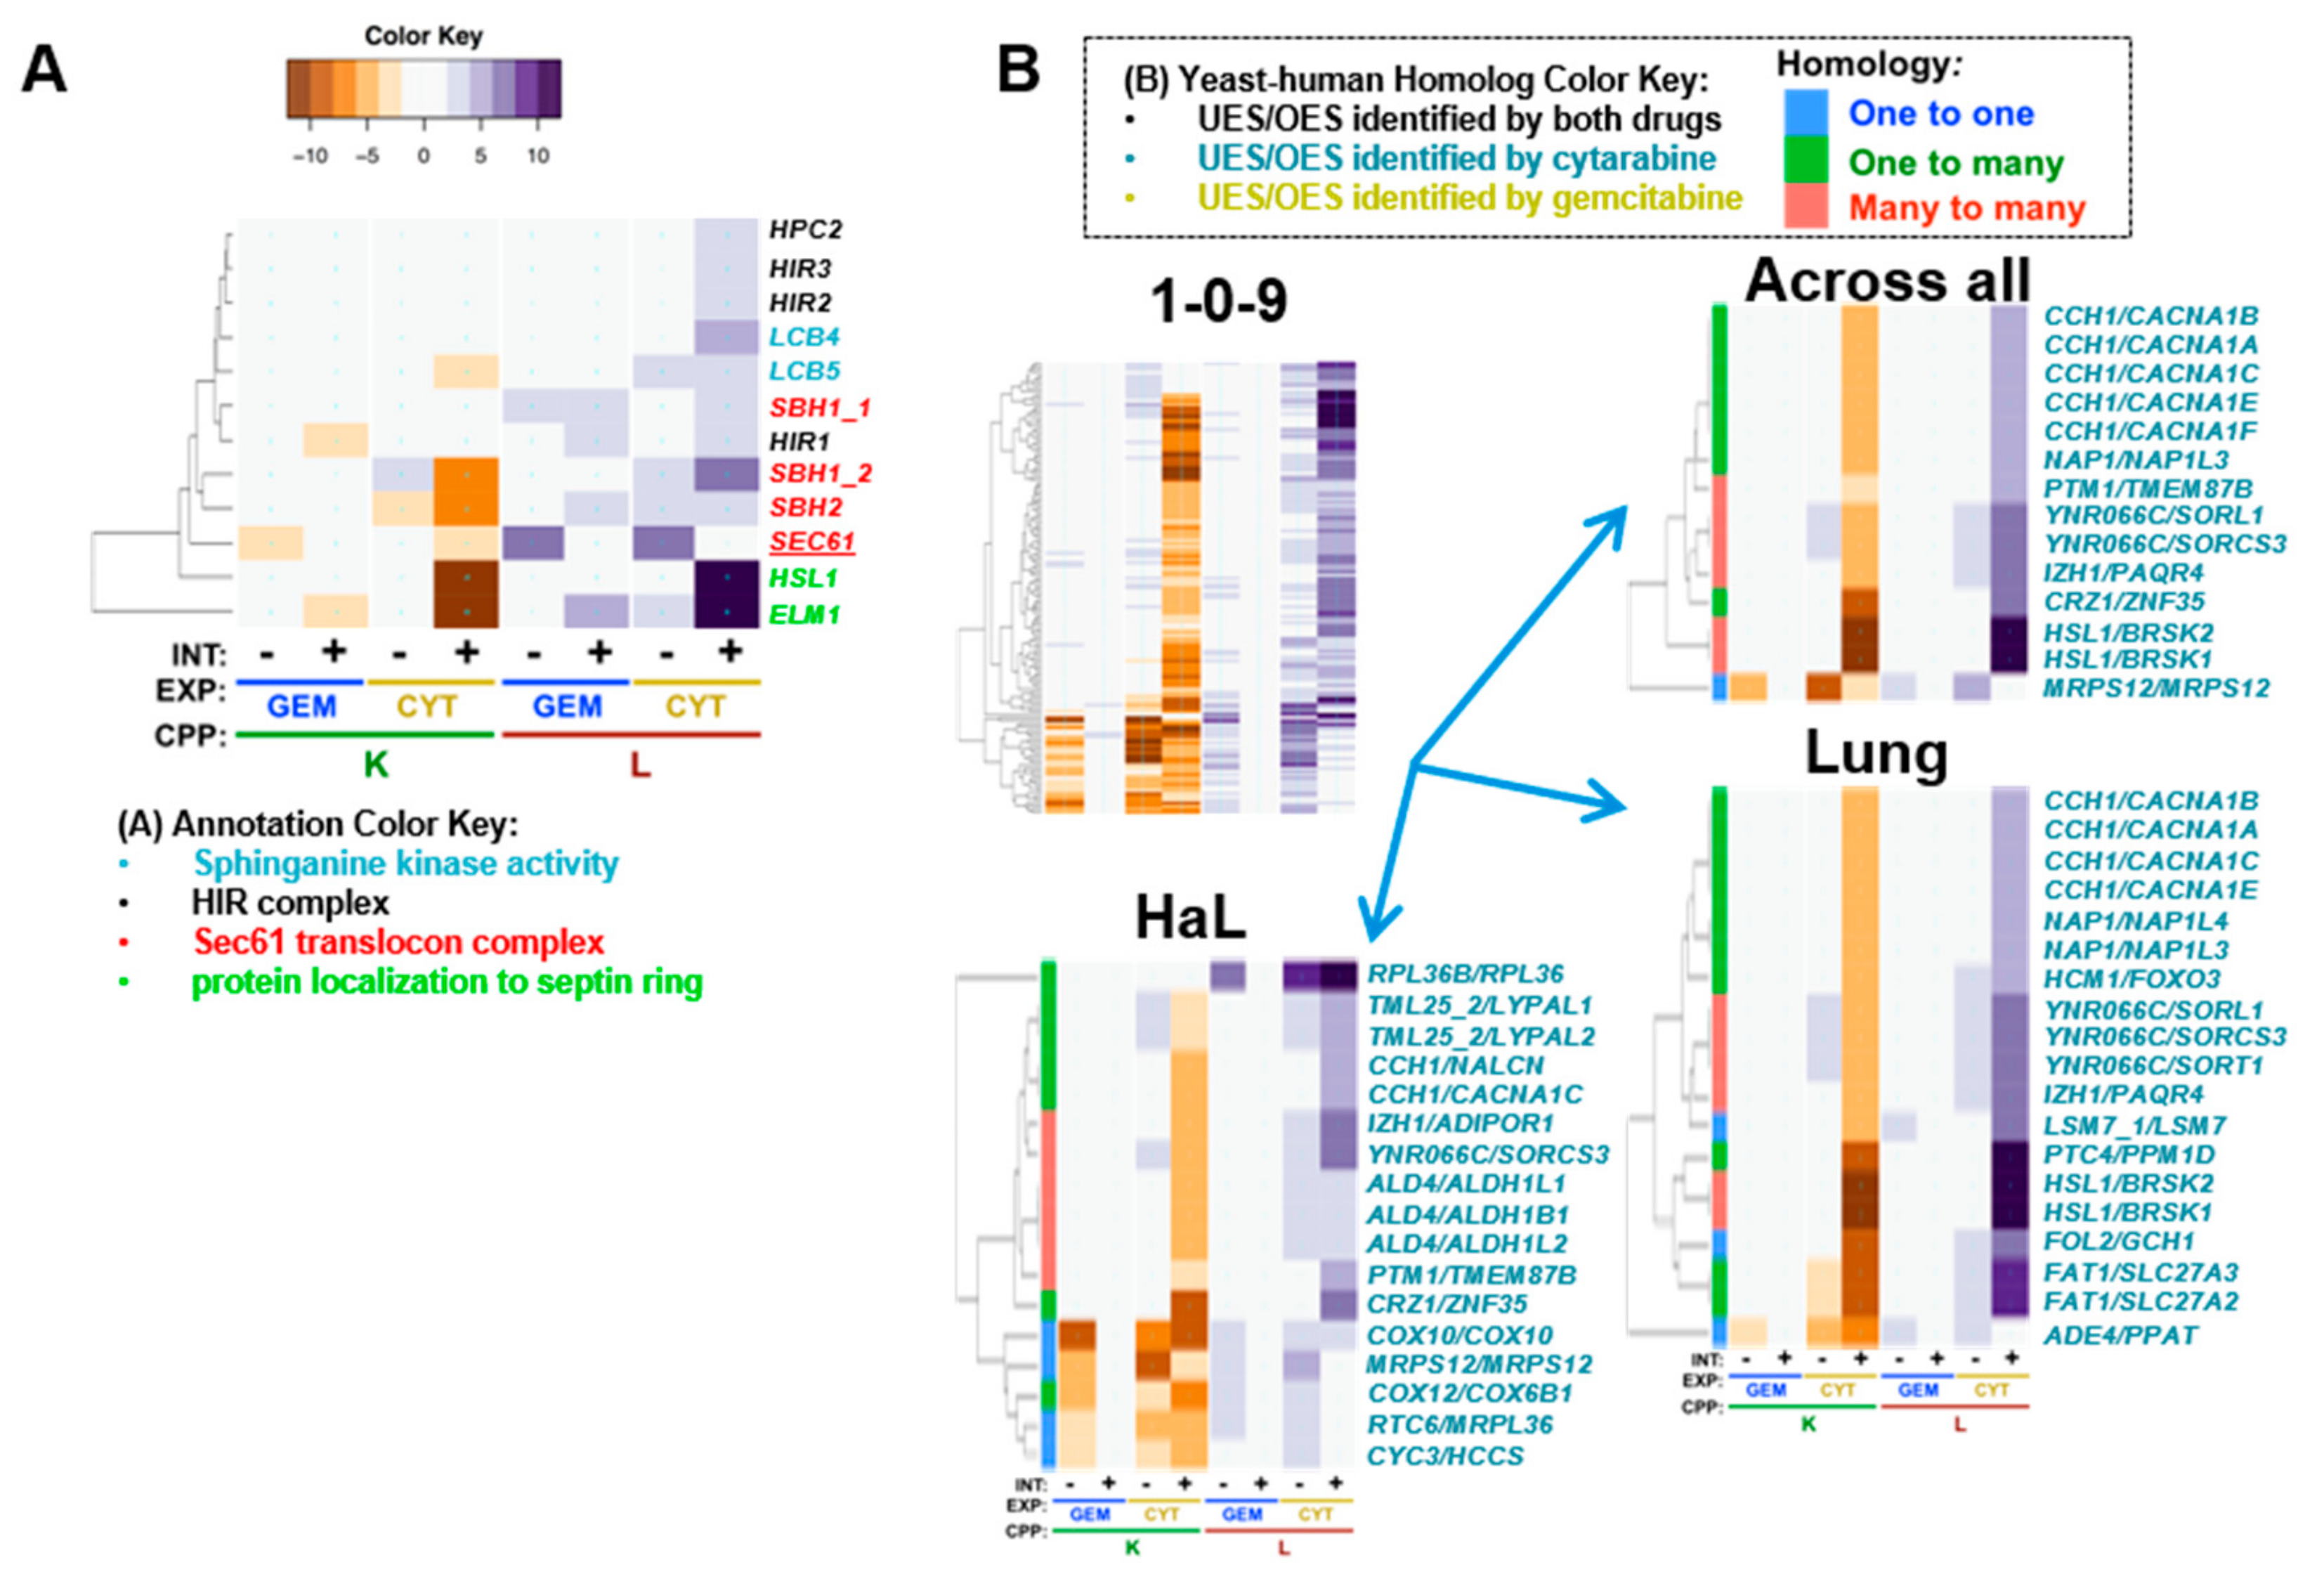
| GO Term | Drug | INT | O | Cluster | Genes in Term | p-Value | Genes | Fig. | GTA Gem L | GTA Cyt L |
|---|---|---|---|---|---|---|---|---|---|---|
| Ubp3-Bre5 deubiquitination complex | Both | Enh | C | 2-0.2-0 | 2/2 | 2.57 × 10⁻⁵ | UBP3:BRE5 | Figure 5D | 19.8 | 14.32 |
| positive regulation of DNA-dependent DNA replication initiation | Both | Enh | P | 1-0-2 | 3/4 | 2.09 × 10⁻⁴ | RFM1:FKH2:SUM1 | Figure 5B | 15.7 | 4.9 |
| Mre11 complex | Both | Enh | C | 2-0.14-1 | 2/3 | 5.66 × 10⁻⁴ | RAD50:XRS2 | Figure 5B | 13.7 | 26.6 |
| HOPS complex | Both | Enh | C | 2-0.14-1 | 2/7 | 3.94 × 10⁻³ | PEP3:VPS33 | Figure 5D | 12.0 | 4.8 |
| CORVET complex | Both | Enh | C | 2-0.14-1 | 2/7 | 3.94 × 10⁻³ | PEP3:VPS33 | Figure 5D | 10.4 | 4.3 |
| RecQ helicase-Topo III complex | Both | Enh | C | 1-0-14 | 2/3 | 3.31 × 10⁻³ | SGS1:RMI1 | Figure 5B | 7.5 | 14.6 |
| GET complex | Both | Enh | C | 2-0.14-0 | 2/3 | 4.68 × 10⁻⁴ | GET1:GET2 | Figure 5D | 3.3 | 18.6 |
| DNA integrity checkpoint | Both | Enh | P | 1-0-14 | 4/40 | 3.85 × 10⁻³ | DUN1:RAD17:RAD24:SGS1 | Figure 5A | 4.8 | 4.8 |
| α-glucoside transmembrane transporter activity | Cyt | Enh | F | 2-0.17-3 | 2/2 | 5.98 × 10⁻³ | MAL31:MAL11 | Figure 7A | −0.7 | 2.2 |
| intralumenal vesicle formation | Gem | Enh | P | 1-0-10 | 3/7 | 2.90 × 10⁻³ | DOA4:VPS24:BRO1 | Figure 6A | 9.0 | 1.6 |
| HDA1 complex | Gem | Enh | C | 1-0-0 | 2/3 | 7.08 × 10⁻² | HDA1:HDA3 | Figure 6B | 4.8 | 0.3 |
| Swr1 complex | Gem | Enh | C | 1-0-11 | 3/12 | 3.46 × 10⁻² | SWC3:VPS71:SWR1 | Figure 6B | 2.9 | −1.6 |
| peptidyl-tyrosine dephosphorylation | Gem | Enh | P | 1-0-0 | 5/20 | 2.18 × 10⁻³ | OCA2:SIW14:OCA1:OCA4:OCA6 | Figure 6C | 1.5 | 0.5 |
| Set1C/COMPASS complex | Gem | Enh | C | 1-0-0 | 3/6 | 5.74 × 10⁻³ | SDC1:SWD3:BRE2 | Figure 6B | 1.0 | 0.6 |
| phospholipid-translocating ATPase activity | Gem | Sup | F | 1-0-8 | 3/7 | 9.70 × 10⁻³ | DRS2:LEM3:DNF2 | Figure 6D | −1.6 | −0.9 |
| Term | Drug | INT_Type | Ont | Cluster | p-Value | Genes | Fig. | Gem GTA_K | Gem GTA_L | Cyt GTA_K | Cyt GTA_L |
|---|---|---|---|---|---|---|---|---|---|---|---|
| checkpoint clamp complex | Both | Enh L/K | C | NA | NA | RAD17 | MEC3 | Figure 5B | −7.3 | 13.8 | −23.5 | 15.4 |
| HOPS complex | Both | Enh L/K | C | 2-0.14-1 | 3.94 × 10⁻³ | VPS16 | VPS8 | PEP3 | VPS41 | VPS33 | PEP5 | Figure 5D | −6.3 | 12.0 | −11.4 | 4.8 |
| Mre11 complex | Both | Enh L/K | C | 2-0.14-1 | 5.66 × 10⁻⁴ | MRE11 | RAD50 | XRS2 | Figure 5B | −8.8 | 13.7 | −39.3 | 26.6 |
| RecQ helicase-Topo III complex | Both | Enh L/K | C | 1-0-14 | 3.31 × 10⁻³ | RMI1 | SGS1 | TOP3 | Figure 5B | −7.7 | 7.5 | −24.7 | 14.6 |
| Ubp3-Bre5 deubiquitination complex | Both | Enh L/K | C | 2-0.2-0 | 2.57 × 10⁻⁵ | UBP3 | BRE5 | Figure 5D | −9.2 | 19.8 | −16.9 | 14.3 |
| vesicle fusion with vacuole | Both | Enh L/K | P | NA | NA | VAM3 | VPS33 | Figure 5D | −7.4 | 13.3 | −11.4 | 7.1 |
| Sec61 translocon complex | Cyt | Enh K | C | NA | NA | SEC61 | SBH2 | Figure 7A | −0.4 | 1.1 | −5.1 | 1.9 |
| HIR complex | Cyt | Enh L | C | NA | NA | HIR1 | HIR2 | HPC2 | HIR3 | Figure 7A | −1.0 | 1.0 | −0.6 | 2.5 |
| sphinganine kinase activity | Cyt | Enh L | F | NA | NA | LCB4 | LCB5 | Figure 7A | −0.1 | 0.3 | −1.2 | 3.9 |
| protein localization to septin ring | Cyt | Enh L/K | P | NA | NA | ELM1 | HSL1 | Figure 7A | −1.3 | 2.5 | −17.8 | 21.9 |
| autophagosome maturation | Gem | Enh K | P | NA | NA | VAM3 | CCZ1 | Figure 6A | −5.6 | 7.7 | −1.6 | 2.5 |
| Elongator holoenzyme complex | Gem | Enh K | C | NA | NA | TUP1 | ELP4 | ELP2 | IKI3 | IKI1 | ELP3 | ELP6 | Figure S4C | −3.6 | 3.4 | −2.6 | 2.5 |
| ESCRT I complex | Gem | Enh K | C | NA | NA | STP22 | VPS28 | SRN2 | MVB12 | Figure 5D | −6.9 | 9.1 | −0.8 | 2.5 |
| negative regulation of macroautophagy | Gem | Enh K | P | NA | NA | PHO85 | PHO80 | KSP1 | PCL5 | SIC1 | Figure 6A | −5.8 | 9.4 | −4.1 | 1.8 |
| protein urmylation | Gem | Enh K | P | NA | NA | ELP2 | UBA4 | NCS2 | URM1 | URE2 | ELP6 | Figure S4C | −3.7 | 1.5 | 1.0 | 1.2 |
| CORVET complex | Gem | Enh L/K | C | 2-0.14-1 | 3.94 × 10⁻³ | VPS16 | VPS8 | PEP3 | VPS41 | VPS33 | VPS3 | PEP5 | Figure 5D | −6.6 | 10.4 | −10.4 | 4.3 |
| ESCRT-0 complex | Gem | Enh L/K | C | NA | NA | VPS27 | HSE1 | Figure 5D | −5.7 | 10.4 | −3.9 | 2.6 |
| HDA1 complex | Gem | Enh L/K | C | 1-0-0 | 7.08 × 10⁻² | HDA3 | HDA1 | HDA2 | Figure 6B | −4.8 | 4.8 | −0.6 | 0.3 |
| GATOR (Iml1) complex | Gem | Enh L/K | C | NA | NA | NPR2 | NPR3 | Figure 6A | −4.4 | 6.4 | 1.0 | 2.2 |
| intralumenal vesicle formation | Gem | Enh L/K | P | 1-0-10 | 2.90 × 10⁻³ | VPS20 | VPS24 | BRO1 | DOA4 | VPS4 | SNF7 | Figure 6A | −5.7 | 9.0 | −1.8 | 1.6 |
| positive regulation of DNA-dependent DNA replication initiation | Gem | Enh L/K | P | 1-0-2 | 2.09 × 10⁻⁴ | SUM1 | FKH2 | RFM1 | FKH1 | Figure 5B | −8.1 | 15.7 | −2.4 | 4.9 |
| RAVE complex | Gem | Enh L/K | C | NA | NA | RAV1 | RAV2 | Figure 6A | −4.2 | 3.5 | 0.6 | −0.2 |
| GARP complex | Gem | Sup L | C | NA | NA | VPS51 | VPS53 | VPS54 | VPS52 | Figure 6D | 1.7 | −3.4 | 1.5 | −1.0 |
| Lem3p-Dnf1p complex | Gem | Sup L | C | NA | NA | DNF1 | LEM3 | Figure 6D | 1.6 | −3.4 | −0.1 | 0.2 |
| phosphatidylserine biosynthetic process | Gem | Sup L | C | NA | NA | DEP1 | CHO1 | UME6 | Figure 6D | 2.6 | −3.7 | 0.8 | −0.3 |
| Gene (Yeast/Human) | Process/Complex | Description (Human) | Ref | Nucleoside Analog Relevance |
|---|---|---|---|---|
| RAD24/RAD17 | DNA damage checkpoint | RAD17 checkpoint clamp loader component | [79] | Depletion of RAD17 sensitizes pancreatic cancer cells to gemcitabine |
| RAD50/RAD50 | Mre11 complex | RAD50 double strand break repair protein | [127] | Depletion of human Rad50 sensitizes Ataxia-telangiectasia (AT) fibroblasts to gemcitabine |
| HDA1/HDAC6 | Hda1 complex; histone deacetylation | histone deacetylase 6 | [160,165] | HDAC inhibitors enhance sensitivity to gemcitabine in pancreatic cancer cells and are associated with reduction of HDAC6; HDAC6 inhibition induces apoptosis in cytarabine treated AML cells |
| RAD54/ATRX | Chromatin remodeling | ATRX, chromatin remodeler | [168] | Glioma patients with IDH1 mutations and loss of ATRX had improved response to gemcitabine plus radiation therapy |
| KEX2/PCSK7 | serine-type endopeptidase activity | proprotein convertase subtilisin/kexin type 7 | [179] | Overexpressed in gemcitabine resistant pancreatic cancer cell lines |
| YNK1/NME5 | Nucleoside diphosphate phosphorylation | NME/NM23 family member 5 | [182] | Depletion of NME5 sensitizes gemcitabine-resistant cancer cell lines to gemcitabine |
| VPS30/BECN1 | Autophagy | beclin 1 | [170] | Depletion of BECN1 sensitizes pancreatic cancer stem cells to gemcitabine |
| LCB4/5/CERKL | sphinganine kinase activity | ceramide kinase like | [138,264] | CERKL stabilizes SIRT1, SIRT1 chemical inhibition sensitizes acute myeloid leukemia cells to cytarabine |
© 2019 by the authors. Licensee MDPI, Basel, Switzerland. This article is an open access article distributed under the terms and conditions of the Creative Commons Attribution (CC BY) license (http://creativecommons.org/licenses/by/4.0/).
Share and Cite
Santos, S.M.; Icyuz, M.; Pound, I.; William, D.; Guo, J.; McKinney, B.A.; Niederweis, M.; Rodgers, J.; Hartman, J.L., IV. A Humanized Yeast Phenomic Model of Deoxycytidine Kinase to Predict Genetic Buffering of Nucleoside Analog Cytotoxicity. Genes 2019, 10, 770. https://doi.org/10.3390/genes10100770
Santos SM, Icyuz M, Pound I, William D, Guo J, McKinney BA, Niederweis M, Rodgers J, Hartman JL IV. A Humanized Yeast Phenomic Model of Deoxycytidine Kinase to Predict Genetic Buffering of Nucleoside Analog Cytotoxicity. Genes. 2019; 10(10):770. https://doi.org/10.3390/genes10100770
Chicago/Turabian StyleSantos, Sean M., Mert Icyuz, Ilya Pound, Doreen William, Jingyu Guo, Brett A. McKinney, Michael Niederweis, John Rodgers, and John L. Hartman, IV. 2019. "A Humanized Yeast Phenomic Model of Deoxycytidine Kinase to Predict Genetic Buffering of Nucleoside Analog Cytotoxicity" Genes 10, no. 10: 770. https://doi.org/10.3390/genes10100770