Host Gene Expression of Macrophages in Response to Feline Coronavirus Infection

 ,
,  ,
,
Abstract
1. Introduction
2. Materials and Methods
2.1. Cell Culture
2.2. Animal Procedures
2.3. Monocyte Isolation
2.4. Viral Infection for Transcriptome
2.5. Quality Control of RNA Sequence Data
2.6. Alignment Against Reference Transcriptomes
2.7. Differential Expression
2.8. Gene Enrichment Analyses Using Both GO Terms and KEGG Pathways
3. Results
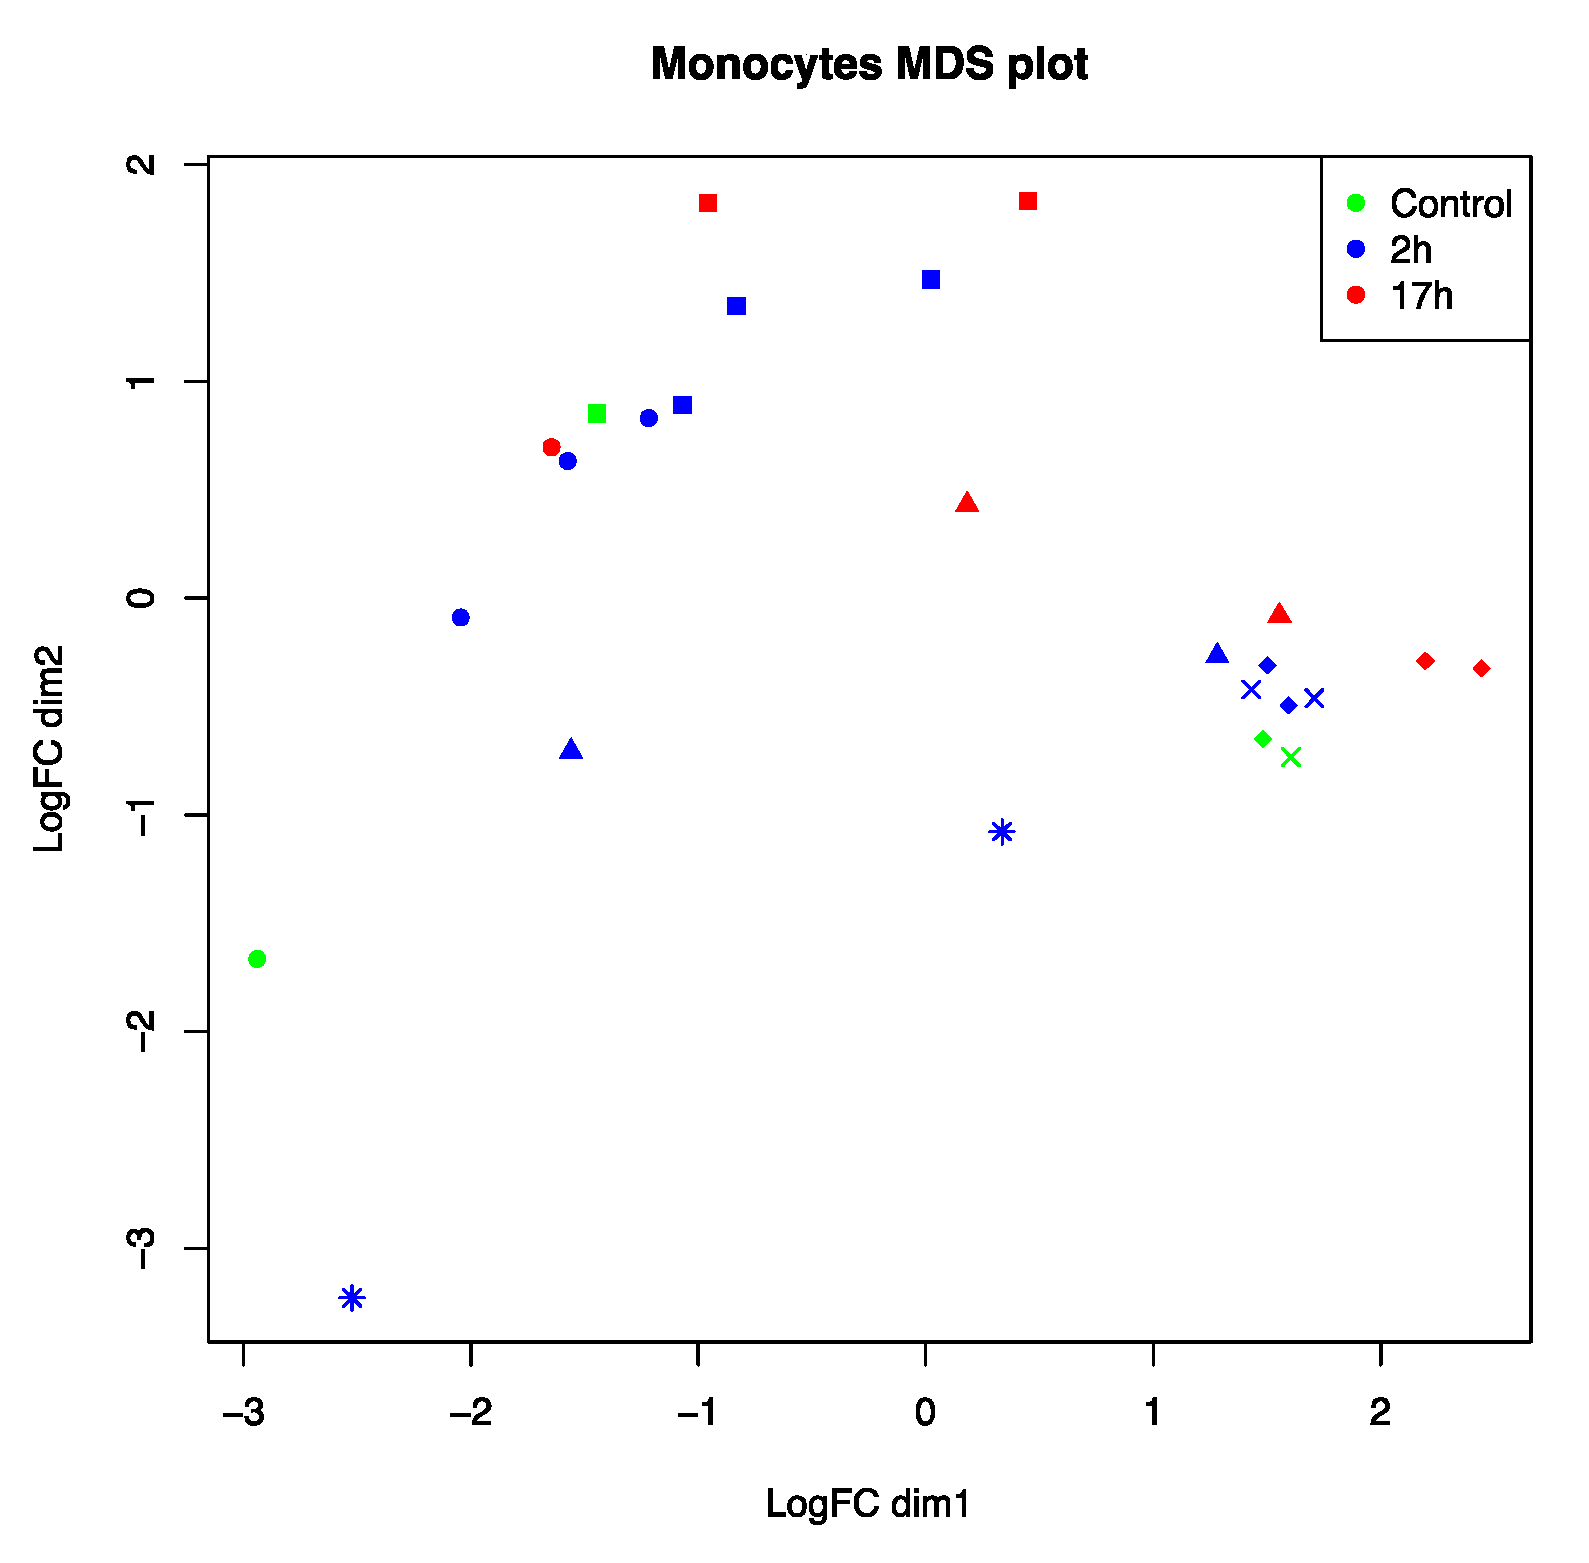
3.1. Host Responses Are Unique to Individual Cats with Several Clusters Present
3.2. Analysis of the Presence of Viral RNA in Infected Macrophages and CRFK
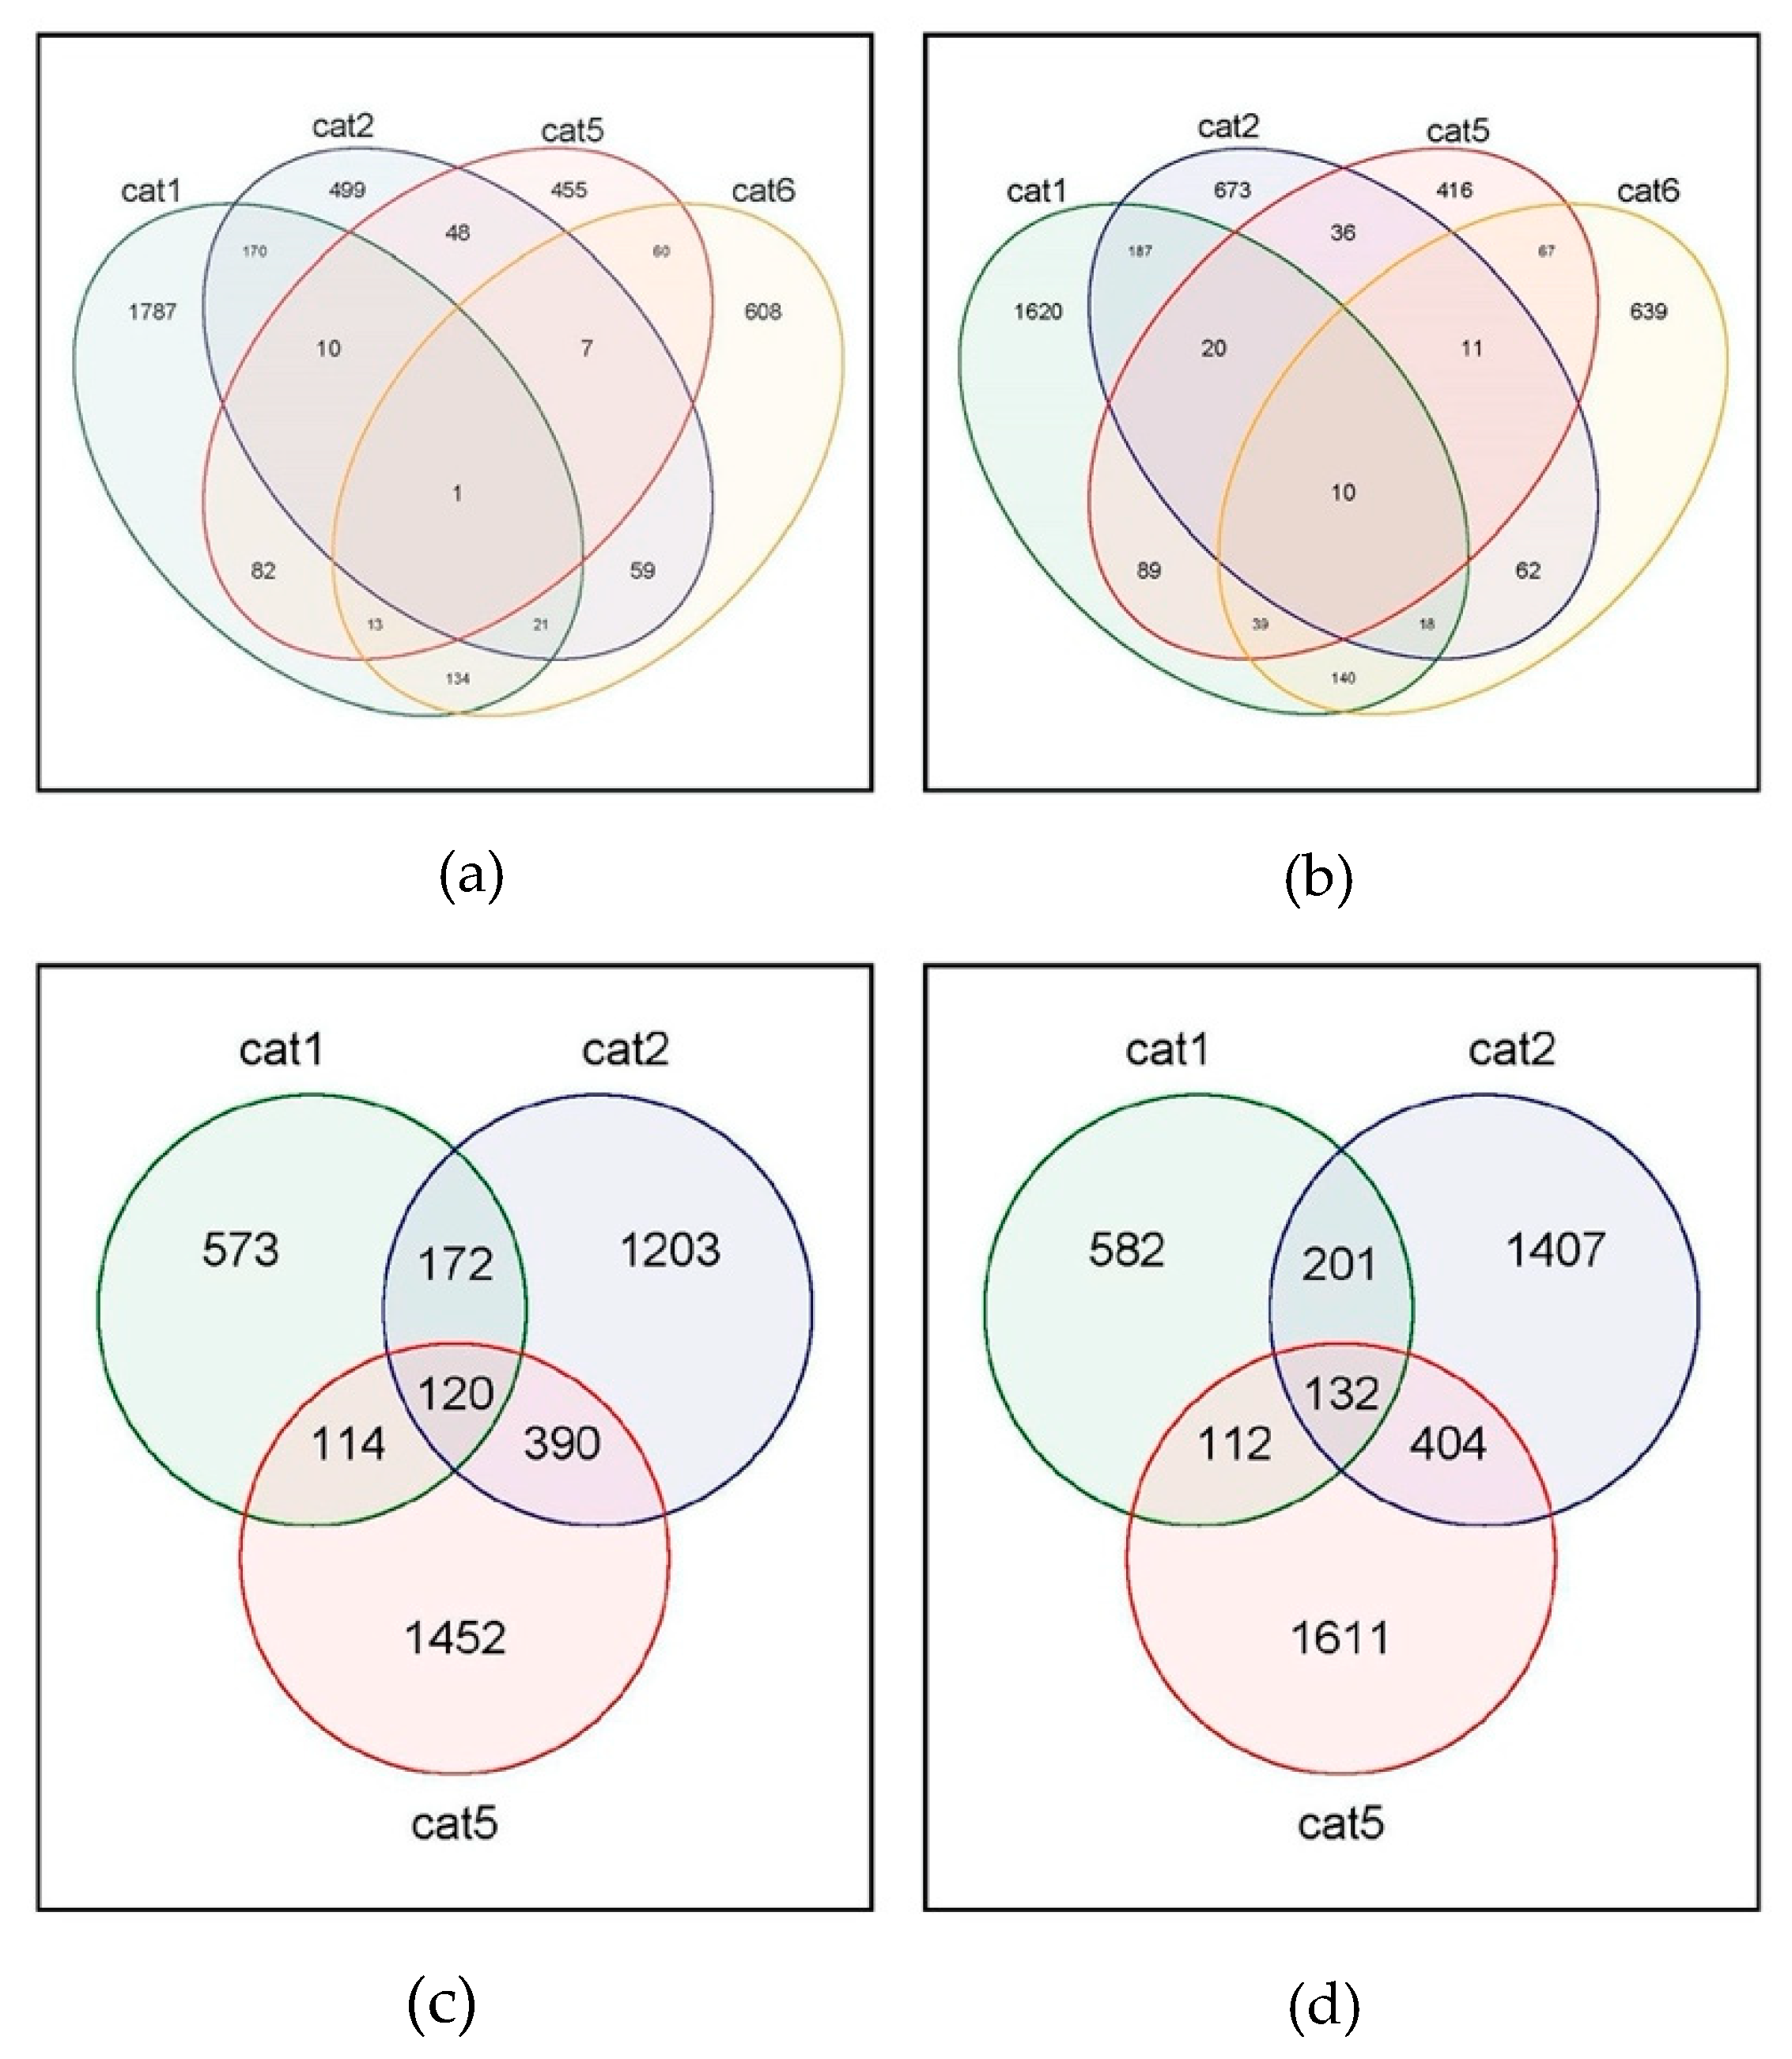
3.3. Host Transcriptome Analysis Shows Cat Specific Responses to FIPV
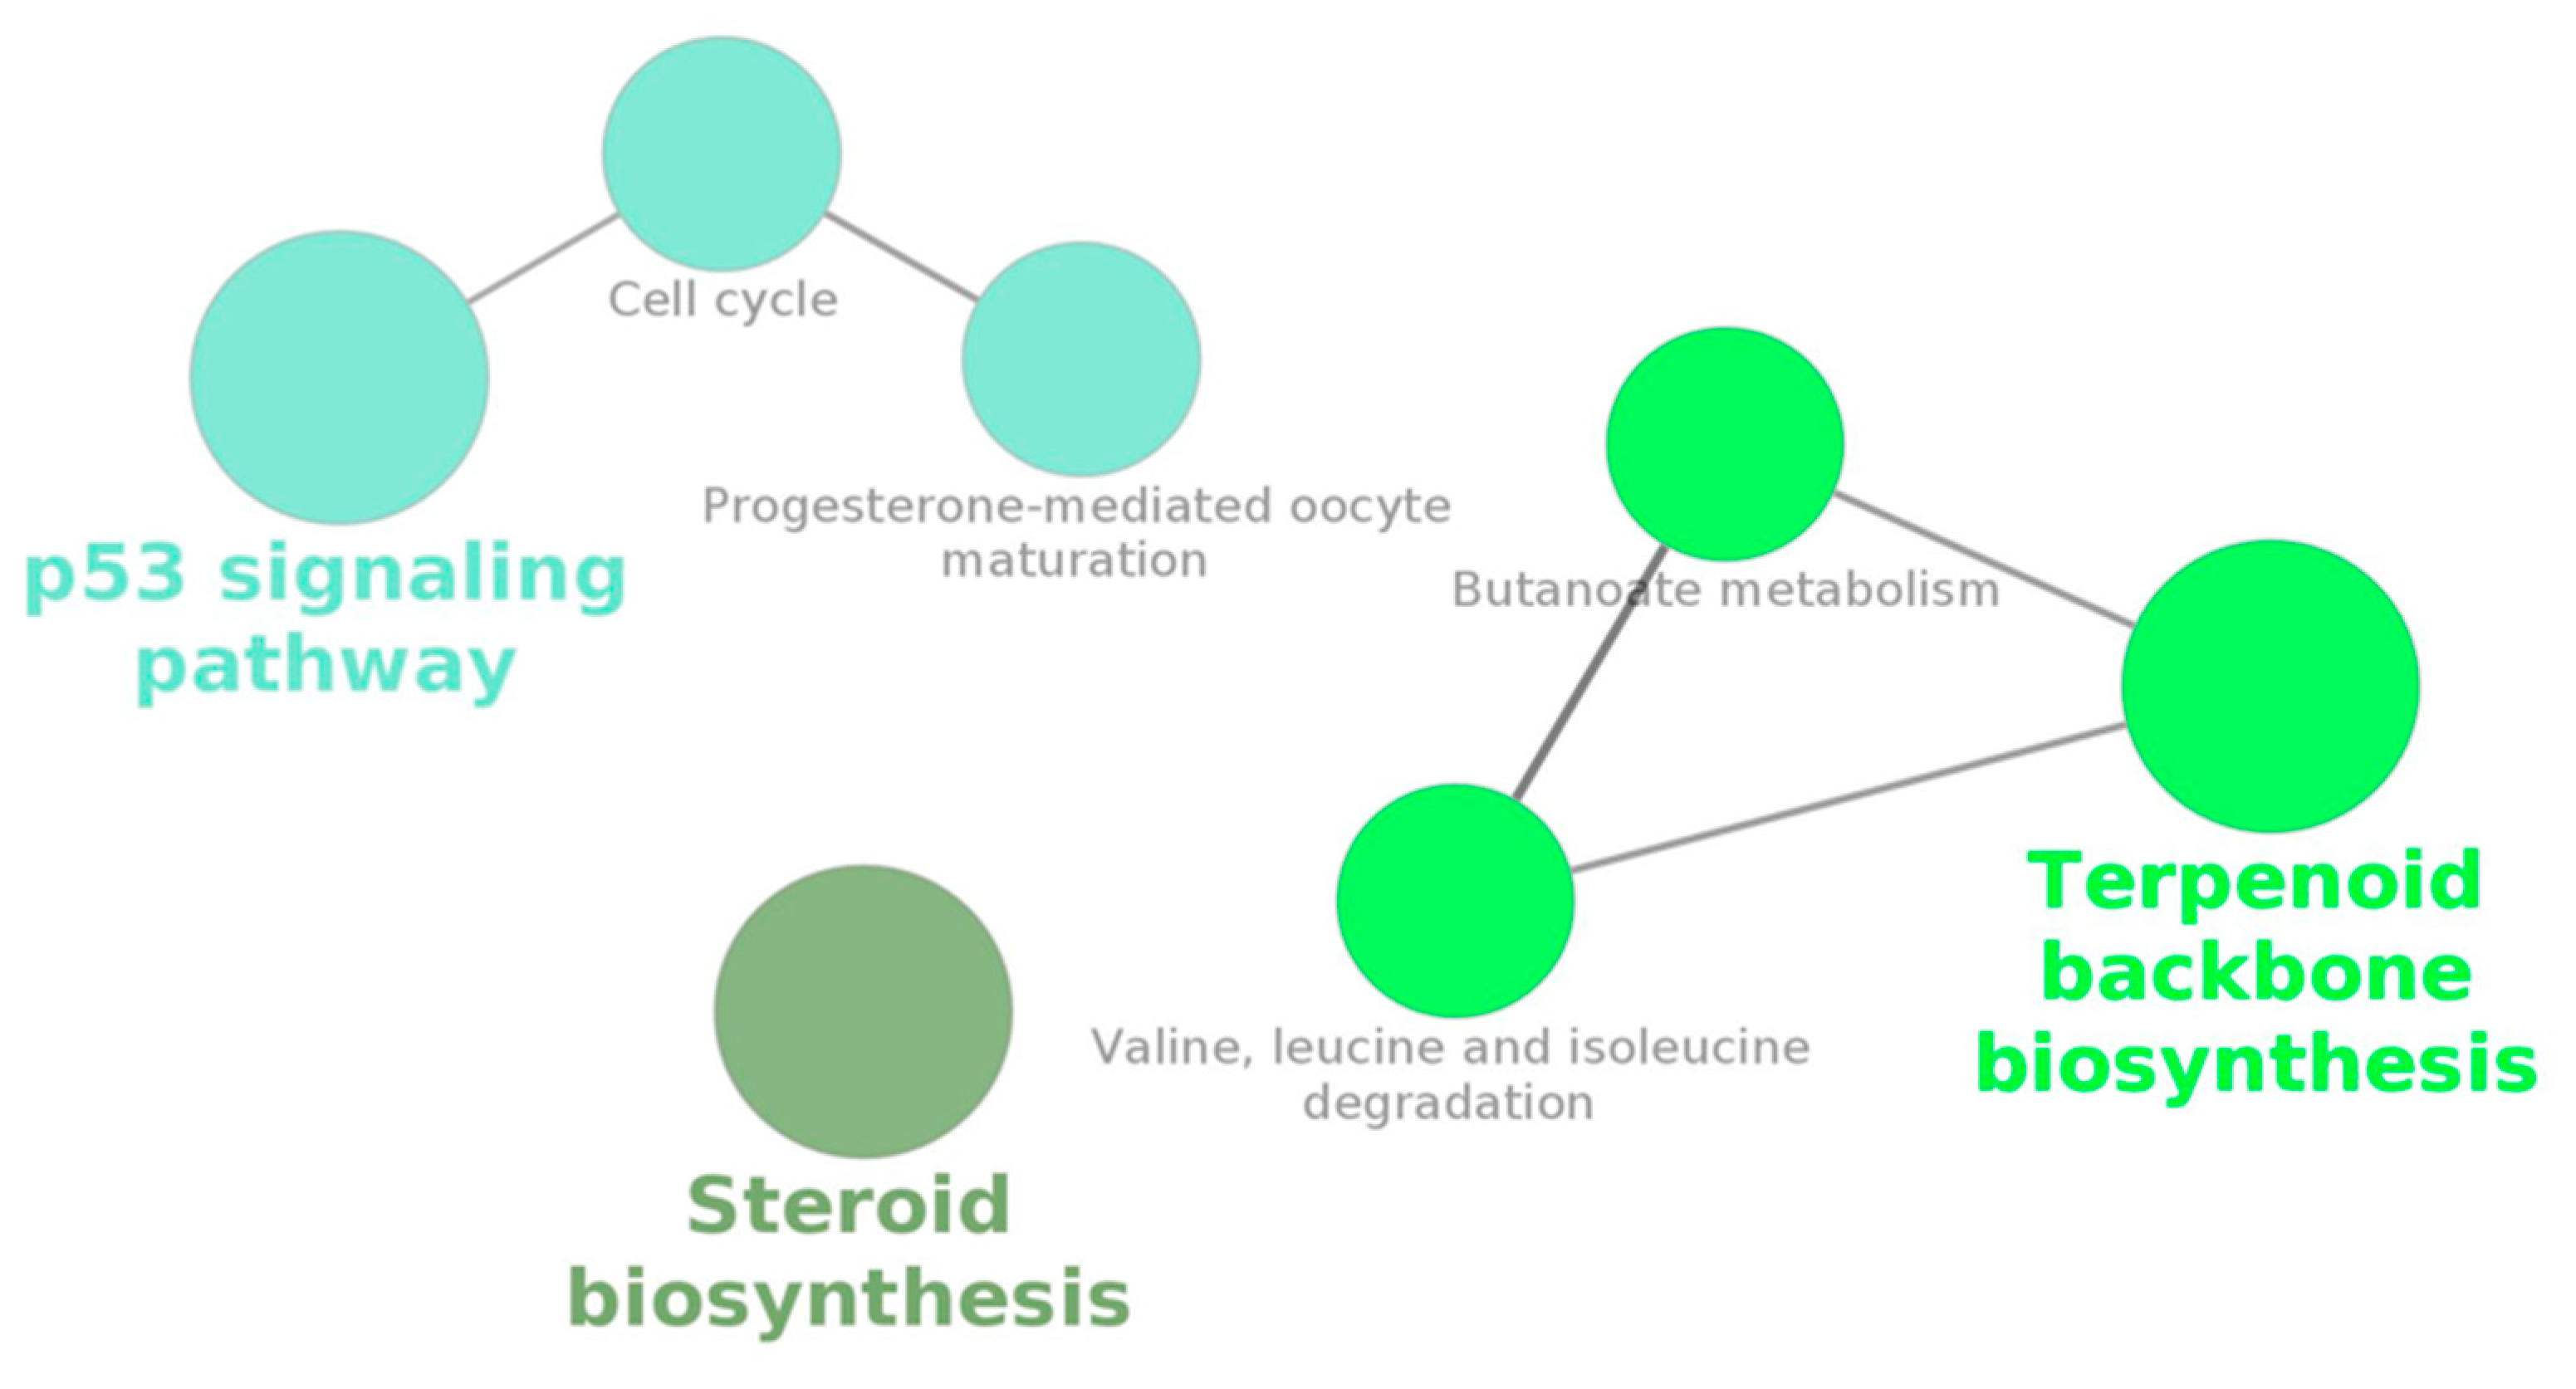
3.4. Gene Enrichment for Pathway Analysis and Ontology
4. Discussion
5. Conclusions
Author Contributions
Funding
Conflicts of Interest
Appendix A

| Gene Identifier | Gene Name |
|---|---|
| NM_001009200.1 | TNF receptor superfamily member 4 |
| NM_001009209.1 | interleukin 10 |
| NM_001009253.1 | CD80 molecule |
| XM_003980782.4 | transforming growth factor beta induced |
| XM_003981485.5 | CD74 molecule, transcript variant X1 |
| XM_003981616.5 | growth arrest and DNA damage inducible beta |
| XM_003984354.4 | limb bud and heart development, transcript variant X1 |
| XM_003986416.5 | PR/SET domain 1, transcript variant X1 |
| XM_003987780.4 | serine and arginine rich splicing factor 5, transcript variant X2 |
| XM_003987833.5 | NPC intracellular cholesterol transporter 2 |
| XM_003990035.4 | peroxiredoxin 1 |
| XM_003990688.5 | glycophorin C (Gerbich blood group) |
| XM_003994088.5 | ribosomal protein S24, transcript variant X6 |
| XM_003995273.5 | carnosine dipeptidase 2, transcript variant X1 |
| XM_003996781.5 | post-GPI attachment to proteins 3, transcript variant X1 |
| XM_003998055.5 | metallothionein-1 |
| XM_003999680.5 | T-cell surface glycoprotein CD1b |
| XM_006928964.4 | bromodomain and PHD finger containing 1, transcript variant X9 |
| XM_006929396.3 | transmembrane protein 140, transcript variant X2 |
| XM_006929637.3 | ribonucleic acid export 1, transcript variant X1 |
| XM_006929792.2 | AAR2 splicing factor homolog, transcript variant X1 |
| XM_006930307.4 | BCL2-like 11, transcript variant X1 |
| XM_006930765.3 | cathepsin B, transcript variant X2 |
| XM_006931414.4 | nucleoporin 153, transcript variant X3 |
| XM_006931511.2 | interferon regulatory factor 4, transcript variant X3 |
| XM_006932723.3 | mitochondrial ribosomal protein L52, transcript variant X5 |
| XM_006932762.3 | ring finger protein 31, transcript variant X2 |
| XM_006933673.2 | microspherule protein 1, transcript variant X4 |
| XM_006934848.4 | Rab geranylgeranyltransferase beta subunit, transcript variant X2 |
| XM_006934929.4 | coagulation factor III, tissue factor |
| XM_006935700.4 | diacylglycerol kinase delta, transcript variant X2 |
| XM_006938342.3 | ankyrin repeat and LEM domain containing 2, transcript variant X2 |
| XM_006938804.4 | elastin microfibril interfacer 2, transcript variant X1 |
| XM_006940068.4 | zinc finger protein 207, transcript variant X5 |
| XM_006941006.4 | CD37 molecule, transcript variant X5 |
| XM_006943029.3 | Rho GTPase activating protein 30, transcript variant X2 |
| XM_011282426.3 | ELOVL fatty acid elongase 5, transcript variant X3 |
| XM_011282594.3 | BCL2 associated transcription factor 1, transcript variant X3 |
| XM_011283077.3 | thrombospondin 1 |
| XM_011283790.3 | C-type lectin domain family 4 member A, transcript variant X2 |
| XM_011285121.3 | extracellular matrix protein 1, transcript variant X4 |
| XM_011285878.3 | ATPase 13A3, transcript variant X1 |
| XM_011286809.3 | CD44 molecule (Indian blood group), transcript variant X13 |
| XM_011290903.3 | coagulation factor V |
| XM_011291023.2 | quinone oxidoreductase-like protein 2, transcript variant X1 |
| XM_011291505.3 | poly(U) binding splicing factor 60, transcript variant X5 |
| XM_011291709.2 | RNA binding motif protein 3, transcript variant X1 |
| XM_019811387.2 | hypoxia upregulated 1, transcript variant X5 |
| XM_019811602.2 | family with sequence similarity 76 member B, transcript variant X1 |
| XM_019812261.2 | CD44 molecule (Indian blood group), transcript variant X2 |
| XM_019812263.2 | CD44 molecule (Indian blood group), transcript variant X3 |
| XM_019812267.2 | CD44 molecule (Indian blood group), transcript variant X7 |
| XM_019812269.2 | CD44 molecule (Indian blood group), transcript variant X10 |
| XM_019812271.2 | CD44 molecule (Indian blood group), transcript variant X12 |
| XM_019815319.2 | cold inducible RNA binding protein, transcript variant X2 |
| XM_019816708.2 | TSC complex subunit 1, transcript variant X3 |
| XM_019817540.2 | HEAT repeat containing 6, transcript variant X4 |
| XM_019817905.2 | signal transducer and activator of transcription 3, transcript variant X2 |
| XM_019819573.1 | heterogeneous nuclear ribonucleoprotein L, transcript variant X3 |
| XM_019819600.2 | ubiquitin-like modifier activating enzyme 2, transcript variant X2 |
| XM_019820314.1 | Sad1 and UNC84 domain containing 1, transcript variant X5 |
| XM_019821314.2 | signaling lymphocytic activation molecule family member 1, transcript variant X2 |
| XM_019821551.2 | cellular repressor of E1A stimulated genes 1, transcript variant X2 |
| XM_019822490.2 | ubiquitin associated protein 2-like, transcript variant X12 |
| XM_019822721.2 | YTH N6-methyladenosine RNA binding protein 3, transcript variant X5 |
| XM_019823162.2 | Src-like adaptor, transcript variant X1 |
| XM_019823774.1 | RNA binding motif protein 3, transcript variant X2 |
| XM_019823775.1 | RNA binding motif protein 3, transcript variant X4 |
| XM_019824901.1 | ubiquitin specific peptidase-like 1, transcript variant X5 |
| XM_019825689.2 | septin 7, transcript variant X7 |
| XM_019829713.2 | tubulin gamma complex associated protein 3, transcript variant X3 |
| XM_019832464.2 | EP300 interacting inhibitor of differentiation 1 |
| XM_019836585.2 | myocyte enhancer factor 2C, transcript variant X18 |
| XM_019836980.2 | Fas associated factor 1, transcript variant X1 |
| XM_019837265.1 | zinc finger ZZ-type containing 3, transcript variant X2 |
| XM_023238977.1 | pleckstrin homology-like domain family A member 2 |
| XM_023239126.1 | cell adhesion molecule 1, transcript variant X3 |
| XM_023240047.1 | calpain 1, transcript variant X1 |
| XM_023241058.1 | ornithine aminotransferase, transcript variant X2 |
| XM_023241314.1 | dynein axonemal heavy chain 10 |
| XM_023241586.1 | neurofibromin 2, transcript variant X2 |
| XM_023241792.1 | elastin microfibril interfacer 2, transcript variant X2 |
| XM_023241843.1 | SS18, nBAF chromatin remodeling complex subunit, transcript variant X3 |
| XM_023241980.1 | SMAD family member 7, transcript variant X2 |
| XM_023242133.1 | nuclear factor of activated T-cells 1, transcript variant X6 |
| XM_023242558.1 | thioredoxin |
| XM_023242850.1 | cold inducible RNA binding protein, transcript variant X3 |
| XM_023243143.1 | transcription factor 3, transcript variant X8 |
| XM_023243448.1 | lysine demethylase 6B, transcript variant X7 |
| XM_023244057.1 | methyltransferase-like 23, transcript variant X2 |
| XM_023244808.1 | TATA-box binding protein associated factor 15, transcript variant X3 |
| XM_023245178.1 | POU class 2 homeobox 2, transcript variant X8 |
| XM_023246400.1 | mitogen-activated protein kinase 8 interacting protein 3, transcript variant X16 |
| XM_023247978.1 | lamin A/C |
| XM_023248580.1 | family with sequence similarity 49 member B, transcript variant X6 |
| XM_023249097.1 | P2Y receptor family member 8, transcript variant X2 |
| XM_023249251.1 | dedicator of cytokinesis 11, transcript variant X1 |
| XM_023251817.1 | thymosin beta 10, transcript variant X2 |
| XM_023252054.1 | intersectin 2, transcript variant X7 |
| XM_023252112.1 | ornithine decarboxylase 1, transcript variant X2 |
| XM_023253670.1 | CD83 molecule, transcript variant X1 |
| XM_023253671.1 | CD83 molecule, transcript variant X2 |
| XM_023253685.1 | human immunodeficiency virus type I enhancer binding protein 1 |
| XM_023254138.1 | CD109 molecule, transcript variant X1 |
| XM_023254166.1 | synaptotagmin binding cytoplasmic RNA interacting protein, transcript variant X4 |
| XM_023255110.1 | transducing-like enhancer of split 3, transcript variant X7 |
| XM_023255350.1 | mitogen-activated protein kinase 6, transcript variant X2 |
| XM_023255486.1 | regulator of microtubule dynamics 3, transcript variant X3 |
| XM_023255629.1 | HECT domain E3 ubiquitin protein ligase 1, transcript variant X5 |
| XM_023256852.1 | cancer susceptibility 1, transcript variant X7 |
| XM_023256920.1 | dynamin-1-like, transcript variant X6 |
| XM_023257772.1 | adaptor-related protein complex 3 beta 1 subunit, transcript variant X1 |
| XM_023258773.1 | ubiquitin specific peptidase 1, transcript variant X3 |
| XM_023258859.1 | G protein subunit gamma 5 |
| XM_023260612.1 | nuclear receptor subfamily 1 group D member 2 |
| XM_023260684.1 | trafficking kinesin protein 1, transcript variant X8 |
| XR_002736856.1 | tetraspanin 14, transcript variant X2 |
| XR_002737850.1 | uncharacterized LOC111557626, transcript variant X1 |
| XR_002740181.1 | Eukaryotic 18S ribosomal RNA |
| XR_890054.3 | heterogeneous nuclear ribonucleoprotein A2/B1, transcript variant X6 |
| Gene Identifier | Gene Name |
|---|---|
| XM_003981024.5 | splicing regulatory glutamic acid and lysine rich protein 1, transcript variant X1 |
| XM_003981036.5 | cyclin B1 |
| XM_003981430.5 | 3-hydroxy-3-methylglutaryl-CoA synthase 1, transcript variant X2 |
| XM_003981592.4 | centrosomal protein 72, transcript variant X2 |
| XM_003982742.5 | lanosterol 14-alpha demethylase, transcript variant X1 |
| XM_003982984.3 | aminoadipate-semialdehyde synthase, transcript variant X1 |
| XM_003984244.4 | cytoskeleton associated protein-2-like, transcript variant X1 |
| XM_003984844.5 | farnesyl-diphosphate farnesyltransferase 1, transcript variant X2 |
| XM_003984882.5 | methylsterol monooxygenase 1, transcript variant X1 |
| XM_003985082.5 | ELOVL fatty acid elongase 6, transcript variant X1 |
| XM_003986073.4 | FYVE, RhoGEF and PH domain containing 2, transcript variant X1 |
| XM_003987096.4 | cyclin B2, transcript variant X2 |
| XM_003988112.5 | optineurin, transcript variant X7 |
| XM_003988333.5 | cell division cycle associated 3, transcript variant X1 |
| XM_003988595.5 | Rap guanine nucleotide exchange factor 3, transcript variant X1 |
| XM_003988664.3 | trophinin associated protein |
| XM_003990222.5 | zinc finger RANBP2-type containing 2, transcript variant X1 |
| XM_003992405.5 | myelin protein zero like-3, transcript variant X1 |
| XM_003993771.3 | 7-dehydrocholesterol reductase, transcript variant X1 |
| XM_003995047.4 | NDC80, kinetochore complex component |
| XM_003995401.5 | transmembrane protein 2, transcript variant X2 |
| XM_003995673.4 | Rho guanine nucleotide exchange factor 39 |
| XM_003996487.4 | sperm associated antigen 5, transcript variant X2 |
| XM_003996771.5 | SH3 and cysteine rich domain 2, transcript variant X1 |
| XM_003998762.5 | Polo-like kinase 1 |
| XM_003999323.5 | NIMA related kinase 2 |
| XM_003999347.5 | abnormal spindle microtubule assembly, transcript variant X2 |
| XM_004000594.4 | kinesin family member 4A |
| XM_004000604.5 | mediator complex subunit 12 |
| XM_006927499.4 | fms-related tyrosine kinase 4, transcript variant X2 |
| XM_006928617.3 | phosphodiesterase 4C, transcript variant X3 |
| XM_006929641.4 | aurora kinase A |
| XM_006932356.4 | Nei-like DNA glycosylase 1, transcript variant X1 |
| XM_006934172.3 | G2 and S-phase expressed 1, transcript variant X1 |
| XM_006934388.4 | zinc finger and BTB domain containing 40, transcript variant X2 |
| XM_006935662.3 | nuclear body protein SP140, transcript variant X7 |
| XM_006935975.4 | ribosomal oxygenase 2, transcript variant X1 |
| XM_006936407.2 | DNA topoisomerase II binding protein 1, transcript variant X3 |
| XM_006937682.4 | Ras association domain family member 7, transcript variant X2 |
| XM_006938581.4 | LIF, interleukin 6 family cytokine, transcript variant X2 |
| XM_006939451.4 | NIMA related kinase 6, transcript variant X2 |
| XM_006939718.4 | KIAA0753 ortholog, transcript variant X7 |
| XM_006943087.3 | farnesyl diphosphate synthase, transcript variant X3 |
| XM_011281000.3 | VPS54, GARP complex subunit, transcript variant X1 |
| XM_011281524.3 | fibroblast growth factor receptor 1, transcript variant X6 |
| XM_011283442.3 | tyrosyl-DNA phosphodiesterase 1, transcript variant X1 |
| XM_011284205.3 | cytoskeleton associated protein 2 |
| XM_011284366.2 | DENN domain containing 6B, transcript variant X2 |
| XM_011287426.3 | centrosomal protein 55, transcript variant X3 |
| XM_011287724.3 | checkpoint kinase 2, transcript variant X2 |
| XM_011288029.3 | regulation of nuclear pre-mRNA domain containing 1A, transcript variant X1 |
| XM_011288421.2 | syntaxin binding protein 1, transcript variant X2 |
| XM_011289261.3 | sclerostin |
| XM_011289687.3 | carnitine palmitoyltransferase 1C, transcript variant X1 |
| XM_011290536.3 | F-box and leucine rich repeat protein 19, transcript variant X1 |
| XM_011290681.3 | brain-specific serine protease 4, transcript variant X4 |
| XM_011291526.3 | kinesin family member C2, transcript variant X2 |
| XM_019812837.2 | 7-dehydrocholesterol reductase, transcript variant X3 |
| XM_019813506.2 | poly(ADP-ribose) glycohydrolase, transcript variant X3 |
| XM_019816169.1 | talin 1, transcript variant X2 |
| XM_019817080.2 | discs large MAGUK scaffold protein 4, transcript variant X9 |
| XM_019817127.2 | aurora kinase B, transcript variant X3 |
| XM_019817247.2 | angiopoietin-like 6, transcript variant X2 |
| XM_019817546.2 | synergin gamma, transcript variant X8 |
| XM_019817554.1 | acetyl-CoA carboxylase alpha, transcript variant X5 |
| XM_019817596.2 | proline rich 11, transcript variant X3 |
| XM_019817950.2 | ETS variant 4, transcript variant X5 |
| XM_019819207.2 | interferon regulatory factor 3, transcript variant X3 |
| XM_019820028.2 | fucokinase, transcript variant X1 |
| XM_019821899.1 | complement C3d receptor 2, transcript variant X3 |
| XM_019821902.1 | complement C3d receptor 2, transcript variant X6 |
| XM_019822306.2 | upstream transcription factor 1, transcript variant X4 |
| XM_019824070.1 | centromere protein I |
| XM_019826681.2 | TPX2, microtubule nucleation factor, transcript variant X7 |
| XM_019829073.2 | alpha kinase 1, transcript variant X4 |
| XM_019830601.2 | peroxisomal biogenesis factor 6, transcript variant X3 |
| XM_019830890.2 | TTK protein kinase, transcript variant X6 |
| XM_019831446.2 | acetyl-CoA acetyltransferase 2 |
| XM_019834535.2 | apolipoprotein L domain containing 1, transcript variant X1 |
| XM_019834543.2 | apolipoprotein L domain containing 1, transcript variant X8 |
| XM_019835370.2 | apoptotic peptidase activating factor 1, transcript variant X1 |
| XM_019836058.2 | nephrocystin 4, transcript variant X2 |
| XM_019839257.2 | lanosterol synthase, transcript variant X3 |
| XM_023239847.1 | telomerase reverse transcriptase, transcript variant X11 |
| XM_023239925.1 | fatty acid desaturase 2, transcript variant X1 |
| XM_023240698.1 | chondroitin sulfate N-acetylgalactosaminyltransferase 2, transcript variant X8 |
| XM_023241280.1 | acetoacetyl-CoA synthetase, transcript variant X2 |
| XM_023241432.1 | HECT domain E3 ubiquitin protein ligase 4, transcript variant X2 |
| XM_023242979.1 | vav guanine nucleotide exchange factor 2, transcript variant X7 |
| XM_023243604.1 | zinc finger and BTB domain containing 4, transcript variant X3 |
| XM_023243877.1 | myosin XVIIIA, transcript variant X20 |
| XM_023244268.1 | ring finger protein 213, transcript variant X5 |
| XM_023244594.1 | centrobin, centriole duplication and spindle assembly protein, transcript variant X3 |
| XM_023244664.1 | acetyl-CoA carboxylase alpha, transcript variant X9 |
| XM_023244901.1 | mevalonate diphosphate decarboxylase, transcript variant X1 |
| XM_023245382.1 | dynamin 2, transcript variant X5 |
| XM_023245498.1 | dedicator of cytokinesis 6 |
| XM_023245844.1 | lipase E, hormone sensitive type, transcript variant X4 |
| XM_023245914.1 | DM1 locus, WD repeat containing, transcript variant X1 |
| XM_023246136.1 | LSM14A, mRNA processing body assembly factor, transcript variant X1 |
| XM_023246494.1 | cyclin F |
| XM_023247155.1 | chromosome E3 C16orf62 homolog, transcript variant X4 |
| XM_023248638.1 | protein tyrosine kinase 2, transcript variant X19 |
| XM_023249981.1 | tRNA nucleotidyl transferase 1, transcript variant X3 |
| XM_023250648.1 | EPH receptor B6, transcript variant X1 |
| XM_023250847.1 | protein tyrosine phosphatase, receptor type S, transcript variant X10 |
| XM_023250896.1 | insulin induced gene 1 |
| XM_023252016.1 | elastin microfibril interfacer 1 |
| XM_023252392.1 | pericentriolar material 1, transcript variant X15 |
| XM_023252891.1 | centromere protein E, transcript variant X7 |
| XM_023252992.1 | heterogeneous nuclear ribonucleoprotein D, transcript variant X6 |
| XM_023253738.1 | discoidin domain receptor tyrosine kinase 1, transcript variant X1 |
| XM_023253977.1 | ubiquitin protein ligase E3 component n-recognin 2, transcript variant X3 |
| XM_023254254.1 | cyclin dependent kinase 19, transcript variant X4 |
| XM_023254265.1 | FYN proto-oncogene, Src family tyrosine kinase, transcript variant X1 |
| XM_023255117.1 | kinesin family member 23, transcript variant X2 |
| XM_023255227.1 | HECT and RLD domain containing E3 ubiquitin protein ligase family member 1, transcript variant X3 |
| XM_023255500.1 | BUB1 mitotic checkpoint serine/threonine kinase B |
| XM_023255706.1 | DLG associated protein 5, transcript variant X1 |
| XM_023256274.1 | isopentenyl-diphosphate delta-isomerase 1, transcript variant X2 |
| XM_023256524.1 | cullin 2, transcript variant X1 |
| XM_023257105.1 | integrin subunit beta 7, transcript variant X5 |
| XM_023257126.1 | diacylglycerol kinase alpha, transcript variant X2 |
| XM_023257348.1 | thymopoietin, transcript variant X4 |
| XM_023257700.1 | casein kinase I, transcript variant X4 |
| XM_023257872.1 | Holliday junction recognition protein |
| XM_023259342.1 | plakophilin 4, transcript variant X6 |
| XM_023259713.1 | Obscurin-like 1, transcript variant X6 |
| XM_023260160.1 | cytoplasmic FMR1 interacting protein 2, transcript variant X2 |
| XR_002150997.2 | uncharacterized LOC109495548 |
| XR_002160083.2 | MFNG O-fucosylpeptide 3-beta-N-acetylglucosaminyltransferase, transcript variant X2 |
| XR_002737671.1 | phosphatidylinositol-4-phosphate 5-kinase-like 1, transcript variant X2 |
References
- Addie, D.D.; Jarrett, O. A study of naturally occurring feline coronavirus infections in kittens. Vet. Rec. 1992, 130, 133–137. [Google Scholar] [CrossRef]
- Pedersen, N.C. Serologic studies of naturally occurring feline infectious peritonitis. Am. J. Vet. Res. 1976, 37, 1449–1453. [Google Scholar]
- Cave, T.A.; Golder, M.C.; Simpson, J.; Addie, D.D. Risk factors for feline coronavirus seropositivity in cats relinquished to a UK rescue charity. J. Feline Med. Surg. 2004, 6, 53–58. [Google Scholar] [CrossRef] [PubMed]
- Drechsler, Y.; Alcaraz, A.; Bossong, F.J.; Collisson, E.W.; Diniz, P.P. Feline coronavirus in multicat environments. Vet. Clin. North. Am. Small Anim. Pract. 2011, 41, 1133–1169. [Google Scholar] [CrossRef] [PubMed]
- Pedersen, N.C.; Boyle, J.F.; Floyd, K.; Fudge, A.; Barker, J. An enteric coronavirus infection of cats and its relationship to feline infectious peritonitis. Am. J. Vet. Res. 1981, 42, 368–377. [Google Scholar]
- Foley, J.E.; Poland, A.; Carlson, J.; Pedersen, N.C. Risk factors for feline infectious peritonitis among cats in multiple-cat environments with endemic feline enteric coronavirus. J. Am. Vet. Med. Assoc. 1997, 210, 1313–1318. [Google Scholar] [PubMed]
- Pedersen, N.C. Feline Infectious Peritonitis. In Comparative Pathobiology of Viral Diseases; Olsen, R.G., Krakowka, S., Blakeslee, J.R., Jr., Eds.; CRC Press: Boca Raton, FL, USA, 2019. [Google Scholar]
- Dewerchin, H.L.; Cornelissen, E.; Nauwynck, H.J. Replication of feline coronaviruses in peripheral blood monocytes. Arch. Virol. 2005, 150, 2483–2500. [Google Scholar] [CrossRef] [PubMed]
- Kipar, A.; Meli, M.L.; Baptiste, K.E.; Bowker, L.J.; Lutz, H. Sites of feline coronavirus persistence in healthy cats. J. Gen. Virol. 2010, 91, 1698–1707. [Google Scholar] [CrossRef]
- Vogel, L.; Van der Lubben, M.; te Lintelo, E.G.; Bekker, C.P.; Geerts, T.; Schuijff, L.S.; Grinwis, G.C.; Egberink, H.F.; Rottier, P.J. Pathogenic characteristics of persistent feline enteric coronavirus infection in cats. Vet. Res. 2010, 41, 71. [Google Scholar] [CrossRef]
- Pedersen, N.C.; Liu, H.; Scarlett, J.; Leutenegger, C.M.; Golovko, L.; Kennedy, H.; Kamal, F.M. Feline infectious peritonitis: Role of the feline coronavirus 3c gene in intestinal tropism and pathogenicity based upon isolates from resident and adopted shelter cats. Virus Res. 2012, 165, 17–28. [Google Scholar] [CrossRef]
- Pesteanu-Somogyi, L.D.; Radzai, C.; Pressler, B.M. Prevalence of feline infectious peritonitis in specific cat breeds. J. Feline Med. Surg. 2006, 8, 1–5. [Google Scholar] [CrossRef] [PubMed]
- Norris, J.M.; Bosward, K.L.; White, J.D.; Baral, R.M.; Catt, M.J.; Malik, R. Clinicopathological findings associated with feline infectious peritonitis in Sydney, Australia: 42 cases (1990–2002). Aust. Vet. J. 2005, 83, 666–673. [Google Scholar] [CrossRef] [PubMed]
- Tsai, H.Y.; Chueh, L.L.; Lin, C.N.; Su, B.L. Clinicopathological findings and disease staging of feline infectious peritonitis: 51 cases from 2003 to 2009 in Taiwan. J. Feline Med. Surg 2011, 13, 74–80. [Google Scholar] [CrossRef] [PubMed]
- Kiss, I.; Kecskemeti, S.; Tanyi, J.; Klingeborn, B.; Belak, S. Preliminary studies on feline coronavirus distribution in naturally and experimentally infected cats. Res. Vet. Sci 2000, 68, 237–242. [Google Scholar] [CrossRef] [PubMed]
- Pedersen, N.C. An overview of feline enteric coronavirus and infectious peritonitis virus infections. Feline Pract. 1995, 23, 7–20. [Google Scholar]
- Takano, T.; Nakaguchi, M.; Doki, T.; Hohdatsu, T. Antibody-dependent enhancement of serotype II feline enteric coronavirus infection in primary feline monocytes. Arch. Virol. 2017, 162, 3339–3345. [Google Scholar] [CrossRef] [PubMed]
- Hohdatsu, T.; Yamada, M.; Tominaga, R.; Makino, K.; Kida, K.; Koyama, H. Antibody-dependent enhancement of feline infectious peritonitis virus infection in feline alveolar macrophages and human monocyte cell line U937 by serum of cats experimentally or naturally infected with feline coronavirus. J. Vet. Med. Sci. 1998, 60, 49–55. [Google Scholar] [CrossRef]
- Takano, T.; Hohdatsu, T.; Hashida, Y.; Kaneko, Y.; Tanabe, M.; Koyama, H. A “possible” involvement of TNF-alpha in apoptosis induction in peripheral blood lymphocytes of cats with feline infectious peritonitis. Vet. Microbiol. 2007, 119, 121–131. [Google Scholar] [CrossRef]
- Kipar, A.; Meli, M.L.; Failing, K.; Euler, T.; Gomes-Keller, M.A.; Schwartz, D.; Lutz, H.; Reinacher, M. Natural feline coronavirus infection: Differences in cytokine patterns in association with the outcome of infection. Vet. Immunol. Immunopathol. 2006, 112, 141–155. [Google Scholar] [CrossRef]
- Dean, G.A.; Olivry, T.; Stanton, C.; Pedersen, N.C. In vivo cytokine response to experimental feline infectious peritonitis virus infection. Vet. Microbiol. 2003, 97, 1–12. [Google Scholar] [CrossRef]
- Kiss, I.; Poland, A.M.; Pedersen, N.C. Disease outcome and cytokine responses in cats immunized with an avirulent feline infectious peritonitis virus (FIPV)-UCD1 and challenge-exposed with virulent FIPV-UCD8. J. Feline Med. Surg. 2004, 6, 89–97. [Google Scholar] [CrossRef] [PubMed]
- de Groot-Mijnes, J.D.; van Dun, J.M.; van der Most, R.G.; de Groot, R.J. Natural history of a recurrent feline coronavirus infection and the role of cellular immunity in survival and disease. J. Virol. 2005, 79, 1036–1044. [Google Scholar] [CrossRef] [PubMed]
- Haagmans, B.L.; Egberink, H.F.; Horzinek, M.C. Apoptosis and T-cell depletion during feline infectious peritonitis. J. Virol. 1996, 70, 8977–8983. [Google Scholar] [CrossRef] [PubMed]
- Mehrbod, P.; Harun, M.S.; Shuid, A.N.; Omar, A.R. Transcriptome analysis of feline infectious peritonitis virus infection. Methods Mol. Biol. 2015, 1282, 241–250. [Google Scholar] [CrossRef] [PubMed]
- Harun, M.S.; Kuan, C.O.; Selvarajah, G.T.; Wei, T.S.; Arshad, S.S.; Hair Bejo, M.; Omar, A.R. Transcriptional profiling of feline infectious peritonitis virus infection in CRFK cells and in PBMCs from FIP diagnosed cats. Virol. J. 2013, 10, 329. [Google Scholar] [CrossRef]
- Watanabe, R.; Eckstrand, C.; Liu, H.; Pedersen, N.C. Characterization of peritoneal cells from cats with experimentally-induced feline infectious peritonitis (FIP) using RNA-seq. Vet. Res. 2018, 49, 81. [Google Scholar] [CrossRef]
- Goto-Koshino, Y.; Ohno, K.; Nakajima, M.; Mochizuki, H.; Kanemoto, H.; Tsujimoto, H. A rapid and simple method to obtain canine peripheral blood-derived macrophages. J. Vet. Med. Sci 2011, 73, 773–778. [Google Scholar] [CrossRef]
- Bolger, A.M.; Lohse, M.; Usadel, B. Trimmomatic: A flexible trimmer for Illumina sequence data. Bioinformatics 2014, 30, 2114–2120. [Google Scholar] [CrossRef]
- Bray, N.L.; Pimentel, H.; Melsted, P.; Pachter, L. Near-optimal probabilistic RNA-seq quantification. Nat. Biotechnol. 2016, 34, 525–527. [Google Scholar] [CrossRef]
- Tarazona, S.; Furio-Tari, P.; Turra, D.; Pietro, A.D.; Nueda, M.J.; Ferrer, A.; Conesa, A. Data quality aware analysis of differential expression in RNA-seq with NOISeq R/Bioc package. Nucleic Acids Res. 2015, 43, e140. [Google Scholar] [CrossRef]
- Ritchie, M.E.; Phipson, B.; Wu, D.; Hu, Y.; Law, C.W.; Shi, W.; Smyth, G.K. limma powers differential expression analyses for RNA-sequencing and microarray studies. Nucleic Acids Res. 2015, 43, e47. [Google Scholar] [CrossRef] [PubMed]
- Bindea, G.; Mlecnik, B.; Hackl, H.; Charoentong, P.; Tosolini, M.; Kirilovsky, A.; Fridman, W.H.; Pages, F.; Trajanoski, Z.; Galon, J. ClueGO: A Cytoscape plug-in to decipher functionally grouped gene ontology and pathway annotation networks. Bioinformatics 2009, 25, 1091–1093. [Google Scholar] [CrossRef] [PubMed]
- Shannon, P.; Markiel, A.; Ozier, O.; Baliga, N.S.; Wang, J.T.; Ramage, D.; Amin, N.; Schwikowski, B.; Ideker, T. Cytoscape: A software environment for integrated models of biomolecular interaction networks. Genome Res. 2003, 13, 2498–2504. [Google Scholar] [CrossRef]
- Smoot, M.E.; Ono, K.; Ruscheinski, J.; Wang, P.L.; Ideker, T. Cytoscape 2.8: New features for data integration and network visualization. Bioinformatics 2011, 27, 431–432. [Google Scholar] [CrossRef]
- Shirato, K.; Chang, H.W.; Rottier, P.J.M. Differential susceptibility of macrophages to serotype II feline coronaviruses correlates with differences in the viral spike protein. Virus Res. 2018, 255, 14–23. [Google Scholar] [CrossRef]
- Stoddart, C.A.; Scott, F.W. Intrinsic resistance of feline peritoneal macrophages to coronavirus infection correlates with in vivo virulence. J. Virol. 1989, 63, 436–440. [Google Scholar] [CrossRef]
- Pedersen, N.C. A review of feline infectious peritonitis virus infection: 1963-2008. J. Feline Med. Surg. 2009, 11, 225–258. [Google Scholar] [CrossRef]
- Poland, A.M.; Vennema, H.; Foley, J.E.; Pedersen, N.C. Two related strains of feline infectious peritonitis virus isolated from immunocompromised cats infected with a feline enteric coronavirus. J. Clin. Microbiol. 1996, 34, 3180–3184. [Google Scholar] [CrossRef]
- Chakraborty, P.; Vervelde, L.; Dalziel, R.G.; Wasson, P.S.; Nair, V.; Dutia, B.M.; Kaiser, P. Marek’s disease virus infection of phagocytes: A de novo in vitro infection model. J. Gen. Virol. 2017, 98, 1080–1088. [Google Scholar] [CrossRef]
- Takano, T.; Ohyama, T.; Kokumoto, A.; Satoh, R.; Hohdatsu, T. Vascular endothelial growth factor (VEGF), produced by feline infectious peritonitis (FIP) virus-infected monocytes and macrophages, induces vascular permeability and effusion in cats with FIP. Virus Res. 2011, 158, 161–168. [Google Scholar] [CrossRef]
- Denney, L.; Branchett, W.; Gregory, L.G.; Oliver, R.A.; Lloyd, C.M. Epithelial-derived TGF-beta1 acts as a pro-viral factor in the lung during influenza A infection. Mucosal Immunol. 2018, 11, 523–535. [Google Scholar] [CrossRef]
- He, T.S.; Chen, T.; Wang, D.D.; Xu, L.G. HAUS8 regulates RLRVISA antiviral signaling positively by targeting VISA. Mol. Med. Rep. 2018, 18, 2458–2466. [Google Scholar] [CrossRef]
- Martinand, C.; Montavon, C.; Salehzada, T.; Silhol, M.; Lebleu, B.; Bisbal, C. RNase L inhibitor is induced during human immunodeficiency virus type 1 infection and down regulates the 2-5A/RNase L pathway in human T cells. J. Virol. 1999, 73, 290–296. [Google Scholar] [CrossRef] [PubMed]
- Soderholm, S.; Kainov, D.E.; Ohman, T.; Denisova, O.V.; Schepens, B.; Kulesskiy, E.; Imanishi, S.Y.; Corthals, G.; Hintsanen, P.; Aittokallio, T.; et al. Phosphoproteomics to Characterize Host Response During Influenza A Virus Infection of Human Macrophages. Mol. Cell Proteomics 2016, 15, 3203–3219. [Google Scholar] [CrossRef] [PubMed]
- Chang, C.K.; Chen, C.J.; Wu, C.C.; Chen, S.W.; Shih, S.R.; Kuo, R.L. Cellular hnRNP A2/B1 interacts with the NP of influenza A virus and impacts viral replication. PLoS ONE 2017, 12, e0188214. [Google Scholar] [CrossRef] [PubMed]
- Dave, P.; George, B.; Balakrishnan, S.; Sharma, D.K.; Raheja, H.; Dixit, N.M.; Das, S. Strand-specific affinity of host factor hnRNP C1/C2 guides positive to negative-strand ratio in Coxsackievirus B3 infection. RNA Biol. 2019, 16, 1286–1299. [Google Scholar] [CrossRef]
- Yasunaga, J.; Lin, F.C.; Lu, X.; Jeang, K.T. Ubiquitin-specific peptidase 20 targets TRAF6 and human T cell leukemia virus type 1 tax to negatively regulate NF-kappaB signaling. J. Virol. 2011, 85, 6212–6219. [Google Scholar] [CrossRef]
- Junger, W.G. Immune cell regulation by autocrine purinergic signalling. Nat. Rev. Immunol. 2011, 11, 201–212. [Google Scholar] [CrossRef]
- Paoletti, A.; Raza, S.Q.; Voisin, L.; Law, F.; Pipoli da Fonseca, J.; Caillet, M.; Kroemer, G.; Perfettini, J.L. Multifaceted roles of purinergic receptors in viral infection. Microbes Infect. 2012, 14, 1278–1283. [Google Scholar] [CrossRef]
- Burbage, M.; Gasparrini, F.; Aggarwal, S.; Gaya, M.; Arnold, J.; Nair, U.; Way, M.; Bruckbauer, A.; Batista, F.D. Tuning of in vivo cognate B-T cell interactions by Intersectin 2 is required for effective anti-viral B cell immunity. Elife 2018, 7. [Google Scholar] [CrossRef]
- Cajee, U.F.; Hull, R.; Ntwasa, M. Modification by ubiquitin-like proteins: Significance in apoptosis and autophagy pathways. Int. J. Mol. Sci 2012, 13, 11804–11831. [Google Scholar] [CrossRef] [PubMed]
- Mahnke, J.; Schumacher, V.; Ahrens, S.; Kading, N.; Feldhoff, L.M.; Huber, M.; Rupp, J.; Raczkowski, F.; Mittrucker, H.W. Interferon Regulatory Factor 4 controls TH1 cell effector function and metabolism. Sci. Rep. 2016, 6, 35521. [Google Scholar] [CrossRef] [PubMed]
- Tjernlund, A.; Walther-Jallow, L.; Behbahani, H.; Screpanti, V.; Nowak, P.; Grandien, A.; Andersson, J.; Patterson, B.K. Leukemia inhibitor factor (LIF) inhibits HIV-1 replication via restriction of stat 3 activation. AIDS Res. Hum. Retroviruses 2007, 23, 398–406. [Google Scholar] [CrossRef] [PubMed]
- Spiegel, M.; Pichlmair, A.; Martinez-Sobrido, L.; Cros, J.; Garcia-Sastre, A.; Haller, O.; Weber, F. Inhibition of Beta interferon induction by severe acute respiratory syndrome coronavirus suggests a two-step model for activation of interferon regulatory factor 3. J. Virol. 2005, 79, 2079–2086. [Google Scholar] [CrossRef]
- Afonso, P.V.; Zamborlini, A.; Saib, A.; Mahieux, R. Centrosome and retroviruses: The dangerous liaisons. Retrovirology 2007, 4, 27. [Google Scholar] [CrossRef]
- Full, F.; van Gent, M.; Sparrer, K.M.J.; Chiang, C.; Zurenski, M.A.; Scherer, M.; Brockmeyer, N.H.; Heinzerling, L.; Stürzl, M.; Korn, K.; et al. Centrosomal protein TRIM43 restricts herpesvirus infection by regulating nuclear lamina integrity. Nat. Microbiol. 2019, 4, 164–176. [Google Scholar] [CrossRef]
- Naghavi, M.H.; Walsh, D. Microtubule Regulation and Function during Virus Infection. J. Virol. 2017, 91. [Google Scholar] [CrossRef]
- Wiede, F.; Shields, B.J.; Chew, S.H.; Kyparissoudis, K.; van Vliet, C.; Galic, S.; Tremblay, M.L.; Russell, S.M.; Godfrey, D.I.; Tiganis, T. T cell protein tyrosine phosphatase attenuates T cell signaling to maintain tolerance in mice. J. Clin. Investig. 2011, 121, 4758–4774. [Google Scholar] [CrossRef]
- Karaky, M.; Fedetz, M.; Potenciano, V.; Andres-Leon, E.; Codina, A.E.; Barrionuevo, C.; Alcina, A.; Matesanz, F. SP140 regulates the expression of immune-related genes associated with multiple sclerosis and other autoimmune diseases by NF-kappaB inhibition. Hum. Mol. Genet. 2018, 27, 4012–4023. [Google Scholar] [CrossRef]


| MØ Origin | Read Counts | Read Counts | FPKM Average | FPKM Average |
|---|---|---|---|---|
| (age of cat) | 2 h | 17 h | 2 h | 17 h |
| cat #1 (2Y) | 727 | 2 | 4.46 × 10⁻² | 1.38 × 10⁻⁴ |
| cat #2 (2Y) | 375 | nd | 1.82 × 10⁻² | nd |
| cat #3 (4Y) | nd | nd | nd | nd |
| cat #4 (5M) | 1798 | 1555 | 9.93 × 10⁻² | 9.05 × 10⁻² |
| cat #5 (2Y) | 673 | 202 | 3.62 × 10⁻² | 8.69 × 10⁻³ |
| cat #6 (2Y) | 245 | n/a | 1.4 × 10⁻¹ | n/a |
| CRFK 1 | 3715 | 459,899 | 1.38 × 10⁻¹ | 17.4 |
| CRFK 2 | 3 | 4871 | 2.19 × 10⁻⁴ | 1.54 × 10⁻¹ |
| CRFK 3 | 808 | 45,208 | 4.71 × 10⁻² | 1.70 |
| CRFK 4 | 1576 | 71,746 | 9.04 × 10⁻² | 2.91 |
| # | Gene Identifier | Gene Name |
|---|---|---|
| 1 | XM_019815278.2 | SMAD family member 4, transcript variant X3 |
| 2 | XM_019816257.2 | ATP binding cassette subfamily A member 1, transcript variant X2 |
| 3 | XM_019819160.2 | HAUS augmin-like complex subunit 8, transcript variant X1 |
| 4 | XM_019819460.2 | FCH domain only 1, transcript variant X4 |
| 5 | XM_019832772.2 | heterogeneous nuclear ribonucleoprotein C (C1/C2), transcript variant X1 |
| 6 | XM_023240709.1 | pantothenate kinase 1, transcript variant X2 |
| 7 | XM_023240796.1 | ligand-dependent corepressor, transcript variant X4 |
| 8 | XM_023242837.1 | ubiquitin specific peptidase 20, transcript variant X4 |
| 9 | XM_023248013.1 | RAB interacting factor, transcript variant X2 |
| 10 | XM_023255193.1 | transcription factor 7, transcript variant X5 |
| 11 | XM_019832447.2 | ATPase phospholipid transporting 8B4 (putative), transcript variant X2 |
| KEGG Pathways 17 h Downregulated | |||||
| KEGG ID | KEGG Pathway | Term p-Value | Term p-Value Corrected | Fold Enrichment | Associated Genes Found |
| KO 0000330 | Arginine and proline metabolism | 6.73 × 10⁻⁴ | 6.73 × 10⁻⁴ | 5.88 | [CNDP2, OAT, ODC1] |
| KEGG Pathways 17 h Upregulated | |||||
| KEGG ID | KEGG Pathway | Term p-Value | Term p-Value Corrected | Fold Enrichment | Associated Genes Found |
| KO 0000100 | Steroid biosynthesis | 4.13 × 10⁻⁶ | 2.89 × 10⁻⁵ | 18.2 | [DHCR7, FDFT1, LOC101083499, LSS] |
| KO 0000280 | Valine, leucine, and isoleucine degradation | 2.35 × 10⁻³ | 2.35 × 10⁻³ | 5.77 | [AACS, ACAT2, HMGCS1] |
| KO 0000650 | Butanoate metabolism | 3.40 × 10⁻⁴ | 5.94 × 10⁻⁴ | 11.1 | [AACS, ACAT2, HMGCS1] |
| KO 0000900 | Terpenoid backbone biosynthesis | 1.58 × 10⁻⁴ | 3.68 × 10⁻⁴ | 14.3 | [ACAT2, HMGCS1, MVD] |
| KO 0004110 | Cell cycle | 3.89 × 10⁻⁴ | 5.45 × 10⁻⁴ | 4.07 | [CCNB1, CCNB2, CHEK2, PLK1, TTK] |
| KO 0004115 | p53 signaling pathway | 3.27 × 10⁻⁵ | 1.14 × 10⁻⁴ | 6.85 | [APAF1, CCNB1, CCNB2, CHEK2, GTSE1] |
| KO 0004914 | Progesterone-mediated oocyte maturation | 1.08 × 10⁻³ | 1.25 × 10⁻³ | 4.49 | [AURKA, CCNB1, CCNB2, PLK1] |
| Gene Ontology for Genes Differentially Downregulated at 17 h | |||
| GO Molecular Function Complete | Fold Enrichment | Raw p-Value | FDR |
| extracellular matrix binding (GO:0050840) | 90.54 | 6.35 × 10⁻⁶ | 2.37 × 10⁻² |
| collagen binding (GO:0005518) | 61.83 | 1.85 × 10⁻⁵ | 3.45 × 10⁻² |
| GO Biological Process Complete | Fold Enrichment | Raw p-Value | FDR |
| regulation of endothelial cell proliferation (GO:0001936) | 56.33 | 3.29 × 10⁻⁸ | 4.49 × 10⁻⁴ |
| positive regulation of angiogenesis (GO:0045766) | 34.14 | 6.07 × 10⁻⁶ | 2.76 × 10⁻² |
| positive regulation of vasculature development (GO:1904018) | 31.01 | 8.77 × 10⁻⁶ | 2.99 × 10⁻² |
| regulation of epithelial cell proliferation (GO:0050678) | 19.84 | 4.81 × 10⁻⁶ | 3.28 × 10⁻² |
| regulation of peptidase activity (GO:0052547) | 16.31 | 1.22 × 10⁻⁵ | 3.33 × 10⁻² |
| Gene Ontology for Genes Differentially Upregulated at 17 h | |||
| GO Molecular Function Complete | Fold Enrichment | Raw p-Value | FDR |
| condensed nuclear chromosome outer kinetochore (GO:0000942) | >100 | 1.99 × 10⁻⁵ | 3.32 × 10⁻² |
| GO Molecular Function Complete | Fold Enrichment | Raw p-Value | FDR |
| regulation of spindle organization (GO:0090224) | >100 | 4.63 × 10⁻⁶ | 1.26 × 10⁻² |
| establishment of spindle orientation (GO:0051294) | >100 | 4.63 × 10⁻⁶ | 1.05 × 10⁻² |
| establishment of spindle localization (GO:0051293) | 83.29 | 8.53 × 10⁻⁶ | 1.16 × 10⁻² |
| spindle localization (GO:0051653) | 69.41 | 1.41 × 10⁻⁵ | 1.75 × 10⁻² |
| mitotic spindle organization (GO:0007052) | 48.43 | 3.88 × 10⁻⁵ | 3.79 × 10⁻² |
| mitotic sister chromatid segregation (GO:0000070) | 45.52 | 2.18 × 10⁻⁶ | 1.49 × 10⁻² |
| microtubule cytoskeleton organization involved in mitosis (GO:1902850) | 45.52 | 2.18 × 10⁻⁶ | 9.94 × 10⁻³ |
| mitotic nuclear division (GO:0140014) | 41.32 | 1.61 × 10⁻⁷ | 2.20 × 10⁻³ |
| sister chromatid segregation (GO:0000819) | 35.6 | 5.55 × 10⁻⁶ | 9.47 × 10⁻³ |
| spindle organization (GO:0007051) | 35.14 | 5.82 × 10⁻⁶ | 8.83 × 10⁻³ |
| nuclear chromosome segregation (GO:0098813) | 22.04 | 3.44 × 10⁻⁵ | 3.91 × 10⁻² |
| nuclear division (GO:0000280) | 21.69 | 3.46 × 10⁻⁶ | 1.18 × 10⁻² |
| organelle fission (GO:0048285) | 19.83 | 5.29 × 10⁻⁶ | 1.03 × 10⁻² |
| mitotic cell cycle process (GO:1903047) | 13.3 | 3.49 × 10⁻⁵ | 3.66 × 10⁻² |
| microtubule cytoskeleton organization (GO:0000226) | 12.48 | 4.69 × 10⁻⁵ | 4.27 × 10⁻² |
© 2020 by the authors. Licensee MDPI, Basel, Switzerland. This article is an open access article distributed under the terms and conditions of the Creative Commons Attribution (CC BY) license (http://creativecommons.org/licenses/by/4.0/).
Share and Cite
Drechsler, Y.; Vasconcelos, E.J.R.; Griggs, L.M.; Diniz, P.P.P.V.; Collisson, E. Host Gene Expression of Macrophages in Response to Feline Coronavirus Infection. Cells 2020, 9, 1431. https://doi.org/10.3390/cells9061431
Drechsler Y, Vasconcelos EJR, Griggs LM, Diniz PPPV, Collisson E. Host Gene Expression of Macrophages in Response to Feline Coronavirus Infection. Cells. 2020; 9(6):1431. https://doi.org/10.3390/cells9061431
Chicago/Turabian StyleDrechsler, Yvonne, Elton J. R. Vasconcelos, Lisa M. Griggs, Pedro P. P. V. Diniz, and Ellen Collisson. 2020. "Host Gene Expression of Macrophages in Response to Feline Coronavirus Infection" Cells 9, no. 6: 1431. https://doi.org/10.3390/cells9061431
APA StyleDrechsler, Y., Vasconcelos, E. J. R., Griggs, L. M., Diniz, P. P. P. V., & Collisson, E. (2020). Host Gene Expression of Macrophages in Response to Feline Coronavirus Infection. Cells, 9(6), 1431. https://doi.org/10.3390/cells9061431