Metabolomic Profiling of Plasma and Erythrocytes in Sickle Mice Points to Altered Nociceptive Pathways

 ,
,  , , and
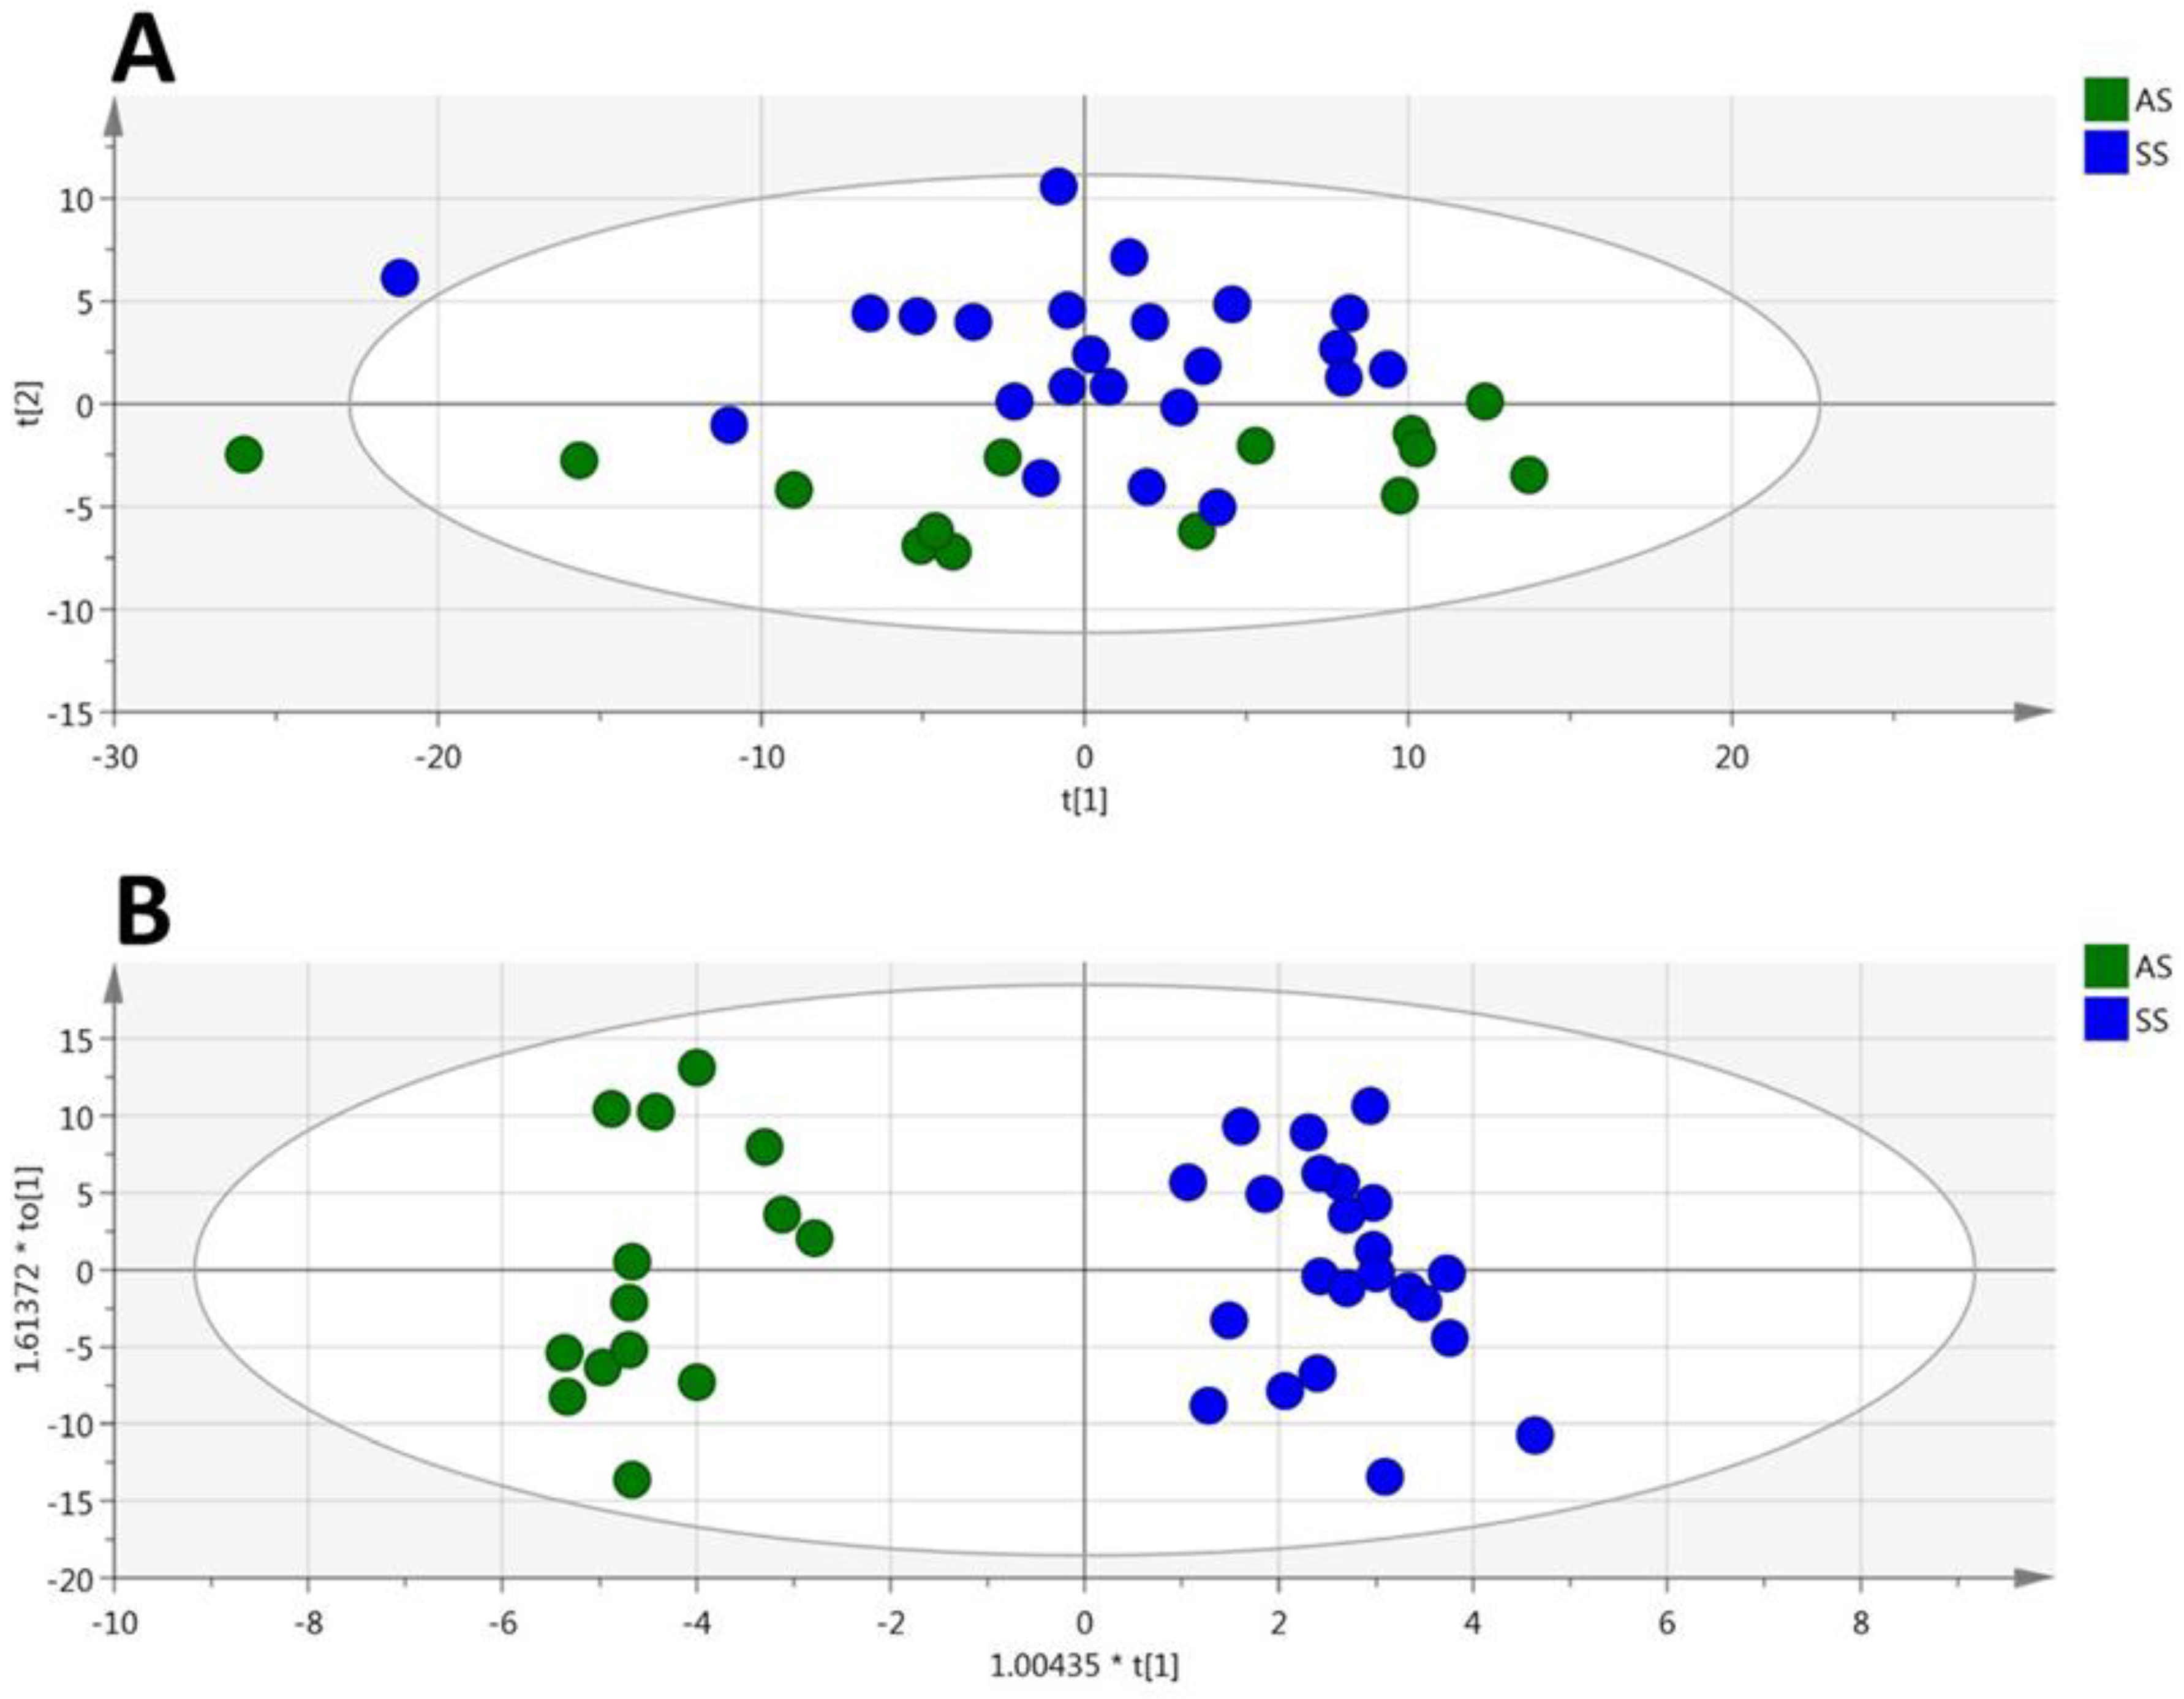
Abstract
1. Introduction
2. Materials and Methods
2.1. Animals and Sampling Procedures
2.2. Red Blood Cell Extraction
2.3. Metabolomic Analyses
2.4. Statistical Analyses
3. Results
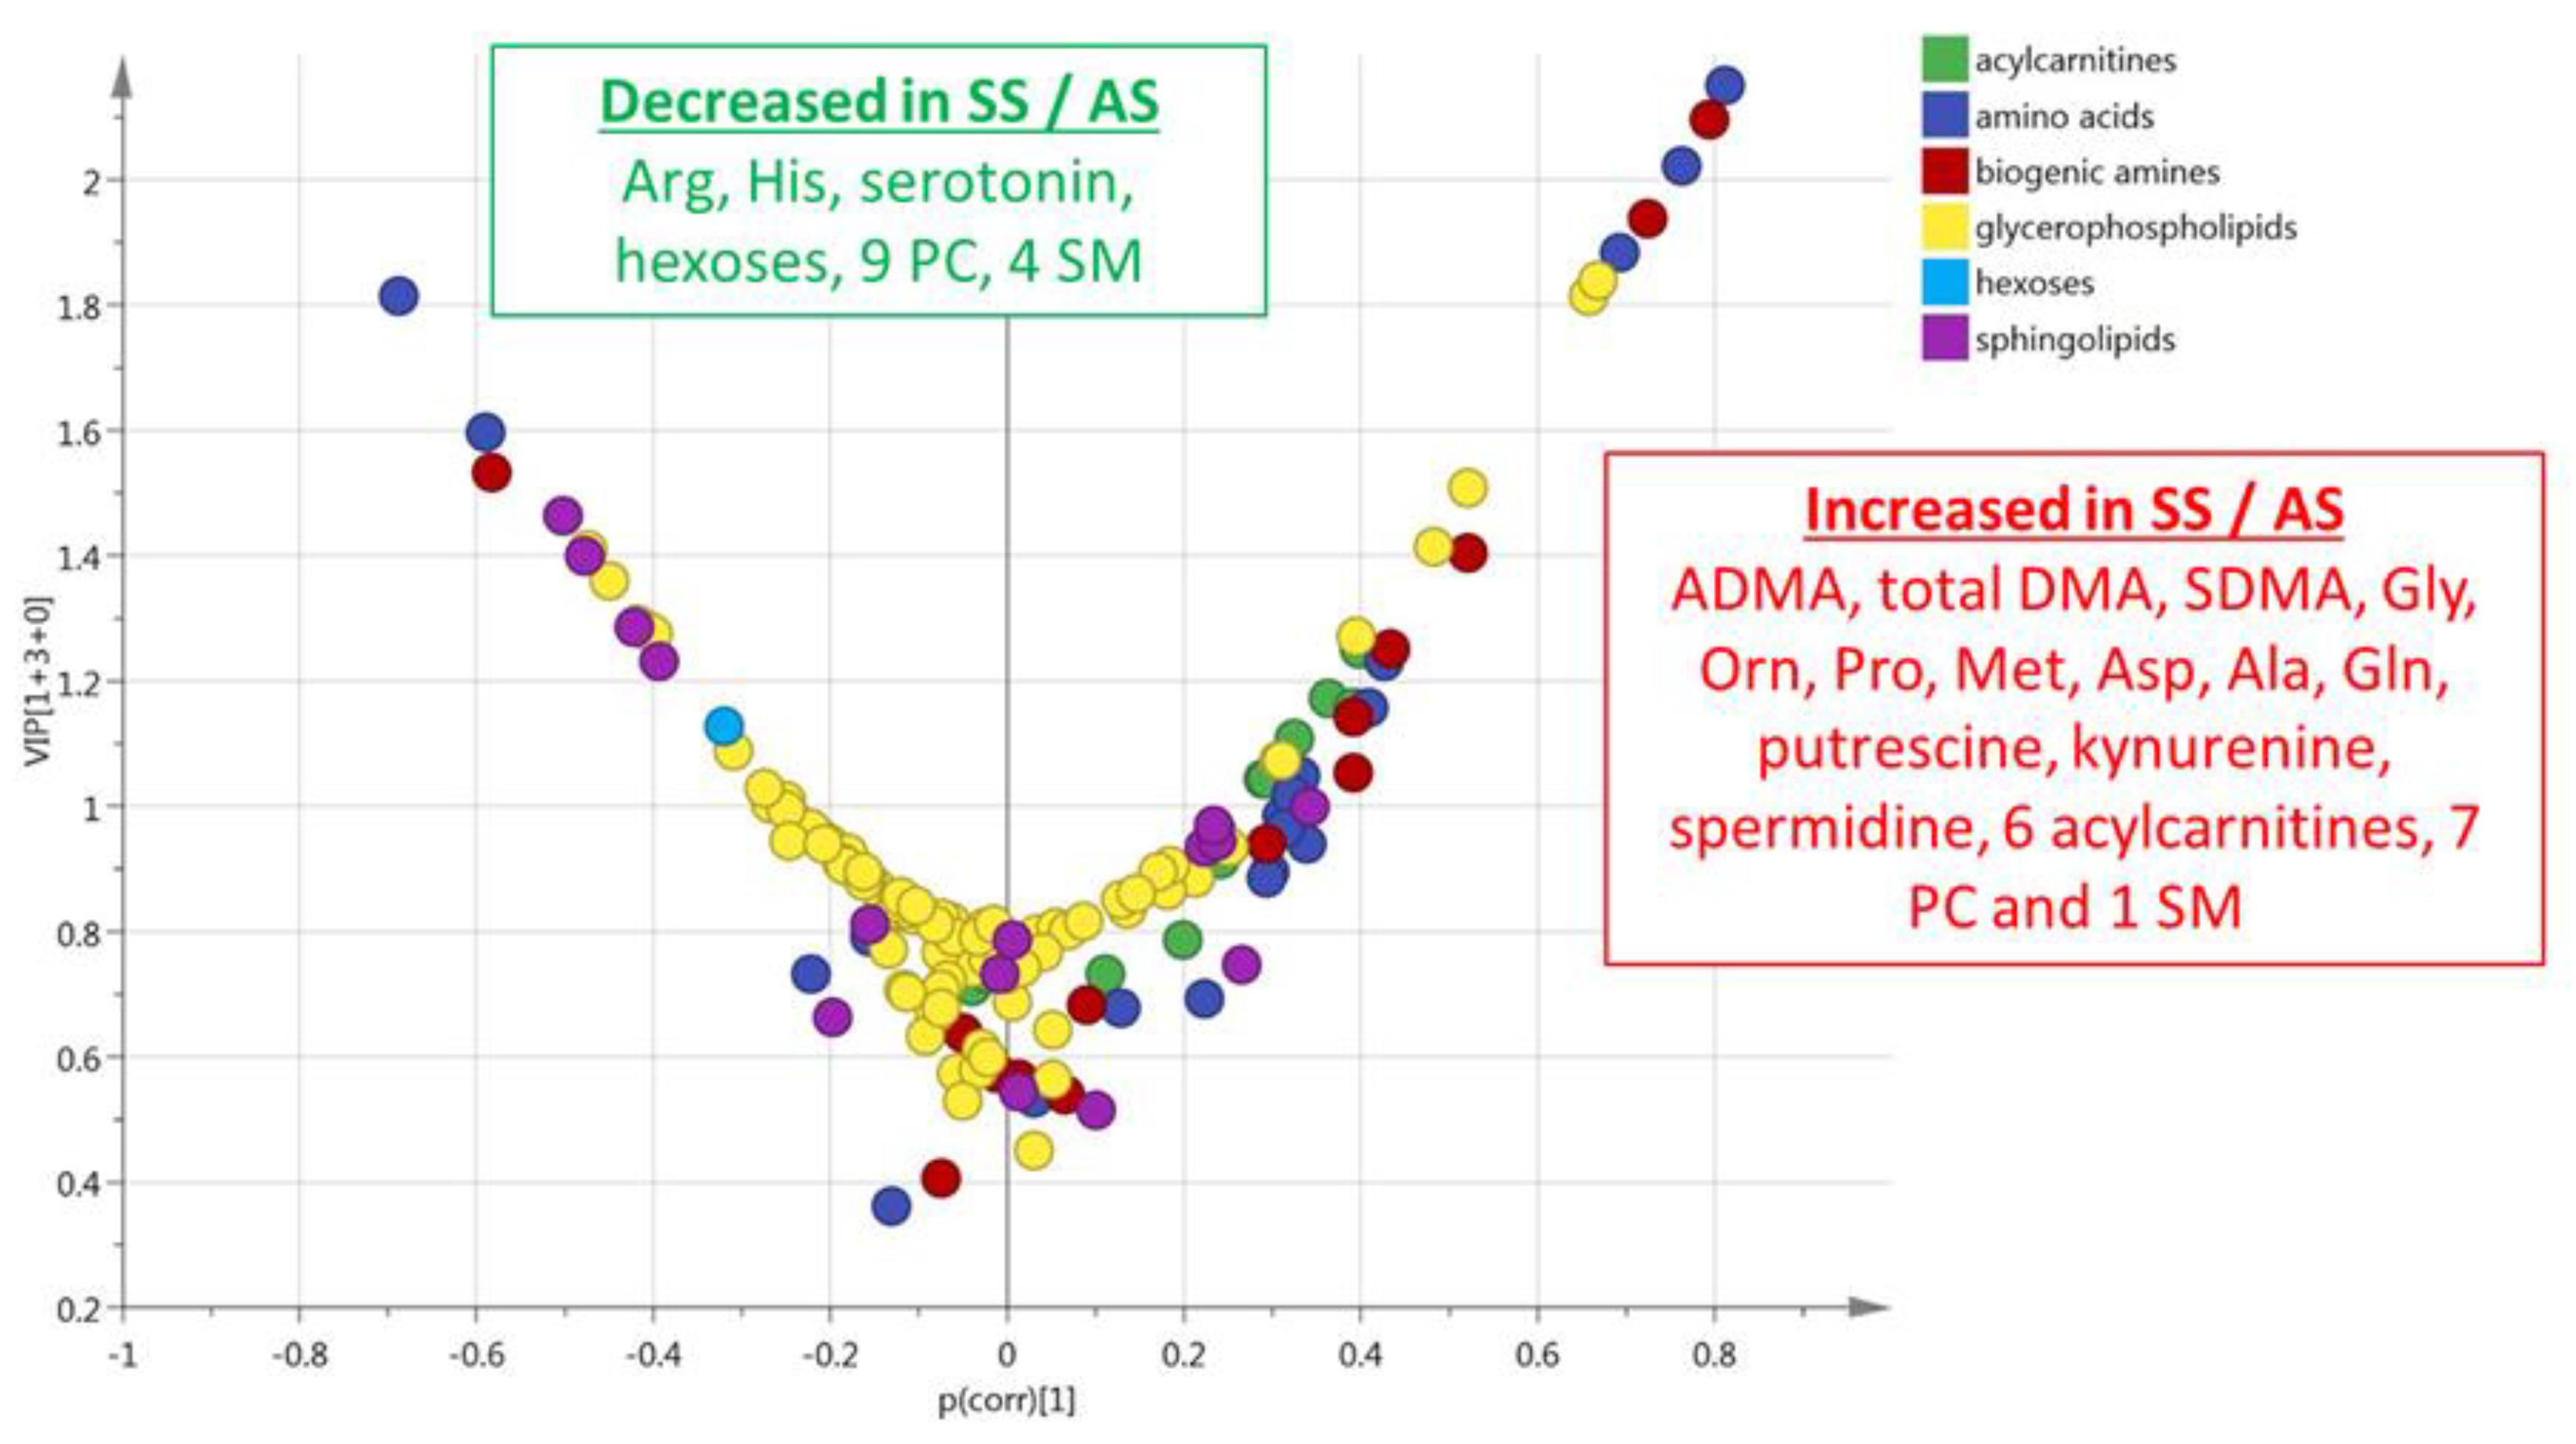
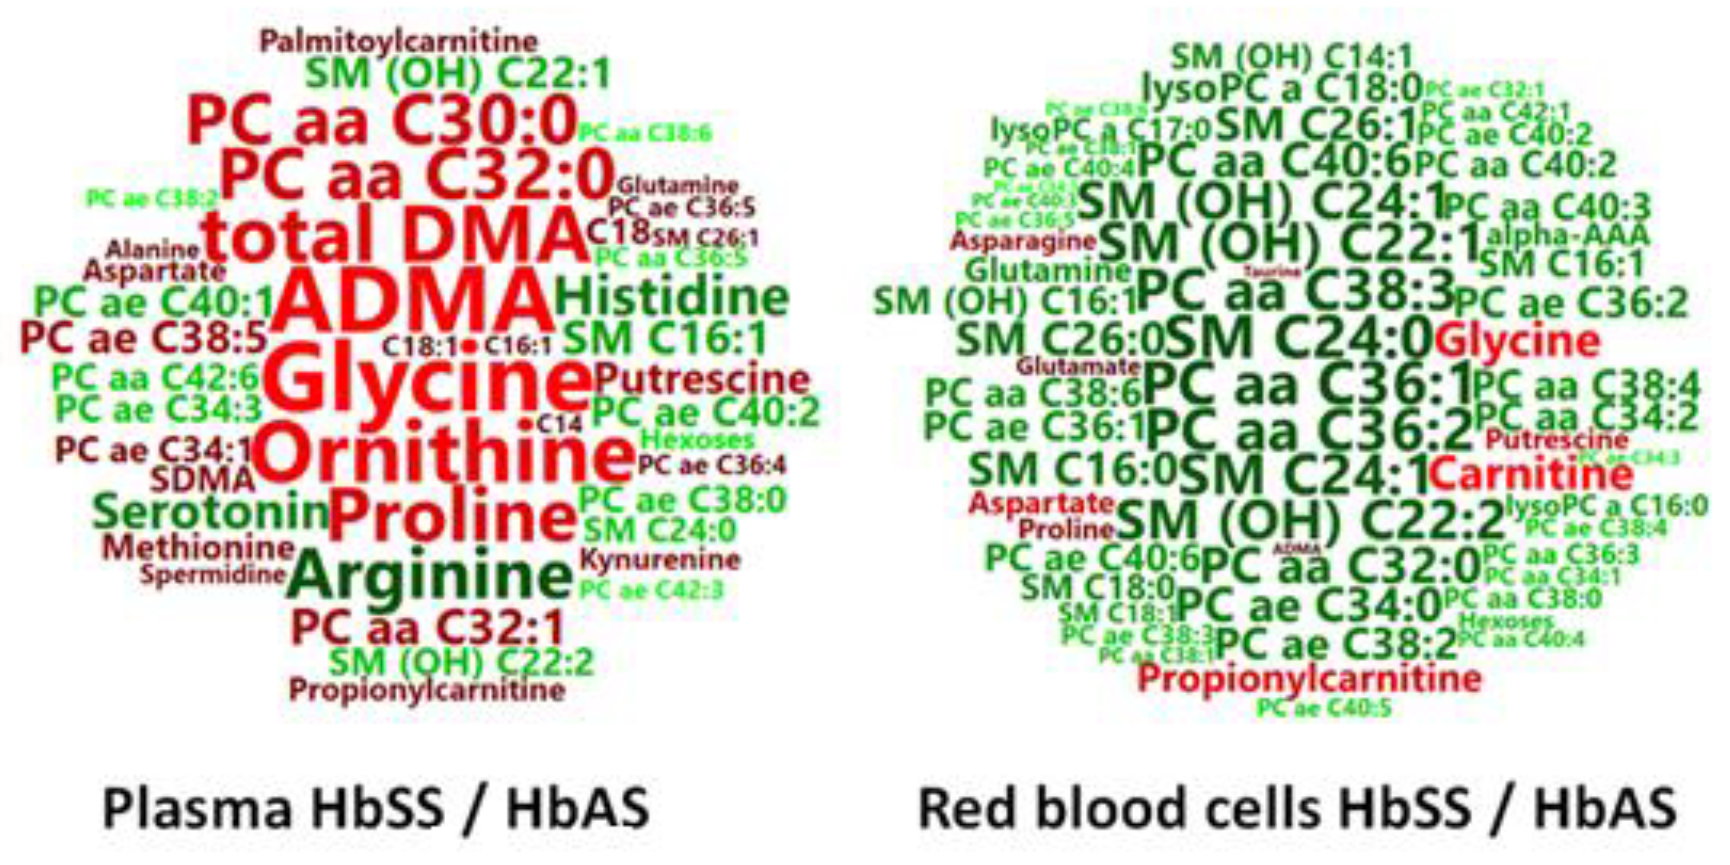
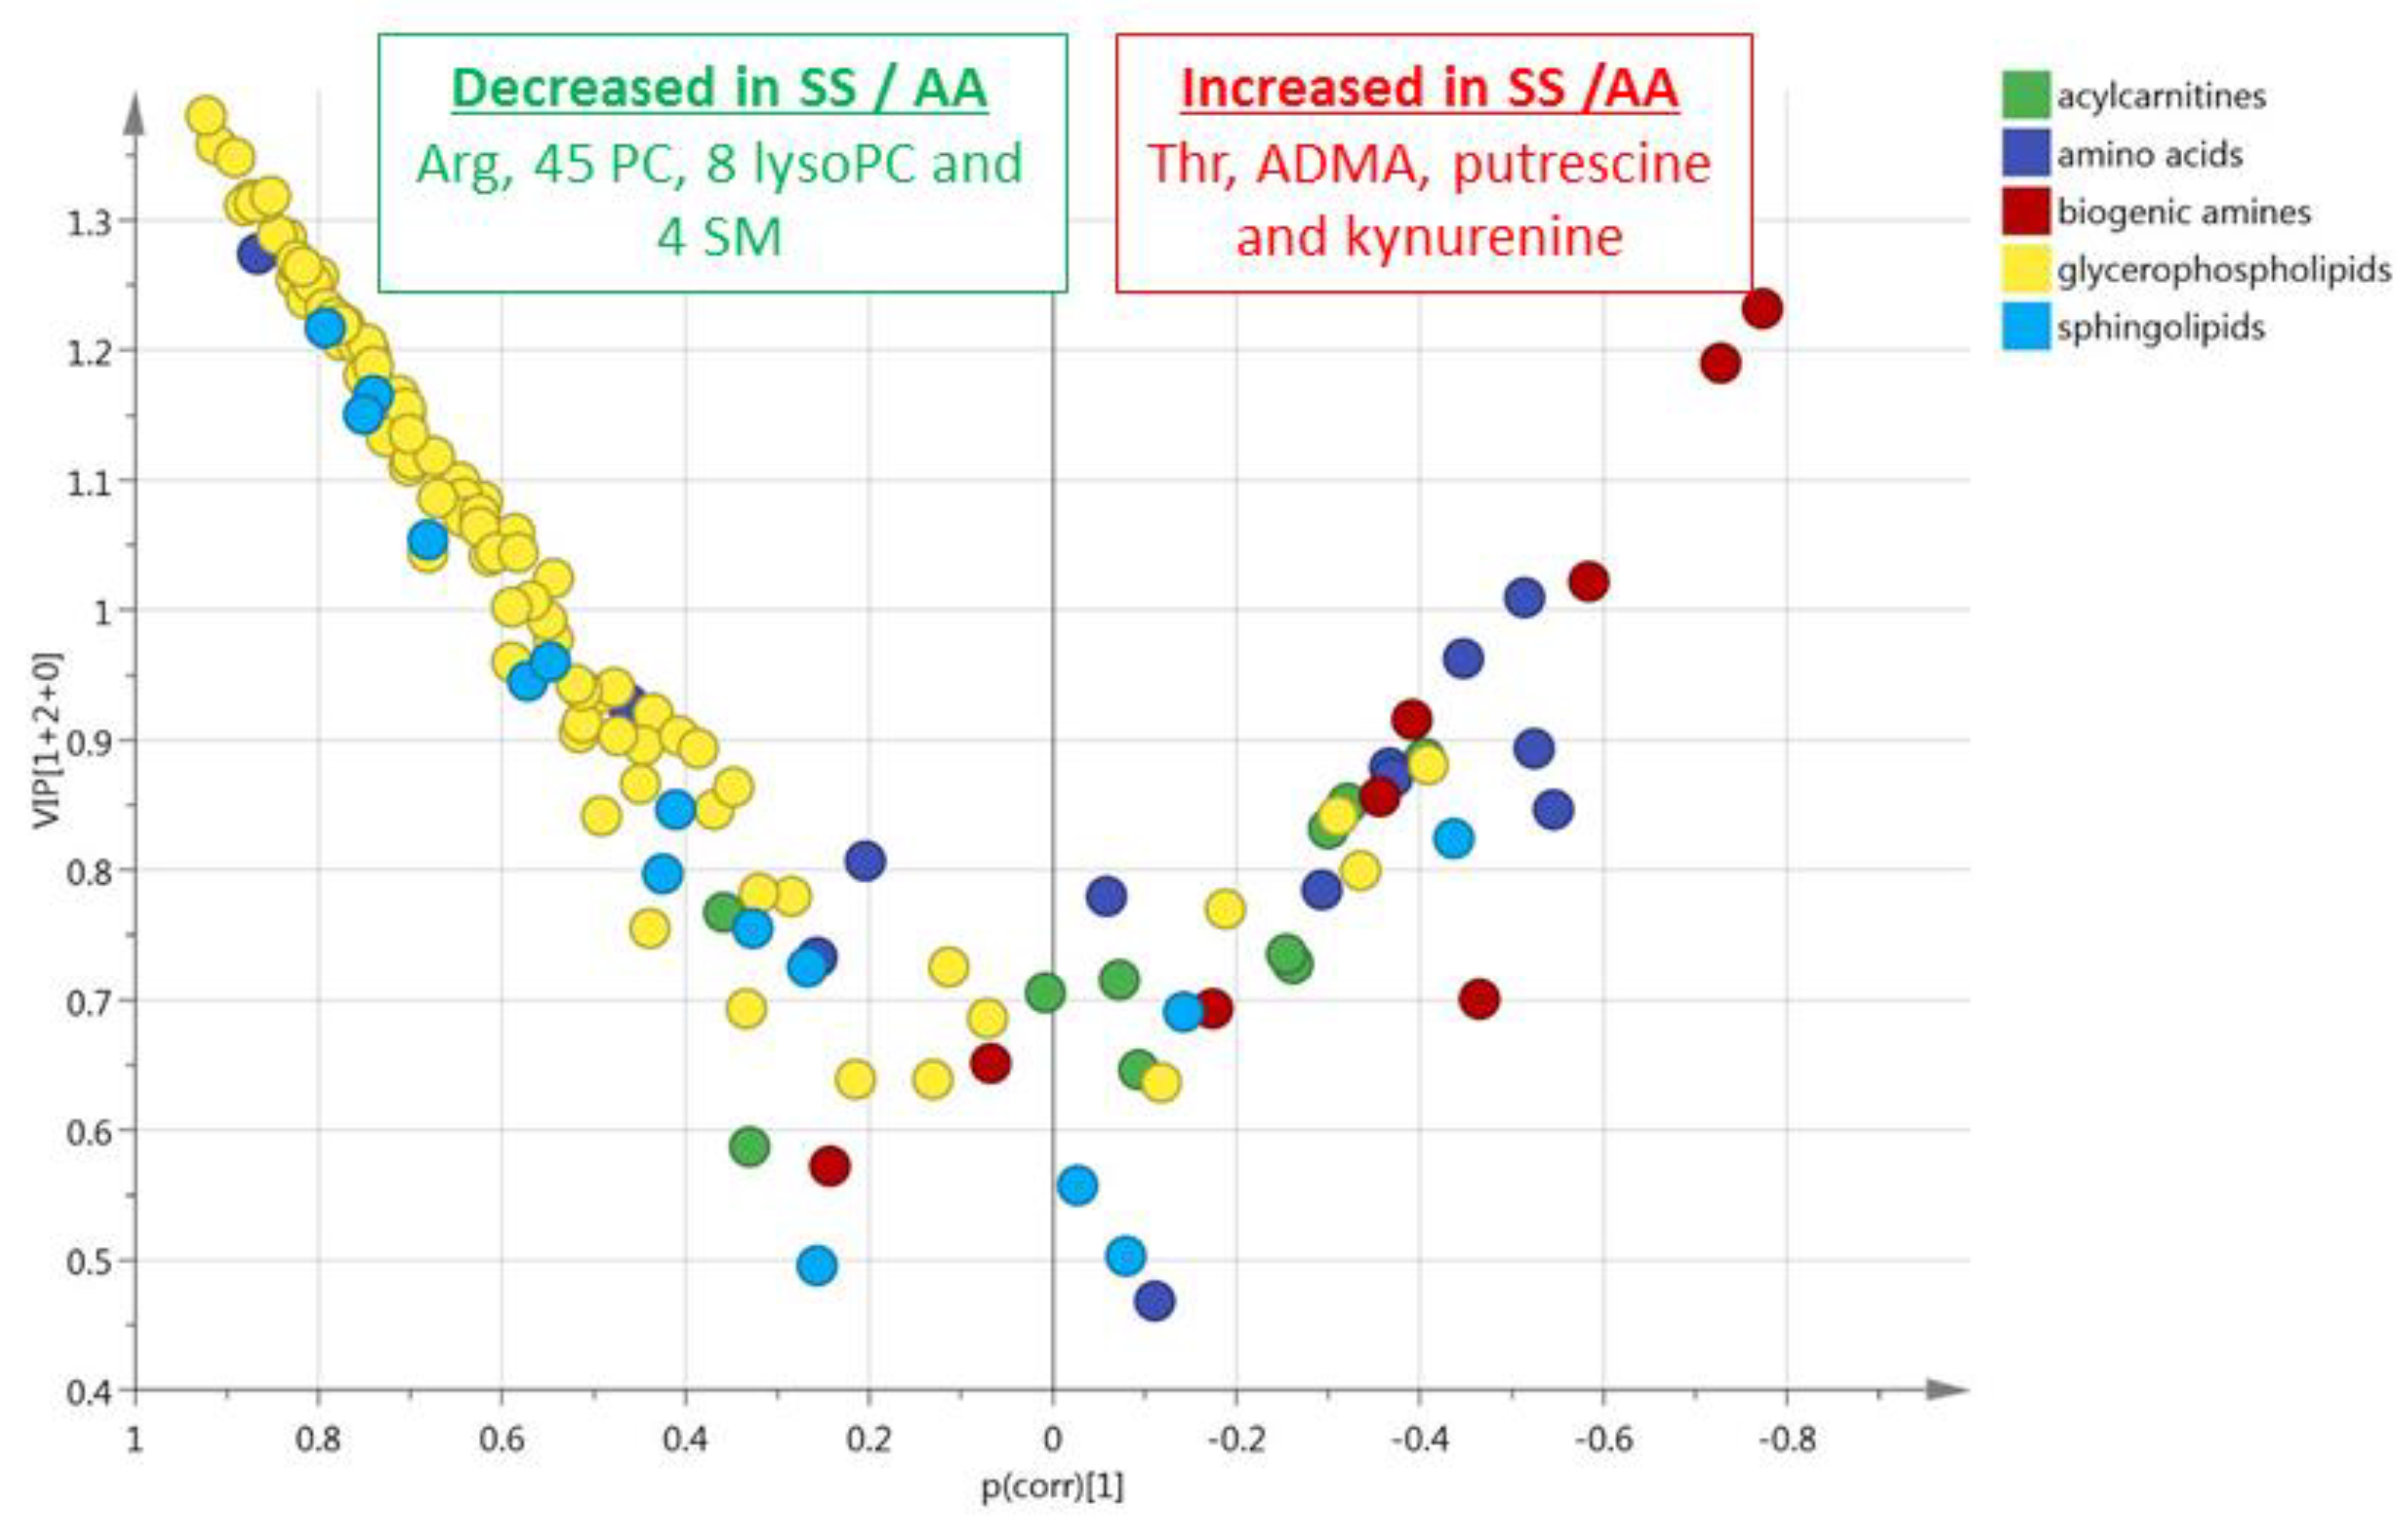
3.1. HbSS/HbAS Plasma Signature
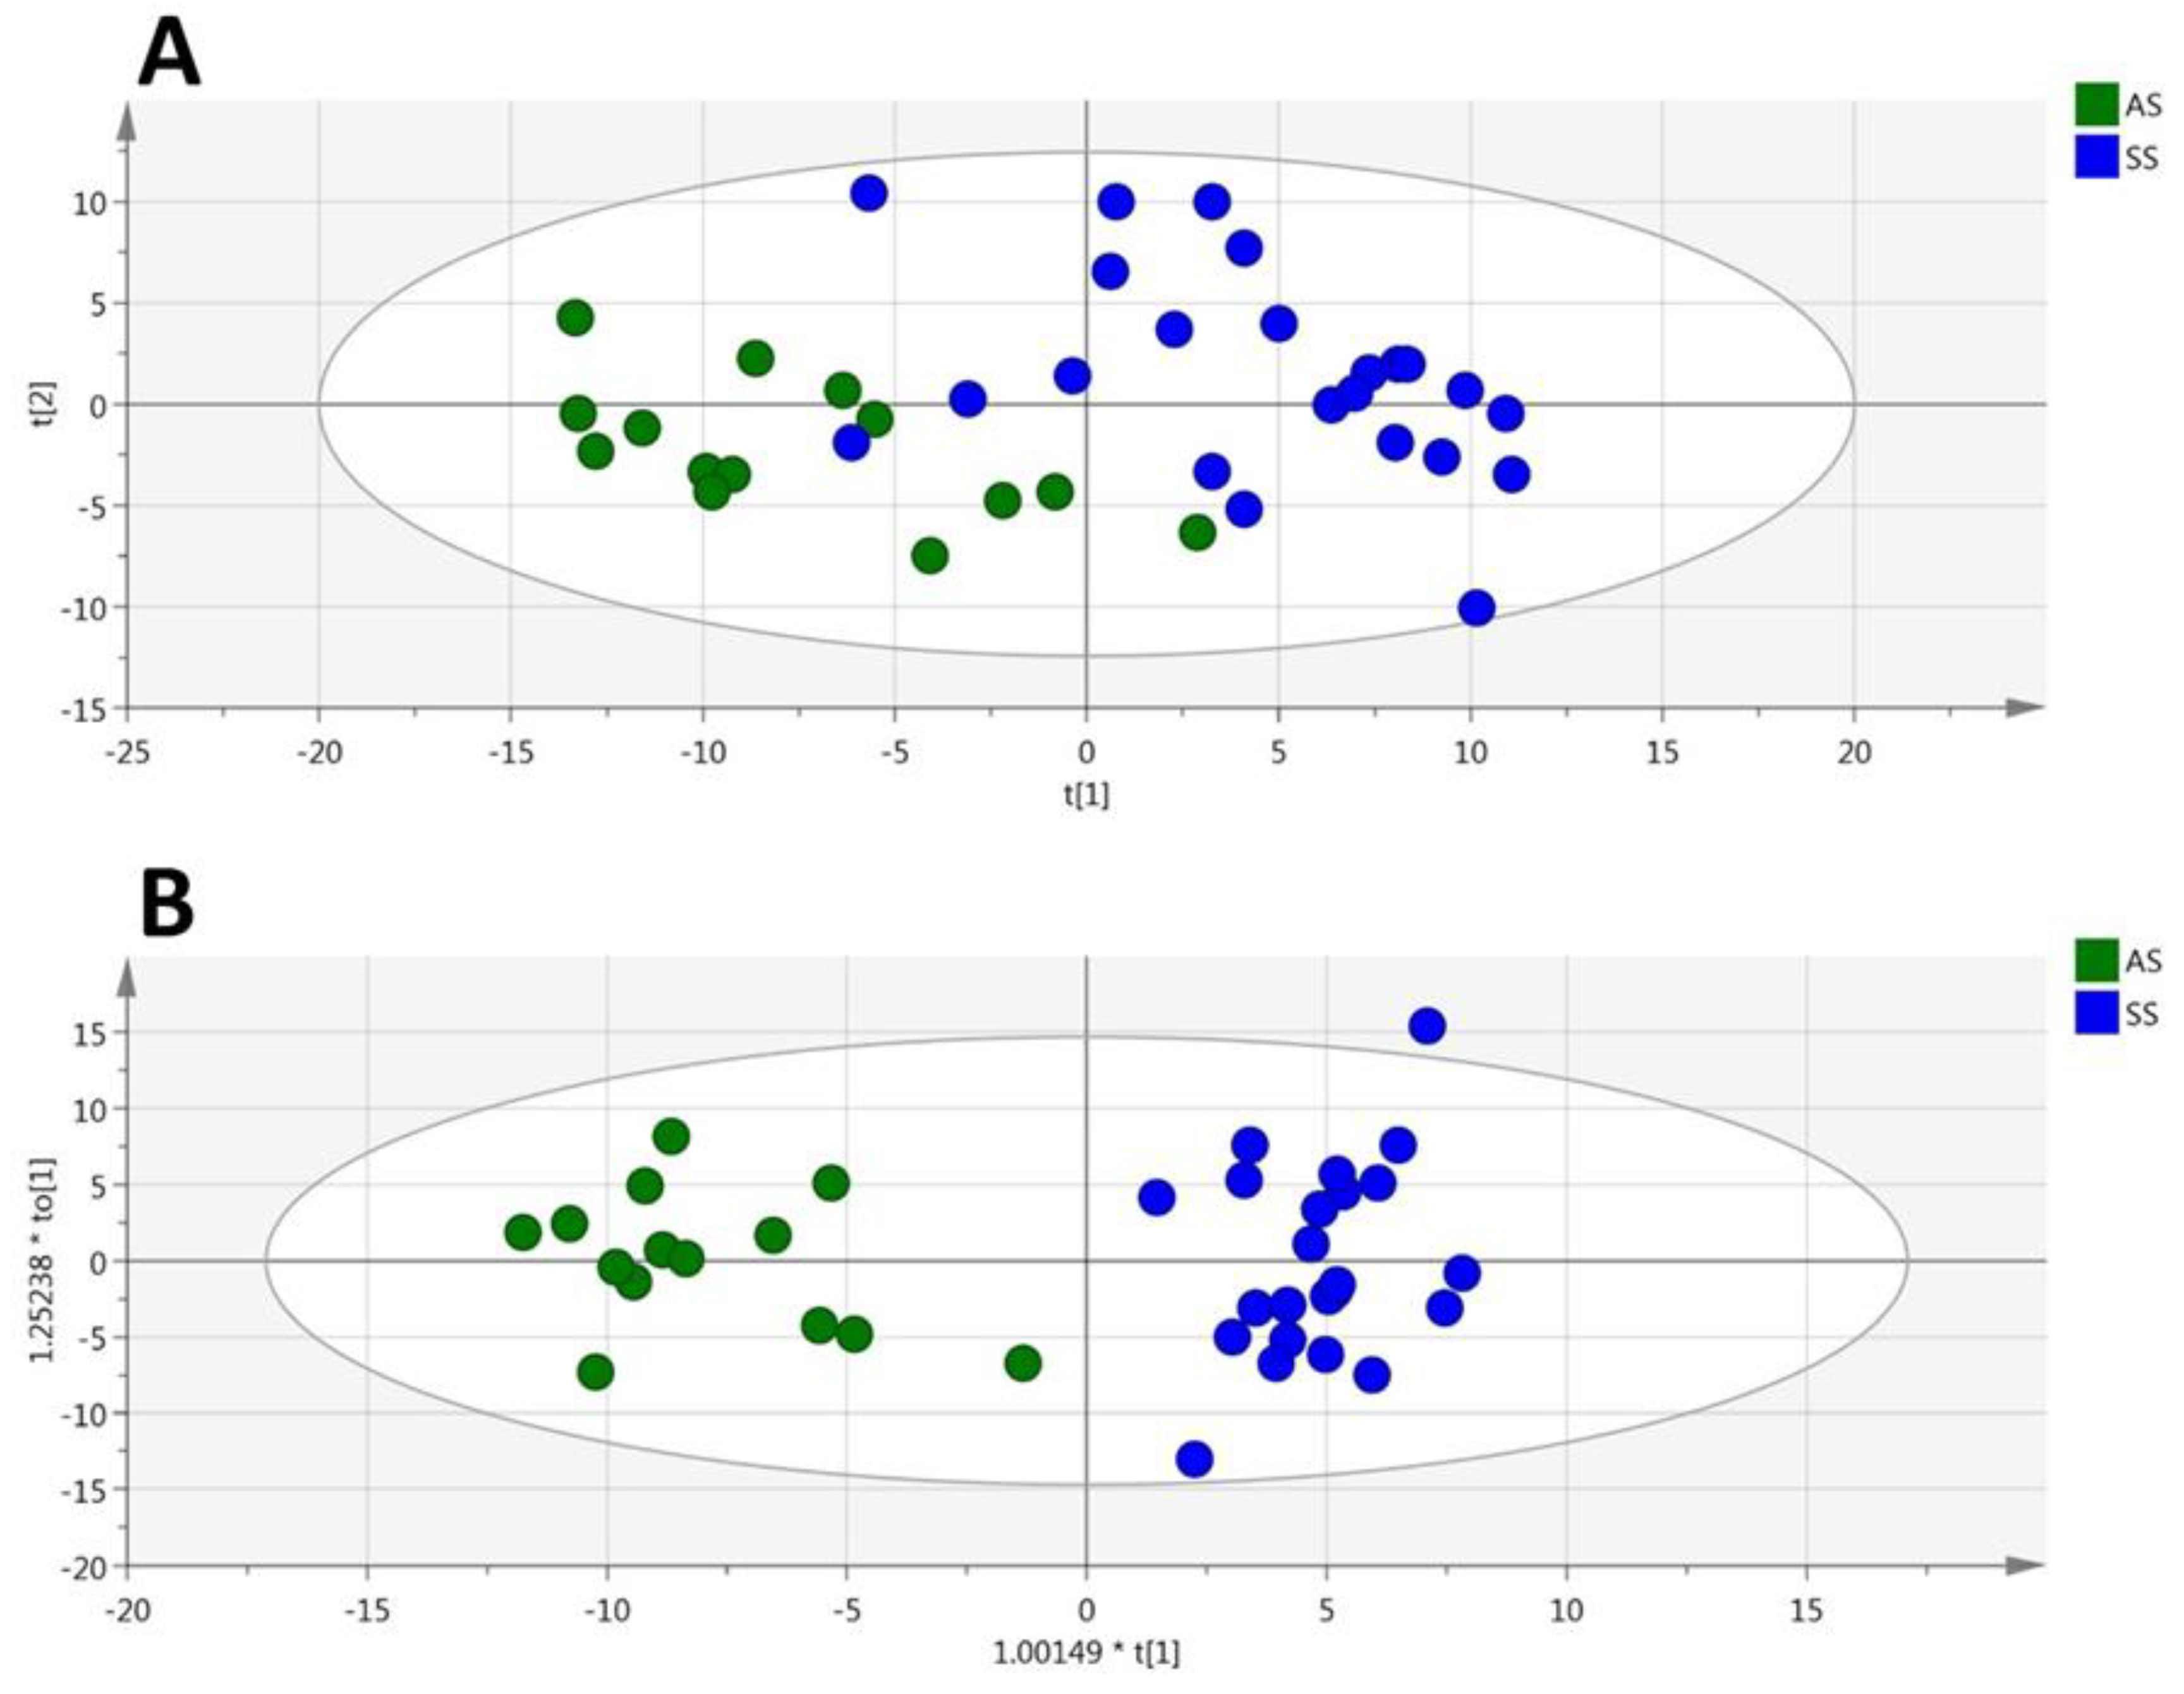
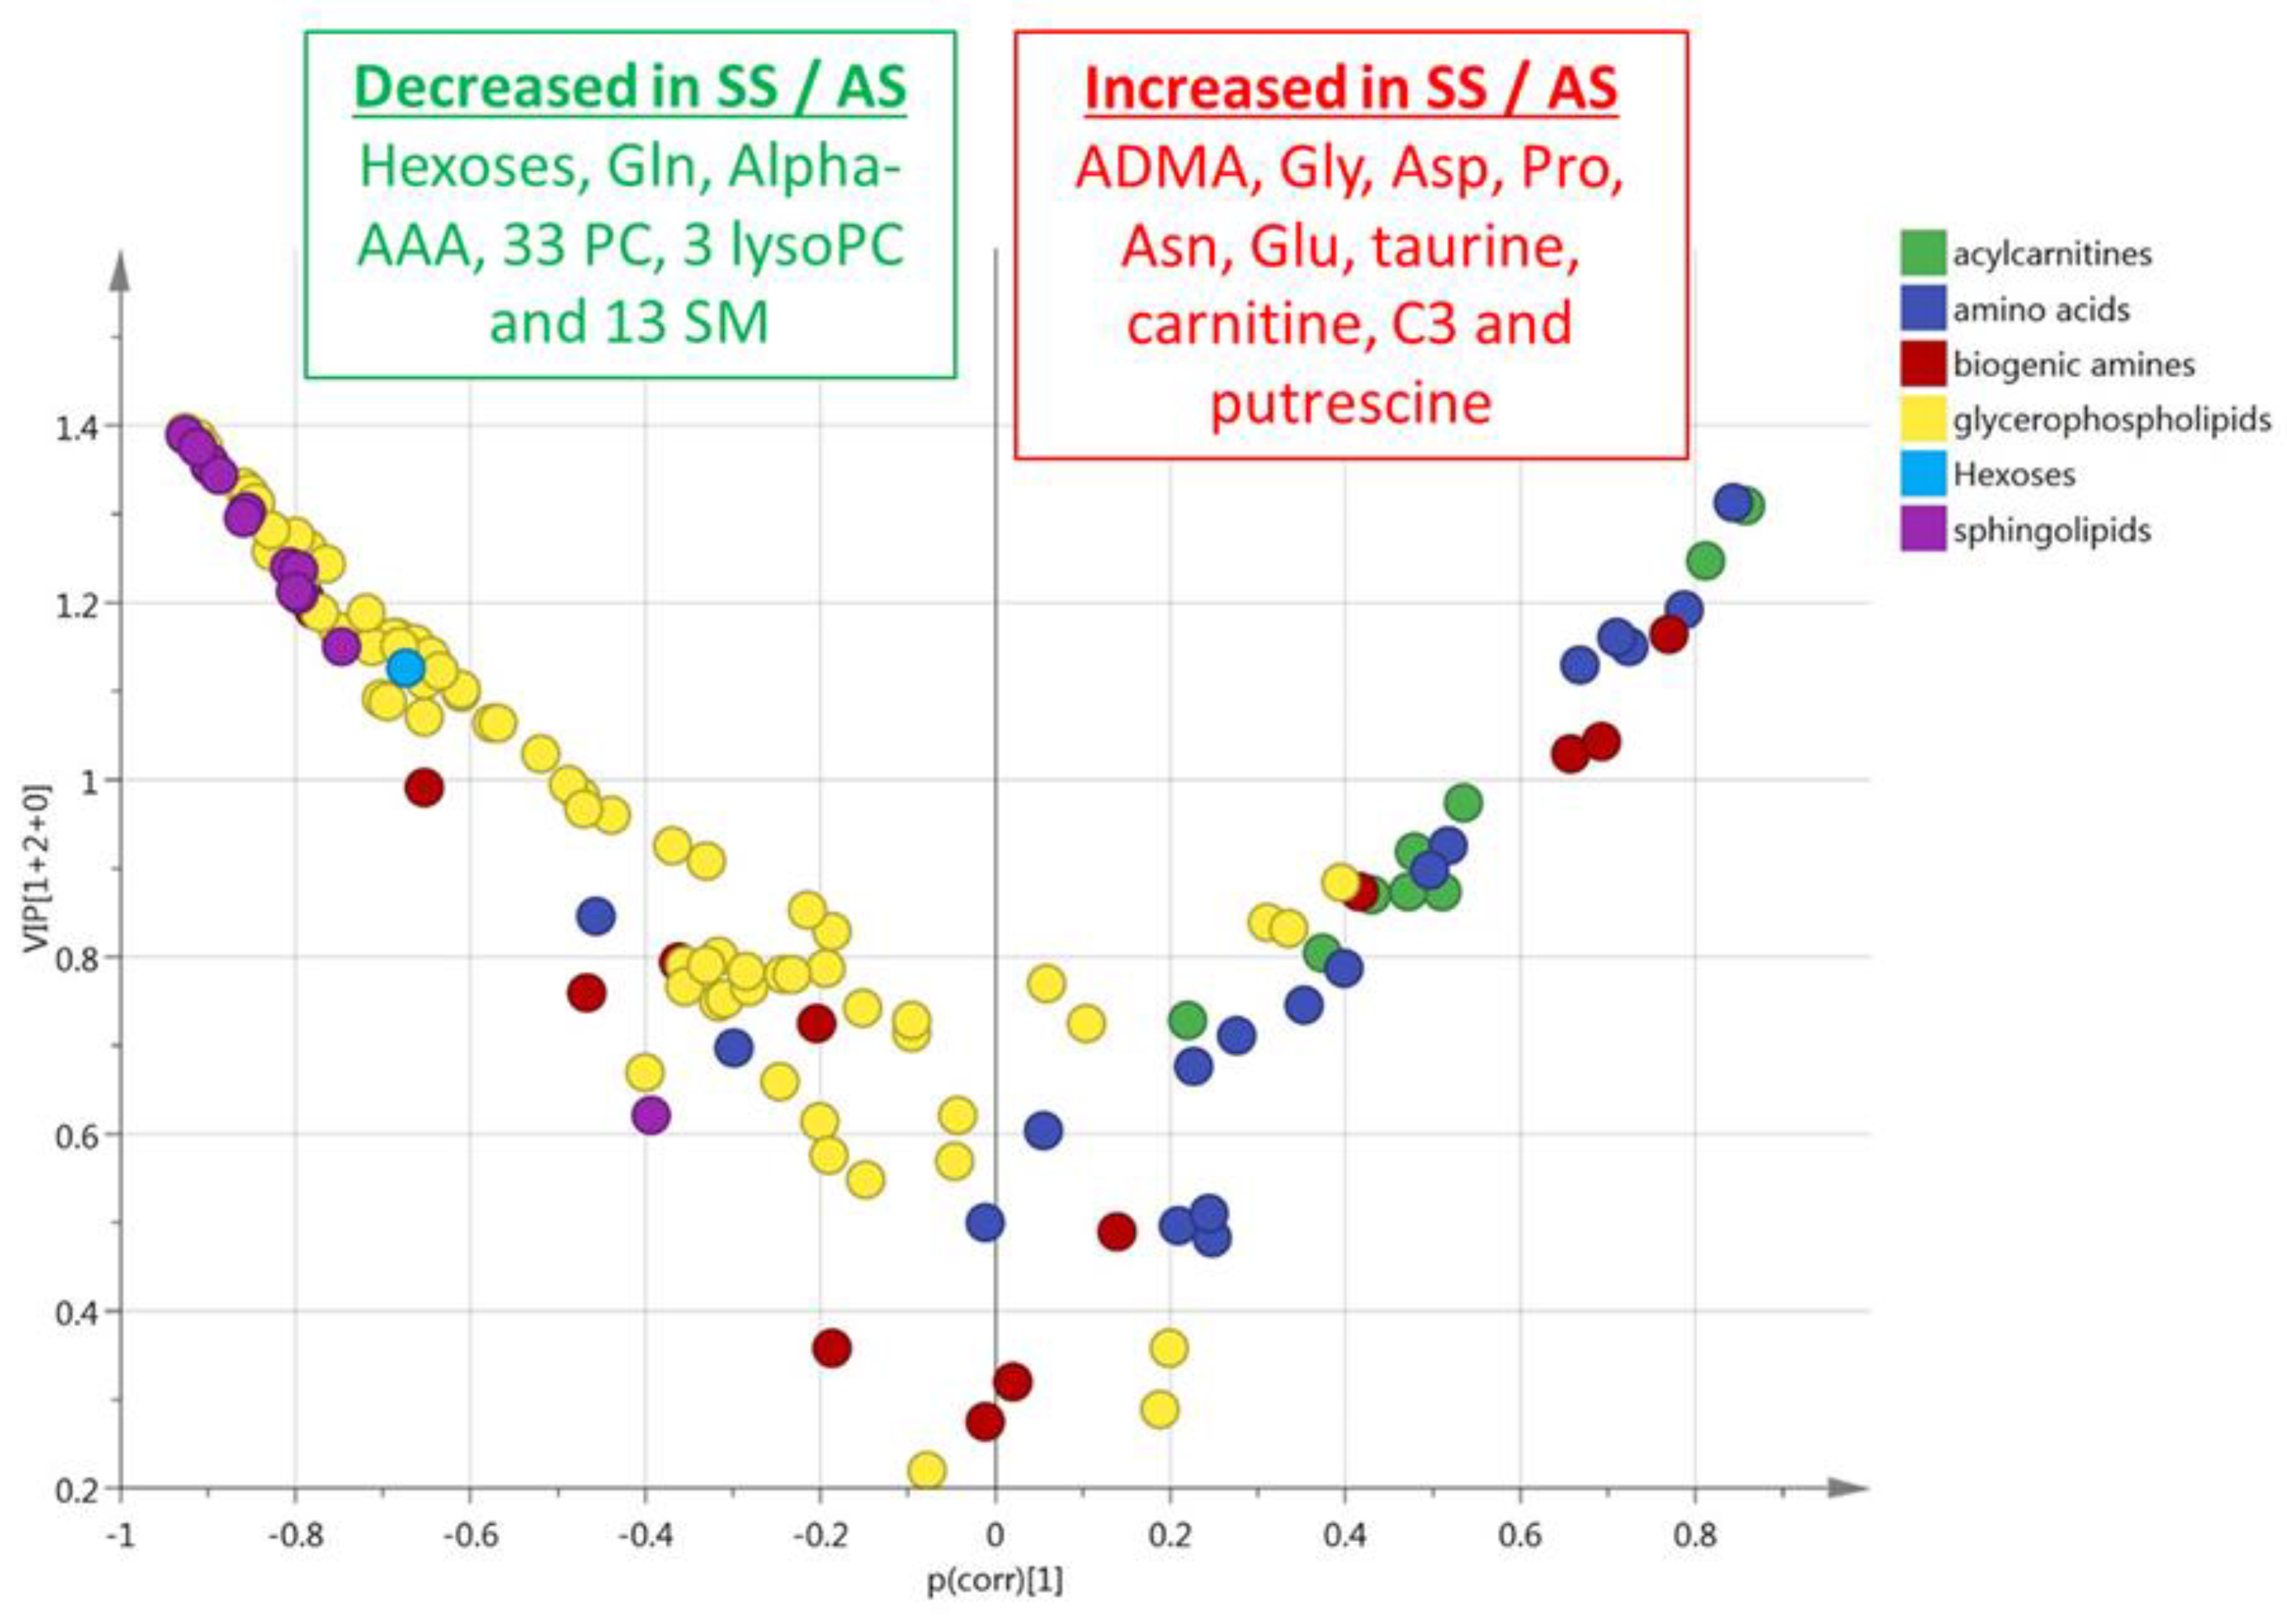
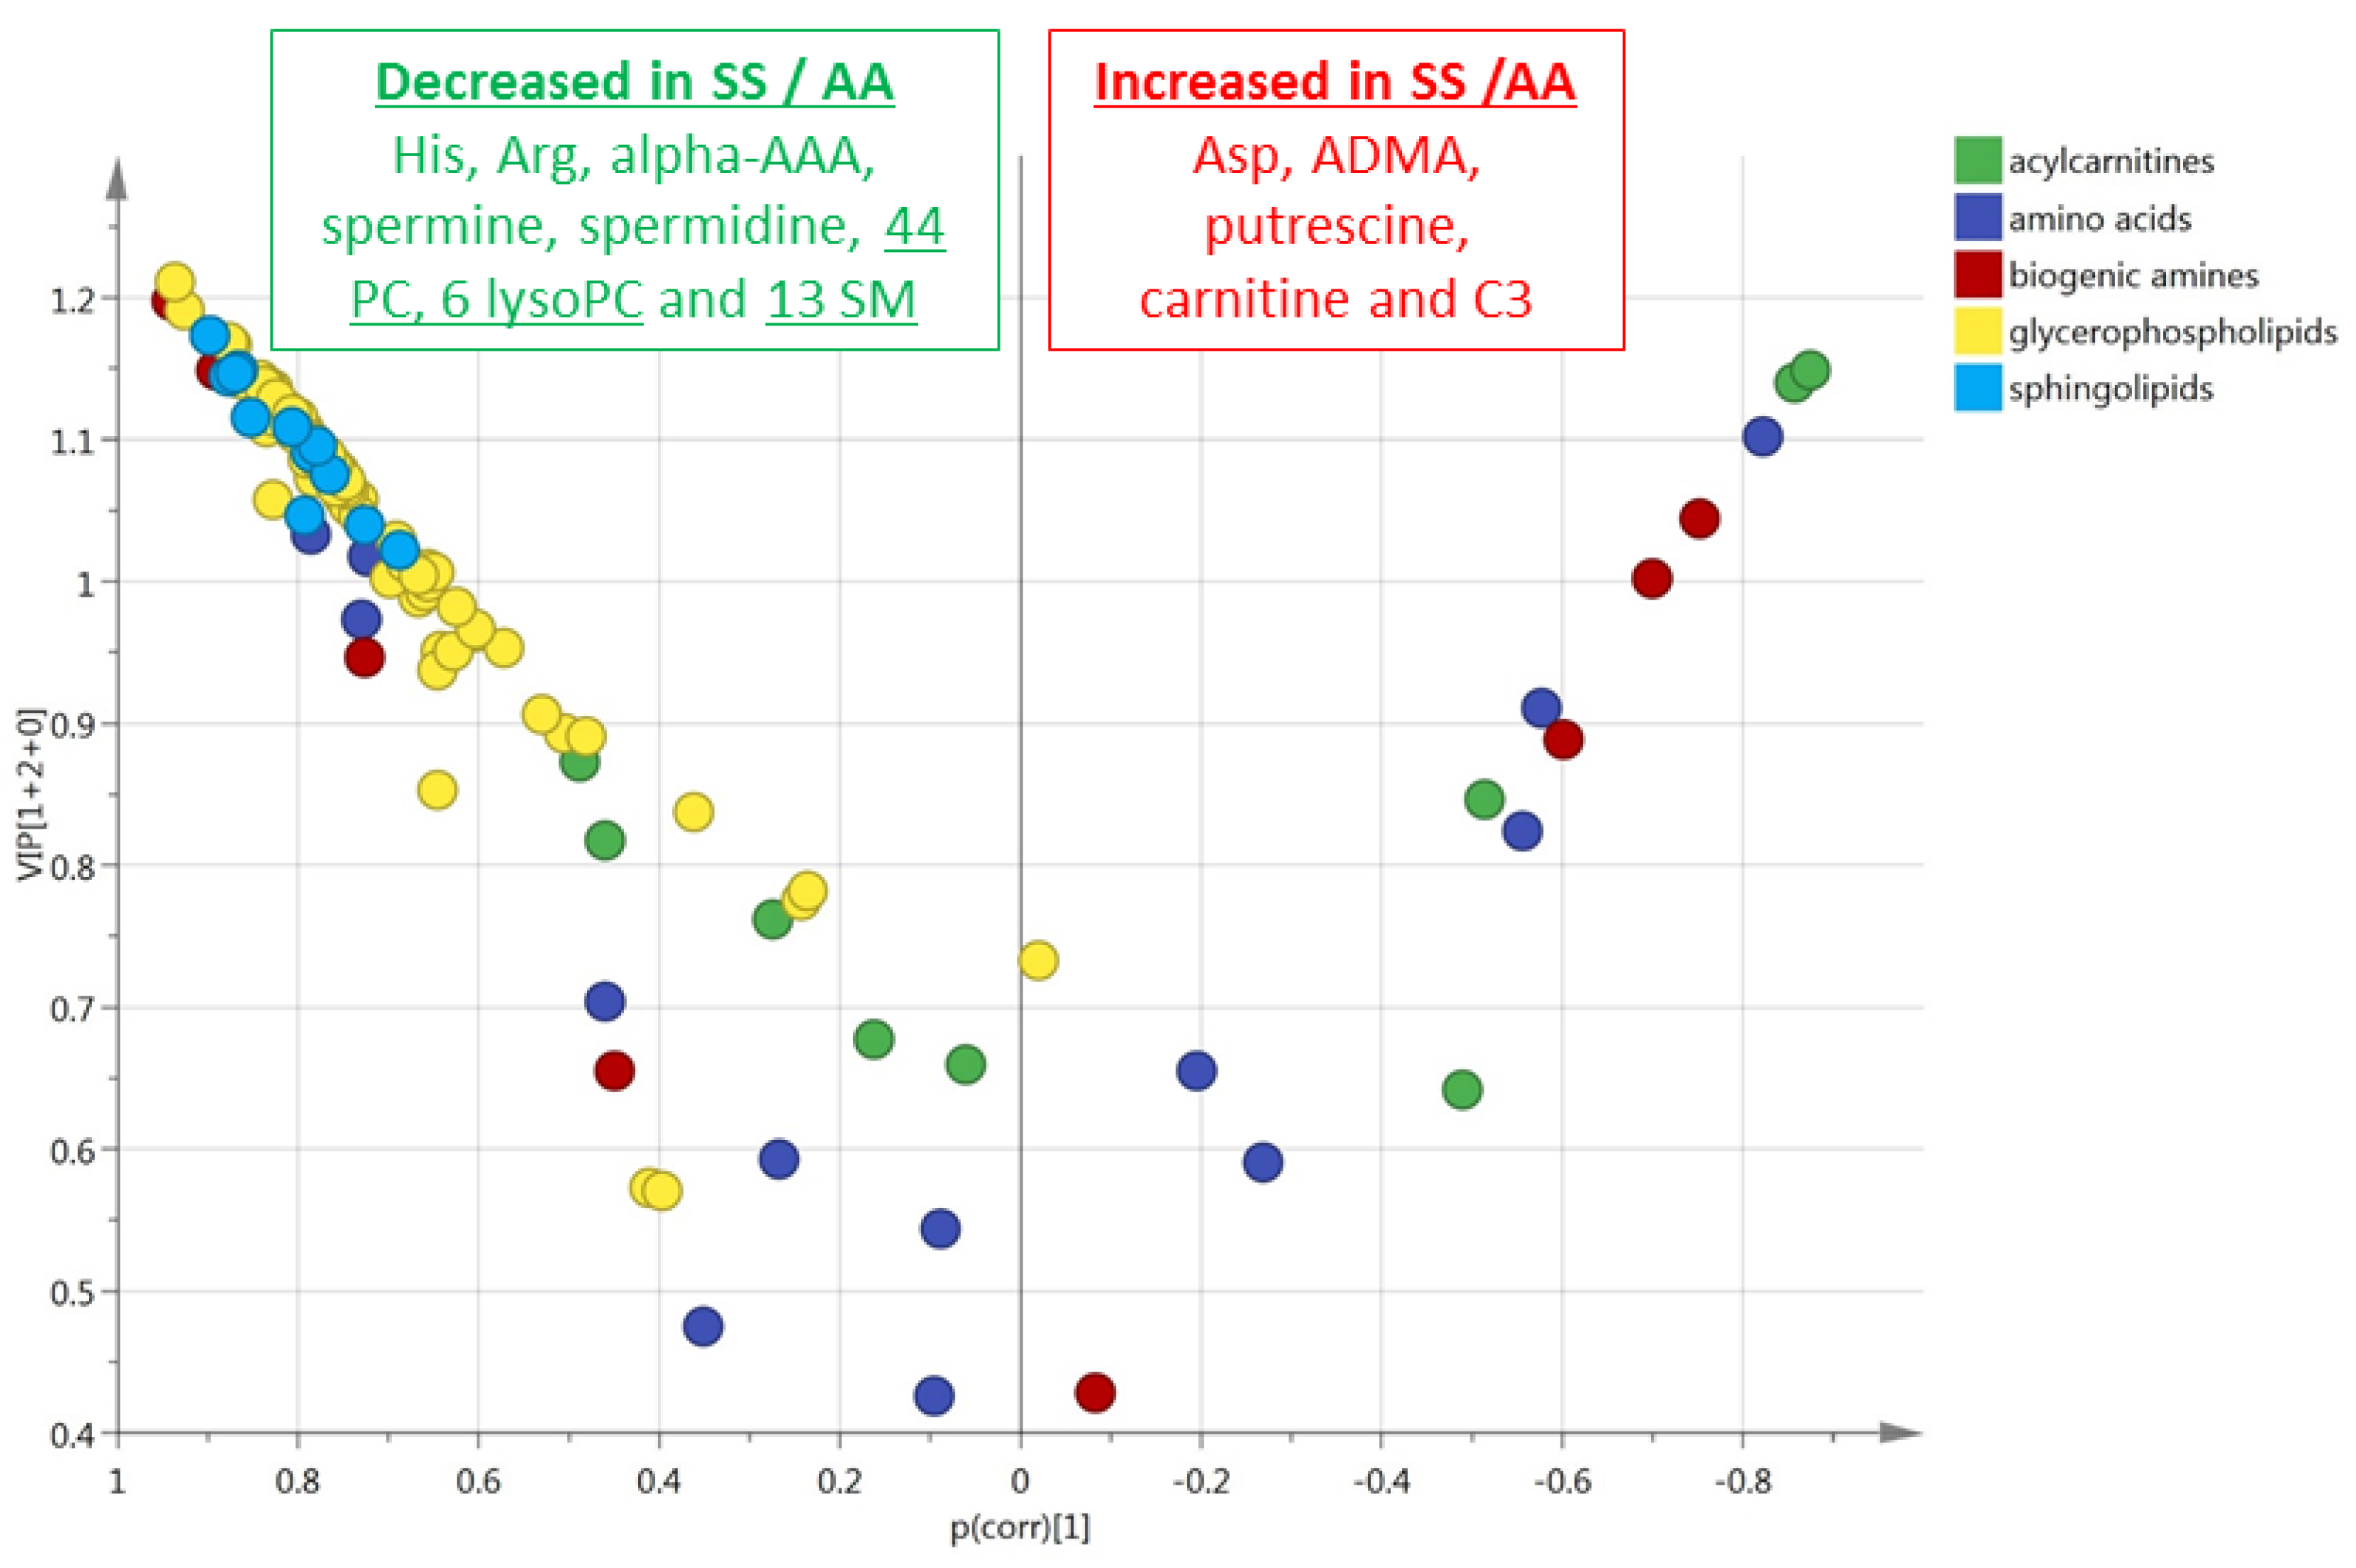
3.2. HbSS/HbAS Red Blood Cells Signature
3.3. Summary of the HbSS/HbAS Signature
3.4. HbSS/HbAA Plasma Signature
3.5. HbSS/HbAA Red Blood Cell Signature
4. Discussion
5. Conclusions
Supplementary Materials
Author Contributions
Funding
Acknowledgments
Conflicts of Interest
References
- Ingram, V.M. Gene mutations in human haemoglobin: The chemical difference between normal and sickle cell haemoglobin. Nature 1957, 180, 326–328. [Google Scholar] [CrossRef] [PubMed]
- Goodman, S.R.; Pace, B.S.; Hansen, K.C.; D’alessandro, A.; Xia, Y.; Daescu, O.; Glatt, S.J. Minireview: Multiomic candidate biomarkers for clinical manifestations of sickle cell severity: Early steps to precision medicine. Exp. Biol. Med. (Maywood) 2016, 241, 772–781. [Google Scholar] [CrossRef] [PubMed]
- Adebiyi, M.G.; Manalo, J.M.; Xia, Y. Metabolomic and molecular insights into sickle cell disease and innovative therapies. Blood Adv. 2019, 3, 1347–1355. [Google Scholar] [CrossRef] [PubMed]
- Darghouth, D.; Koehl, B.; Madalinski, G.; Heilier, J.F.; Bovee, P.; Xu, Y.; Olivier, M.F.; Bartolucci, P.; Benkerrou, M.; Pissard, S.; et al. Pathophysiology of sickle cell disease is mirrored by the red blood cell metabolome. Blood 2011, 117, e57–e66. [Google Scholar] [CrossRef] [PubMed]
- Zhang, Y.; Dai, Y.; Wen, J.; Zhang, W.; Grenz, A.; Sun, H.; Tao, L.; Lu, G.; Alexander, D.C.; Milburn, M.V.; et al. Detrimental effects of adenosine signaling in sickle cell disease. Nat. Med. 2011, 17, 79–86. [Google Scholar] [CrossRef]
- Zhang, Y.; Berka, V.; Song, A.; Sun, K.; Wang, W.; Zhang, W.; Ning, C.; Li, C.; Zhang, Q.; Bogdanov, M.; et al. Elevated sphingosine-1-phosphate promotes sickling and sickle cell disease progression. J. Clin. Invest. 2014, 124, 2750–2761. [Google Scholar] [CrossRef]
- Zhao, S.; Adebiyi, M.G.; Zhang, Y.; Couturier, J.P.; Fan, X.; Zhang, H.; Kellems, R.E.; Lewis, D.E.; Xia, Y. Sphingosine-1-phosphate receptor 1 mediates elevated IL-6 signaling to promote chronic inflammation and multitissue damage in sickle cell disease. FASEB J. 2018, 32, 2855–2865. [Google Scholar] [CrossRef]
- Elsherif, L.; Pathmasiri, W.; McRitchie, S.; Archer, D.R.; Ataga, K.I.; Townes, T.M. Plasma metabolomics analysis in sickle cell disease patients with albuminuria–an exploratory study. Br. J. Haematol. 2019, 185, 620–623. [Google Scholar]
- Wu, L.C.; Sun, C.W.; Ryan, T.M.; Pawlik, K.M.; Ren, J.; Townes, T.M. Correction of sickle cell disease by homologous recombination in embryonic stem cells. Blood 2006, 108, 1183–1188. [Google Scholar] [CrossRef]
- Eriksson, L.; Johansson, E.; Kettaneh-Wold, N.; Trygg, J.; Wiksström, C.; Wold, S. Part I: Basic Principles and Applications PLS. Multi- and Magavariate Data Analysis, 2nd ed.; Umetrics Ed: Umea, Sweden, 2006; p. 85. [Google Scholar]
- Reiter, C.D.; Gladwin, M.T. An emerging role for nitric oxide in sickle cell disease vascular homeostasis and therapy. Curr. Opin. Hematol. 2003, 10, 99–107. [Google Scholar] [CrossRef]
- Schnog, J.J.; Jager, E.H.; van der Dijs, F.P.; Duits, A.J.; Moshage, H.; Muskiet, F.D.; Muskiet, F.A. Evidence for a metabolic shift of arginine metabolism in sickle cell disease. Ann. Hematol. 2004, 83, 371–375. [Google Scholar] [CrossRef]
- Natta, C.L.; Kremzner, L.T. Polyamines and membrane proteins in sickle cell disease. Blood Cells 1982, 8, 273–280. [Google Scholar] [PubMed]
- Kato, G.J.; Wang, Z.; Machado, R.F.; Blackwelder, W.C.; Taylor, J.G., 6th; Hazen, S.L. Endogenous nitric oxide synthase inhibitors in sickle cell disease: Abnormal levels and correlations with pulmonary hypertension, desaturation, haemolysis, organ dysfunction and death. Br. J. Haematol. 2009, 145, 506–513. [Google Scholar] [CrossRef] [PubMed]
- Tsikas, D. Does the inhibitory action of asymmetric dimethylarginine (ADMA) on the endothelial nitric oxide synthase activity explain its importance in the cardiovascular system? The ADMA paradox. J Controv. Biomed. Res. 2017, 3, 16–22. [Google Scholar] [CrossRef][Green Version]
- Closs, E.I.; Basha, F.Z.; Habermeier, A.; Forstermann, U. Interference of L-arginine analogues with L-arginine transport mediated by the y+ carrier hCAT-2B. Nitric Oxide 1997, 1, 65–73. [Google Scholar] [CrossRef]
- Gore, M.O.; Lüneburg, N.; Schwedhelm, E.; Ayers, C.R.; Anderssohn, M.; Khera, A.; Atzler, D.; de Lemos, J.A.; Grant, P.J.; McGuire, D.K.; et al. Symmetrical dimethylarginine predicts mortality in the general population: Observations from the Dallas heart study. Arterioscler. Thromb. Vasc. Biol. 2013, 33, 2682–2688. [Google Scholar] [CrossRef]
- Tripepi, G.; Mattace, R.F.; Sijbrands, E.; Seck, M.S.; Maas, R.; Boger, R.; Witteman, J.; Rapisarda, F.; Malatino, L.; Mallamaci, F.; et al. Inflammation and asymmetric dimethylarginine for predicting death and cardiovascular events in ESRD patients. Clin. J. Am. Soc. Nephrol. 2011, 6, 1714–1721. [Google Scholar] [CrossRef]
- Schnog, J.B.; Teerlink, T.; van der Dijs, F.P.; Duits, A.J.; Muskiet, F.A.; CURAMA Study Group. Plasma levels of asymmetric dimethylarginine (ADMA), an endogenous nitric oxide synthase inhibitor, are elevated in sickle cell disease. Ann. Hematol. 2005, 84, 282–286. [Google Scholar] [CrossRef]
- Bakshi, N.; Morris, C.R. The role of the arginine metabolome in pain: Implications for sickle cell disease. J Pain Res. 2016, 9, 167–175. [Google Scholar]
- Eleutério, R.M.N.; Nascimento, F.O.; Araújo, T.G.; Castro, M.F.; Filho, T.P.A.; Filho, P.A.M.; Eleutério, J., Jr.; Elias, D.B.D.; Lemes, R.P.G. Double-Blind Clinical Trial of Arginine Supplementation in the Treatment of Adult Patients with Sickle Cell Anaemia. Adv. Hematol. 2019, 2019, 4397150. [Google Scholar] [CrossRef]
- Silva, M.A.; Klafke, J.Z.; Rossato, M.F.; Gewehr, C.; Guerra, G.P.; Rubin, M.A.; Ferreira, J. Role of peripheral polyamines in the development of inflammatory pain. Biochem. Pharmacol. 2011, 82, 269–277. [Google Scholar] [CrossRef]
- Rivat, C.; Richebé, P.; Laboureyras, E.; Laulin, J.P.; Havouis, R.; Noble, F.; Moulinoux, J.P.; Simonnet, G. Polyamine deficient diet to relieve pain hypersensitivity. Pain 2008, 137, 125–137. [Google Scholar] [CrossRef] [PubMed]
- Hänggi, P.; Makhro, A.; Gassmann, M.; Schmugge, M.; Goede, J.S.; Speer, O.; Bogdanova, A. Red blood cells of sickle cell disease patients exhibit abnormally high abundance of N-methyl D-aspartate receptors mediating excessive calcium uptake. Br. J. Haematol. 2014, 167, 252–264. [Google Scholar] [CrossRef] [PubMed]
- Zhou, H.Y.; Chen, S.R.; Pan, H.L. Targeting N-methyl-D-aspartate receptors for treatment of neuropathic pain. Expert Rev. Clin. Pharmacol. 2011, 4, 379–388. [Google Scholar] [CrossRef] [PubMed]
- Lötsch, J.; Hummel, T.; Warskulat, U.; Coste, O.; Häussinger, D.; Geisslinger, G.; Tegeder, I. Congenital taurine deficiency in mice is associated with reduced sensitivity to nociceptive chemical stimulation. Neuroscience 2014, 259, 63–70. [Google Scholar] [CrossRef] [PubMed]
- Van der Leek, A.P.; Yanishevsky, Y.; Kozyrskyj, A.L. The Kynurenine Pathway as a Novel Link between Allergy and the Gut Microbiome. Front. Immunol. 2017, 8, 1374. [Google Scholar] [CrossRef]
- Wang, Y.; Liu, H.; McKenzie, G.; Witting, P.K.; Stasch, J.P.; Hahn, M.; Changsirivathanathamrong, D.; Wu, B.J.; Ball, H.J.; Thomas, S.R.; et al. Kynurenine is an endothelium-derived relaxing factor produced during inflammation. Nat. Med. 2010, 16, 279–285. [Google Scholar]
- Rojewska, E.; Ciapała, K.; Piotrowska, A.; Makuch, W.; Mika, J. Pharmacological Inhibition of Indoleamine 2,3-Dioxygenase-2 and Kynurenine 3-Monooxygenase, Enzymes of the Kynurenine Pathway, Significantly Diminishes Neuropathic Pain in a Rat Model. Front. Pharmacol. 2018, 9, 724. [Google Scholar] [CrossRef]
- Ballas, S.K. Current issues in sickle cell pain and its management. Hematol. Am. Soc. Hematol. Educ. Program. 2007, 1, 97–105. [Google Scholar] [CrossRef]
- Manning, B.M.; Hebbel, R.P.; Gupta, K.; Haynes, C.L. Carbon-fiber microelectrode amperometry reveals sickle-cell-induced inflammation and chronic morphine effects on single mast cells. ACS Chem. Biol. 2012, 7, 543–551. [Google Scholar] [CrossRef]
- Tran, H.; Jarrett, S.; Nguyen, J.; Badgaiyan, R.; Gupta, K. Activation of the Central Serotonergic System Reduces Hyperalgesia in Sickle Mice. Blood 2016, 128, 266. [Google Scholar] [CrossRef]
- Lopez-Vilchez, I.; Diaz-Ricart, M.; White, J.G.; Escolar, G.; Galan, A.M. Serotonin enhances platelet procoagulant properties antheir activation induced during platelet tissue factor upake. Cardiovasc. Res. 2009, 84, 309–316. [Google Scholar] [CrossRef]
- Wang, T.J.; Ngo, D.; Psychogios, N.; Dejam, A.; Larson, M.G.; Vasan, R.S.; Ghorbani, A.; O’Sullivan, J.; Cheng, S.; Rhee, E.P.; et al. 2-Aminoadipic acid is a biomarker for diabetes risk. J. Clin. Invest. 2013, 123, 4309–4317. [Google Scholar] [CrossRef] [PubMed]
- Akinlade, K.S.; Kumuyi, A.S.; Rahamon, S.K.; Olaniyi, J.A. Insulin Sensitivity, Inflammation, and Basal Metabolic Rate in Adults with Sickle Cell Anemia. Int. J. Appl. Basic. Med. Res. 2018, 8, 106–110. [Google Scholar] [CrossRef] [PubMed]
- Chen, G.; Luo, X.; Qadri, M.Y.; Berta, T.; Ji, R.R. Sex-Dependent Glial Signaling in Pathological Pain: Distinct Roles of Spinal Microglia and Astrocytes. Neurosci. Bull. 2018, 34, 98–108. [Google Scholar] [CrossRef]
- Arduini, A.; Mancinelli, G.; Radatti, G.L.; Dottori, S.; Molajoni, F.; Ramsay, R.R. Role of carnitine and carnitine palmitoyltransferase as integral components of the pathway for membrane phospholipid fatty acid turnover in intact human erythrocytes. J. Biol. Chem. 1992, 267, 12673–12681. [Google Scholar]
- Aslan, M.; Kıraç, E.; Kaya, S.; Özcan, F.; Salim, O.; Küpesiz, O.A. Decreased Serum Levels of Sphingomyelins and Ceramides in Sickle Cell Disease Patients. Lipids 2018, 53, 313–322. [Google Scholar] [CrossRef]
- Patti, G.J.; Yanes, O.; Shriver, L.P.; Courade, J.P.; Tautenhahn, R.; Manchester, M.; Siuzdak, G. Metabolomics implicates altered sphingolipids in chronic pain of neuropathic origin. Nat. Chem. Biol. 2012, 8, 232–234. [Google Scholar] [CrossRef]
- Dembélé, K.C.; Veyrat-Durebex, C.; Aldiouma, G.; Chupin, S.; Goïta, Y.; Homedan, C.; Mirebeau-Prunier, D.; Cissé, B.; Simard, G.; Diallo, D.; et al. Sickle cell disease: Metabolomic profiles of vaso-occlusive crisis in plasma and erythrocytes. J. Clin. Med. 2020, 9, 1092. [Google Scholar] [CrossRef]
- Ceglie, G.; Di Mauro, M.; Tarissi De Jacobis, I.; de Gennaro, F.; Quaranta, M.; Baronci, C.; Villani, A.; Palumbo, G. Gender-Related Differences in Sickle Cell Disease in a Pediatric Cohort: A Single-Center Retrospective Study. Front Mol. Biosci. 2019, 6, 140. [Google Scholar] [CrossRef]


© 2020 by the authors. Licensee MDPI, Basel, Switzerland. This article is an open access article distributed under the terms and conditions of the Creative Commons Attribution (CC BY) license (http://creativecommons.org/licenses/by/4.0/).
Share and Cite
Dembélé, K.C.; Mintz, T.; Veyrat-Durebex, C.; Chabrun, F.; Chupin, S.; Tessier, L.; Simard, G.; Henrion, D.; Mirebeau-Prunier, D.; Chao de la Barca, J.M.; et al. Metabolomic Profiling of Plasma and Erythrocytes in Sickle Mice Points to Altered Nociceptive Pathways. Cells 2020, 9, 1334. https://doi.org/10.3390/cells9061334
Dembélé KC, Mintz T, Veyrat-Durebex C, Chabrun F, Chupin S, Tessier L, Simard G, Henrion D, Mirebeau-Prunier D, Chao de la Barca JM, et al. Metabolomic Profiling of Plasma and Erythrocytes in Sickle Mice Points to Altered Nociceptive Pathways. Cells. 2020; 9(6):1334. https://doi.org/10.3390/cells9061334
Chicago/Turabian StyleDembélé, Klétigui Casimir, Thomas Mintz, Charlotte Veyrat-Durebex, Floris Chabrun, Stéphanie Chupin, Lydie Tessier, Gilles Simard, Daniel Henrion, Delphine Mirebeau-Prunier, Juan Manuel Chao de la Barca, and et al. 2020. "Metabolomic Profiling of Plasma and Erythrocytes in Sickle Mice Points to Altered Nociceptive Pathways" Cells 9, no. 6: 1334. https://doi.org/10.3390/cells9061334
APA StyleDembélé, K. C., Mintz, T., Veyrat-Durebex, C., Chabrun, F., Chupin, S., Tessier, L., Simard, G., Henrion, D., Mirebeau-Prunier, D., Chao de la Barca, J. M., Tharaux, P.-L., & Reynier, P. (2020). Metabolomic Profiling of Plasma and Erythrocytes in Sickle Mice Points to Altered Nociceptive Pathways. Cells, 9(6), 1334. https://doi.org/10.3390/cells9061334