Insulin Signaling in Intestinal Stem and Progenitor Cells as an Important Determinant of Physiological and Metabolic Traits in Drosophila


 ,
,
Abstract

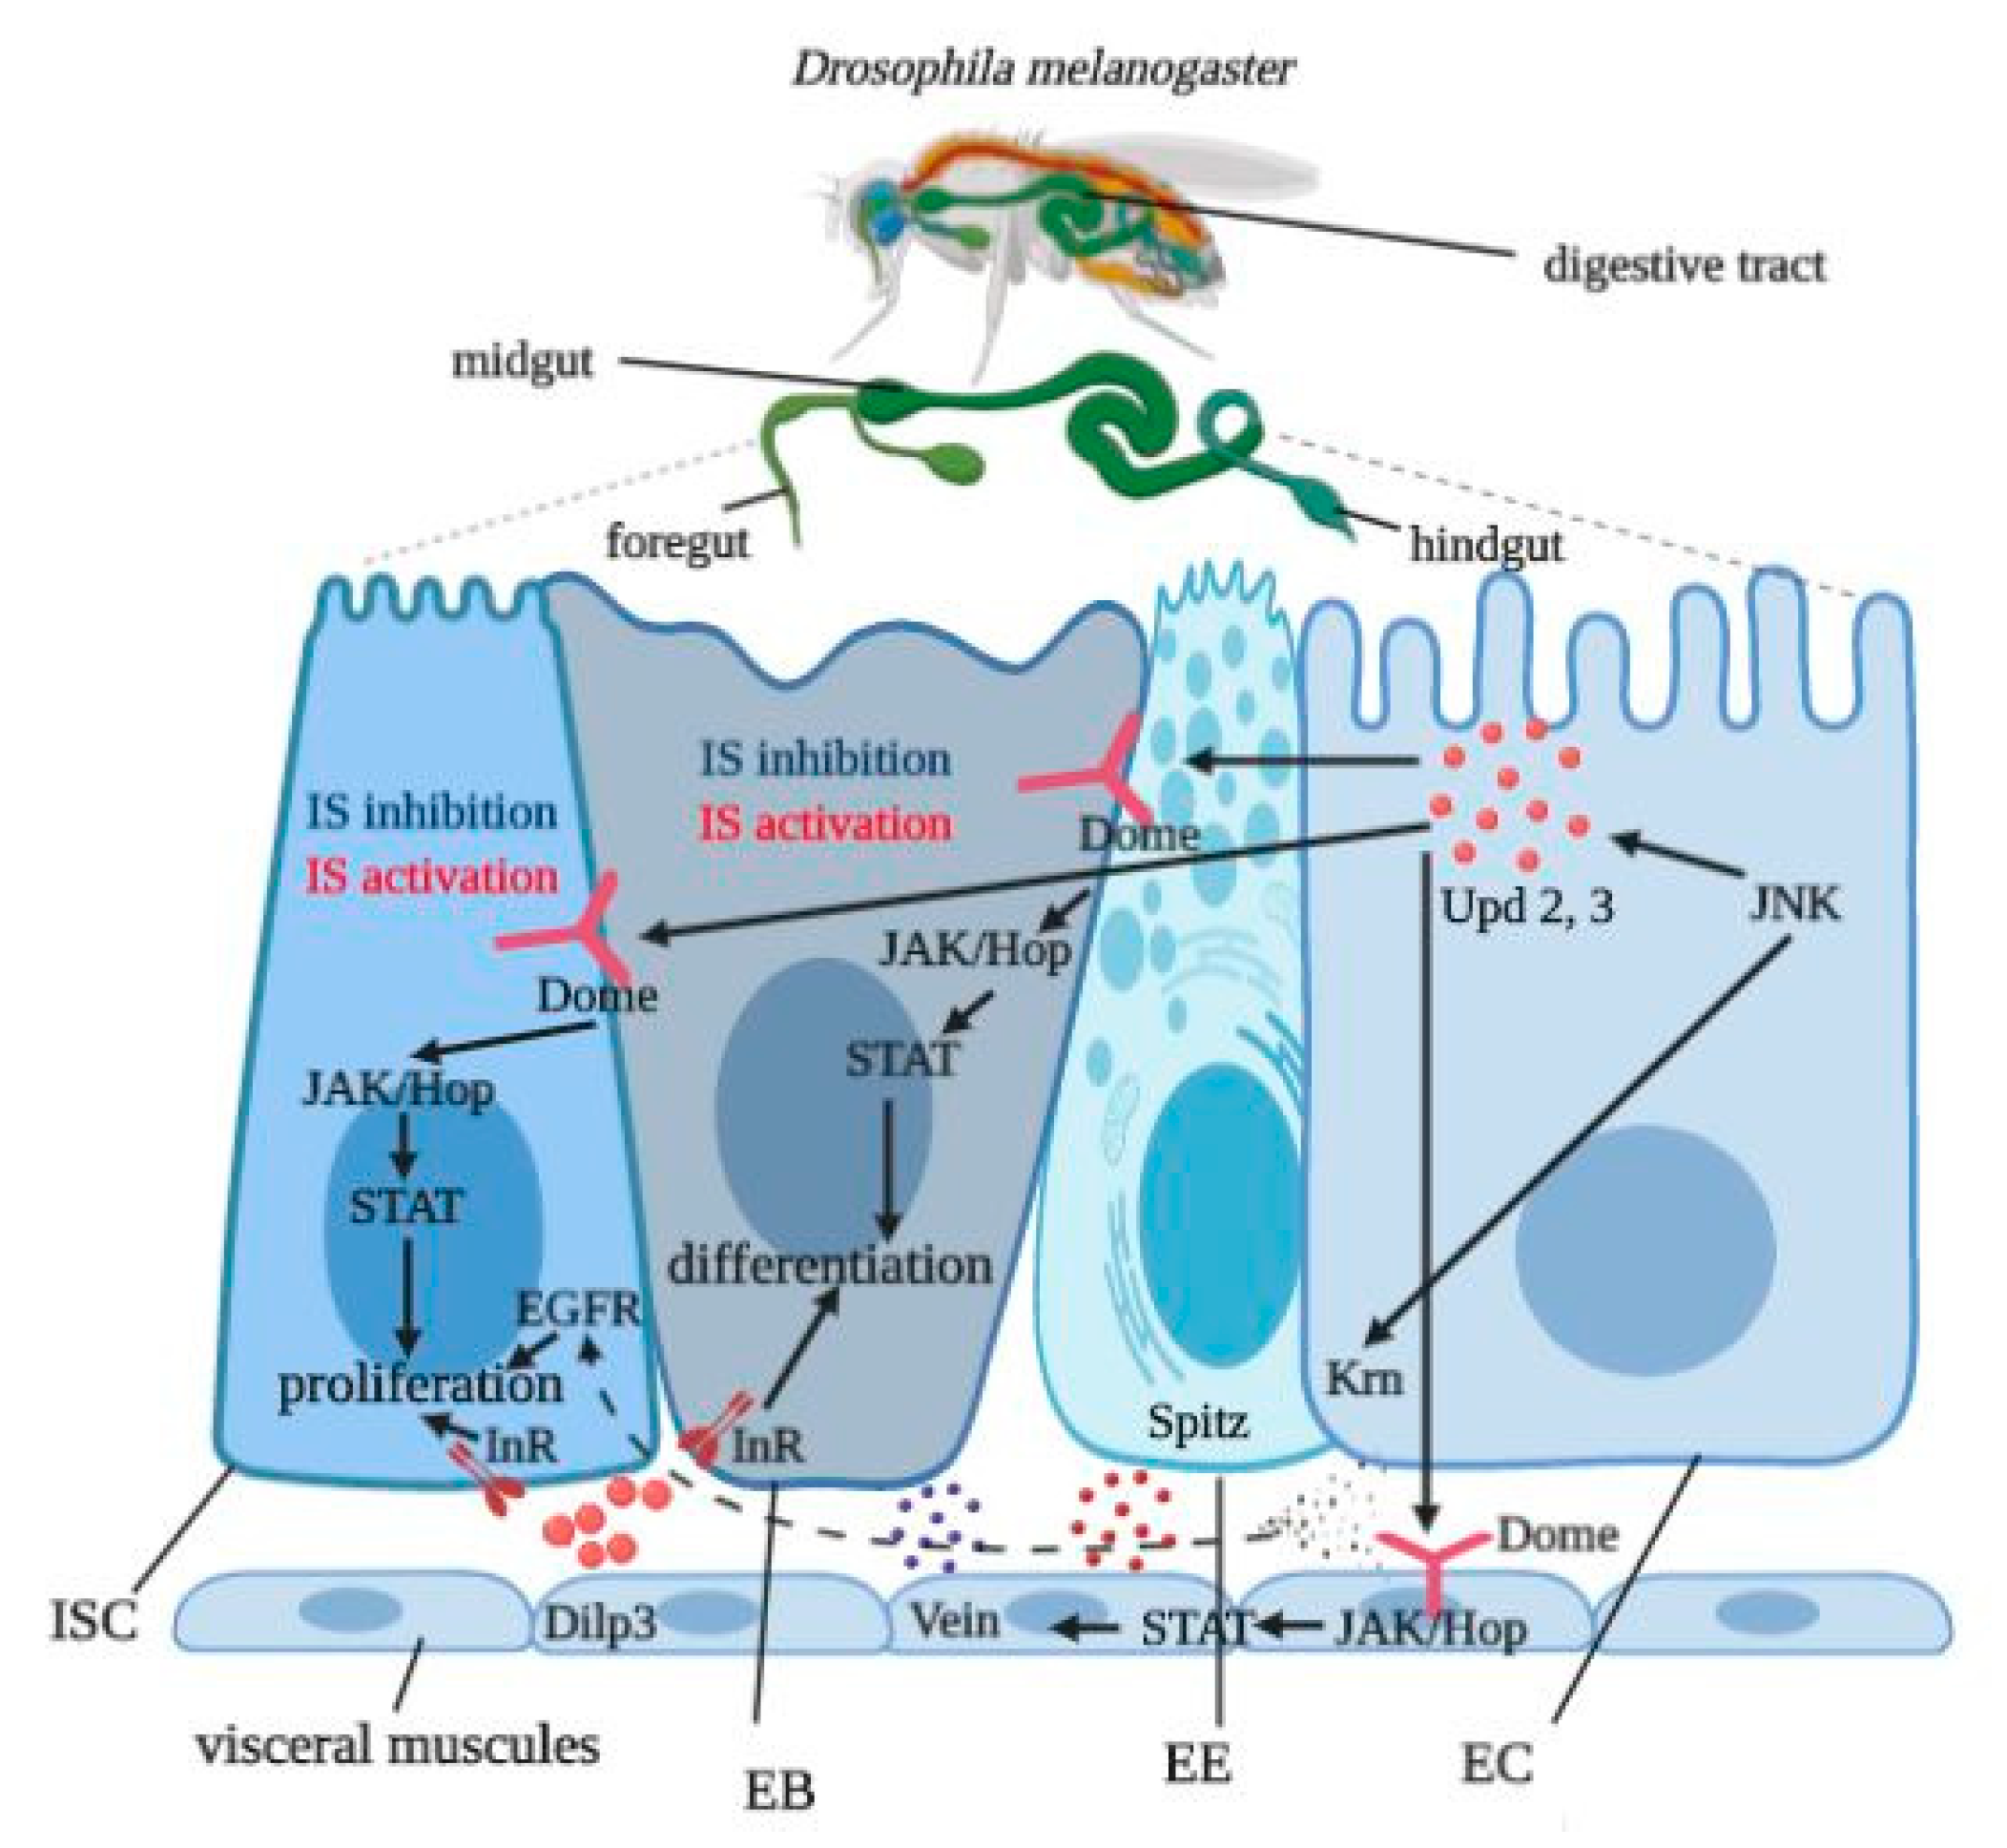
1. Introduction
2. Materials and Methods
2.1. Fly Husbandry and Transgenic Flies
2.2. Lifespan and Fecundity
2.3. Feeding
2.4. Malnutrition and Starvation
2.5. Metabolites
2.6. Analysis of Gut Integrity
2.7. Gene Expression
2.8. Statistical Procedures
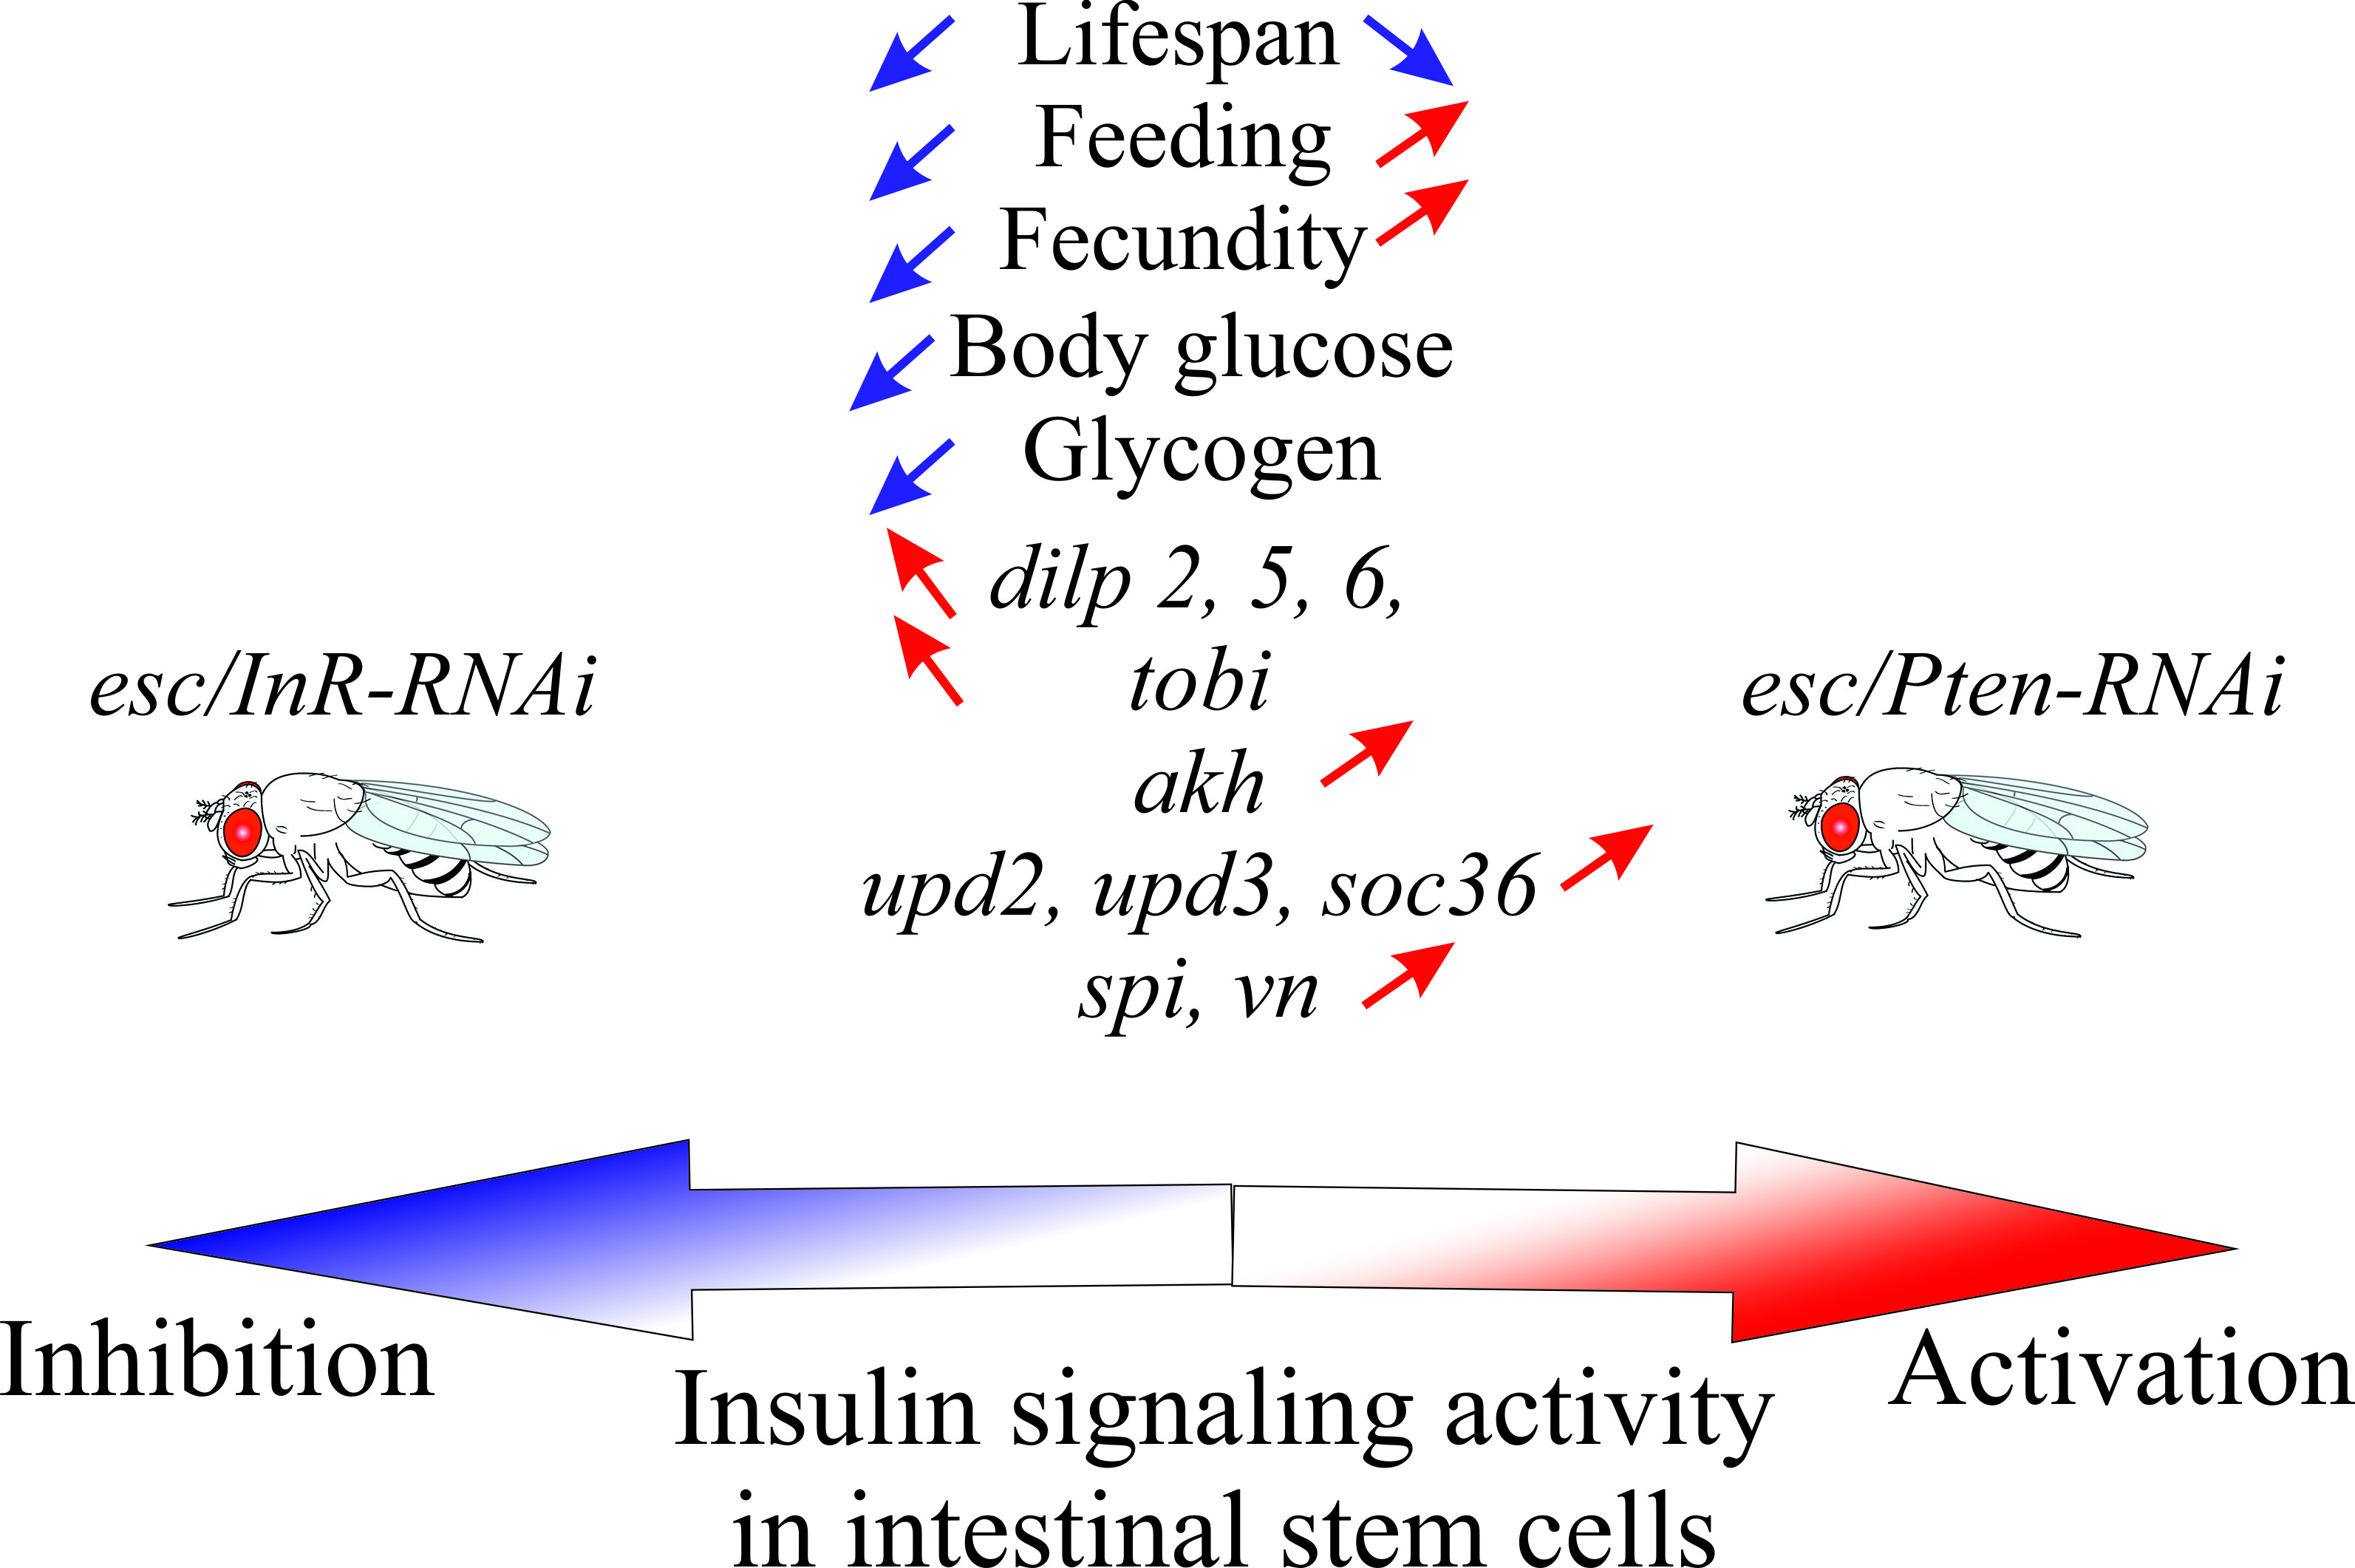
3. Results
3.1. Lifespan and Stress Resistance
3.2. Feeding and Fecundity
3.3. Metabolism
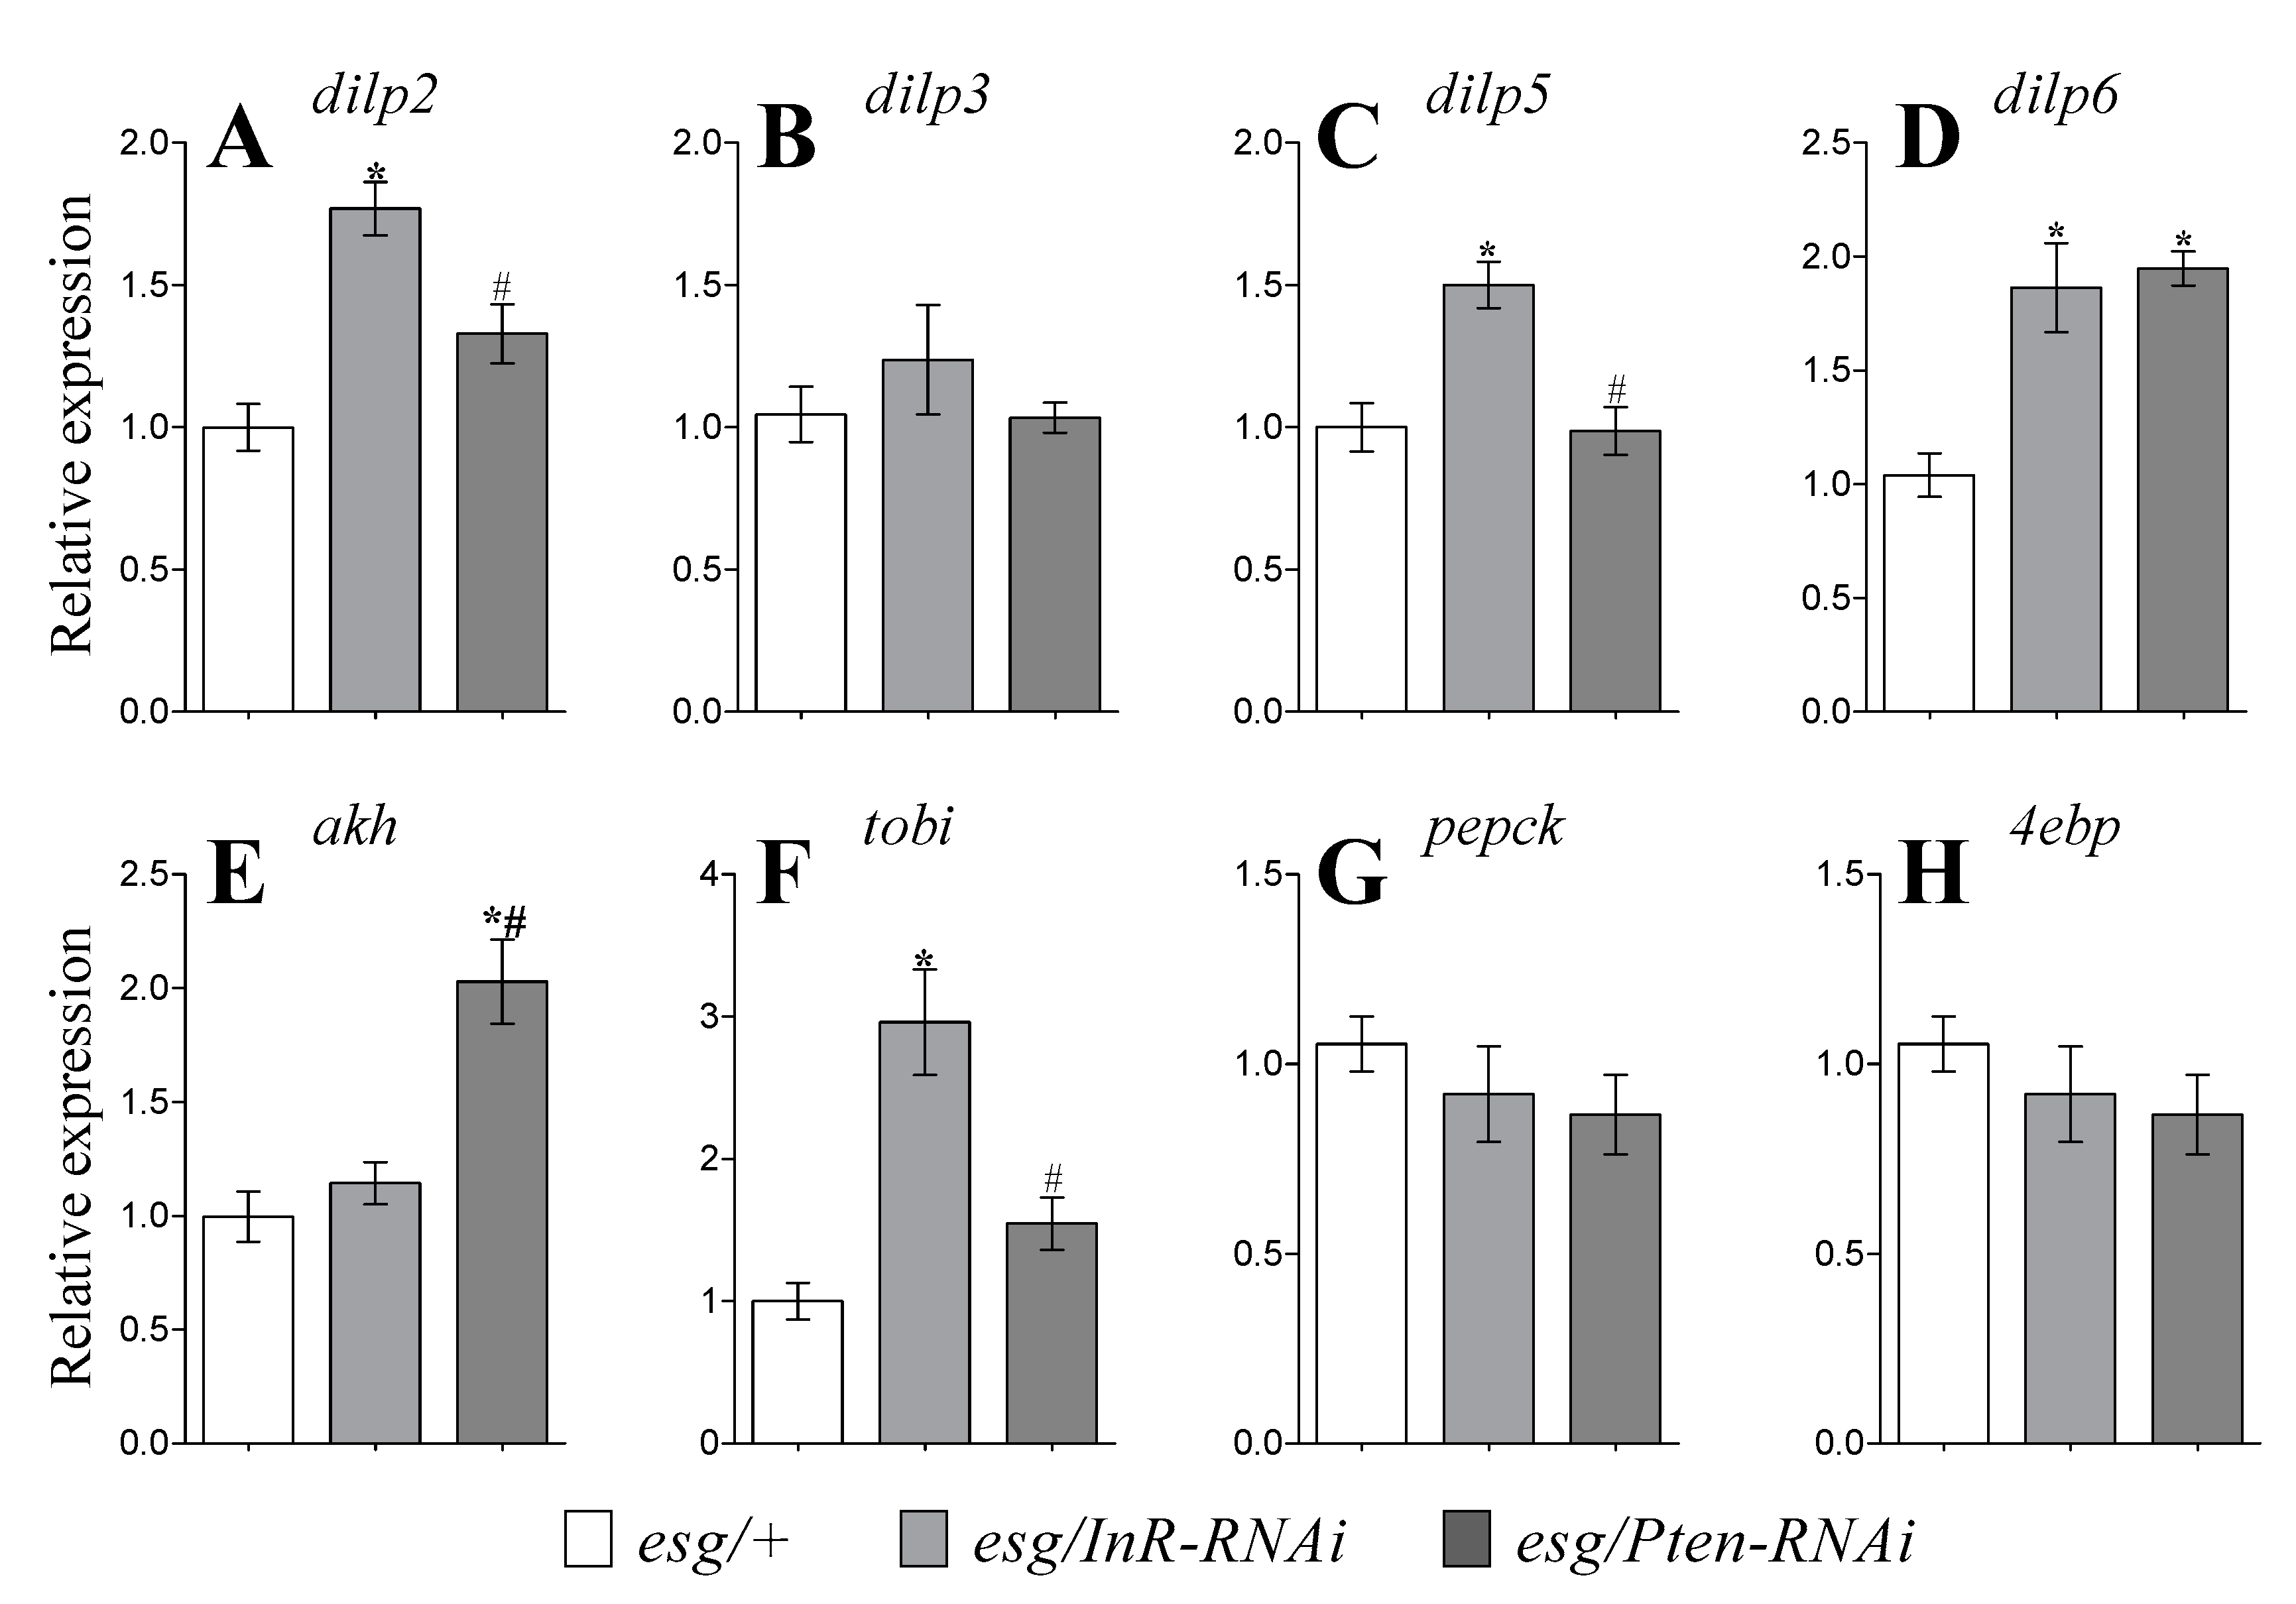
3.4. Expression of DILP Genes
3.5. Expression of Genes Related To Glucagon-Like Signaling and Metabolism
3.6. Gut Tissue-Specific Effects
4. Discussion
5. Conclusions
Supplementary Materials
Author Contributions
Funding
Acknowledgments
Conflicts of Interest
References
- Rera, M.; Clark, R.I.; Walker, D.W. Intestinal barrier dysfunction links metabolic and inflammatory markers of aging to death in Drosophila. Proc. Natl. Acad. Sci. USA 2012, 109, 21528–21533. [Google Scholar] [CrossRef] [PubMed]
- Ohlstein, B.; Spradling, A. Multipotent Drosophila intestinal stem cells specify daughter cell fates by differential notch signaling. Science 2007, 315, 988–992. [Google Scholar] [CrossRef] [PubMed]
- O’Brien, L.E.; Soliman, S.S.; Li, X.; Bilder, D. Altered modes of stem cell division drive adaptive intestinal growth. Cell 2011, 147, 147–603. [Google Scholar] [CrossRef]
- Zeng, X.; Han, L.; Singh, S.R.; Liu, H.; Neumüller, R.A.; Yan, D.; Hu, Y.; Liu, Y.; Liu, W.; Lin, X.; et al. Genome-wide RNAi screen identifies networks involved in intestinal stem cell regulation in Drosophila. Cell Rep. 2015, 10, 1226–1238. [Google Scholar] [CrossRef] [PubMed]
- Amcheslavsky, A.; Jiang, J.; Ip, Y.T. Tissue damage-induced intestinal stem cell division in Drosophila. Cell Stem Cell 2009, 4, 49–61. [Google Scholar] [CrossRef] [PubMed]
- Choi, N.H.; Lucchetta, E.; Ohlstein, B. Nonautonomous regulation of Drosophila midgut stem cell proliferation by the insulin-signaling pathway. Proc. Natl. Acad. Sci. USA 2011, 108, 18702–18707. [Google Scholar] [CrossRef]
- McLeod, C.J.; Wang, L.; Wong, C.; Jones, D.L. Stem cell dynamics in response to nutrient availability. Curr. Biol. 2010, 20, 2100–2105. [Google Scholar] [CrossRef]
- Biteau, B.; Karpac, J.; Supoyo, S.; Degennaro, M.; Lehmann, R.; Jasper, H. Lifespan extension by preserving proliferative homeostasis in Drosophila. PLoS Genet. 2010, 6, e1001159. [Google Scholar] [CrossRef]
- Brand, A.H.; Perrimon, N. Targeted gene expression as a means of altering cell fates and generating dominant phenotypes. Development 1993, 118, 401–415. [Google Scholar]
- Lushchak, O.V.; Gospodaryov, D.V.; Rovenko, B.M.; Glovyak, A.D.; Yurkevych, I.S.; Klyuba, V.P.; Scherbij, M.V.; Lushchak, V.I. Balance between macronutrients affects lifespan and functional senescence in fruit fly Drosophila melanogaster. J. Gerontol. A Biol. Sci. Med. Sci. 2012, 67, 118–125. [Google Scholar] [CrossRef]
- Lushchak, O.V.; Gospodaryov, D.V.; Rovenko, B.M.; Yurkevych, I.S.; Perkhulyn, N.V.; Lushchak, V.I. Specific dietary carbohydrates differentially influence the life span and fecundity of Drosophila melanogaster. J. Gerontol. A Biol. Sci. Med. Sci. 2014, 69, 3–12. [Google Scholar] [CrossRef] [PubMed]
- Rovenko, B.M.; Kubrak, O.I.; Gospodaryov, D.V.; Perkhulyn, N.V.; Yurkevych, I.S.; Sanz, A.; Lushchak, O.V.; Lushchak, V.I. High sucrose consumption promotes obesity whereas its low consumption induces oxidative stress in Drosophila melanogaster. J. Insect Physiol. 2015, 7, 42–54. [Google Scholar] [CrossRef] [PubMed]
- Rovenko, B.M.; Perkhulyn, N.V.; Lushchak, O.; Storey, J.M.; Storey, K.B.; Lushchak, V.I. Molybdate partly mimics insulin-promoted metabolic effects in Drosophila melanogaster. Comp. Biochem. Physiol. C Toxicol. Pharmacol. 2014, 165, 76–82. [Google Scholar] [CrossRef] [PubMed]
- Lushchak, O.V.; Carlsson, M.A.; Nässel, D.R. Food odors trigger an endocrine response that affects food ingestion and metabolism. Cell. Mol. Life Sci. 2015, 72, 3143–3155. [Google Scholar] [CrossRef] [PubMed]
- Strilbytska, O.M.; Semaniuk, U.V.; Storey, K.B.; Edgar, B.A.; Lushchak, O.V. Activation of the Tor/Myc signaling axis in intestinal stem and progenitor cells affects longevity, stress resistance and metabolism in Drosophila. Comp. Biochem. Physiol. B Biochem. Mol. Biol. 2017, 203, 92–99. [Google Scholar] [CrossRef] [PubMed]
- Broughton, S.J.; Piper, M.D.; Ikeya, T.; Bass, T.M.; Jacobson, J.; Driege, Y.; Martinez, P.; Hafen, E.; Withers, D.J.; Leevers, S.J.; et al. Longer lifespan, altered metabolism, and stress resistance in Drosophila from ablation of cells making insulin-like ligands. Proc. Natl. Acad. Sci. USA 2005, 102, 3105–3110. [Google Scholar] [CrossRef]
- Bharucha, K.N.; Tarr, P.; Zipursky, S.L. A glucagon-like endocrine pathway in Drosophila modulates both lipid and carbohydrate homeostasis. J. Exp. Biol. 2008, 211, 3103–3110. [Google Scholar] [CrossRef]
- Buch, S.; Melcher, C.; Bauer, M.; Katzenberger, J.; Pankratz, M.J. Opposing effects of dietary protein and sugar regulate a transcriptional target of Drosophila insulin-like peptide signaling. Cell Metab. 2008, 7, 321–332. [Google Scholar] [CrossRef]
- Okamura, T.; Shimizu, H.; Nagao, T.; Ueda, R.; Ishii, T. ATF-2 regulates fat metabolism in Drosophila. Mol. Biol. Cell 2007, 18, 1519–1529. [Google Scholar] [CrossRef]
- Bauzek, N. JAK-STAT signaling in stem cells and their niches in Drosophila. Landes Biosci. 2013, 2, e25686. [Google Scholar]
- Tatar, M.; Kopelman, A.; Epstein, D.; Tu, M.P.; Yin, C.M.; Garofalo, R.S. A mutant Drosophila insulin receptor homolog that extends life-span and impairs neuroendocrine function. Science 2001, 292, 107–110. [Google Scholar] [CrossRef] [PubMed]
- Hwangbo, D.S.; Gershman, B.; Tu, M.P.; Palmer, M.; Tatar, M. Drosophila dFOXO controls lifespan and regulates insulin signalling in brain and fat body. Nature 2004, 429, 562–566. [Google Scholar] [CrossRef] [PubMed]
- Kimura, K.D.; Tissenbaum, H.A.; Liu, Y.; Ruvkun, G. Daf-2, an insulin receptor-like gene that regulates longevity and diapause in Caenorhabditis elegans. Science 1997, 277, 942–946. [Google Scholar] [CrossRef] [PubMed]
- Bluher, M.; Kahn, B.B.; Kahn, C.R. Extended longevity in mice lacking the insulin receptor in adipose tissue. Science 2003, 299, 572–574. [Google Scholar] [CrossRef] [PubMed]
- Buchon, N.; Broderick, N.A.; Kuraishi, T.; Lemaitre, B. Drosophila EGFR pathway coordinates stem cell proliferation and gut remodeling following infection. BMC Biol. 2010, 8, 152. [Google Scholar] [CrossRef] [PubMed]
- Jiang, H.; Grenley, M.O.; Bravo, M.J.; Blumhagen, R.Z.; Edgar, B.A. EGFR/Ras/MAPK signaling mediates adult midgut epithelial homeostasis and regeneration in Drosophila. Cell Stem Cell 2011, 8, 84–95. [Google Scholar] [CrossRef]
- Grönke, S.; Clarke, D.F.; Broughton, S.; Andrews, T.D.; Partridge, L. Molecular evolution and functional characterization of Drosophila insulin-like peptides. PLoS Genet. 2010, 6, e1000857. [Google Scholar] [CrossRef]
- Bai, H.; Kang, P.; Tatar, M. Drosophila insulin-like peptide-6 (dilp6) expression from fat body extends lifespan and represses secretion of Drosophila insulin-like peptide-2 from the brain. Aging Cell 2012, 11, 978–985. [Google Scholar] [CrossRef]
- Yang, J.; Kalhan, S.C.; Hanson, R.W. What is the metabolic role of phosphoenolpyruvate carboxykinase? J. Biol. Chem. 2009, 284, 27025–27029. [Google Scholar] [CrossRef]
- Lushchak, O.; Strilbytska, O.; Piskovatska, V.; Storey, K.B.; Koliada, A.; Vaiserman, A. The role of the TOR pathway in mediating the link between nutrition and longevity. Mech. Ageing Dev. 2017, 164, 127–138. [Google Scholar] [CrossRef]
- Lushchak, O.; Strilbytska, O.M.; Yurkevych, I.; Vaiserman, A.M.; Storey, K.B. Implications of amino acid sensing and dietary protein to the aging process. Exp. Gerontol. 2019, 115, 69–78. [Google Scholar] [CrossRef] [PubMed]
- Strilbytska, O.M.; Storey, K.B.; Lushchak, O.V. TOR signaling inhibition in intestinal stem and progenitor cells affects physiology and metabolism in Drosophila. Comp. Biochem. Physiol. B Biochem. Mol. Biol. 2020, 243, 110424. [Google Scholar] [CrossRef] [PubMed]


| Parameters | Inhibition | Activation |
|---|---|---|
| Lifespan |  | |
| Starvation resistance |  |  |
| Malnutrition resistance 1% sucrose |  |  |
| Malnutrition resistance 1% autolyzed yeast |  |  |
| Malnutrition resistance 0.5% S and 0.5% AY |  | |
| Feeding, Fecundity |  |  |
| Body glucose, glycogen |  | |
| dilp2, dilp5, tobi |  | |
| dilp6 |  |  |
| akh |  | |
| upd2, upd3, soc36 |  | |
| spi |  | |
| vn |  |  |
© 2020 by the authors. Licensee MDPI, Basel, Switzerland. This article is an open access article distributed under the terms and conditions of the Creative Commons Attribution (CC BY) license (http://creativecommons.org/licenses/by/4.0/).
Share and Cite
Strilbytska, O.M.; Semaniuk, U.V.; Storey, K.B.; Yurkevych, I.S.; Lushchak, O. Insulin Signaling in Intestinal Stem and Progenitor Cells as an Important Determinant of Physiological and Metabolic Traits in Drosophila. Cells 2020, 9, 803. https://doi.org/10.3390/cells9040803
Strilbytska OM, Semaniuk UV, Storey KB, Yurkevych IS, Lushchak O. Insulin Signaling in Intestinal Stem and Progenitor Cells as an Important Determinant of Physiological and Metabolic Traits in Drosophila. Cells. 2020; 9(4):803. https://doi.org/10.3390/cells9040803
Chicago/Turabian StyleStrilbytska, Olha M., Uliana V. Semaniuk, Kenneth B. Storey, Ihor S. Yurkevych, and Oleh Lushchak. 2020. "Insulin Signaling in Intestinal Stem and Progenitor Cells as an Important Determinant of Physiological and Metabolic Traits in Drosophila" Cells 9, no. 4: 803. https://doi.org/10.3390/cells9040803
APA StyleStrilbytska, O. M., Semaniuk, U. V., Storey, K. B., Yurkevych, I. S., & Lushchak, O. (2020). Insulin Signaling in Intestinal Stem and Progenitor Cells as an Important Determinant of Physiological and Metabolic Traits in Drosophila. Cells, 9(4), 803. https://doi.org/10.3390/cells9040803