The Diagnostic Value of Mir-133a in ST Elevation and Non-ST Elevation Myocardial Infarction: A Meta-Analysis


Abstract
1. Introduction
2. Materials and Methods
2.1. Search Strategy
2.2. Inclusion and Exclusion Criteria
- STEMI or NSTEMI was the clinical diagnosis in study patients.
- The study was either case-controlled or a cohort.
- Mir-133a was quantified from plasma using qRT-PCR with either SYBR or TaqMan probes.
- Sample size, area under the standard receiver operator characteristic curve (AUC), location of study, and maximum plasma sample collection time must be stated.
- A sample size of 5 or more patients was required for each subgroup.
- Papers written in languages other than English.
- Reviews, meta-analyses, posters, and correspondence letters.
- Experimental design based solely on animal models.
2.3. Data Extraction
2.4. Statistical Analysis
3. Results
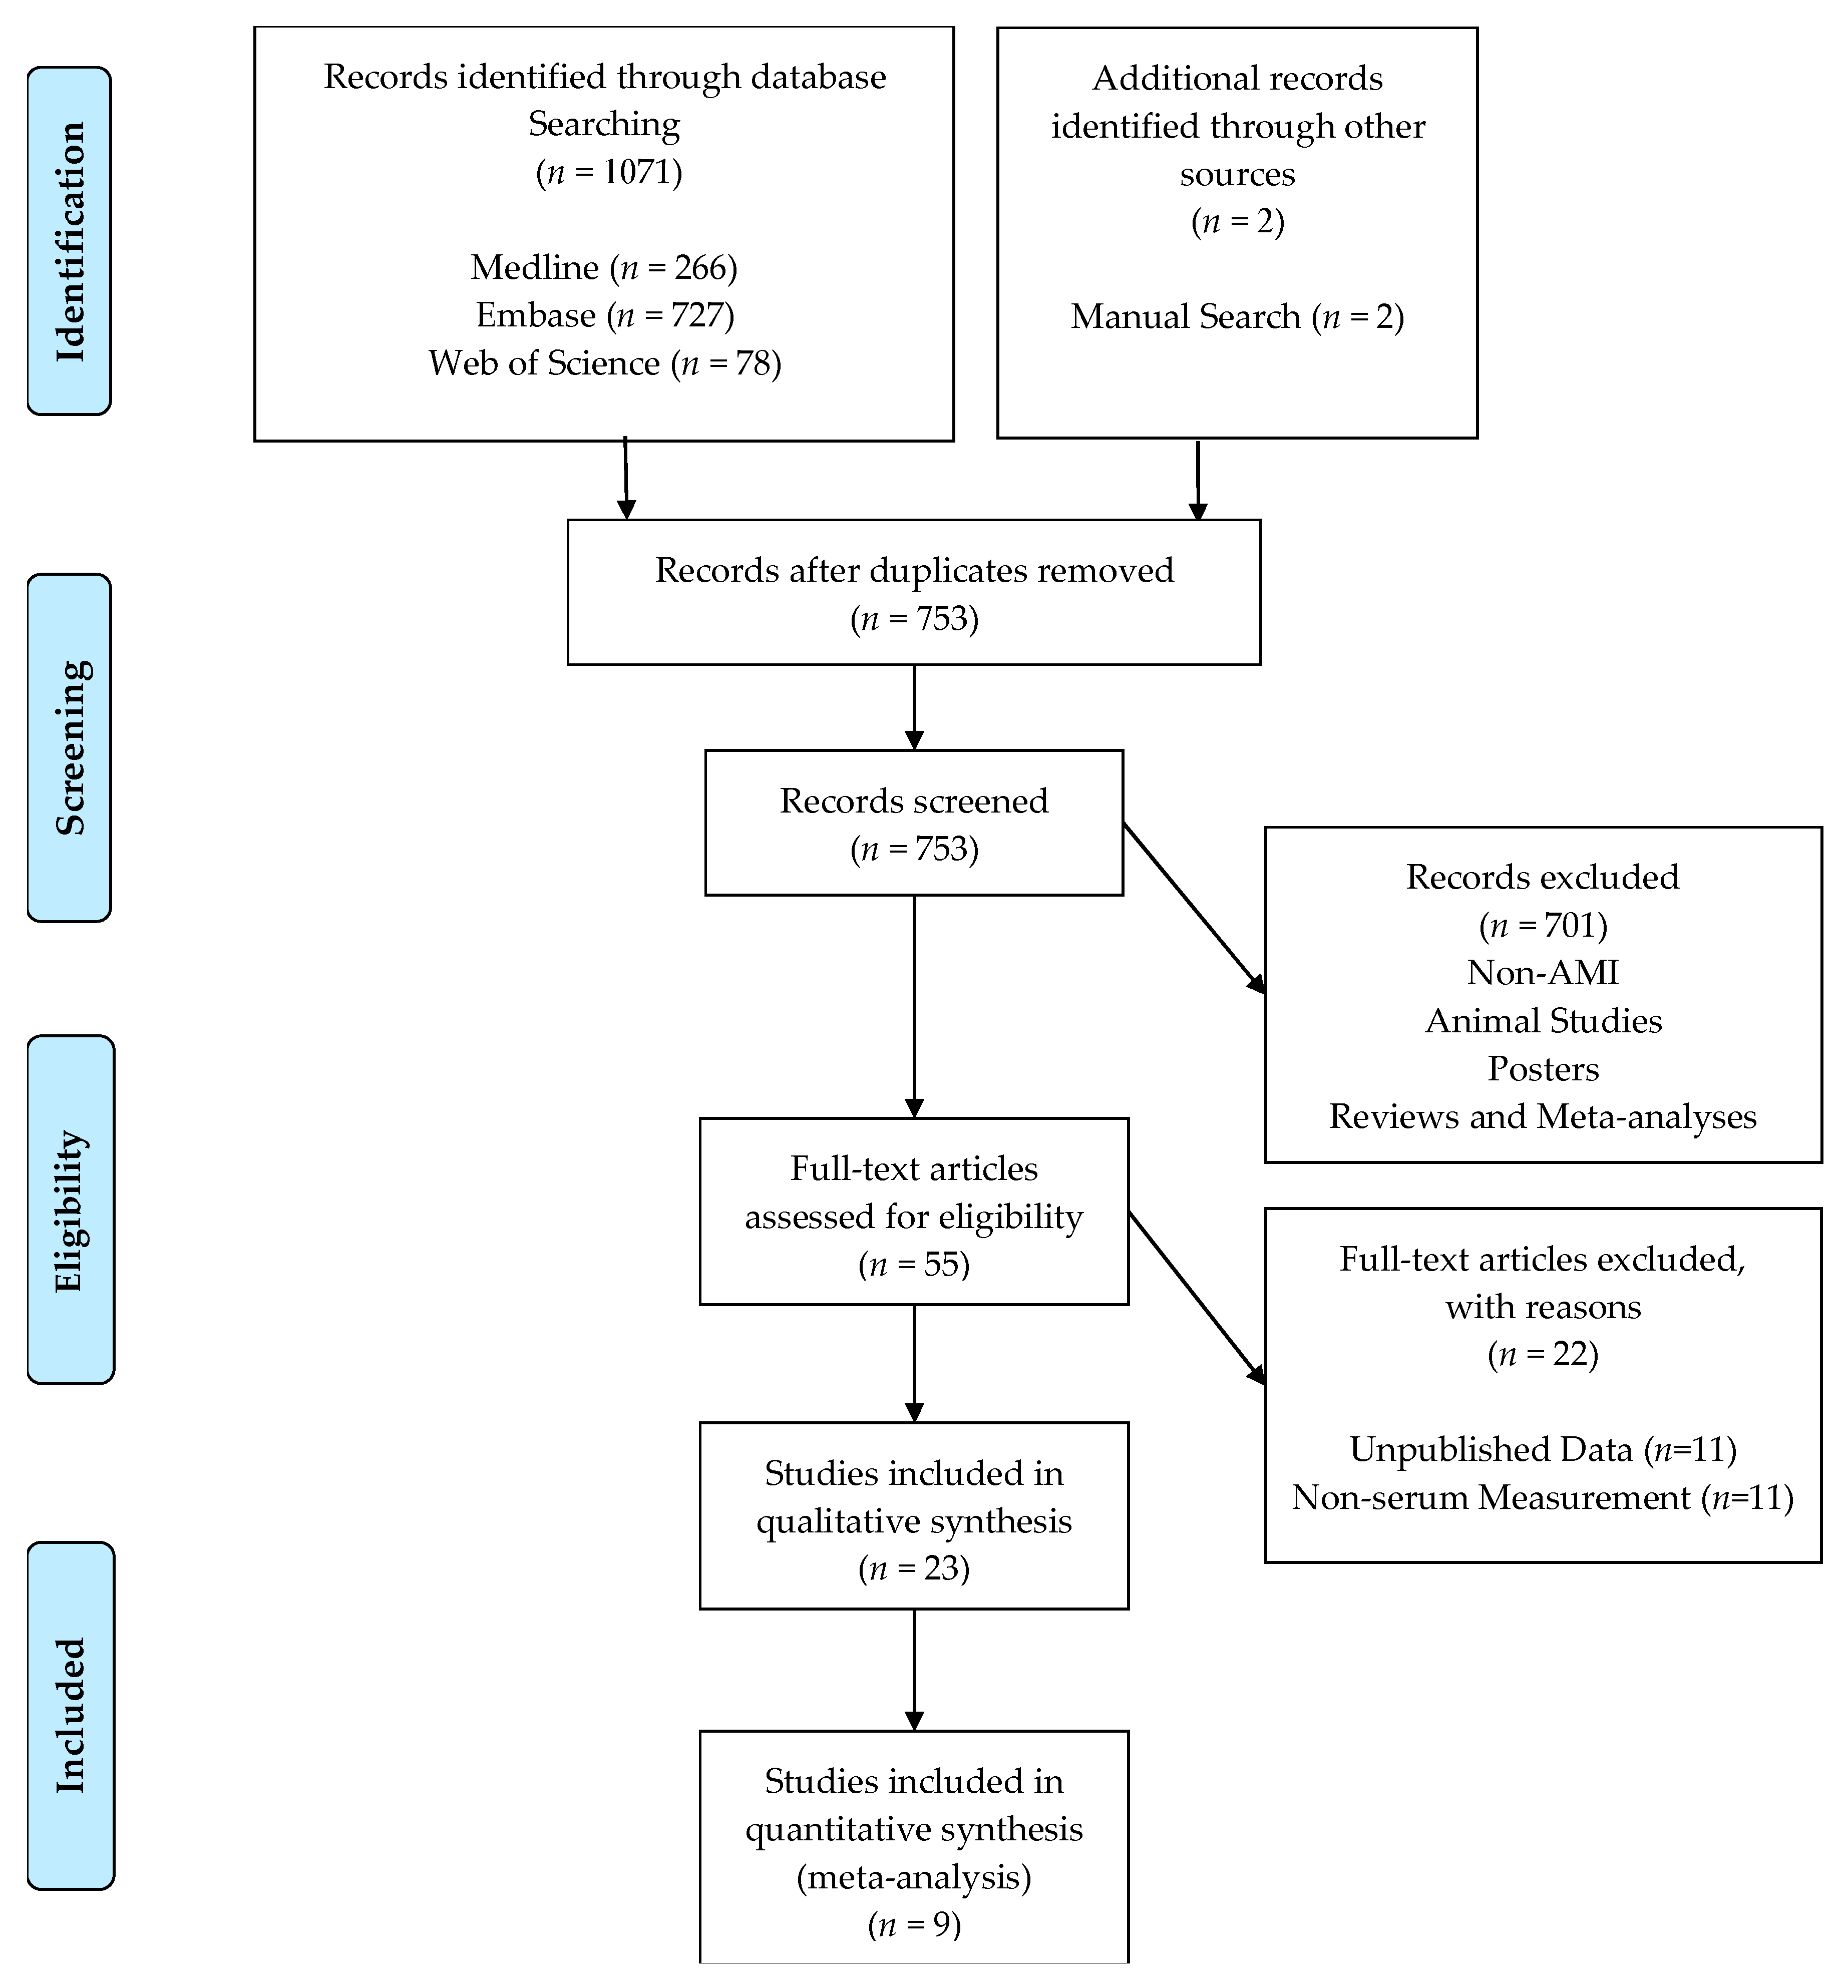
3.1. Literature Search Results
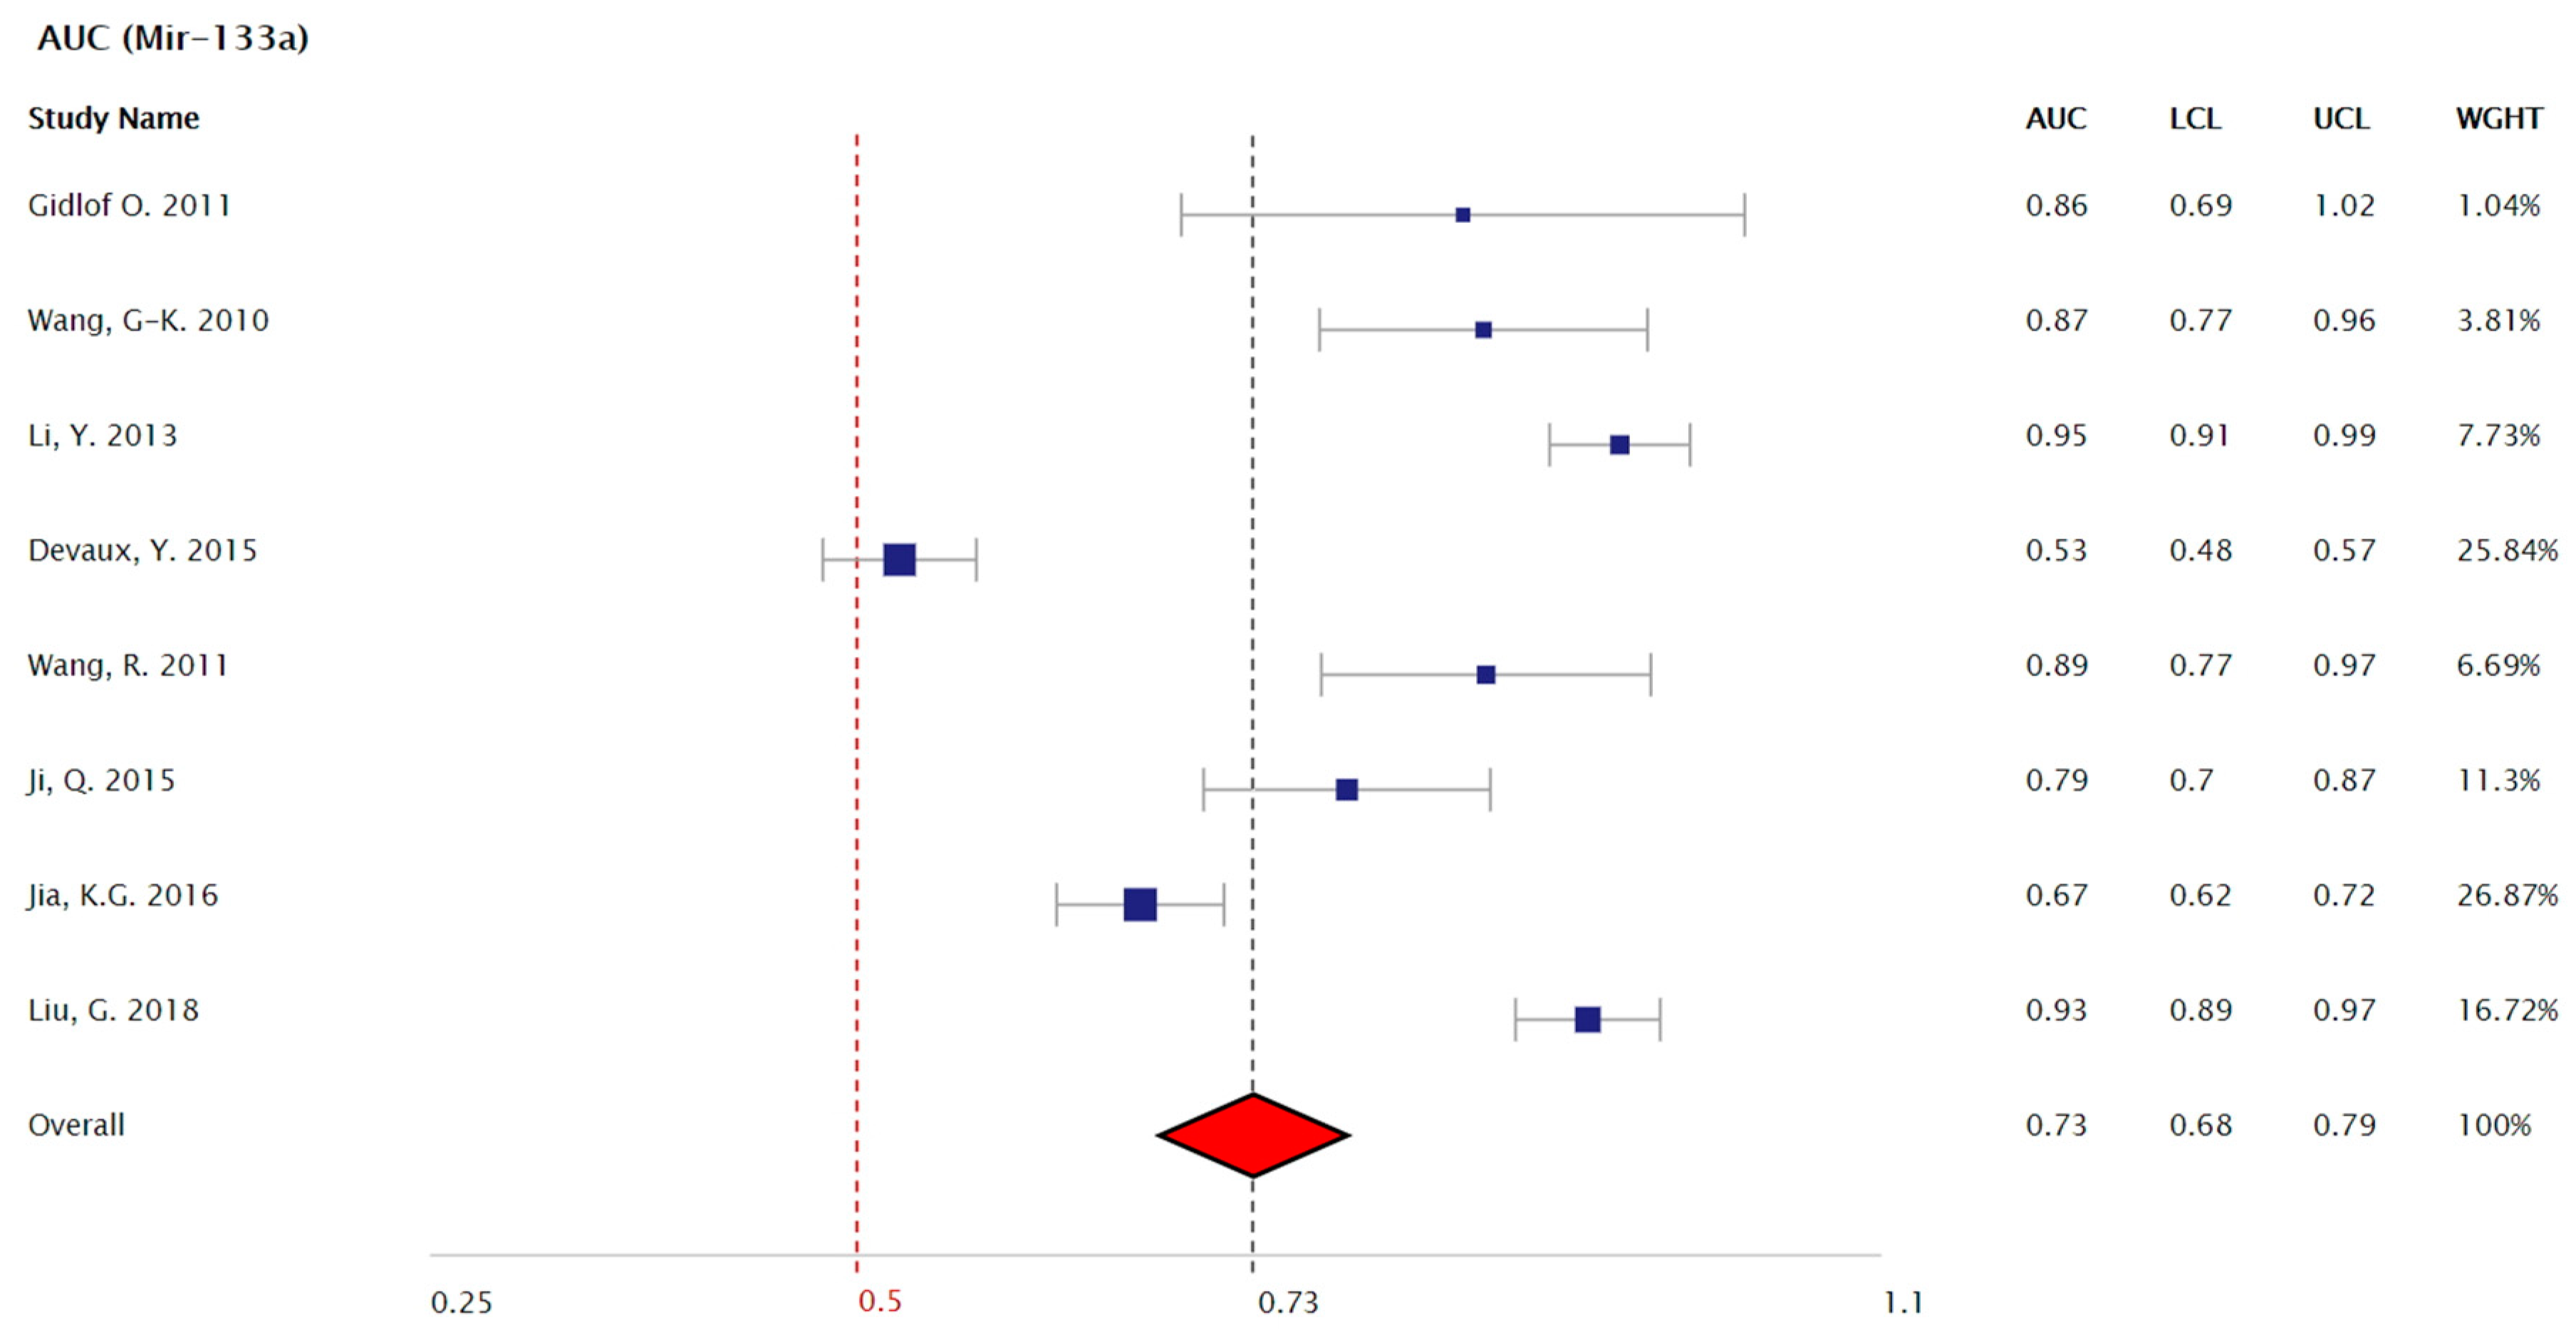
3.2. Meta-Analysis Results
4. Discussion
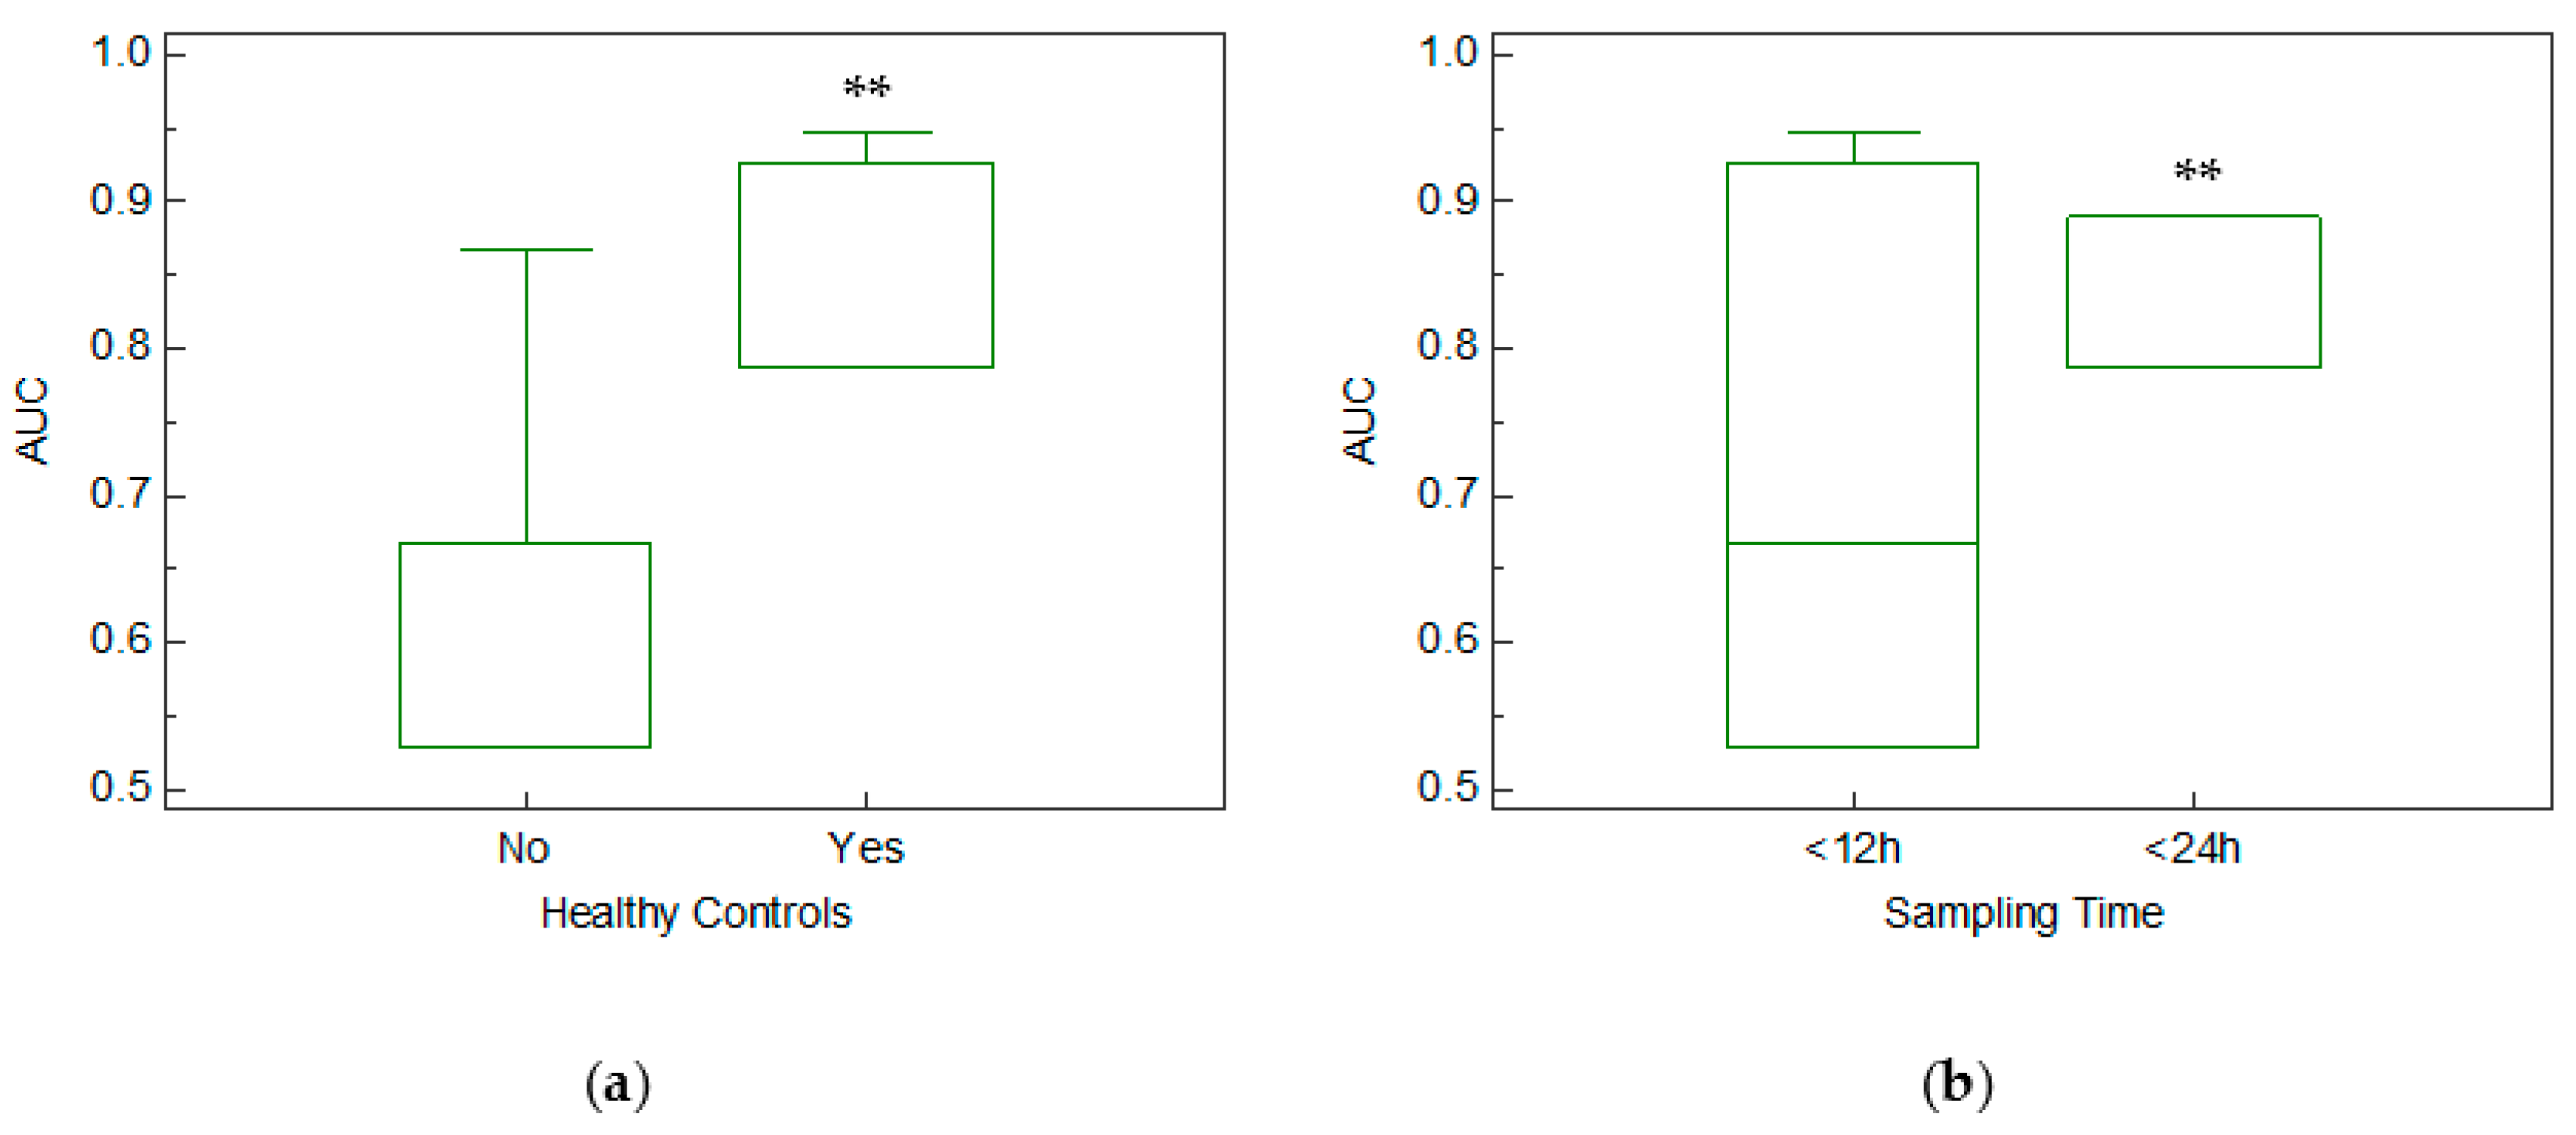
4.1. Mir-133a As an Early Biomarker for the Diagnosis of AMI
4.2. Mir-133a in Healthy and Unhealthy Controls
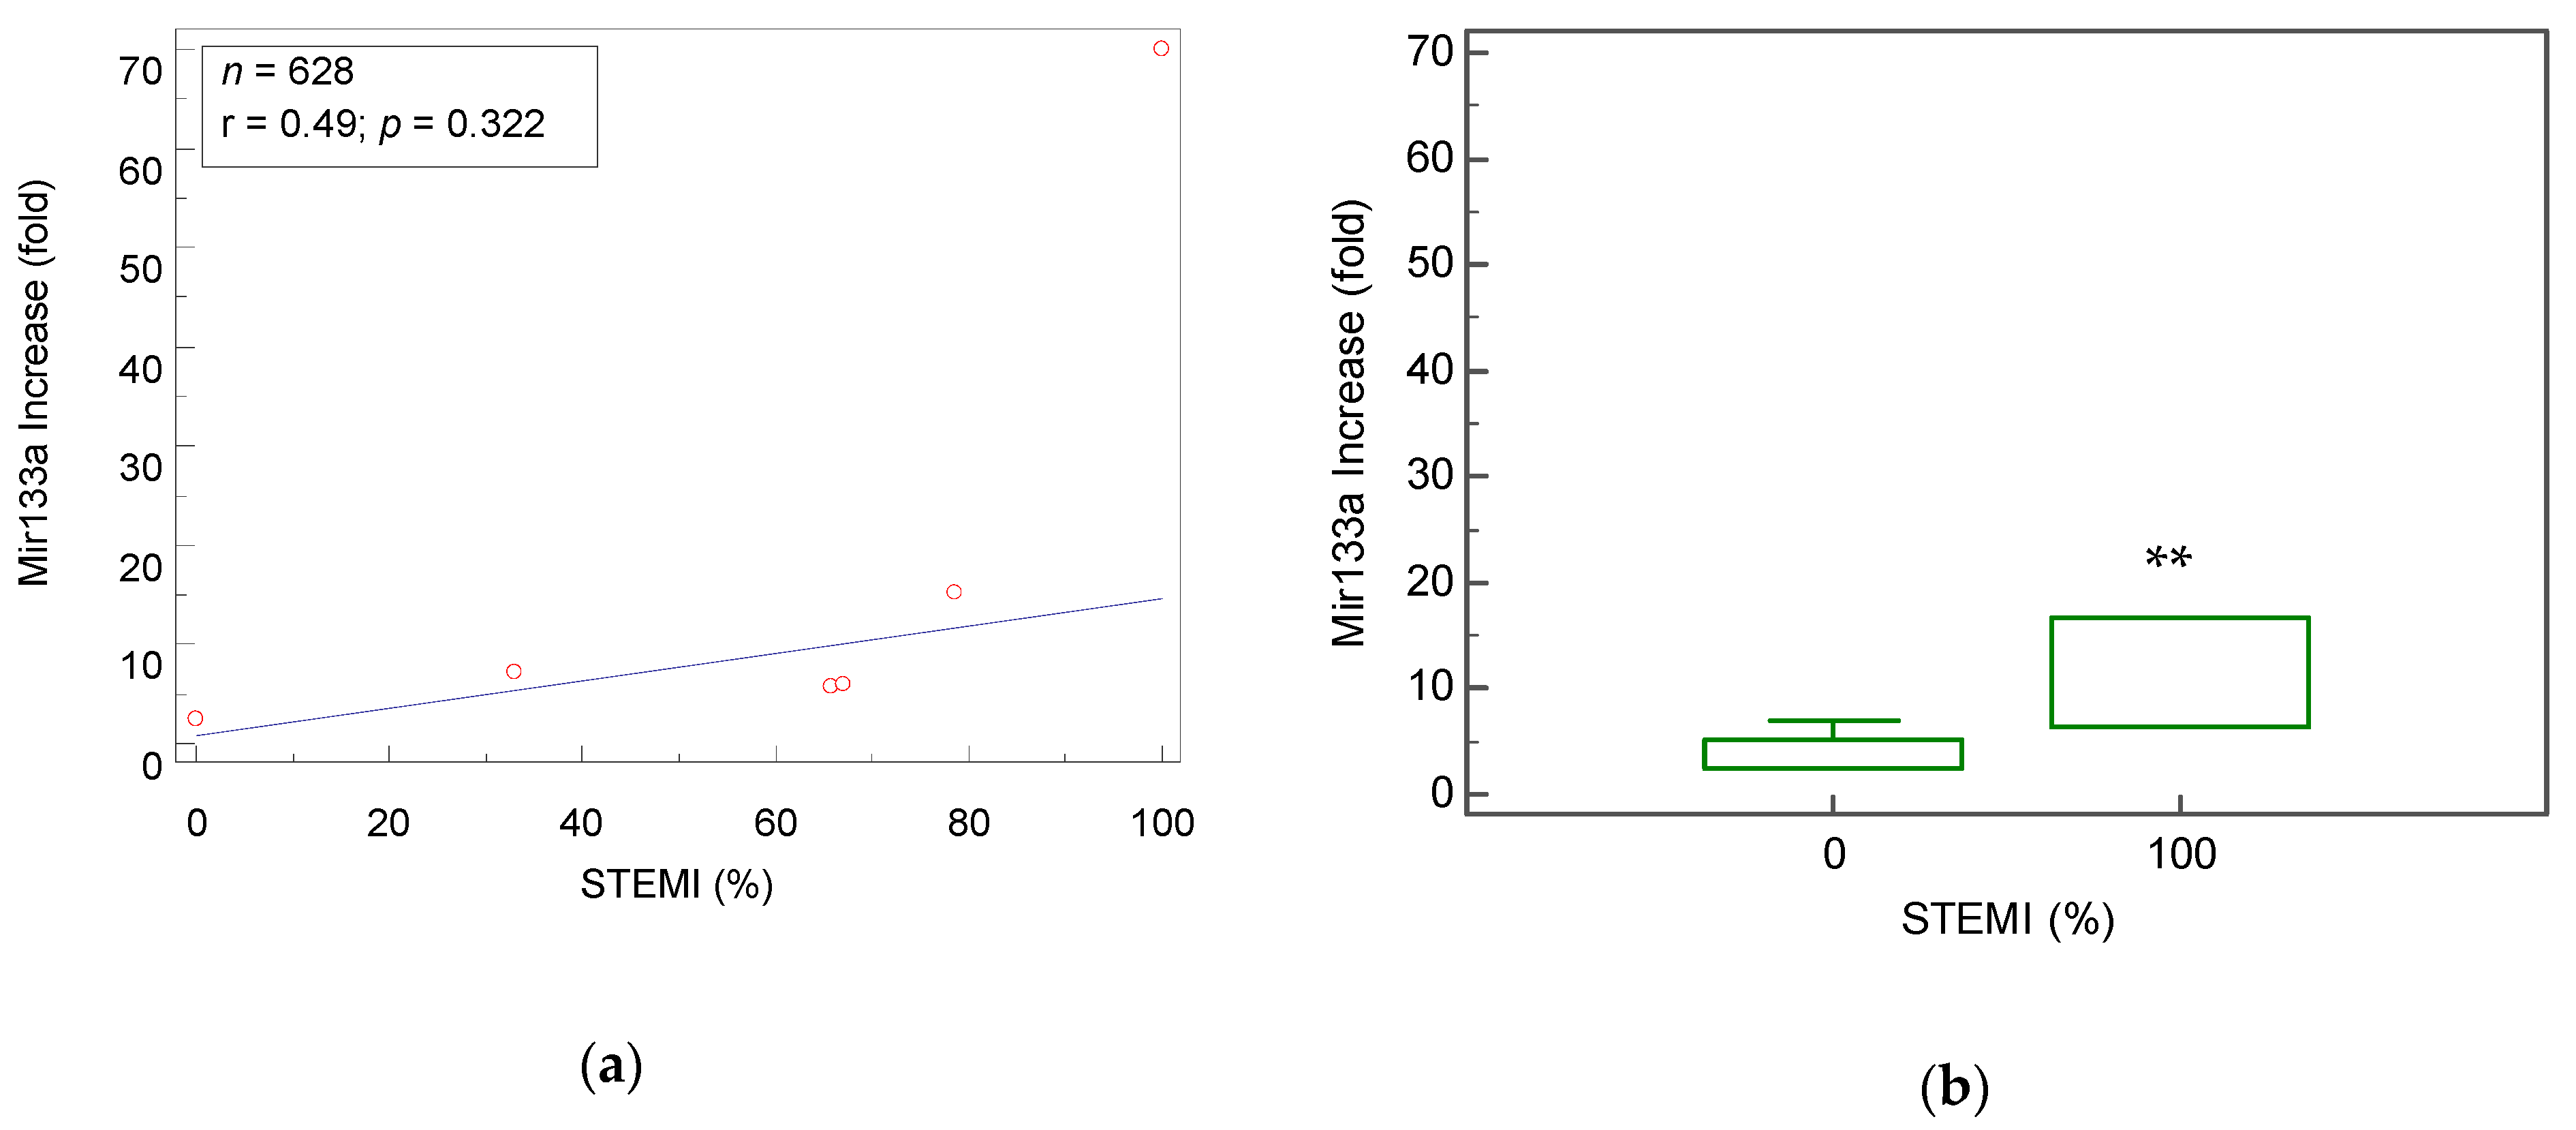
4.3. Mir-133a As a Biomarker that Distinguishes Between STEMI and NSTEMI
4.4. Study Limitations and Methodological Issues
5. Conclusions
Supplementary Materials
Author Contributions
Funding
Acknowledgments
Conflicts of Interest
References
- Heron, M. Deaths: Leading Causes for 2015. Natl. Vital Stat. Rep. 2017, 66, 1–76. [Google Scholar] [PubMed]
- Benjamin, E.J.; Muntner, P.; Alonso, A.; Bittencourt, M.S.; Callaway, C.W.; Carson, A.P.; Chamberlain, A.M.; Chang, A.R.; Cheng, S.; Das, S.R.; et al. Heart Disease and Stroke Statistics-2019 Update: A Report From the American Heart Association. Circulation 2019, 139, e56–e66. [Google Scholar] [CrossRef] [PubMed]
- Fryar, C.D.; Chen, T.C.; Li, X. Prevalence of uncontrolled risk factors for cardiovascular disease: United States, 1999–2010. NCHS Data Brief 2012, 103, 1–8. [Google Scholar]
- Baro, R.; Haseeb, S.; Ordoñez, S.; Costabel, J.P. High-sensitivity cardiac troponin T as a predictor of acute Total occlusion in patients with non-ST-segment elevation acute coronary syndrome. Clin. Cardiol. 2019, 42, 222–226. [Google Scholar] [CrossRef] [PubMed]
- Aydin, S.; Ugur, K.; Aydin, S.; Sahin, İ.; Yardim, M. Biomarkers in acute myocardial infarction: Current perspectives. Vasc. Health Risk Manag. 2019, 15, 1–10. [Google Scholar] [CrossRef] [PubMed]
- Cannon, C.P.; Gibson, C.M.; Lambrew, C.T.; Shoultz, D.A.; Levy, D.; French, W.J.; Gore, J.M.; Weaver, W.D.; Rogers, W.J.; Tiefenbrunn, A.J. Relationship of symptom-onset-to-balloon time and door-to-balloon time with mortality in patients undergoing angioplasty for acute myocardial infarction. J. Am. Med. Assoc. 2000, 283, 2941–2947. [Google Scholar] [CrossRef]
- Rathore, S.S.; Curtis, J.P.; Chen, J.; Wang, Y.; Nallamothu, B.K.; Epstein, A.J.; Krumholz, H.M.; Hines, H.H. Association of door-to-balloon time and mortality in patients admitted to hospital with ST elevation myocardial infarction: National cohort study. BMJ 2009, 338, 1312–1315. [Google Scholar] [CrossRef]
- Khan, A.R.; Golwala, H.; Tripathi, A.; Bin Abdulhak, A.A.; Bavishi, C.; Riaz, H.; Mallipedi, V.; Pandey, A.; Bhatt, D.L. Impact of total occlusion of culprit artery in acute non-ST elevation myocardial infarction: A systematic review and meta-analysis. Eur. Heart J. 2017, 38, 3082–3089. [Google Scholar] [CrossRef]
- Hung, C.-S.; Chen, Y.-H.; Huang, C.-C.; Lin, M.-S.; Yeh, C.-F.; Li, H.-Y.; Kao, H.-L. Prevalence and outcome of patients with non-ST segment elevation myocardial infarction with occluded “culprit” artery—A systemic review and meta-analysis. Crit. Care 2018, 22, 34. [Google Scholar] [CrossRef]
- Devaux, Y.R.; Mueller, M.R.; Haaf, P.R.; Goretti, E.R.; Twerenbold, R.R.; Zangrando, J.R.; Vausort, M.R.; Reichlin, T.R.; Wildi, K.R.; Moehring, B.R.; et al. Diagnostic and prognostic value of circulating microRNAs in patients with acute chest pain. J. Intern. Med. 2015, 277, 260–271. [Google Scholar] [CrossRef]
- Wang, R.; Li, N.; Zhang, Y.; Ran, Y.; Pu, J. Circulating MicroRNAs are Promising Novel Biomarkers of Acute Myocardial Infarction. Intern. Med. 2011, 50, 1789–1795. [Google Scholar] [CrossRef] [PubMed]
- Widera, C.; Gupta, S.K.; Lorenzen, J.M.; Bang, C.; Bauersachs, J.; Bethmann, K.; Kempf, T.; Wollert, K.C.; Thum, T. Diagnostic and prognostic impact of six circulating microRNAs in acute coronary syndrome. J. Mol. Cell. Cardiol. 2011, 51, 872–875. [Google Scholar] [CrossRef] [PubMed]
- Wronska, A.; Kurkowska-Jastrzebska, I.; Santulli, G. Application of microRNAs in diagnosis and treatment of cardiovascular disease. Acta Physiol. 2015, 213, 60–83. [Google Scholar] [CrossRef] [PubMed]
- Wojciechowska, A.; Braniewska, A.; Kozar-Kamińska, K. MicroRNA in cardiovascular biology and disease. Adv. Clin. Exp. Med. 2017, 26, 865–874. [Google Scholar] [CrossRef]
- Xiao, Y.; Zhao, J.; Tuazon, J.P.; Borlongan, C.V.; Yu, G. MicroRNA-133a and Myocardial Infarction. Cell Transpl. 2019, 28, 831–838. [Google Scholar] [CrossRef] [PubMed]
- Kuwabara, Y.; Ono, K.; Horie, T.; Nishi, H.; Nagao, K.; Kinoshita, M.; Watanabe, S.; Baba, O.; Kojima, Y.; Shizuta, S.; et al. Increased MicroRNA-1 and MicroRNA-133a Levels in Serum of Patients With Cardiovascular Disease Indicate Myocardial Damage. Circ. Cardiovasc. Genet. 2011, 4, 446–454. [Google Scholar] [CrossRef] [PubMed]
- Ke-Gang, J.; Zhi-Wei, L.; Xin, Z.; Jing, W.; Ping, S.; Xue-Jing, H.; Hong-Xia, T.; Xin, T.; Xiao-Cheng, L. Evaluating Diagnostic and Prognostic Value of Plasma miRNA133a in Acute Chest Pain Patients Undergoing Coronary Angiography. Medicine 2016, 95. [Google Scholar] [CrossRef] [PubMed]
- Peng, L.; Chun-Guang, Q.; Bei-Fang, L.; Xue-Zhi, D.; Zi-Hao, W.; Yun-Fu, L.; Yan-Ping, D.; Yang-Gui, L.; Wei-Guo, L.; Tian-Yong, H.; et al. Clinical impact of circulating miR-133, miR-1291 and miR-663b in plasma of patients with acute myocardial infarction. Diagn. Pathol. 2014, 9, 89. [Google Scholar] [CrossRef]
- Li, Y.-Q.; Zhang, M.-F.; Wen, H.-Y.; Hu, C.-L.; Liu, R.; Wei, H.-Y.; Ai, C.-M.; Wang, G.; Liao, X.-X.; Li, X.; et al. Comparing the diagnostic values of circulating microRNAs and cardiac troponin T in patients with acute myocardial infarction. Clinics 2013, 68, 75–80. [Google Scholar] [CrossRef]
- Liu, G.; Niu, X.; Meng, X.; Zhang, Z. Sensitive miRNA markers for the detection and management of NSTEMI acute myocardial infarction patients. J. Thorac. Dis. 2018, 10, 3206–3215. [Google Scholar] [CrossRef]
- Gidlof, O.; Andersson, P.; van der Pals, J.; Gotberg, M.; Erlinge, D. Cardiospecific microRNA plasma levels correlate with troponin and cardiac function in patients with ST elevation myocardial infarction, are selectively dependent on renal elimination, and can be detected in urine samples. Cardiology 2011, 118, 217–226. [Google Scholar] [CrossRef] [PubMed]
- Wang, G.-K.; Zhu, J.-Q.; Zhang, J.-T.; Li, Q.; Li, Y.; He, J.; Qin, Y.-W.; Jing, Q. Circulating microRNA: A novel potential biomarker for early diagnosis of acute myocardial infarction in humans. Eur. Heart J. 2010, 31, 659–666. [Google Scholar] [CrossRef] [PubMed]
- Moher, D.; Liberati, A.; Tetzlaff, J.; Altman, D.G. Preferred Reporting Items for Systematic Reviews and Meta-Analyses: The PRISMA Statement. PLoS Med. 2009, 6, e1000097. [Google Scholar] [CrossRef] [PubMed]
- Ji, Q.; Jiang, Q.; Yan, W.; Li, X.; Zhang, Y.; Meng, P.; Shao, M.; Chen, L.; Zhu, H.; Tian, N.; et al. Expression of circulating microRNAs in patients with ST segment elevation acute myocardial infarction. Minerva Cardioangiol. 2015, 63, 397–402. [Google Scholar]
- Maciejak, A.; Kiliszek, M.; Opolski, G.; Segiet, A.; Matlak, K.; Dobrzycki, S.; Tulacz, D.; Sygitowicz, G.; Burzynska, B.; Gora, M. miR-22-5p revealed as a potential biomarker involved in the acute phase of myocardial infarction via profiling of circulating microRNAs. Mol. Med. Rep. 2016, 14, 2867–2875. [Google Scholar] [CrossRef][Green Version]
- Goldbergova, M.P.; Lipkova, J.; Fedorko, J.; Sevcikova, J.; Parenica, J.; Spinar, J.; Masarik, M.; Vasku, A. MicroRNAs in pathophysiology of acute myocardial infarction and cardiogenic shock. Bratisl. Lek. Listy 2018, 119, 341–347. [Google Scholar] [CrossRef]
- Olivieri, F.; Antonicelli, R.; Lorenzi, M.; D’Alessandra, Y.; Lazzarini, R.; Santini, G.; Spazzafumo, L.; Lisa, R.; La Sala, L.; Galeazzi, R.; et al. Diagnostic potential of circulating miR-499-5p in elderly patients with acute non ST-elevation myocardial infarction. Int. J. Cardiol. 2013, 167, 531–536. [Google Scholar] [CrossRef]
- Ai, J.; Zhang, R.; Li, Y.; Pu, J.; Lu, Y.; Jiao, J.; Li, K.; Yu, B.; Li, Z.; Wang, R.; et al. Circulating microRNA-1 as a potential novel biomarker for acute myocardial infarction. Biochem. Biophys. Res. Commun. 2010, 391, 73–77. [Google Scholar] [CrossRef]
- Wang, F.; Long, G.; Zhao, C.; Li, H.; Chaugai, S.; Wang, Y.; Chen, C.; Wang, D. Plasma microRNA-133a is a new marker for both acute myocardial infarction and underlying coronary artery stenosis. J. Transl. Med. 2013, 11, 222. [Google Scholar]
- Eitel, I.; Adams, V.; Dieterich, P.; Fuernau, G.; Waha, S.D.; Desch, S.; Schuler, G.; Thiele, H. Relation of circulating MicroRNA-133a concentrations with myocardial damage and clinical prognosis in ST-elevation myocardial infarction. Am. Heart J. 2012, 164, 706–714. [Google Scholar] [CrossRef]
- Hromádka, M.; Černá, V.; Pešta, M.; Kučerová, A.; Jarkovský, J.; Rajdl, D.; Rokyta, R.; Moťovská, Z. Prognostic Value of MicroRNAs in Patients after Myocardial Infarction: A Substudy of PRAGUE-18. Dis. Markers 2019, 2019, 1–9. [Google Scholar] [CrossRef] [PubMed]
- Eryilmaz, U.; Akgullu, C.; Beser, N.; Yildiz, O.; Omurlu, I.K.; Bozdogan, B. Circulating microRNAs in patients with ST-elevation myocardial infarction. Anatol. J. Cardiol. 2016, 16, 392–396. [Google Scholar] [CrossRef] [PubMed]
- Corsten, M.F.; Dennert, R.; Jochems, S.; Kuznetsova, T.; Devaux, Y.; Hofstra, L.; Wagner, D.R.; Staessen, J.A.; Heymans, S.; Schroen, B. Circulating MicroRNA-208b and MicroRNA-499 Reflect Myocardial Damage in Cardiovascular Disease. Circ. Cardiovasc. Genet. 2010, 3, 499–506. [Google Scholar] [CrossRef] [PubMed]
- Jaguszewski, M.; Osipova, J.; Ghadri, J.-R.; Napp, L.C.; Widera, C.; Franke, J.; Fijalkowski, M.; Nowak, R.; Fijalkowska, M.; Volkmann, I.; et al. A signature of circulating microRNAs differentiates takotsubo cardiomyopathy from acute myocardial infarction. Eur. Heart J. 2014, 35, 999–1006. [Google Scholar] [CrossRef]
- Gacon, J.; Kablak-Ziembicka, A.; Stepien, E.; Enguita, F.J.; Karch, I.; Derlaga, B.; Zmudka, K.; Przewlocki, T. Decision-making microRNAs (MIR-124, -133a/b, -34a and -134) in patients with occluded target vessel in acute coronary syndrome. Kardiol. Pol. 2016, 74, 280–288. [Google Scholar]
- Dalessandra, Y.; Devanna, P.; Limana, F.; Straino, S.; Carlo, A.D.; Brambilla, P.G.; Rubino, M.; Carena, M.C.; Spazzafumo, L.; Simone, M.D.; et al. Circulating microRNAs are new and sensitive biomarkers of myocardial infarction. Eur. Heart J. 2010, 31, 2765–2773. [Google Scholar] [CrossRef]
- Li, Y.; Ouyang, M.; Shan, Z.; Ma, J.; Li, J.; Yao, C.; Zhu, Z.; Zhang, L.; Chen, L.; Chang, G.; et al. Involvement of microRNA-133a in the development of arteriosclerosis obliterans of the lower extremities via RHoA targeting. J. Atheroscler. Thromb. 2014, 22, 424–432. [Google Scholar] [CrossRef][Green Version]
- Su, Q.; Guo, Y.; Liu, H.; Qin, Y.; Zhang, J.; Yuan, X.; Zhao, X. Diagnostic role of high-sensitivity cardiac troponin T in acute myocardial infarction and cardiac noncoronary artery disease. Arch. Med. Res. 2015, 46, 193–198. [Google Scholar] [CrossRef]
- Neumann, J.T.; Sörensen, N.A.; Ojeda, F.; Renné, T.; Schnabel, R.B.; Zeller, T.; Karakas, M.; Blankenberg, S.; Westermann, D. Early diagnosis of acute myocardial inf1. Neumann, J.T.; et al. Early diagnosis of acute myocardial infarction using high-sensitivity troponin i. PLoS ONE 2017, 12. [Google Scholar] [CrossRef]
- Wang, A.Z.; Schaffer, J.T.; Holt, D.B.; Morgan, K.L.; Hunter, B.R. Troponin Testing and Coronary Syndrome in Geriatric Patients With Nonspecific Complaints: Are We Overtesting? Acad. Emerg. Med. 2020, 27, 6–14. [Google Scholar] [CrossRef]
- Ho Jeong, M.; Ho Jung, D.; Hun Kim, K.; Seok Lee, W.; Hong Lee, K.; Joo Yoon, H.; Sik Yoon, N.; Youn Moon, J.; Joon Hong, Y.; Wook Park, H.; et al. Predictors of total occlusion of the infarct-related artery in patients with acute Non-ST elevation myocardial infarction. Korean J. Med. 2008, 74, 271–280. [Google Scholar]
- Xiang, M.; Zeng, Y.; Yang, R.; Xu, H.; Chen, Z.; Zhong, J.; Xie, H.; Xu, Y.; Zeng, X. U6 is not a suitable endogenous control for the quantification of circulating microRNAs. Biochem. Biophys. Res. Commun. 2014, 454, 210–214. [Google Scholar] [CrossRef]
- Peltier, H.J.; Latham, G.J. Normalization of microRNA expression levels in quantitative RT-PCR assays: Identification of suitable reference RNA targets in normal and cancerous human solid tissues. RNA 2008, 14, 844–852. [Google Scholar] [CrossRef] [PubMed]
- Gimenez, M.R.; Twerenbold, R.; Reichlin, T.; Wildi, K.; Haaf, P.; Schaefer, M.; Zellweger, C.; Moehring, B.; Stallone, F.; Sou, S.M.; et al. Direct comparison of high-sensitivity-cardiac troponin i vs. T for the early diagnosis of acutemyocardial infarction. Eur. Heart J. 2014, 35, 2303–2311. [Google Scholar] [CrossRef] [PubMed]


| Study (Author, Year, Reference) | Country | Number of Patients (Case/Control) | Patient Characteristics (Case) | Mean Age (Case) | Patient Characteristics (Control) | AUC | Mir Fold Increase (Total/STEMI/NSTEMI) | Max Time from Onset Until Sample Acquisition |
|---|---|---|---|---|---|---|---|---|
| Gidlof, O. et al. 2011 [21] | Sweden | 9/11 | STEMI Patients Undergoing PPCI | 64.56 ± 2.7 | STEMI/Healthy | 0.859 | 70 | 12 h |
| Wang, G-K. et al. 2010 [22] | China | 33/33 | STEMI and NSTEMI | 63.5 ± 10.1 | AMI/Non-AMI ACS | 0.867 | ____ | 12 h |
| Li, Y. et al. 2013 [19] | China | 67/32 | STEMI (n = 44) and NSTEMI (n = 23) | 63.84 ± 11.17 | AMI/Healthy | 0.947 | 5.67 | 12 h |
| Devaux, Y. et al. 2015 [10] | Czechia, Italy, Poland, Spain, Switzerland | 224/931 | STEMI (n = 45) and NSTEMI (n = 179) | 72 | AMI/Non-AMI ACS | 0.53 | ____ | 12 h |
| Wang, R. et al. 2011 [11] | China | 58/21 | STEMI and NSTEMI | 60.06 ± 11.53 | AMI/non-AMI ACS | 0.89 | 4.4 | 24 h |
| Peng, L. et al. 2014 [18] | China | 76/110 | STEMI (n = 25) and NSTEMI (n = 51) | 64.6 | AMI/non-AMI ACS | 0.912 | 7.26/7.6/7.1 | ____ |
| Ji, Q. et al. 2015 [24] | China | 98/23 | STEMI (n = 77) and NSTEMI (n = 21) | 62.33 ± 13.9 | AMI/Healthy | 0.787 | 15.26/16.65/10.9 | 24 h |
| Jia, K.-G. et al. 2016 [17] | China | 233/146 | STEMI (n = 156) and NSTEMI (n = 77) | 62.32 | AMI/Healthy and Non-AMI ACS | 0.667 | 5.99/6.39/5.18 | 12 h |
| Liu, G. et al. 2018 [20] | China | 145/30 | NSTEMI Patients | 67 | NSTEMI/Healthy | 0.927 | 2.4 | 12 h |
© 2020 by the authors. Licensee MDPI, Basel, Switzerland. This article is an open access article distributed under the terms and conditions of the Creative Commons Attribution (CC BY) license (http://creativecommons.org/licenses/by/4.0/).
Share and Cite
Wexler, Y.; Nussinovitch, U. The Diagnostic Value of Mir-133a in ST Elevation and Non-ST Elevation Myocardial Infarction: A Meta-Analysis. Cells 2020, 9, 793. https://doi.org/10.3390/cells9040793
Wexler Y, Nussinovitch U. The Diagnostic Value of Mir-133a in ST Elevation and Non-ST Elevation Myocardial Infarction: A Meta-Analysis. Cells. 2020; 9(4):793. https://doi.org/10.3390/cells9040793
Chicago/Turabian StyleWexler, Yehuda, and Udi Nussinovitch. 2020. "The Diagnostic Value of Mir-133a in ST Elevation and Non-ST Elevation Myocardial Infarction: A Meta-Analysis" Cells 9, no. 4: 793. https://doi.org/10.3390/cells9040793
APA StyleWexler, Y., & Nussinovitch, U. (2020). The Diagnostic Value of Mir-133a in ST Elevation and Non-ST Elevation Myocardial Infarction: A Meta-Analysis. Cells, 9(4), 793. https://doi.org/10.3390/cells9040793