Light-Regulated Transcription of a Mitochondrial-Targeted K+ Channel

 and
and 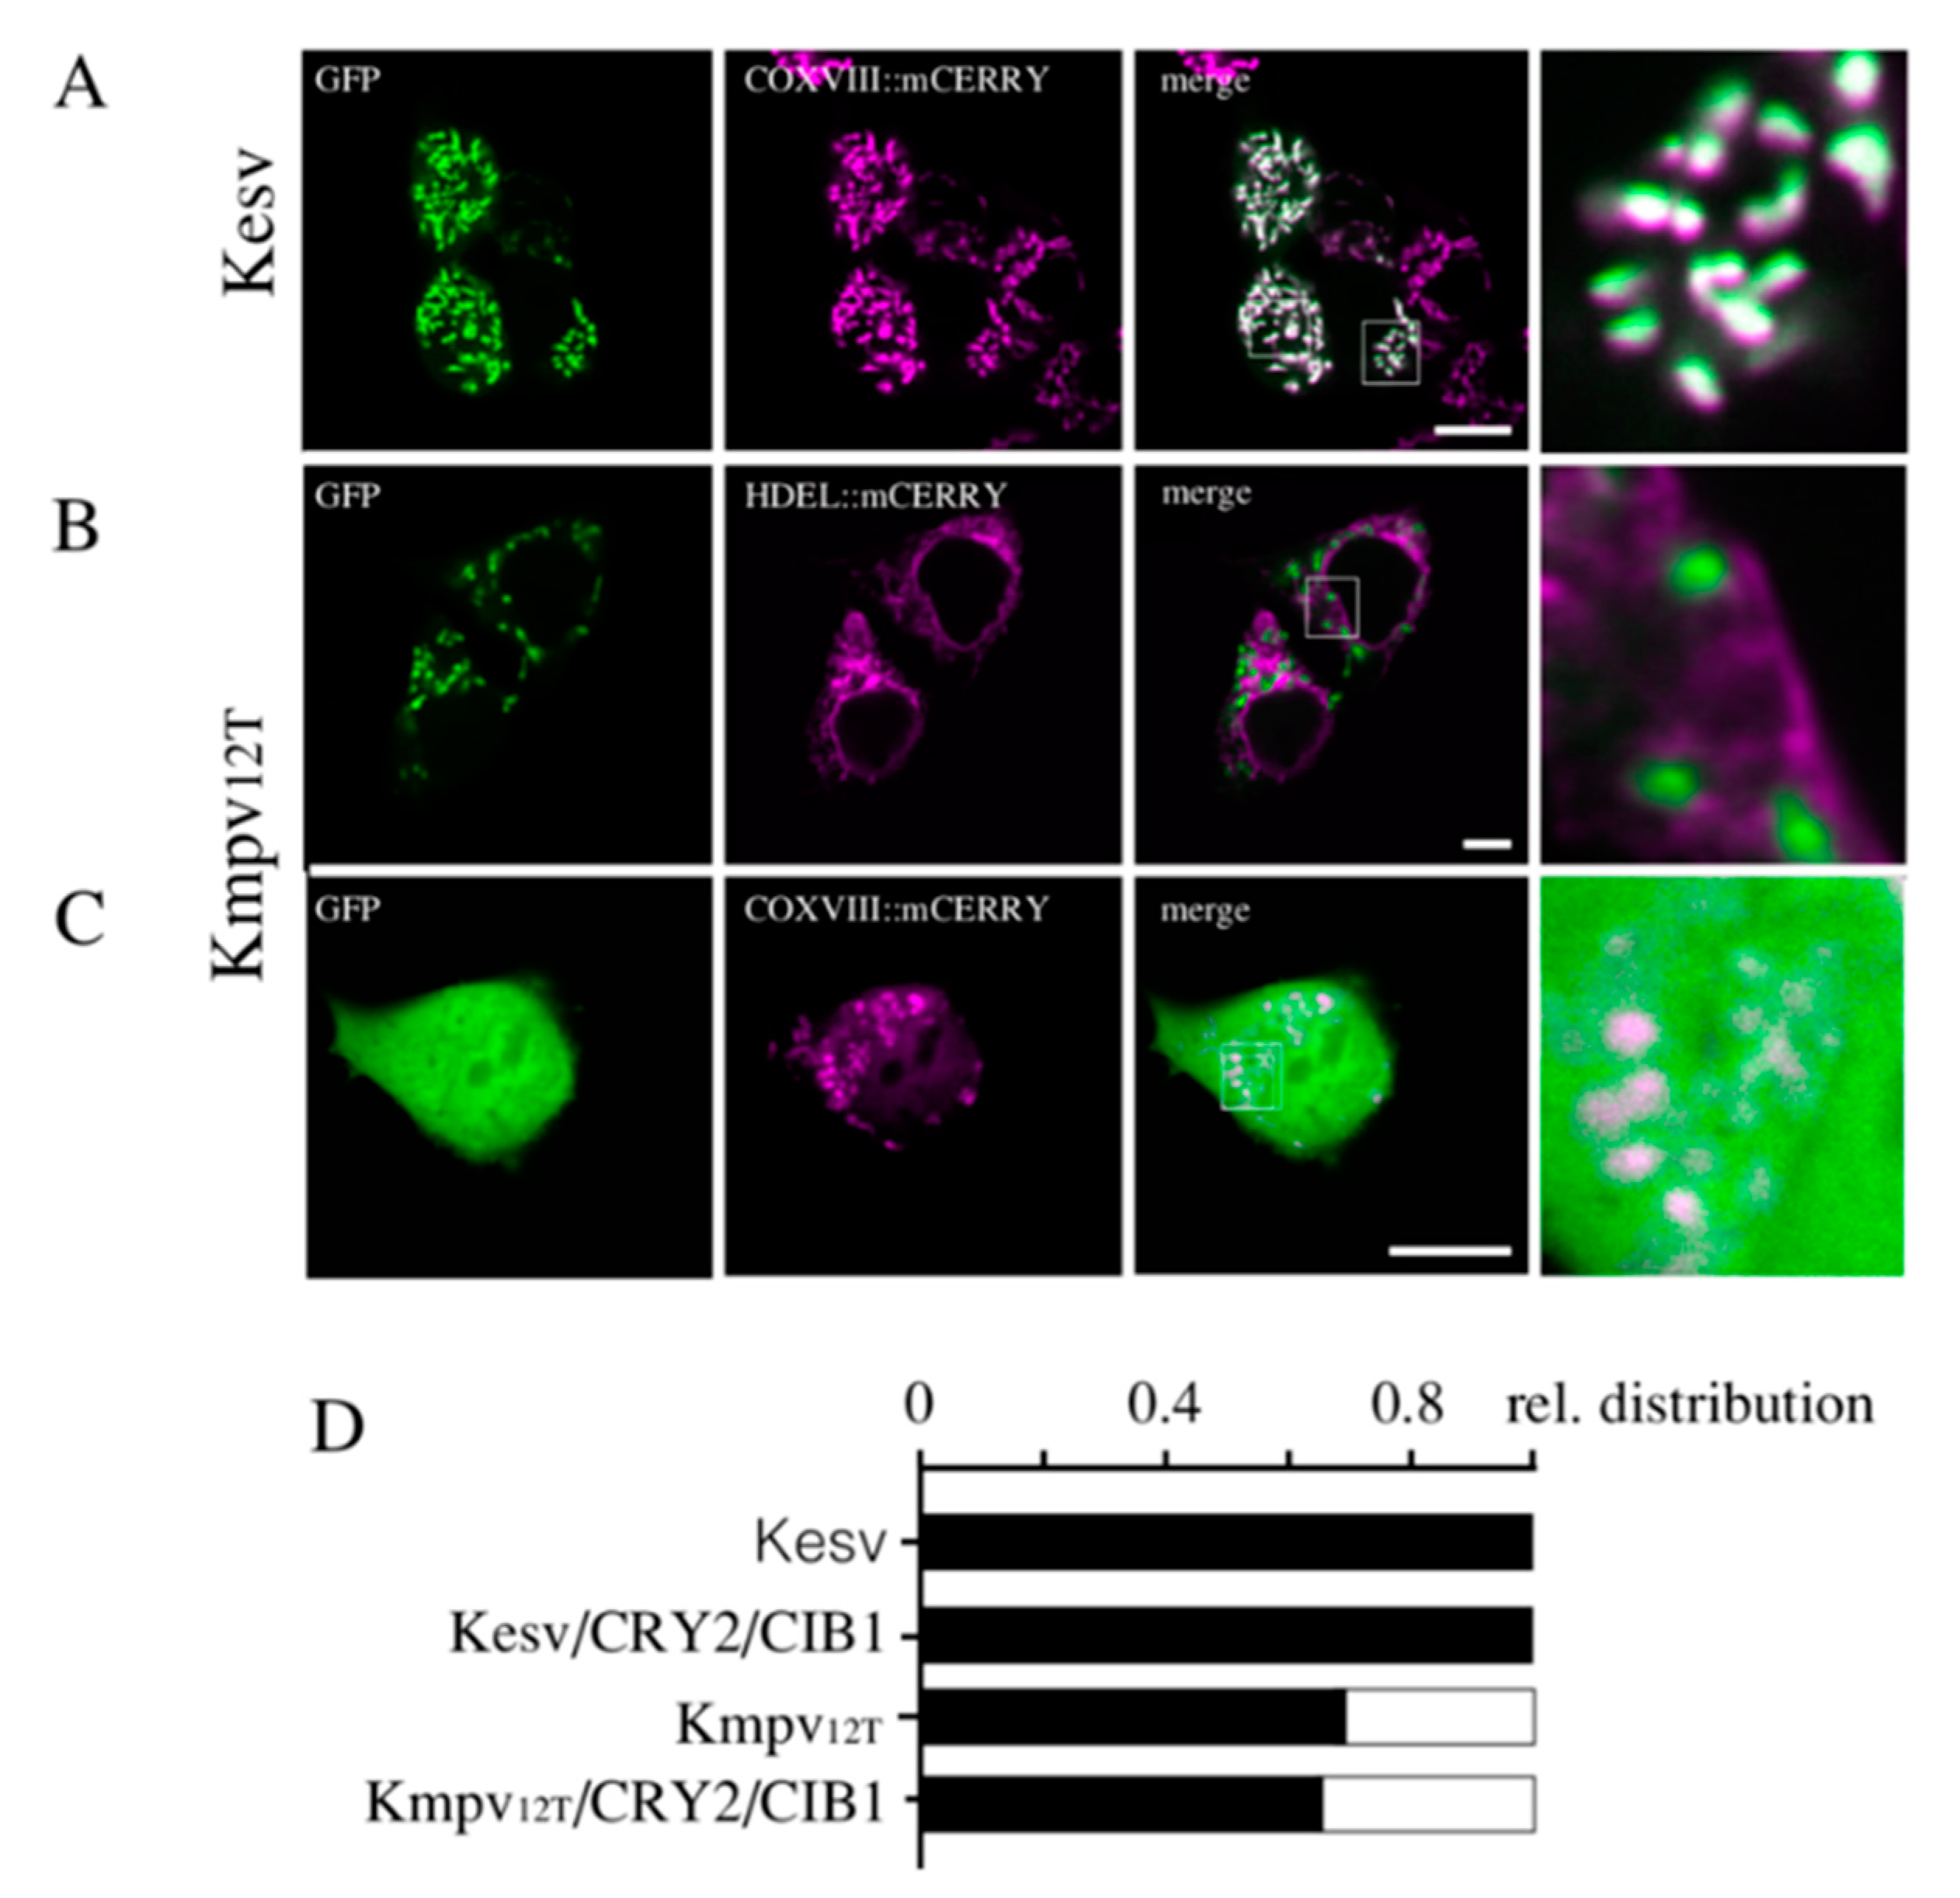
Abstract
1. Introduction
2. Materials and Methods
2.1. Constructs
2.2. Mutagenesis
2.3. Heterologous Expression and Illumination Setup
2.4. Confocal Microscopy
2.5. Planar Lipid Bilayer Experiments
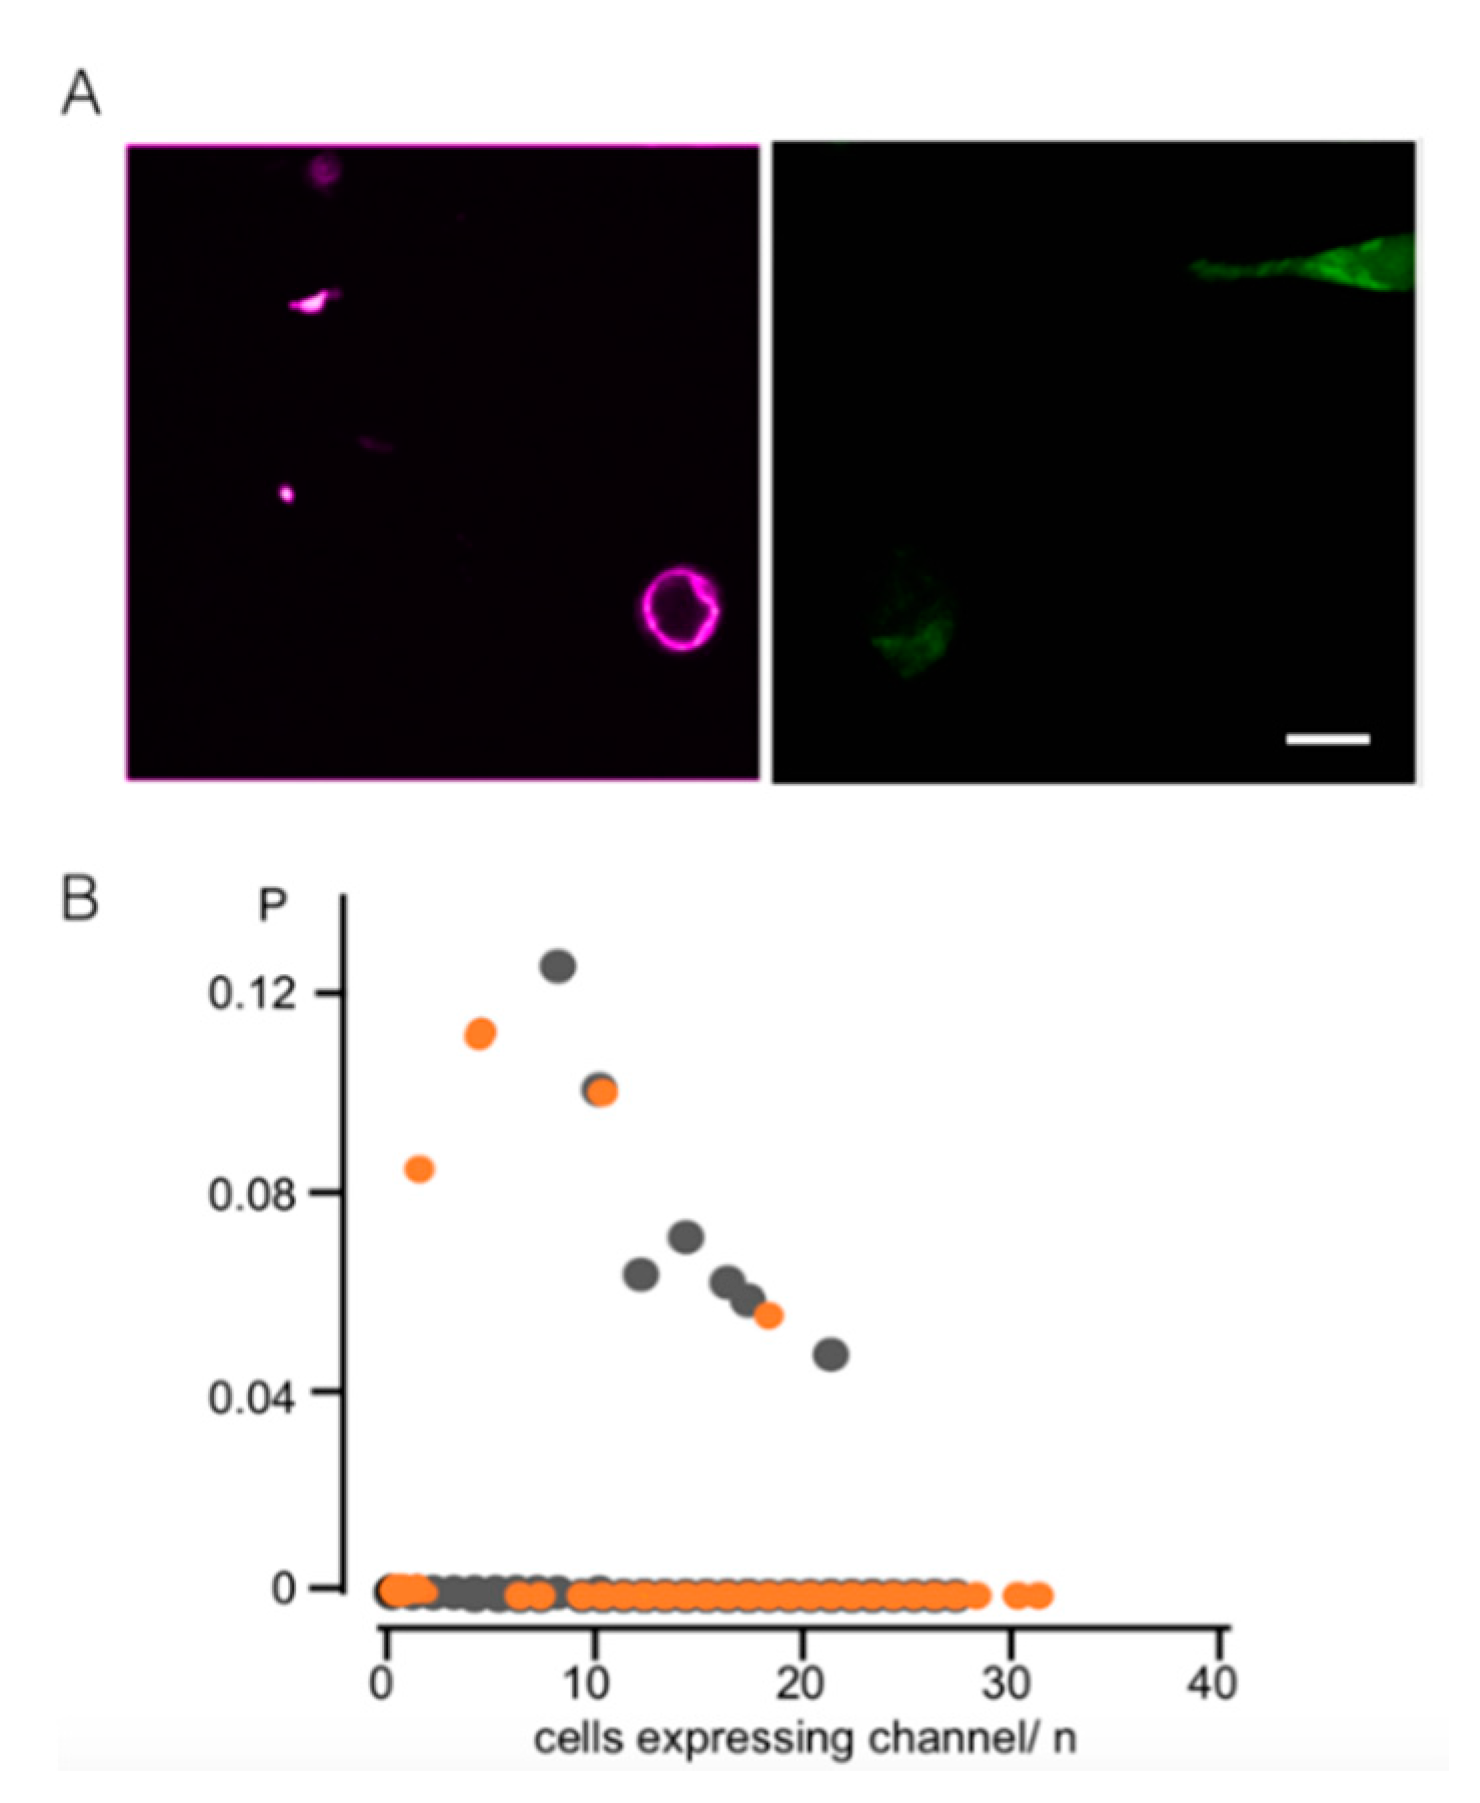
2.6. Flow Cytometry
3. Results and Discussion
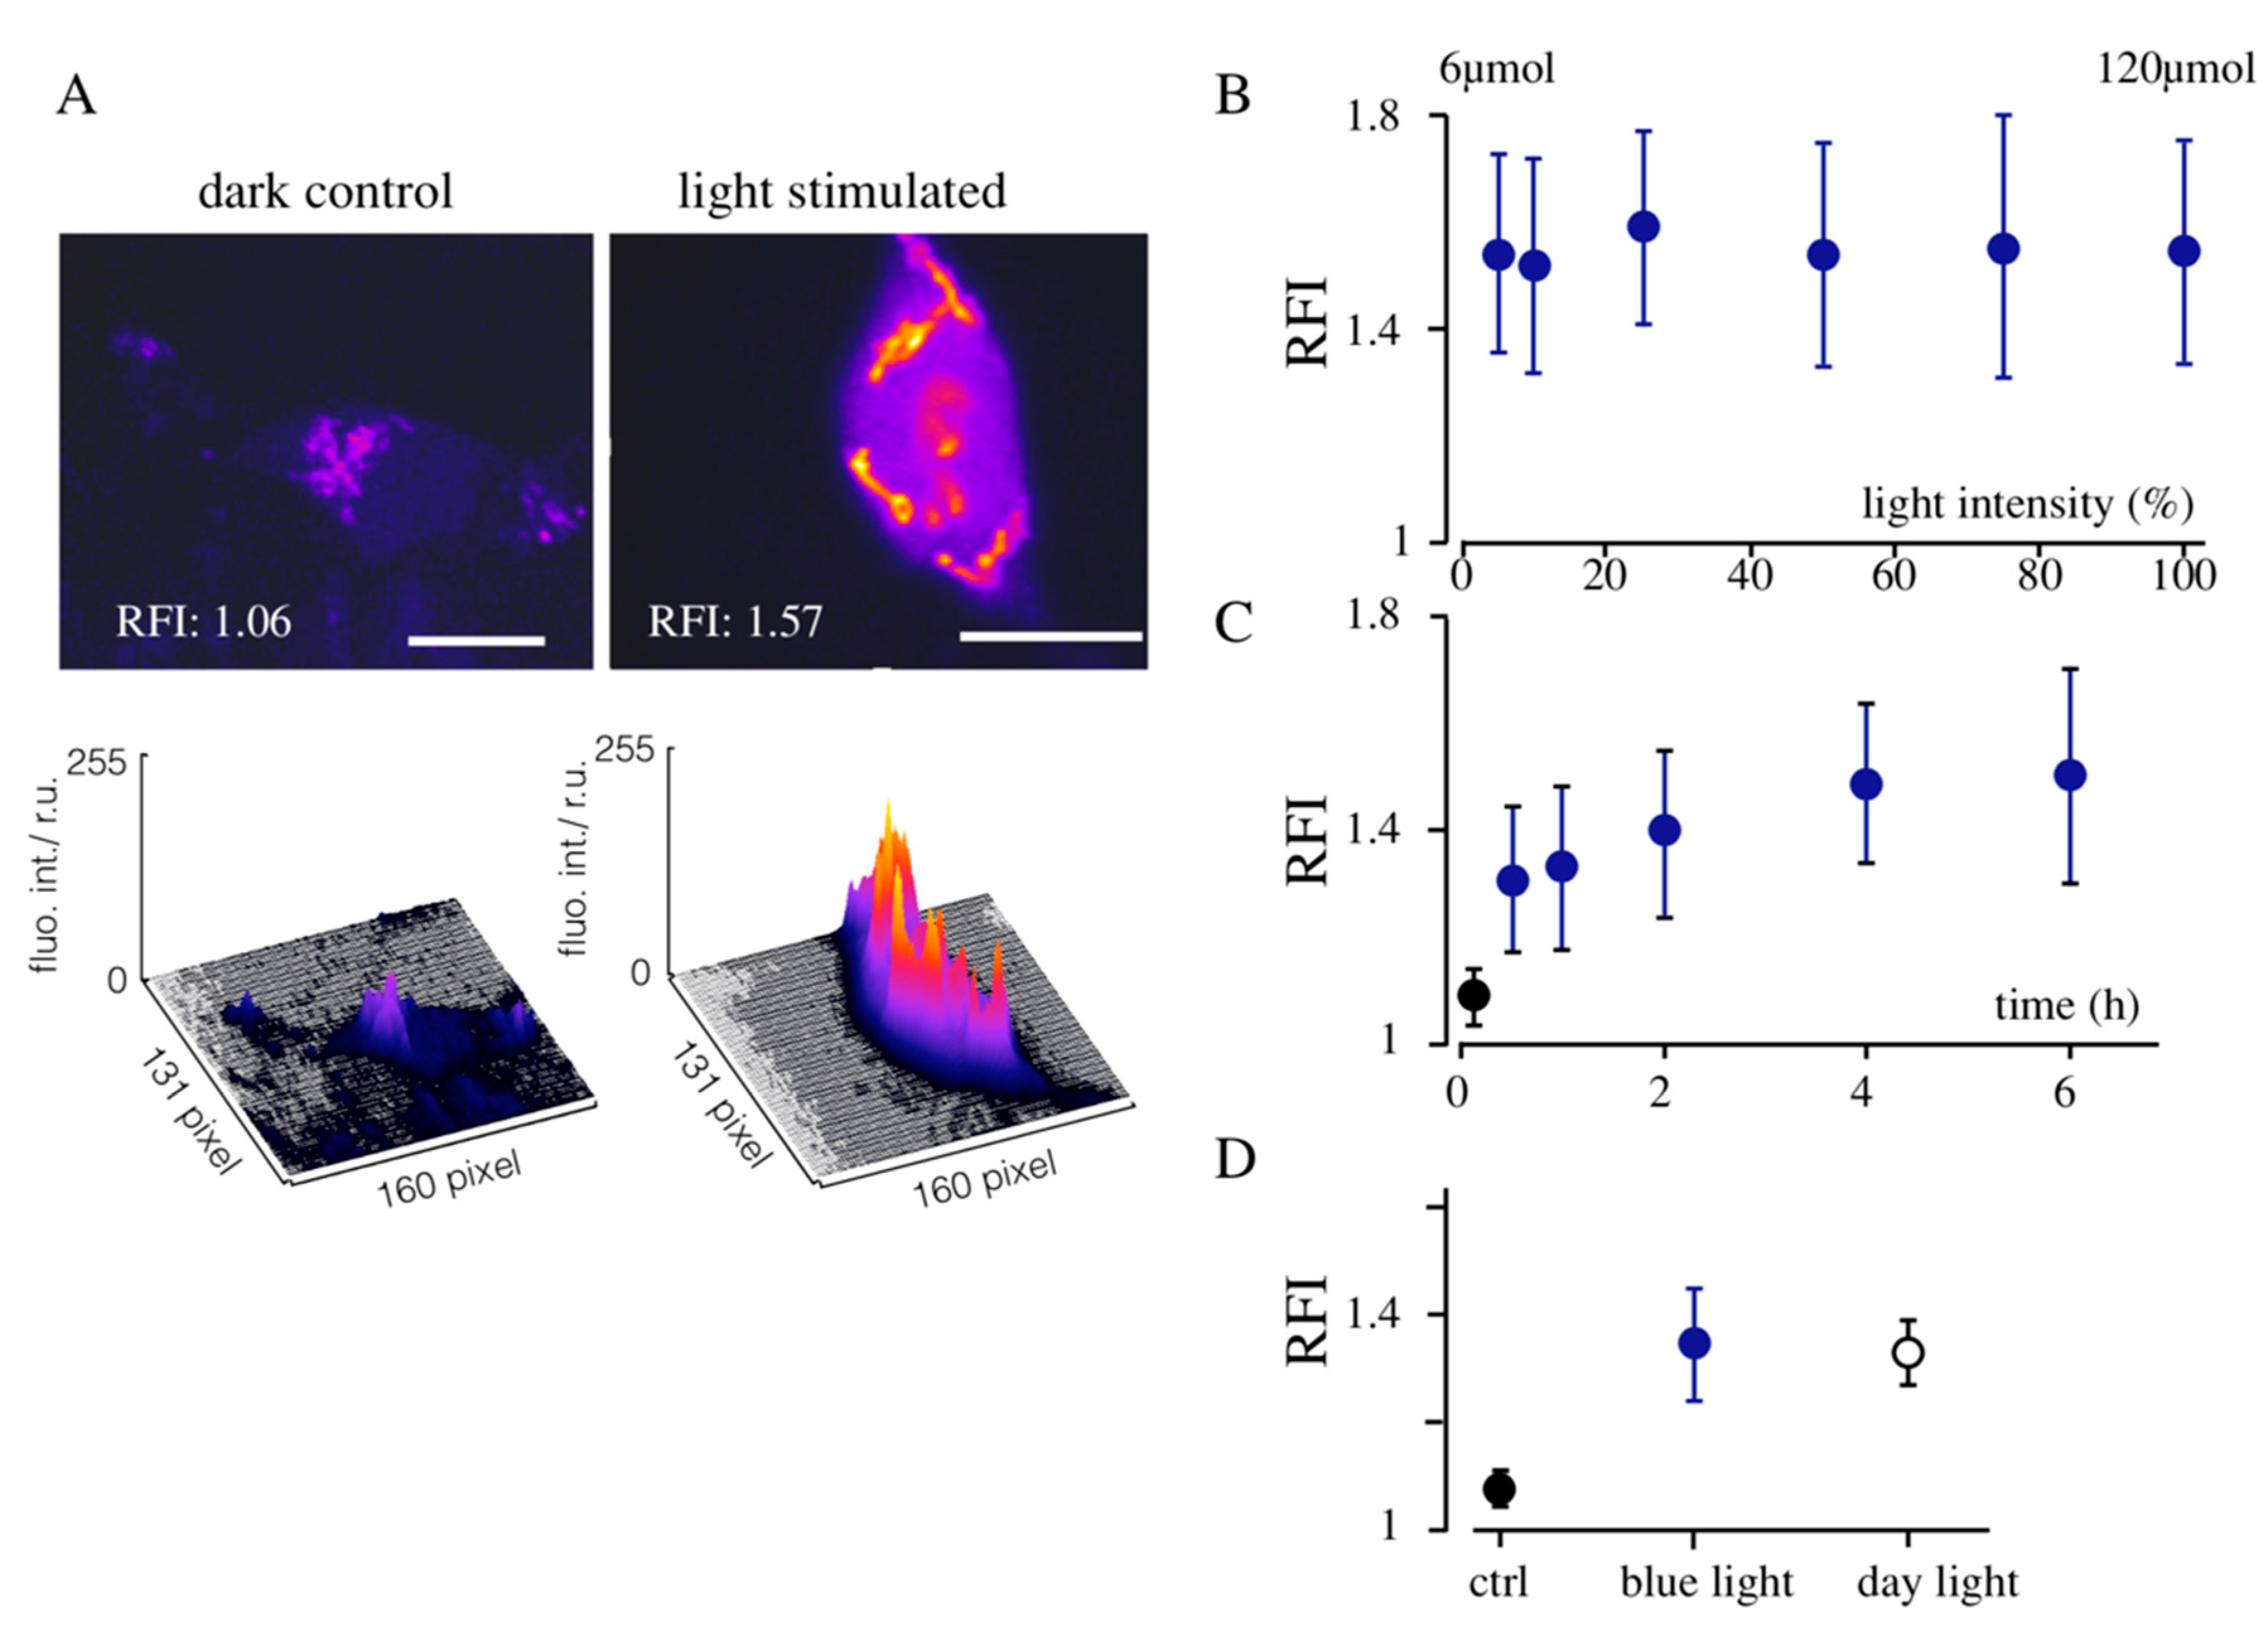
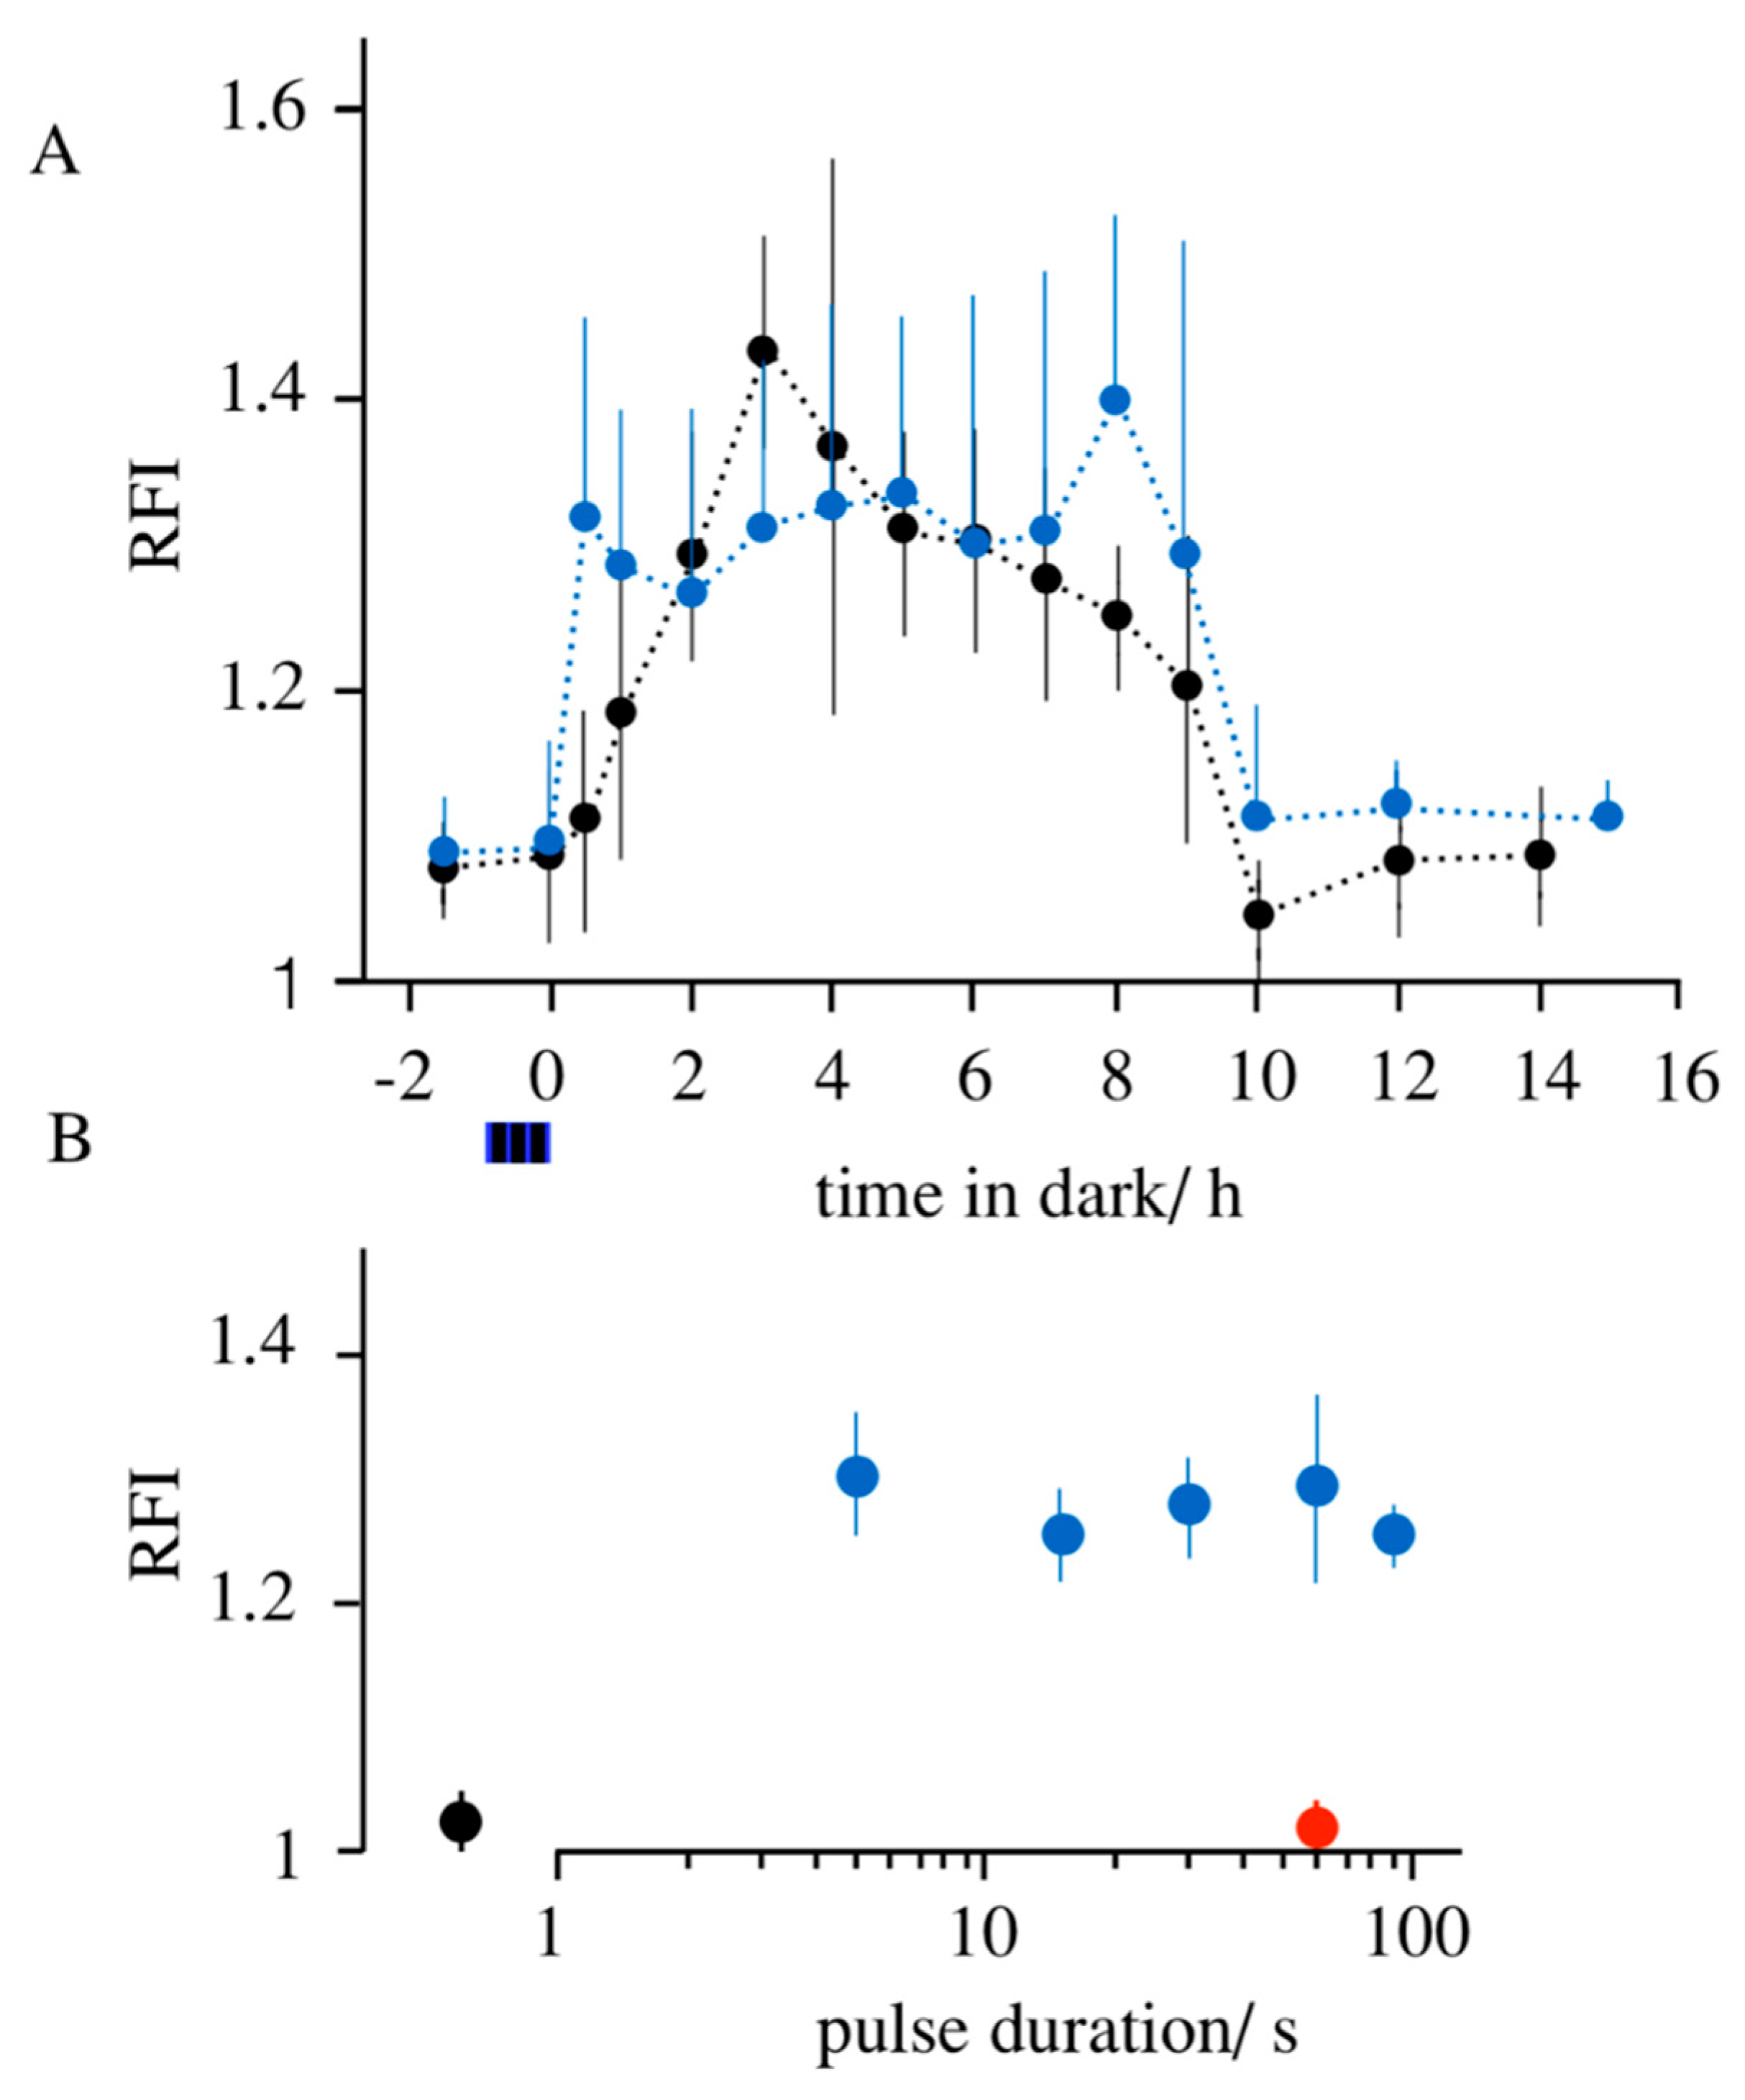
3.1. Light-Induced Transcription of K+ Channels
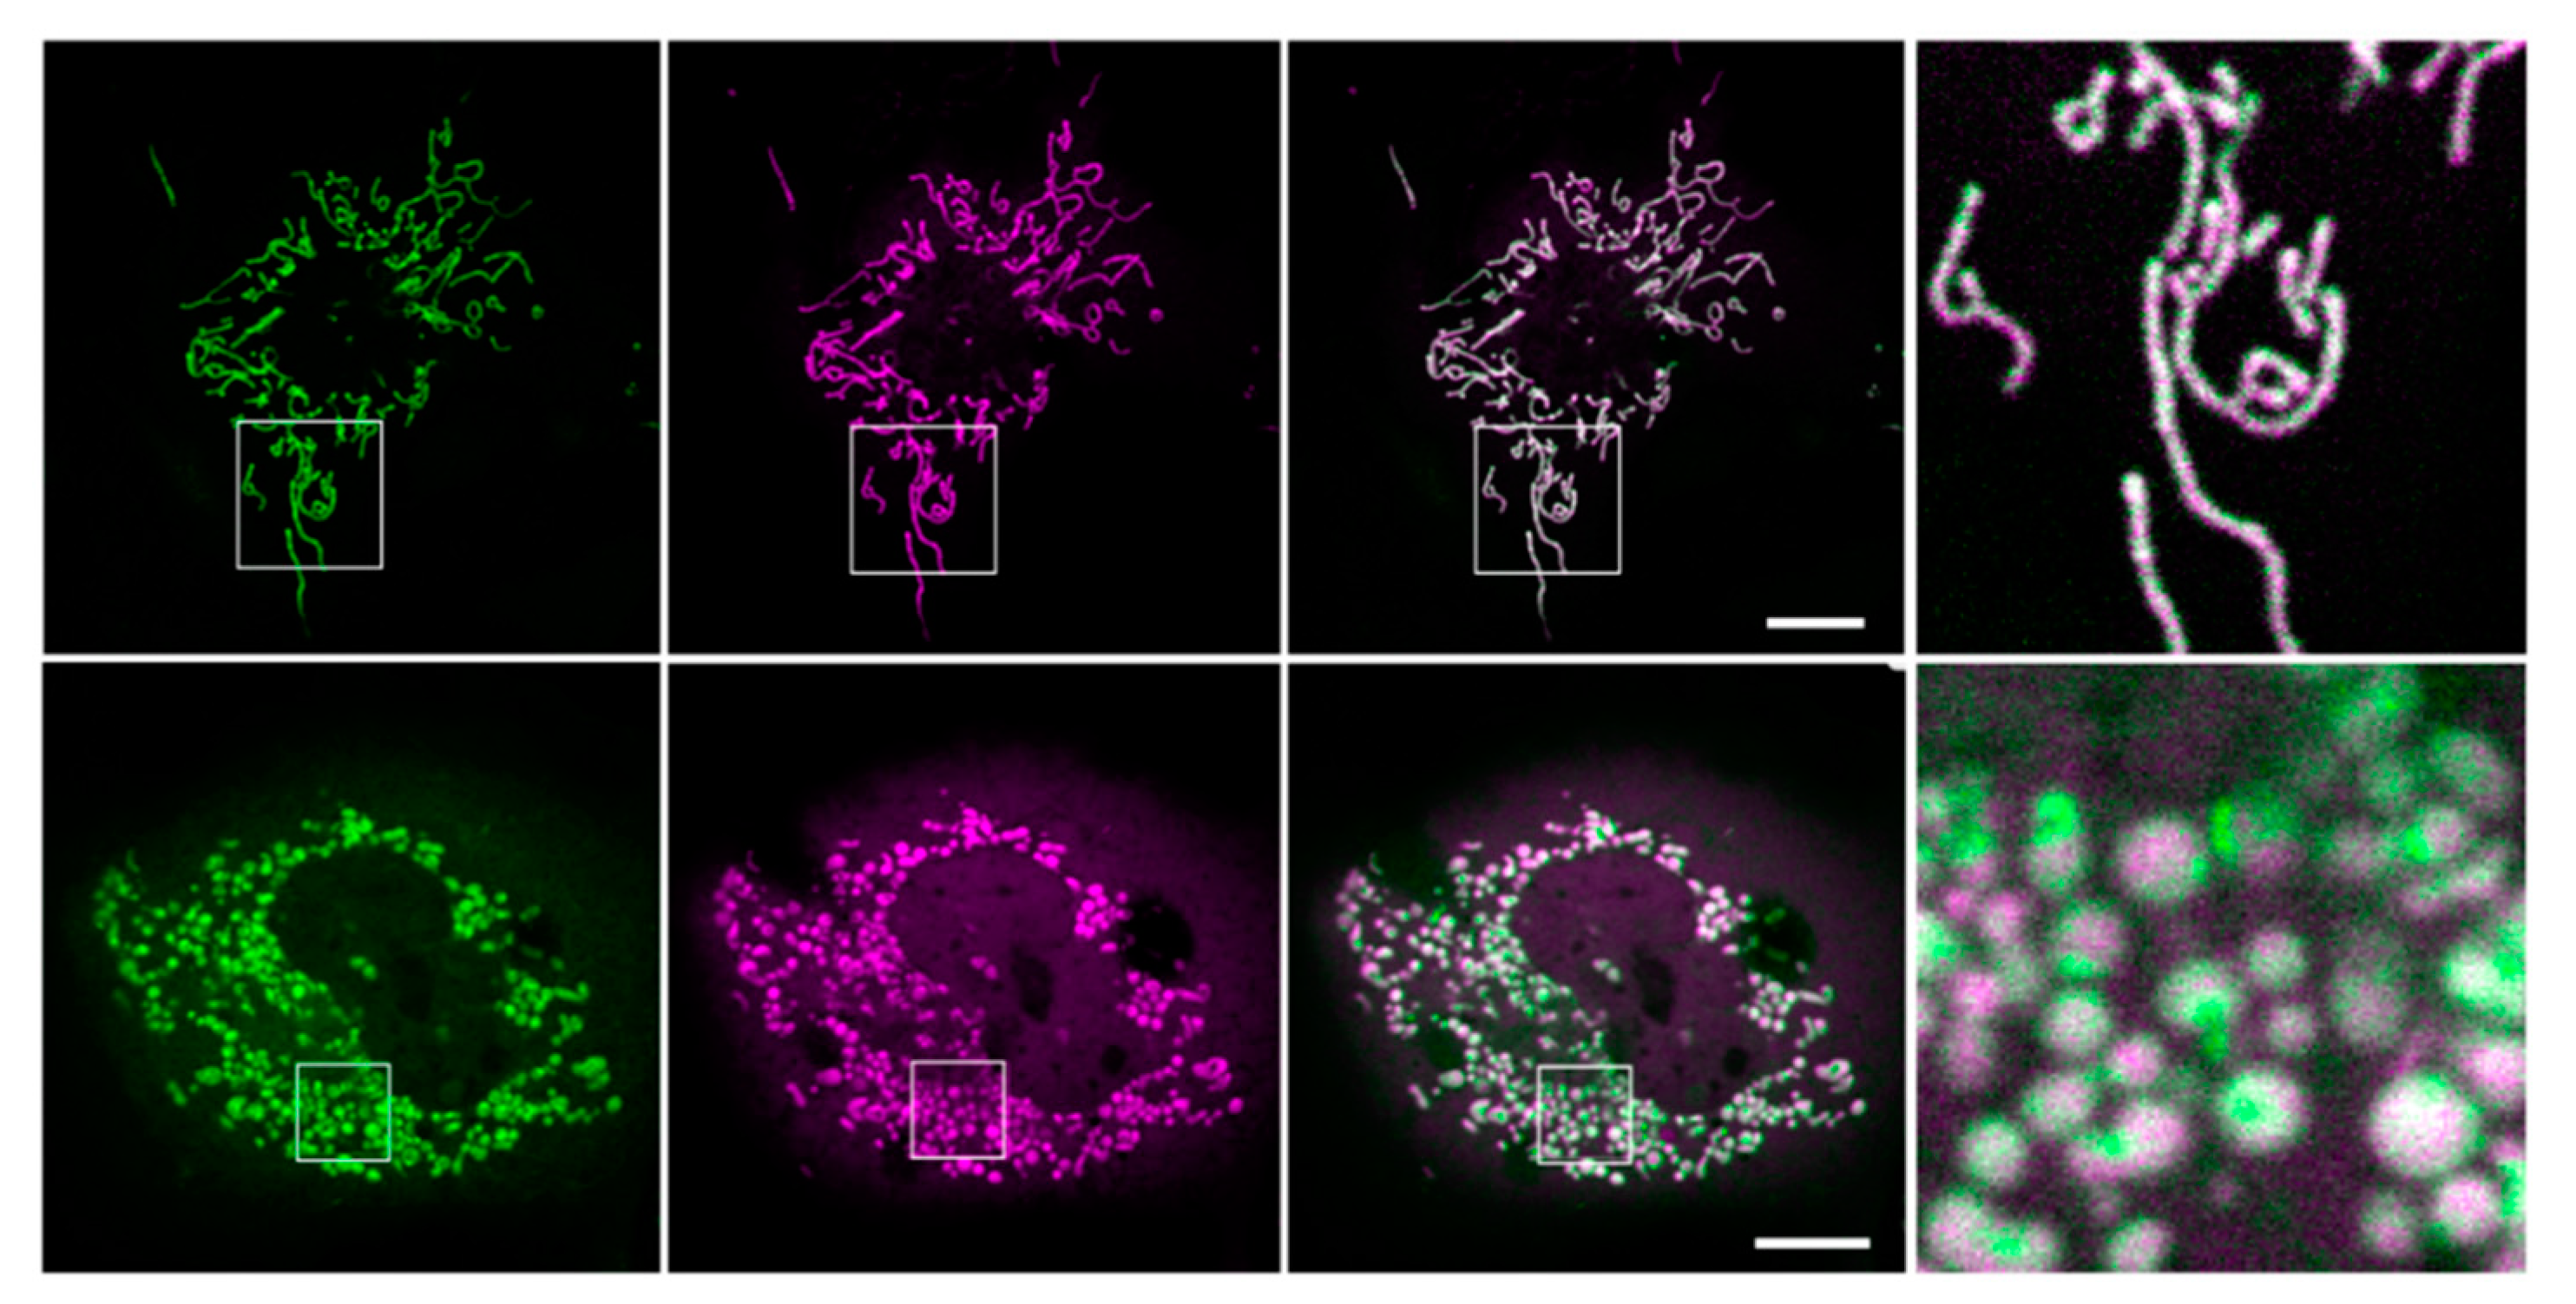
3.2. Localization of Kesv and Kmpv12T in Inner Mitochondria Membrane
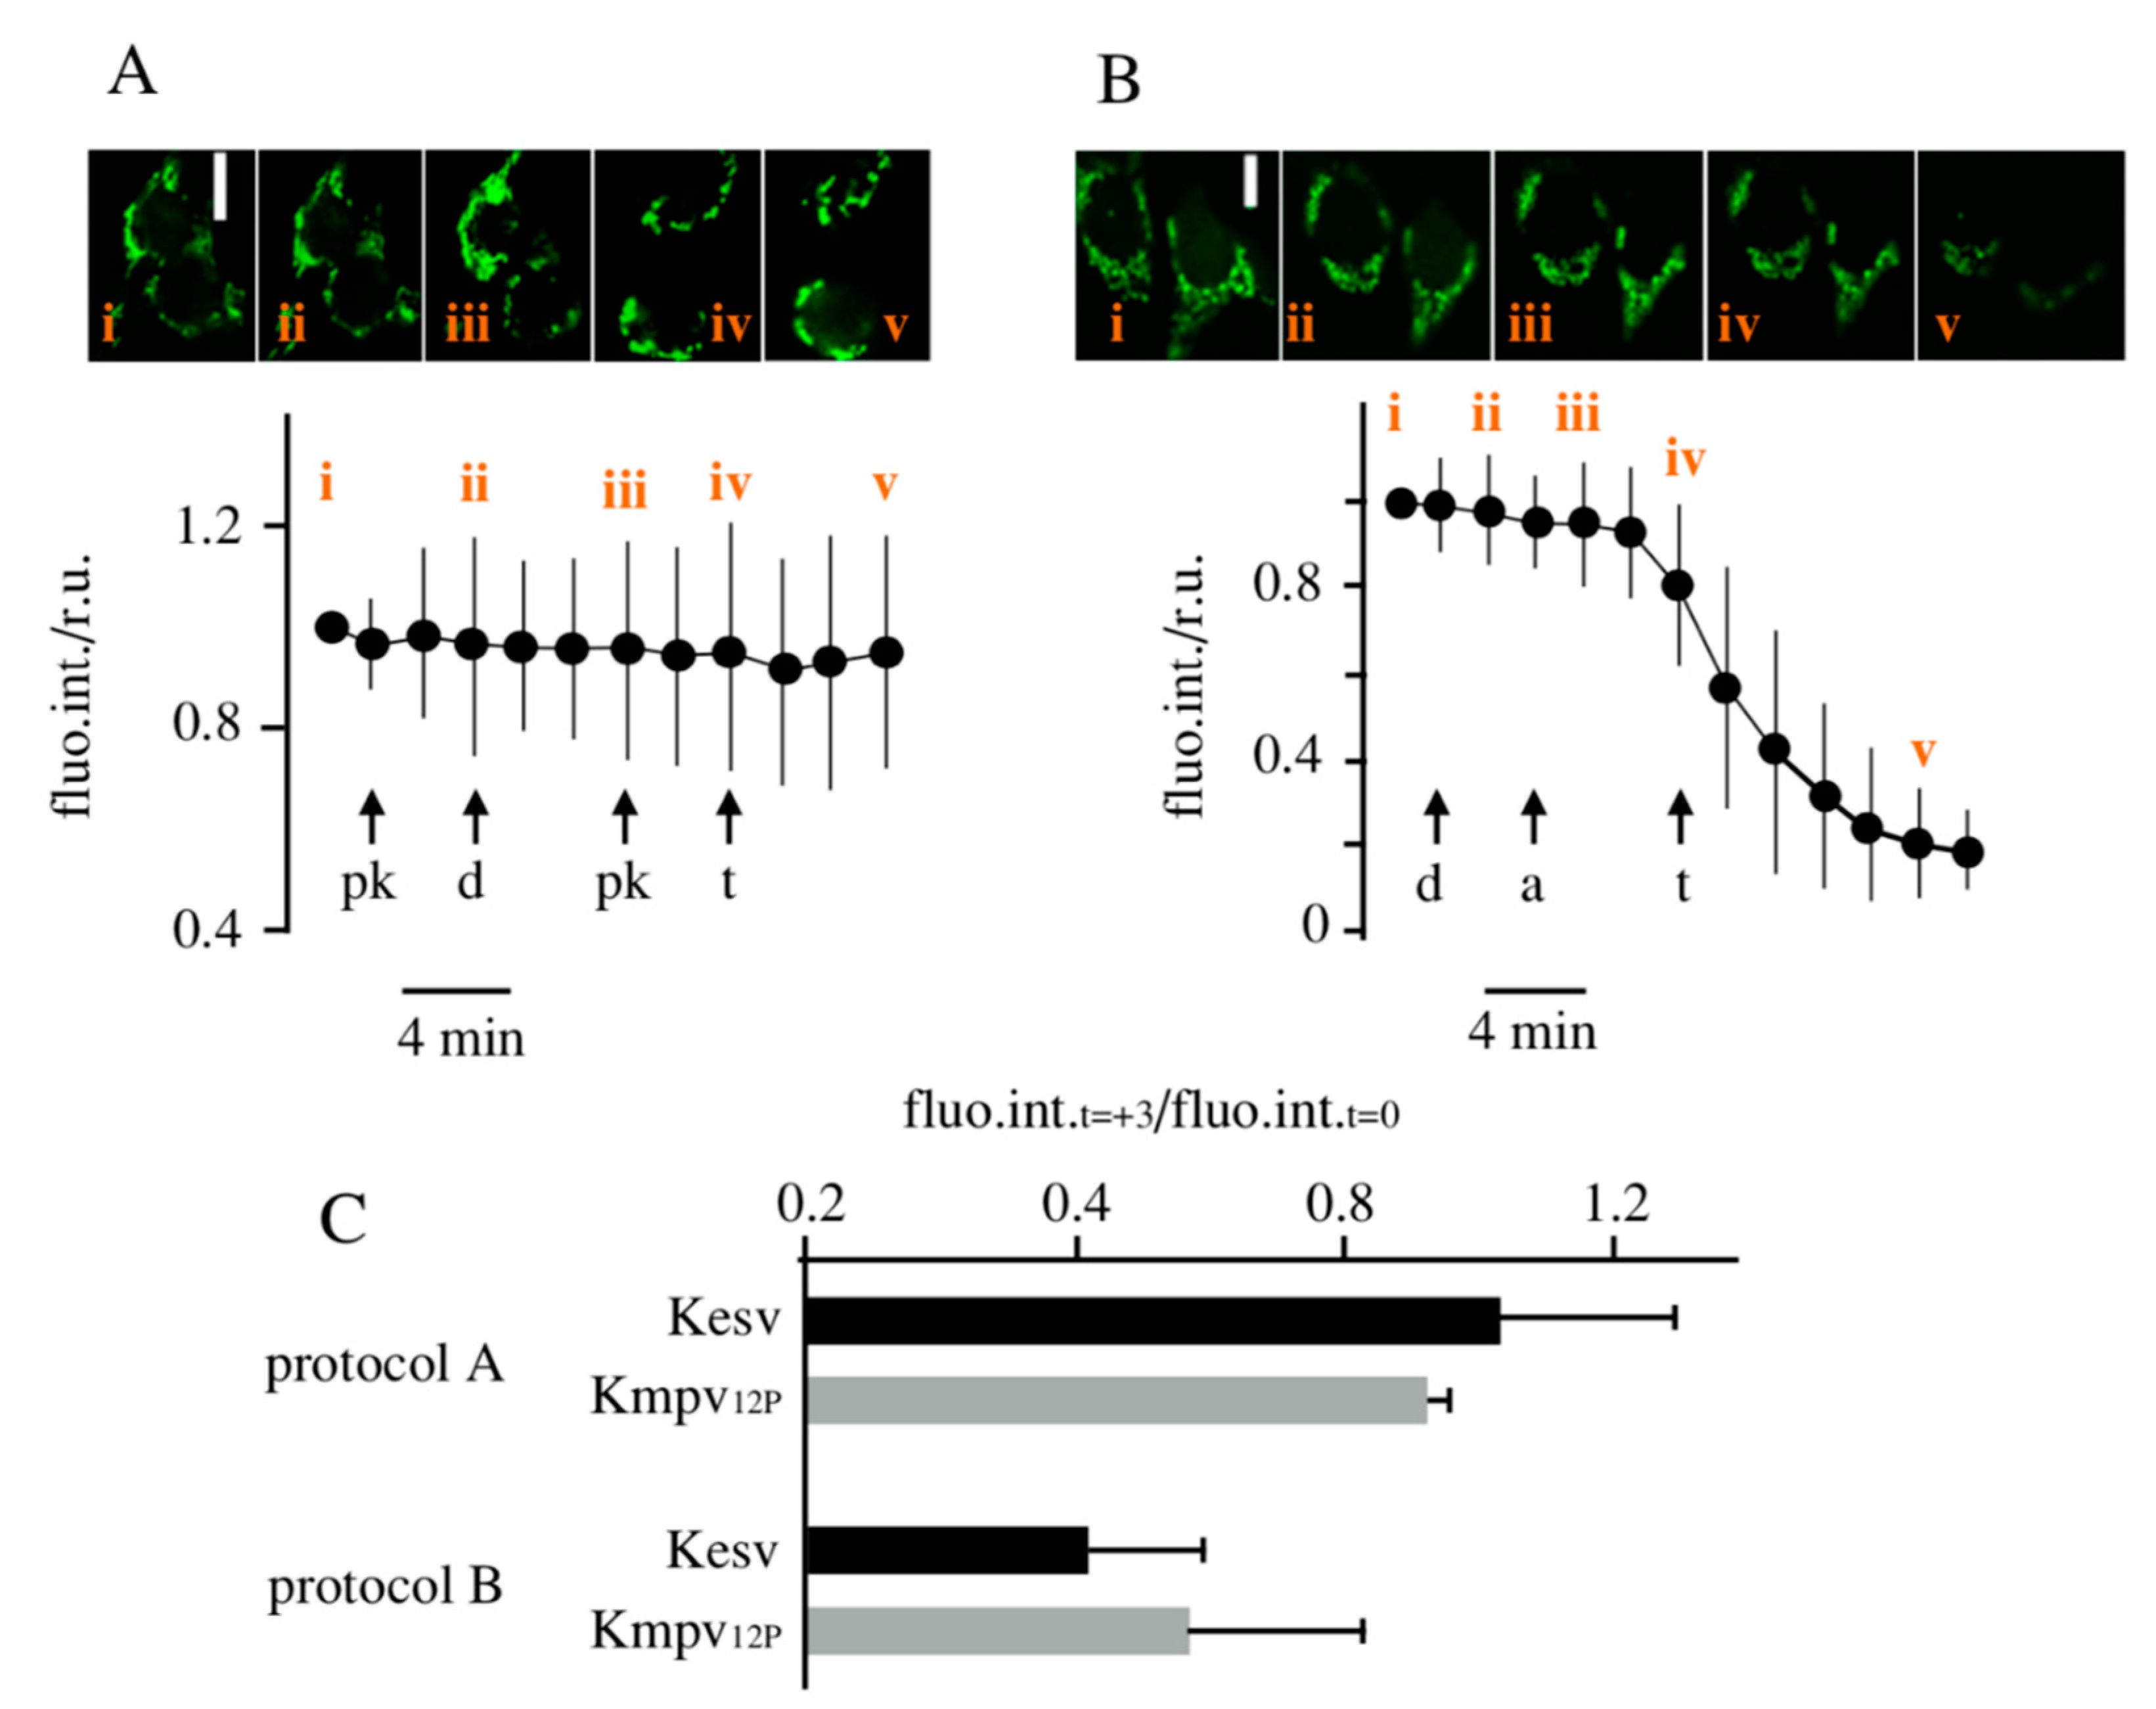
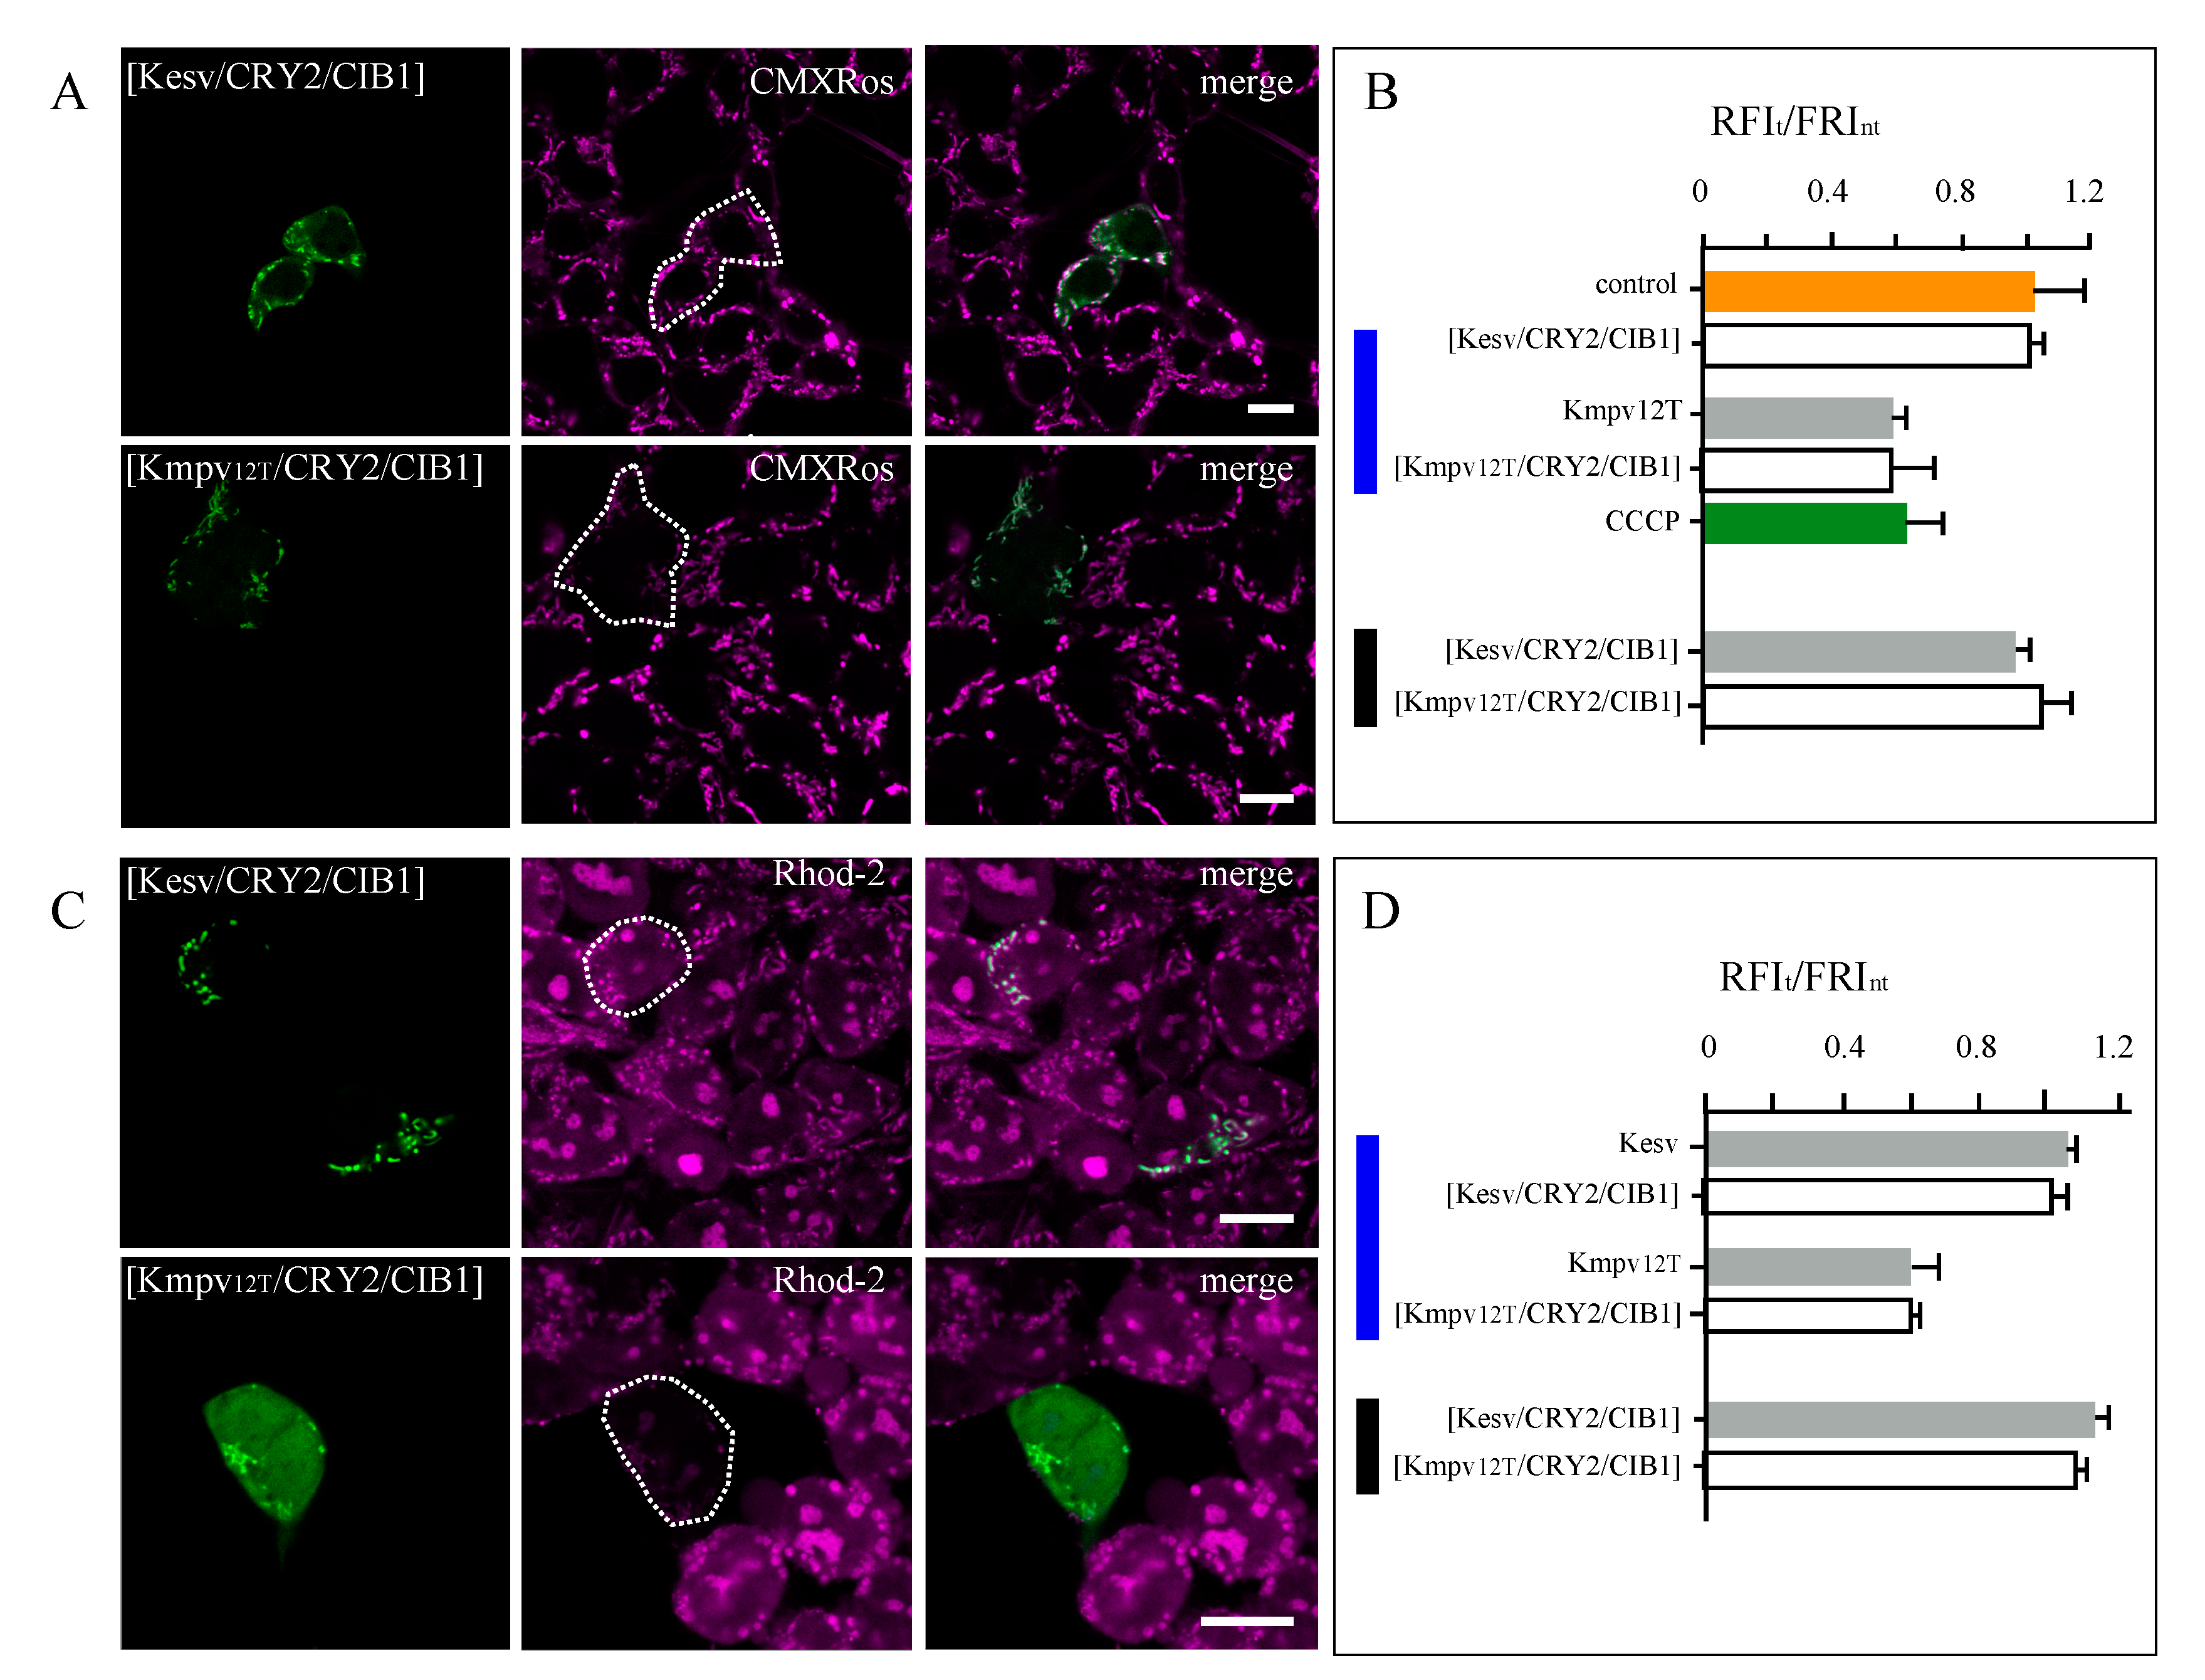
3.3. Effect of K+ Channels on Mitochondria Physiology
4. Conclusions
Supplementary Materials
Author Contributions
Funding
Acknowledgments
Conflicts of Interest
References
- Hille, B. Ion Channels of Excitable Membranes, 3rd ed.; Sinauer Associates Inc.: Sunderland, MA, USA, 2001. [Google Scholar]
- Banghart, M.R.; Volgraf, M.; Trauner, D. Engineering light-gated ion channels. Biochemistry 2006, 45, 15129–15141. [Google Scholar] [CrossRef] [PubMed]
- Deisseroth, K.; Hegemann, P. The form and function of channelrhodopsin. Science 2017, 357, eaan5544. [Google Scholar] [CrossRef] [PubMed]
- Alberio, L.; Locarno, A.; Saponaro, A.; Romano, E.; Bercier, V.; Albadri, S.; Simeoni, F.; Moleri, S.; Pelucchi, S.; Porro, A.; et al. A light-gated potassium channel for sustained neuronal inhibition. Nat. Methods 2018, 15, 969–976. [Google Scholar] [CrossRef] [PubMed]
- Paoletti, P.; Ellis-Davies, G.C.R.; Mourot, A. Optical control of neuronal ion channels and receptors. Nat. Rev. Neurosci. 2019, 20, 514–532. [Google Scholar] [CrossRef] [PubMed]
- Tkatch, T.; Greotti, E.; Baranauskas, G.; Pendin, D.; Roy, S.; Nita, L.I.; Wettmarshausen, J.; Prigge, M.; Yizhar, O.; Shirihai, O.S.; et al. Optogenetic control of mitochondrial metabolism and Ca2+ signaling by mitochondria-targeted opsins. Proc. Natl. Acad. Sci. USA 2017, 114, E5167–E5176. [Google Scholar]
- Ernst, P.; Xu, N.; Qu, J.; Chen, H.; Goldberg, M.S.; Darley-Usmar, V.; Zhang, J.J.; O’Rourke, B.; Liu, X.; Zhou, L. Precisely control mitochondria with light to manipulate cell fate decision. Biophys. J. 2019, 117, 631–645. [Google Scholar] [CrossRef] [PubMed]
- O’Rourke, B. Evidence for mitochondrial K+ channels and their role in cardioprotection. Circ. Res. 2004, 94, 420–432. [Google Scholar] [CrossRef]
- Szabo, I.; Zoratti, M. Mitochondrial channels. Ion fluxes and more. Physiol. Revs. 2014, 94, 519–608. [Google Scholar] [CrossRef]
- Laskowski, M.; Augustynek, B.; Kulawiak, B.; Koprowski, P.; Bednarczyk, P.; Jarmuszkiewicz, W.; Szewczyk, A. What do we not know about mitochondrial potassium channels? BBA 2016, 1857, 1247–1257. [Google Scholar] [CrossRef]
- Wrosek, A.; Augustynek, B.; Żochowska, M.; Szewczyk, A. Mitochondrial potassium channels as druggable targets. Biomolecules 2020, 10, 1200. [Google Scholar] [CrossRef]
- Szewczyk, A.; Jarmuszkiewicz, W.; Kunz, W.S. Mitochondrial potassium channels. IUBMB Life 2009, 61, 134–143. [Google Scholar] [CrossRef] [PubMed]
- Van Bergeijk, P.; Adrian, M.; Hoogenraad, C.C.; Kapitein, L.C. Optogenetic control of organelle transport and positioning. Nature 2015, 518, 111–114. [Google Scholar] [CrossRef] [PubMed]
- Shi, F.; Kawano, F.; Park, S.-H.E.; Komazaki, S.; Hirabayashi, Y.; Polleux, F.; Yazawa, M. Optogenetic control of endoplasmic reticulum-mitochondria tethering. ACS Syn. Biol. 2018, 7, 2–9. [Google Scholar] [CrossRef] [PubMed]
- D’Acunzo, P.; Strappazzon, F.; Caruana, I.; Meneghetti, G.; Di Rita, A.; Simula, L.; Weber, G.; Del Bufalo, F.; Dalla Valle, L.; Campello, S.; et al. Reversible induction of mitophagy by an optogenetic bimodular system. Nat. Commun. 2019, 10, 1533. [Google Scholar] [CrossRef]
- Berry, B.J.; Trewin, A.J.; Milliken, A.S.; Baldzizhar, A.; Amitrano, A.M.; Kim, M.; Wojtovich, A.P. Controlling the Mitochondrial Protonmotive Force with Light to Impact Cellular Stress Resistance. EMBO Rep. 2020, e49113. [Google Scholar] [CrossRef]
- Schneider, F.; Gradmann, D.; Hegemann, P. Ion selectivity and competition in channelrhodopsins. Biophys. J. 2013, 105, 91–100. [Google Scholar] [CrossRef]
- Ahmad, M.; Cashmore, A.R. HY4 gene of A. thaliana encodes a protein with characteristics of a blue-light photoreceptor. Nature 1993, 366, 162–166. [Google Scholar] [CrossRef]
- Liu, H.; Wang, Q.; Liu, Y.; Zhao, X.; Imaizumi, T.; Somers, D.E.; Tobin, E.M.; Lin, C. Arabidopsis CRY2 and ZTL mediate blue-light regulation of the transcription factor CIB1 by distinct mechanisms. Proc. Natl. Acad. Sci. USA 2013, 110, 17582–17587. [Google Scholar] [CrossRef]
- Pathak, G.P.; Spiltoir, J.I.; Hoglund, C.; Polstein, L.R.; Heine-Koskinen, S.; Gersbach, C.A.; Rossi, J.; Tucker, C.L. Bidirectional approaches for optogenetic regulation of gene expression in mammalian cells using Arabidopsis cryptochrome 2. Nucleic Acids Res. 2017, 45, e167. [Google Scholar] [CrossRef]
- Heckman, K.L.; Pease, L.R. Gene splicing and mutagenesis by PCR-driven overlap extension. Nat. Protoc. 2007, 2, 924–932. [Google Scholar] [CrossRef]
- Gibson, D.G.; Young, L.; Chuang, R.-Y.; Venter, J.C.; Hutchison, C.A.; Smith, H.O. Enzymatic assembly of DNA molecules up to several hundred kilobases. Nat. Methods 2009, 6, 343–345. [Google Scholar] [CrossRef] [PubMed]
- Winterstein, L.-M.; Kukovetz, K.; Rauh, O.; Turman, D.L.; Braun, C.; Moroni, A.; Schroeder, I.; Thiel, G. Reconstitution and functional characterization of ion channels from nanodiscs in lipid bilayers. J. Gen. Physiol. 2018, 150, 637–646. [Google Scholar] [CrossRef] [PubMed]
- Scaduto, R.C., Jr.; Grothyhann, L.W. Measurment of mitochondrial membrane potential using fluorescent rhodamine derivatives. Biophys. J. 1999, 76, 469–477. [Google Scholar] [CrossRef]
- Braun, C.J.; Lachnit, C.; Becker, P.; Henkes, L.M.; Arrigoni, C.; Kast, S.M.; Moroni, A.; Thiel, G.; Schroeder, I. Viral potassium channels as a robust model system for studies of membrane-protein interaction. BBA 2014, 1838, 1096–1103. [Google Scholar] [CrossRef] [PubMed]
- Eckert, D.; Schulze, T.; Stahl, J.; Rauh, O.; Van Etten, J.L.; Hertel, B.; Schroeder, I.; Moroni, A.; Thiel, G. A small viral potassium ion channel with an inherent inward rectification. Channels 2019, 13, 124–135. [Google Scholar] [CrossRef] [PubMed]
- Siotto, F.; Martin, C.; Rauh, O.; Van Etten, J.L.; Schroeder, I.; Moroni, A.; Thiel, G. Viruses infecting marine picoplancton encode functional potassium ion channels. Virology 2014, 467, 103–111. [Google Scholar] [CrossRef]
- Balss, J.; Papatheodorou, P.; Mehmel, M.; Baumeister, D.; Hertel, B.; Delaroque, N.; Chatelain, F.C.; Minor, D.L., Jr.; van Etten, J.L.; Rassow, J.; et al. Transmembrane domain length of viral K+ channels is a signal for mitochondria targeting. Proc. Natl. Acad. Sci. USA 2008, 105, 12313–12318. [Google Scholar] [CrossRef]
- Sun, L.; Li, J.; Xiao, X. Overcoming adeno-associated virus vector size limitation thtrough viral DNA heterodimerization. Nat. Med. 2000, 6, 599–602. [Google Scholar] [CrossRef]
- Engelhard, C.; Wang, X.; Robles, D.; Moldt, J.; Essen, L.-O.; Batschauer, A.; Bittl, R.; Ahmad, M. Cellular metabolites enhance the light sensitivity of the Arabidopsis cyrptochome through alternate electron transfer pathways. Plant Cell 2014, 26, 4519–4531. [Google Scholar] [CrossRef]
- Giacomello, M.; Drago, I.; Bortolozzi, M.; Scorzeto, M.; Gianelle, A.; Pizzo, P.; Pozzan, T. Ca2+ hot spots on the mitochondrial surface are generated by Ca2+ mobilization from stores, but not by activation of store-operated Ca2+ channels. Mol. Cell 2010, 38, 280–290. [Google Scholar] [CrossRef]
- Rondelli, V.; Del Favero, E.; Brocca, P.; Fragneto, G.; Trapp, M.; Mauri, L.; Ciampa, M.G.; Romani, G.; Braun, C.J.; Schroeder, I.; et al. Vectional K+ Channel insertion in a single phospholipid bilayer: Neutron Reflectometry and Electrophysiology in the joint exploration of a model membrane functional platform. BBA Gen. Subj. 2018, 1862, 1742–1750. [Google Scholar] [CrossRef] [PubMed]
- Bertl, A.; Blumwald, E.; Coronado, R.; Eisenberg, R.; Findlay, G.; Gradmann, D.; Hille, B.; Köhler, K.; Kolb, H.A.; MacRobbie, E.; et al. Electrical measurements on endomembranes. Science 1992, 258, 873–874. [Google Scholar] [CrossRef] [PubMed]
- Santel, A.; Fuller, M.T. Human homologs of drosophila Fzo-GTPase. J. Cell Sci. 2000, 114, 867–874. [Google Scholar]
- Miyazono, Y.; Hirashima, S.; Ishihara, N.; Kusukawa, J.; Nakamura, K.-I.; Ohta, K. Uncoupled mitochondria quickly shorten along their long axis to form indented spheroids, instead of rings, in a fission-independent manner. Sci. Rep. 2018, 8, 350. [Google Scholar] [CrossRef] [PubMed]
- Isenberg, J.S.; Klaunig, J.E. Role of mitochondrial membrane permeability transition (MPT) in rotenome-induced apoptosis in liver cells. Toxicol. Sci. 2000, 53, 340–351. [Google Scholar] [CrossRef]
- Nguyen, T.; Chin, W.-C.; Verdugo, P. Role of Ca2+/K+ ion exchange in intracellular storage and release of Ca2+. Nature 1998, 395, 908–912. [Google Scholar] [CrossRef]
- Giorgi, C.; Agnoletto, C.; Bononi, A.; Bonora, M.; De Marchi, E.; Marchi, S.; Missiroli, S.; Patergnani, S.; Poletti, F.; Rimessi, A.; et al. Mitochoindrial calcium homeostasis as potential target for mitochondrial medicine. Mitochondrion 2012, 12, 77–85. [Google Scholar] [CrossRef]
- Aubry, J.P.; Blaecke, A.; Lecoanet-Henchoz, S.; Jeannin, P.; Herbault, N.; Caron, G.; Moine, V.; Bonnefoy, J.Y. Annexin V used for measuring apoptosis in the early events of cellular cytotoxicity. Cytometry 1999, 37, 197–204. [Google Scholar] [CrossRef]


Publisher’s Note: MDPI stays neutral with regard to jurisdictional claims in published maps and institutional affiliations. |
© 2020 by the authors. Licensee MDPI, Basel, Switzerland. This article is an open access article distributed under the terms and conditions of the Creative Commons Attribution (CC BY) license (http://creativecommons.org/licenses/by/4.0/).
Share and Cite
Engel, A.J.; Winterstein, L.-M.; Kithil, M.; Langhans, M.; Moroni, A.; Thiel, G. Light-Regulated Transcription of a Mitochondrial-Targeted K+ Channel. Cells 2020, 9, 2507. https://doi.org/10.3390/cells9112507
Engel AJ, Winterstein L-M, Kithil M, Langhans M, Moroni A, Thiel G. Light-Regulated Transcription of a Mitochondrial-Targeted K+ Channel. Cells. 2020; 9(11):2507. https://doi.org/10.3390/cells9112507
Chicago/Turabian StyleEngel, Anja J., Laura-Marie Winterstein, Marina Kithil, Markus Langhans, Anna Moroni, and Gerhard Thiel. 2020. "Light-Regulated Transcription of a Mitochondrial-Targeted K+ Channel" Cells 9, no. 11: 2507. https://doi.org/10.3390/cells9112507
APA StyleEngel, A. J., Winterstein, L.-M., Kithil, M., Langhans, M., Moroni, A., & Thiel, G. (2020). Light-Regulated Transcription of a Mitochondrial-Targeted K+ Channel. Cells, 9(11), 2507. https://doi.org/10.3390/cells9112507