TDP-43-Mediated Toxicity in HEK293T Cells: A Fast and Reproducible Protocol To Be Employed in the Search of New Therapeutic Options against Amyotrophic Lateral Sclerosis

 ,
,  ,
,  and
and 
Abstract
1. Introduction
2. Materials and Methods
2.1. Plasmids
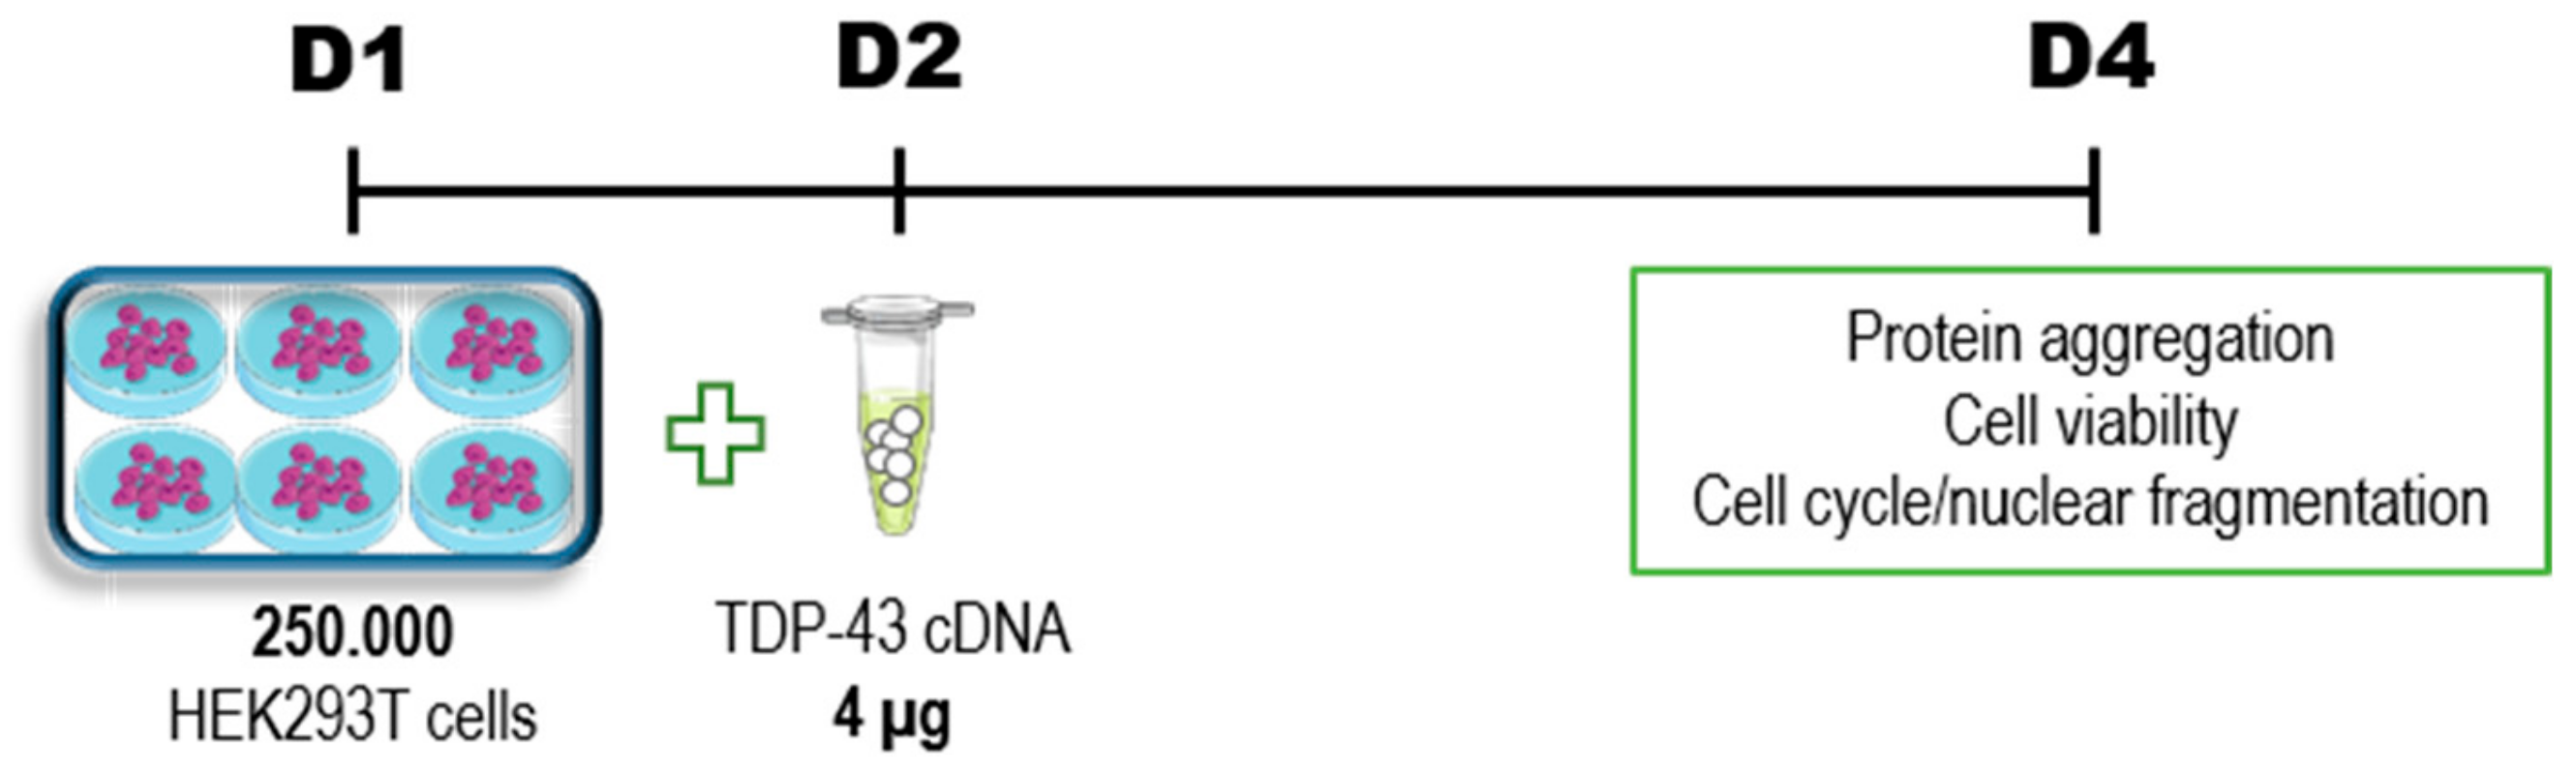
2.2. Cells
2.3. Western Blot
2.4. Cell Viability Assays
2.5. Cell Cycle Analysis
2.6. Analysis of Reactive Oxygen Species (ROS) Levels
2.7. Analysis of Mitochondrial Dysfunction
2.8. Energy Metabolism Analyses
2.9. Metabolomics Analysis
2.10. Statistical Analysis
3. Results
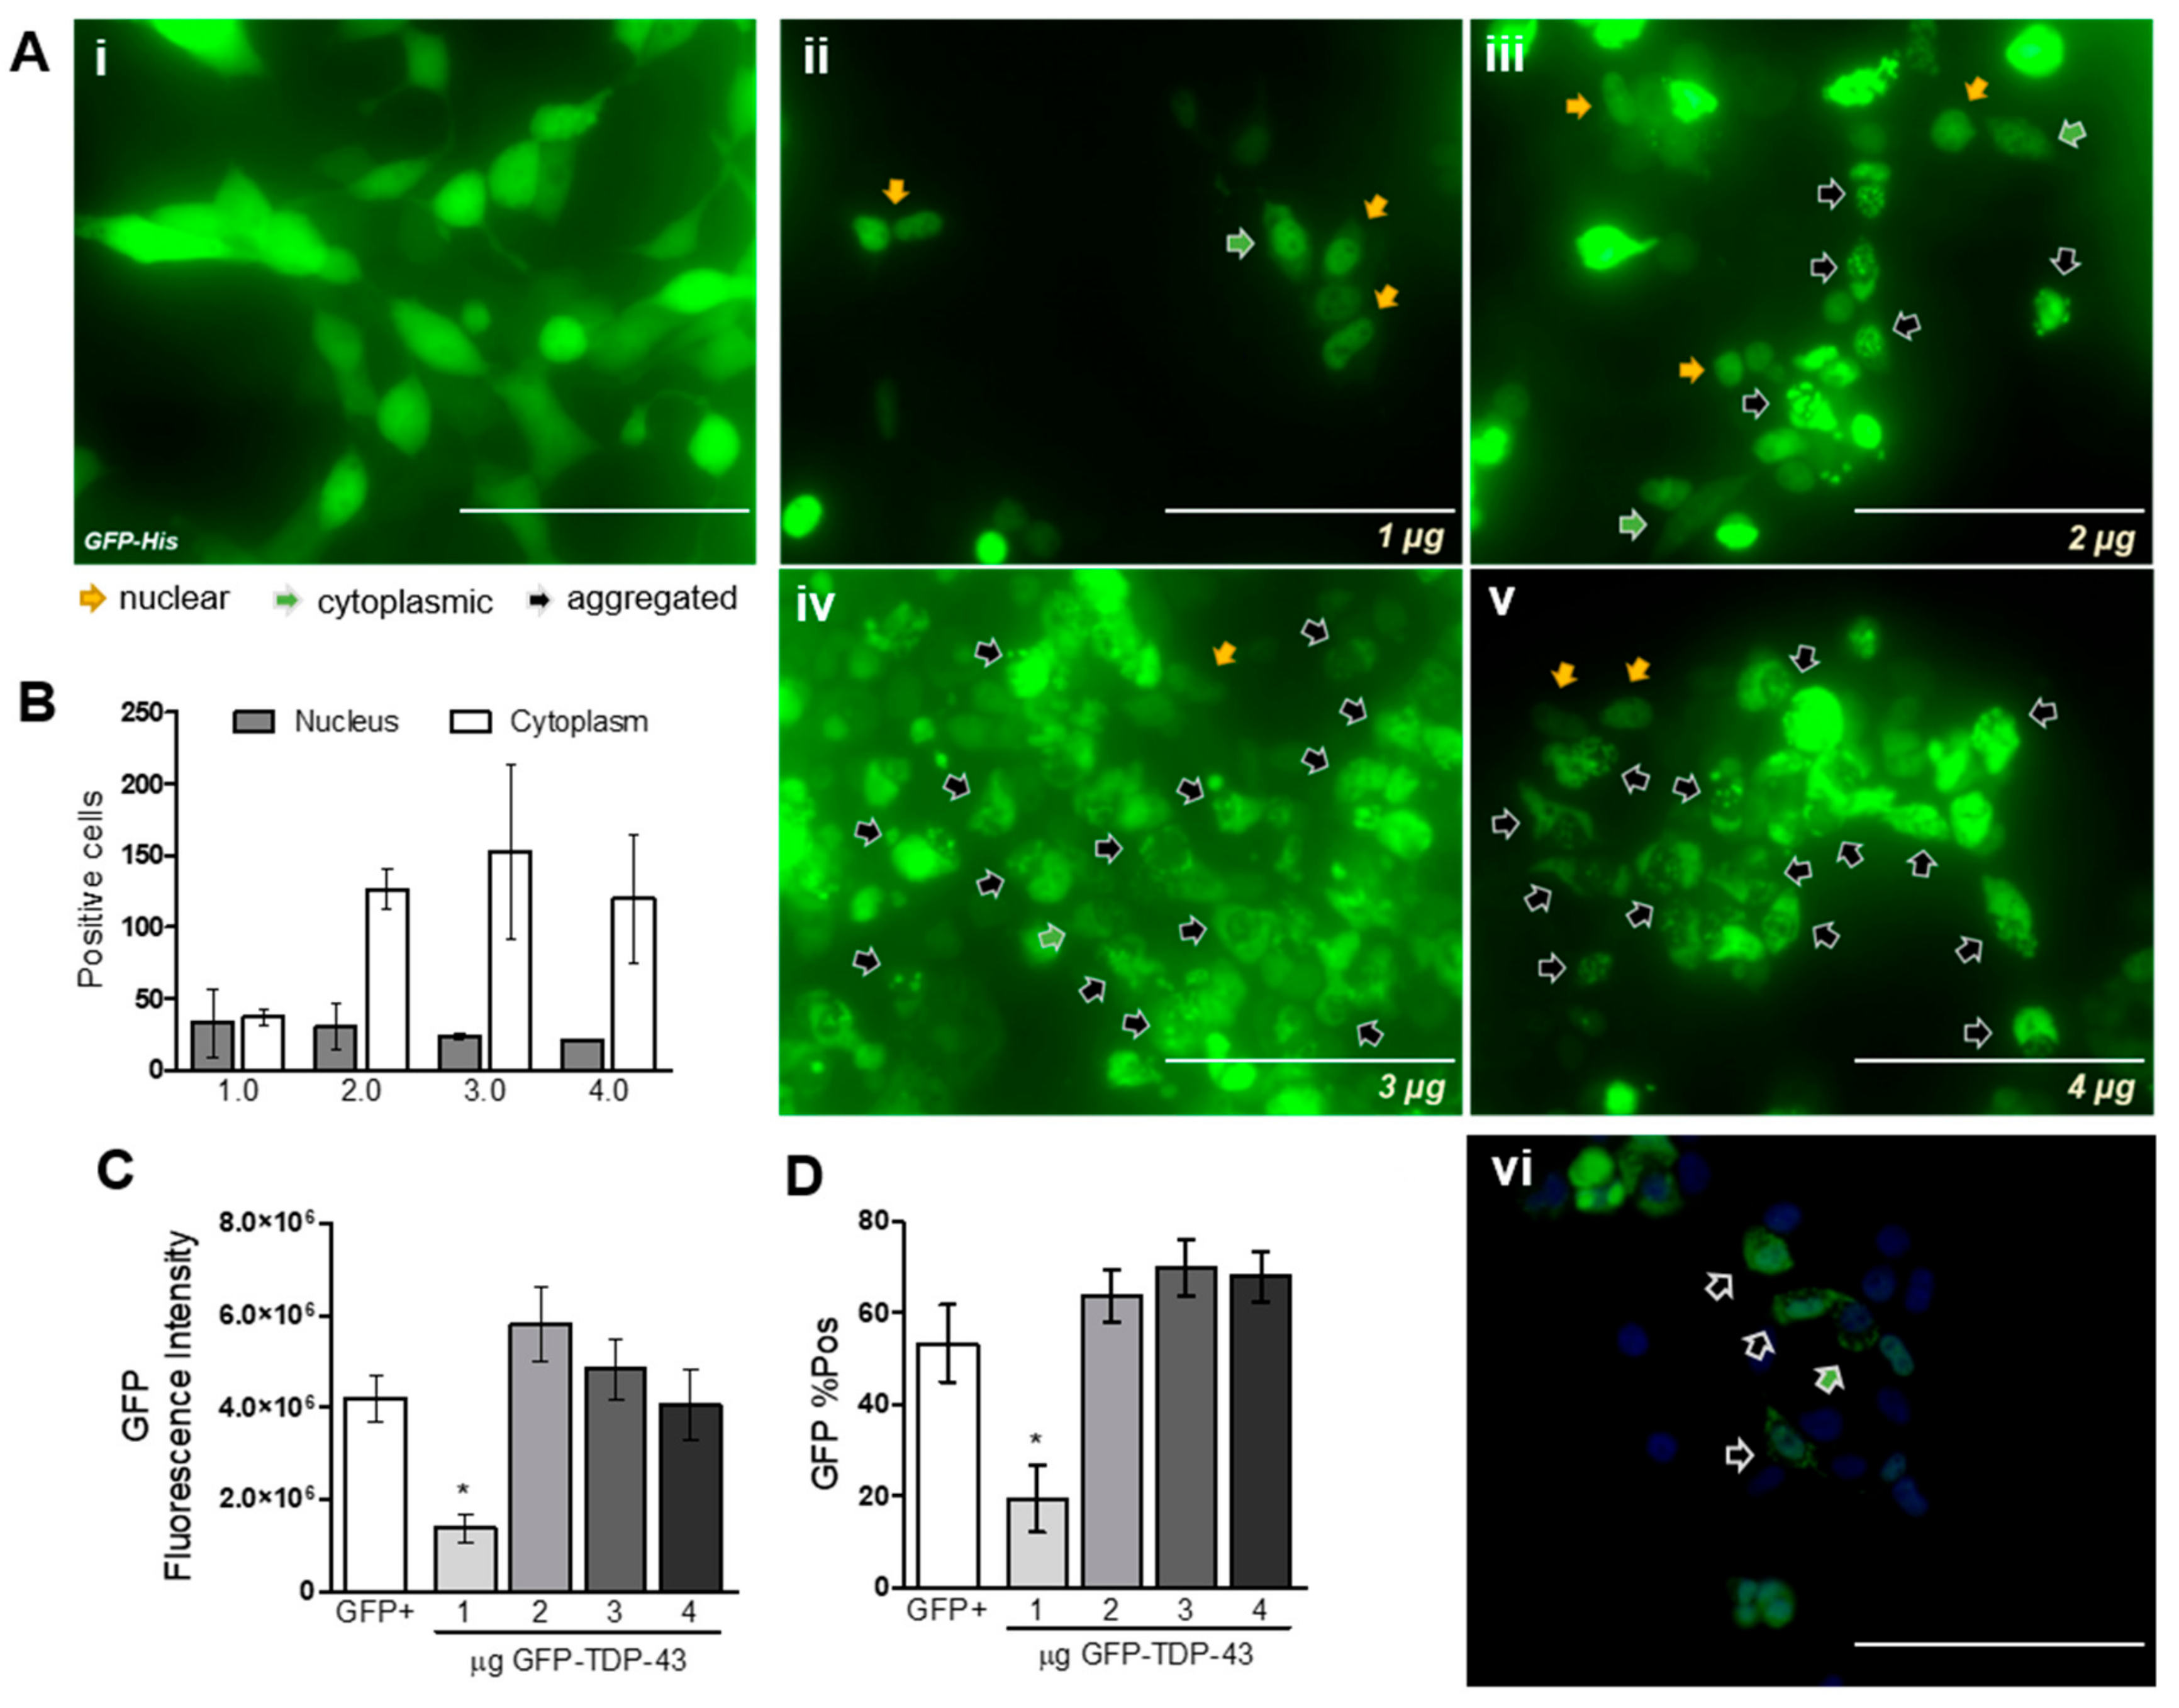
3.1. Cellular Distribution and Aggregation of TDP-43
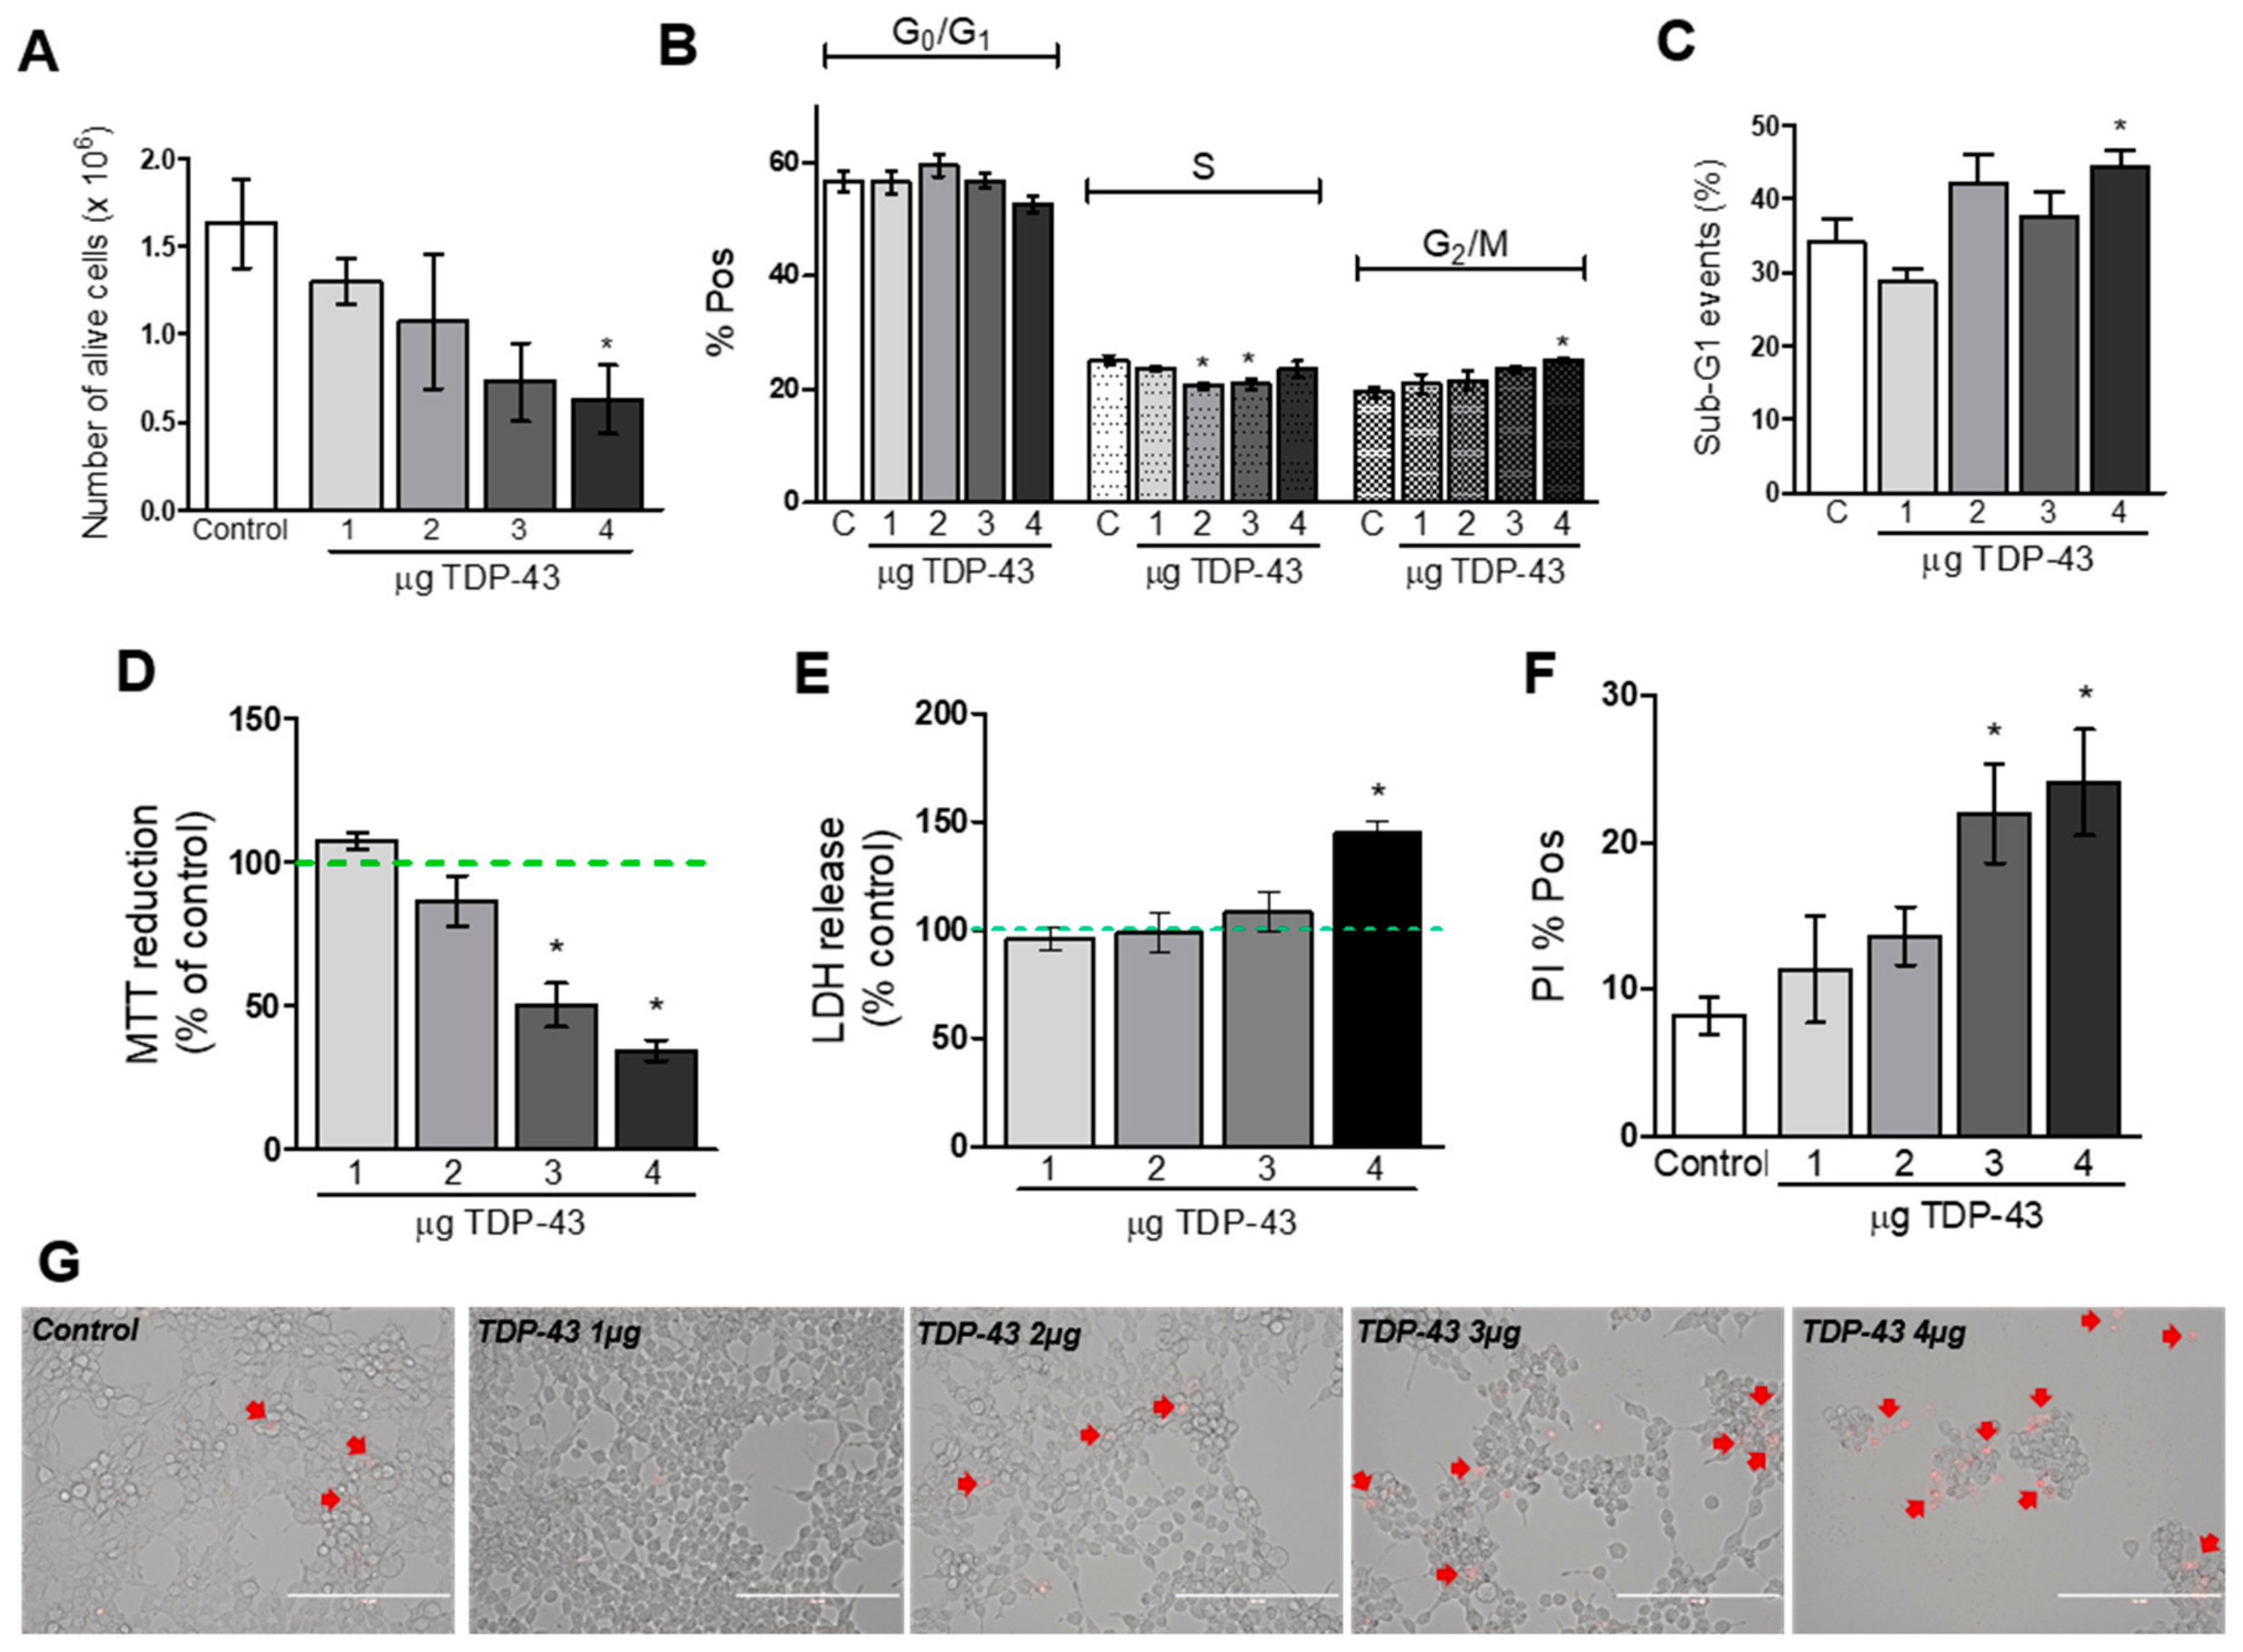
3.2. Cell Viability Assays
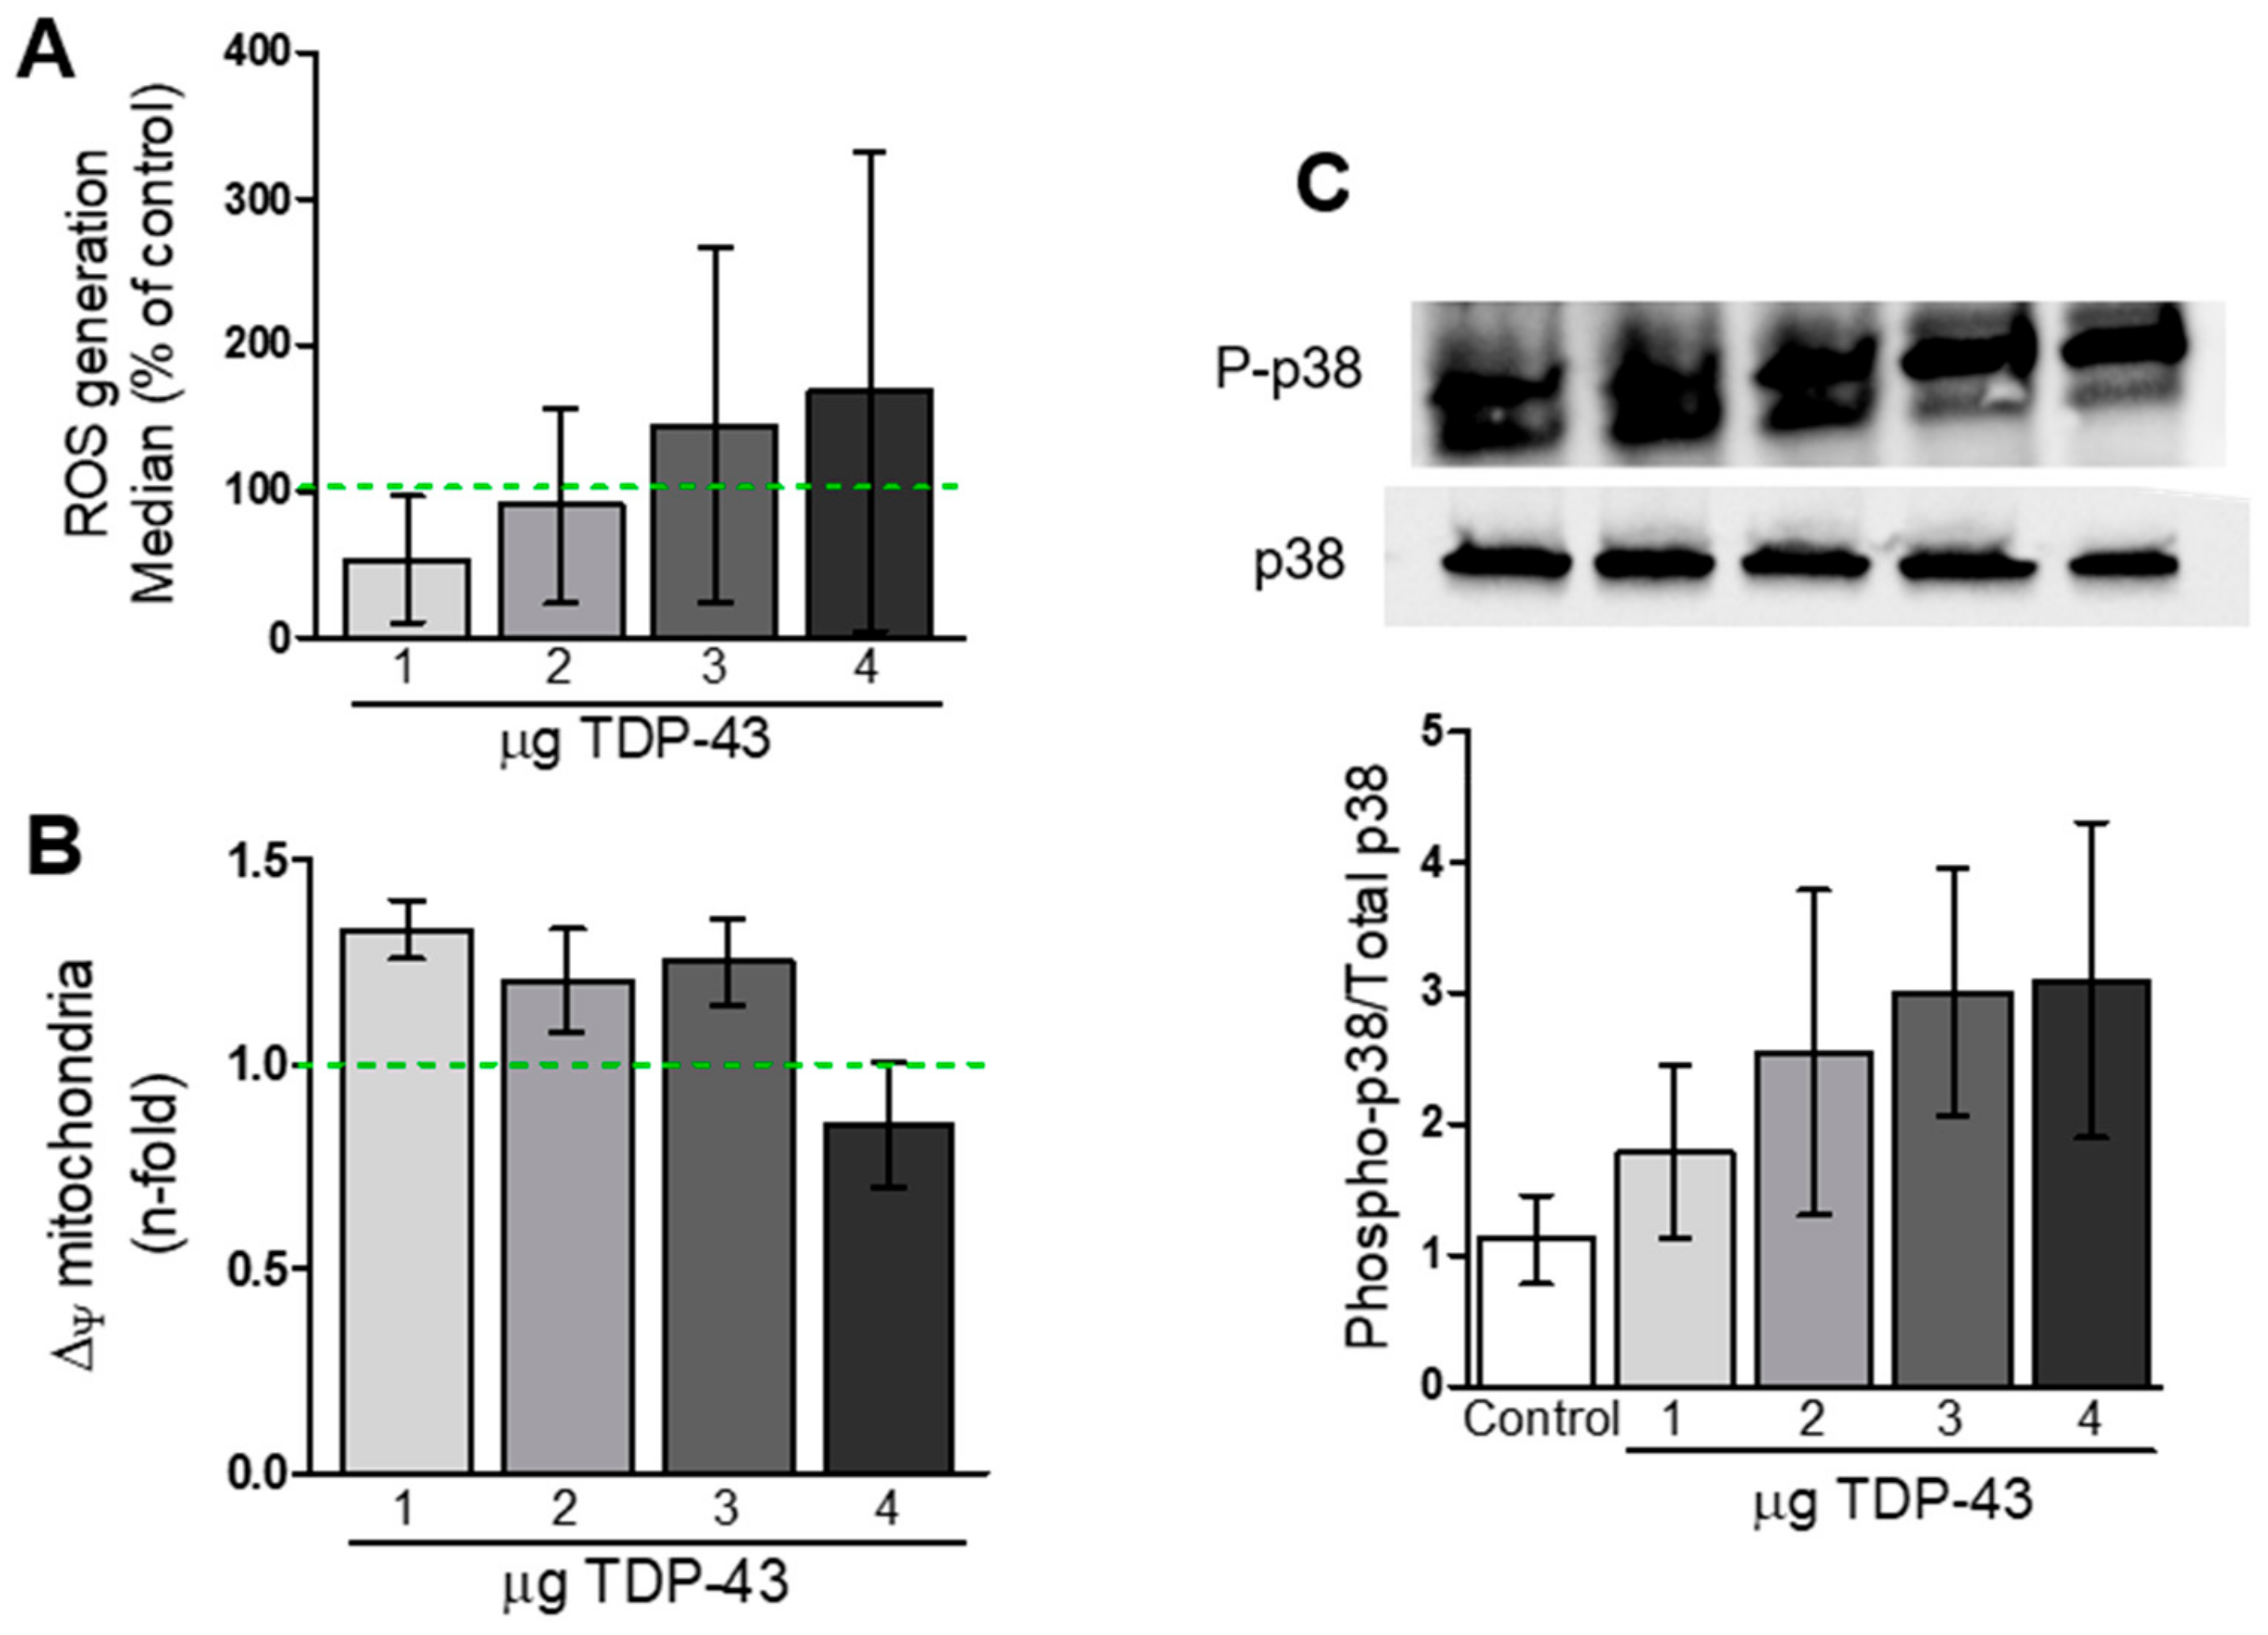
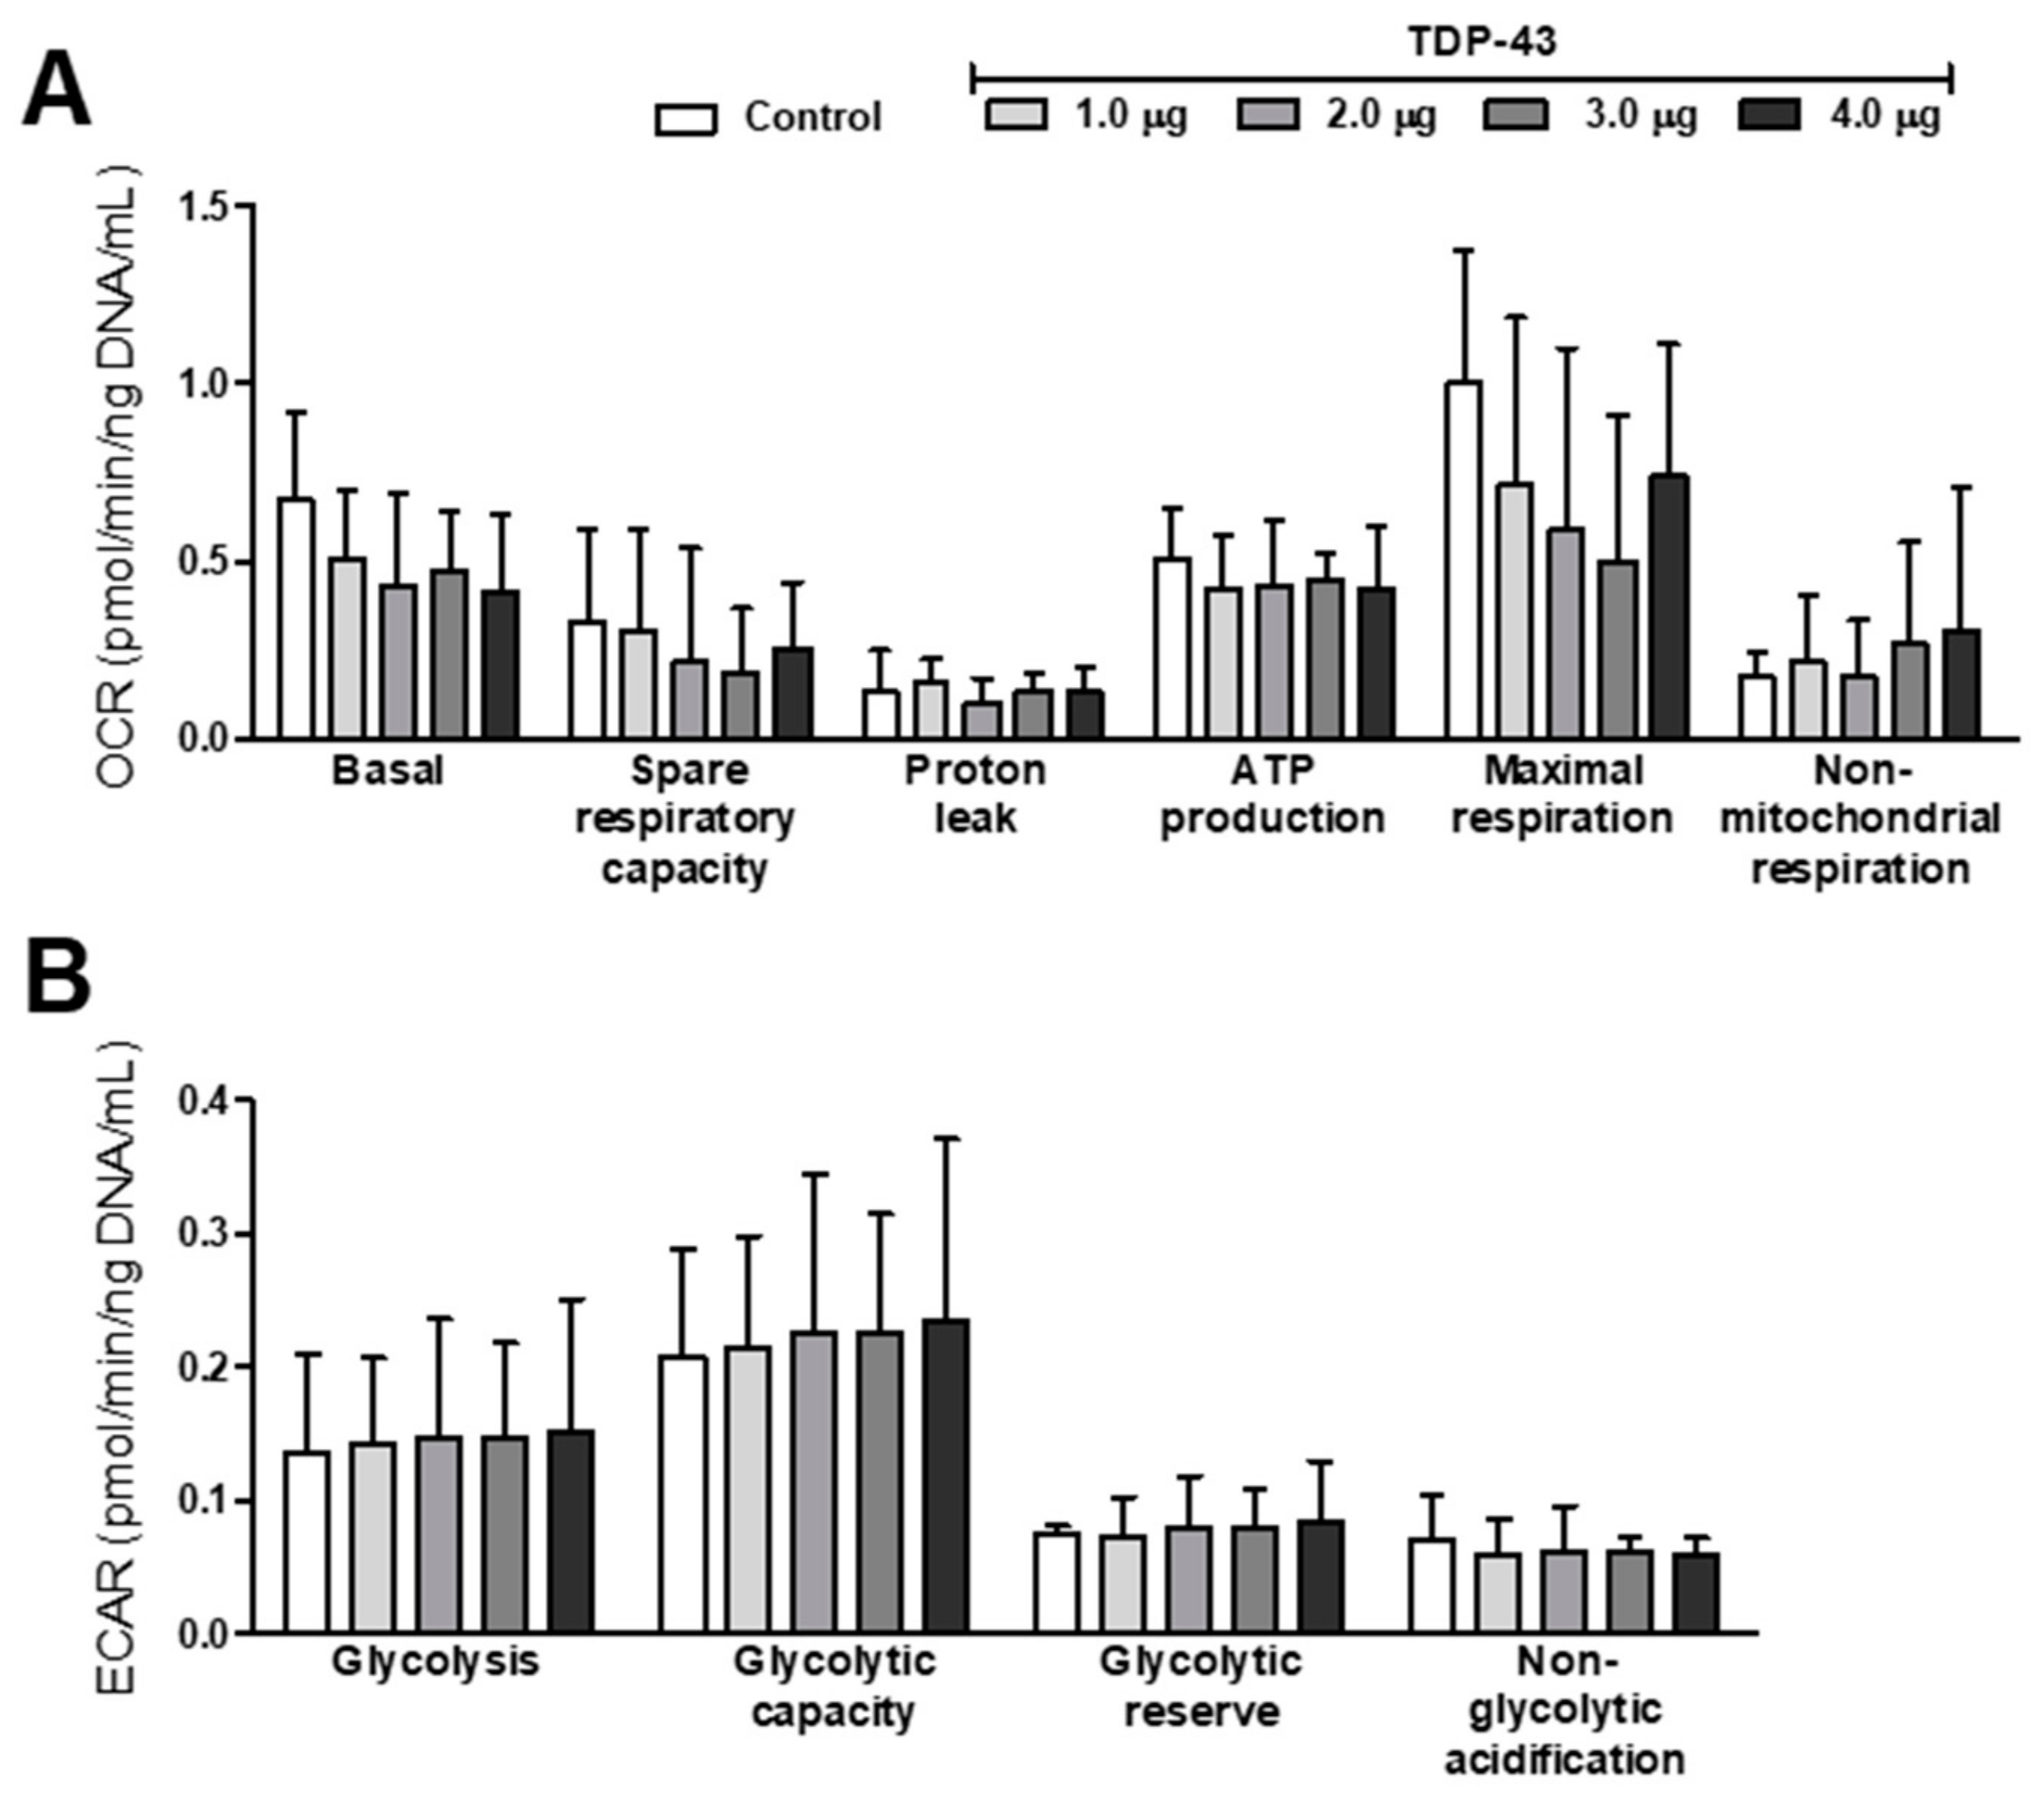
3.3. Oxidative Stress and Energy Metabolism Evaluation
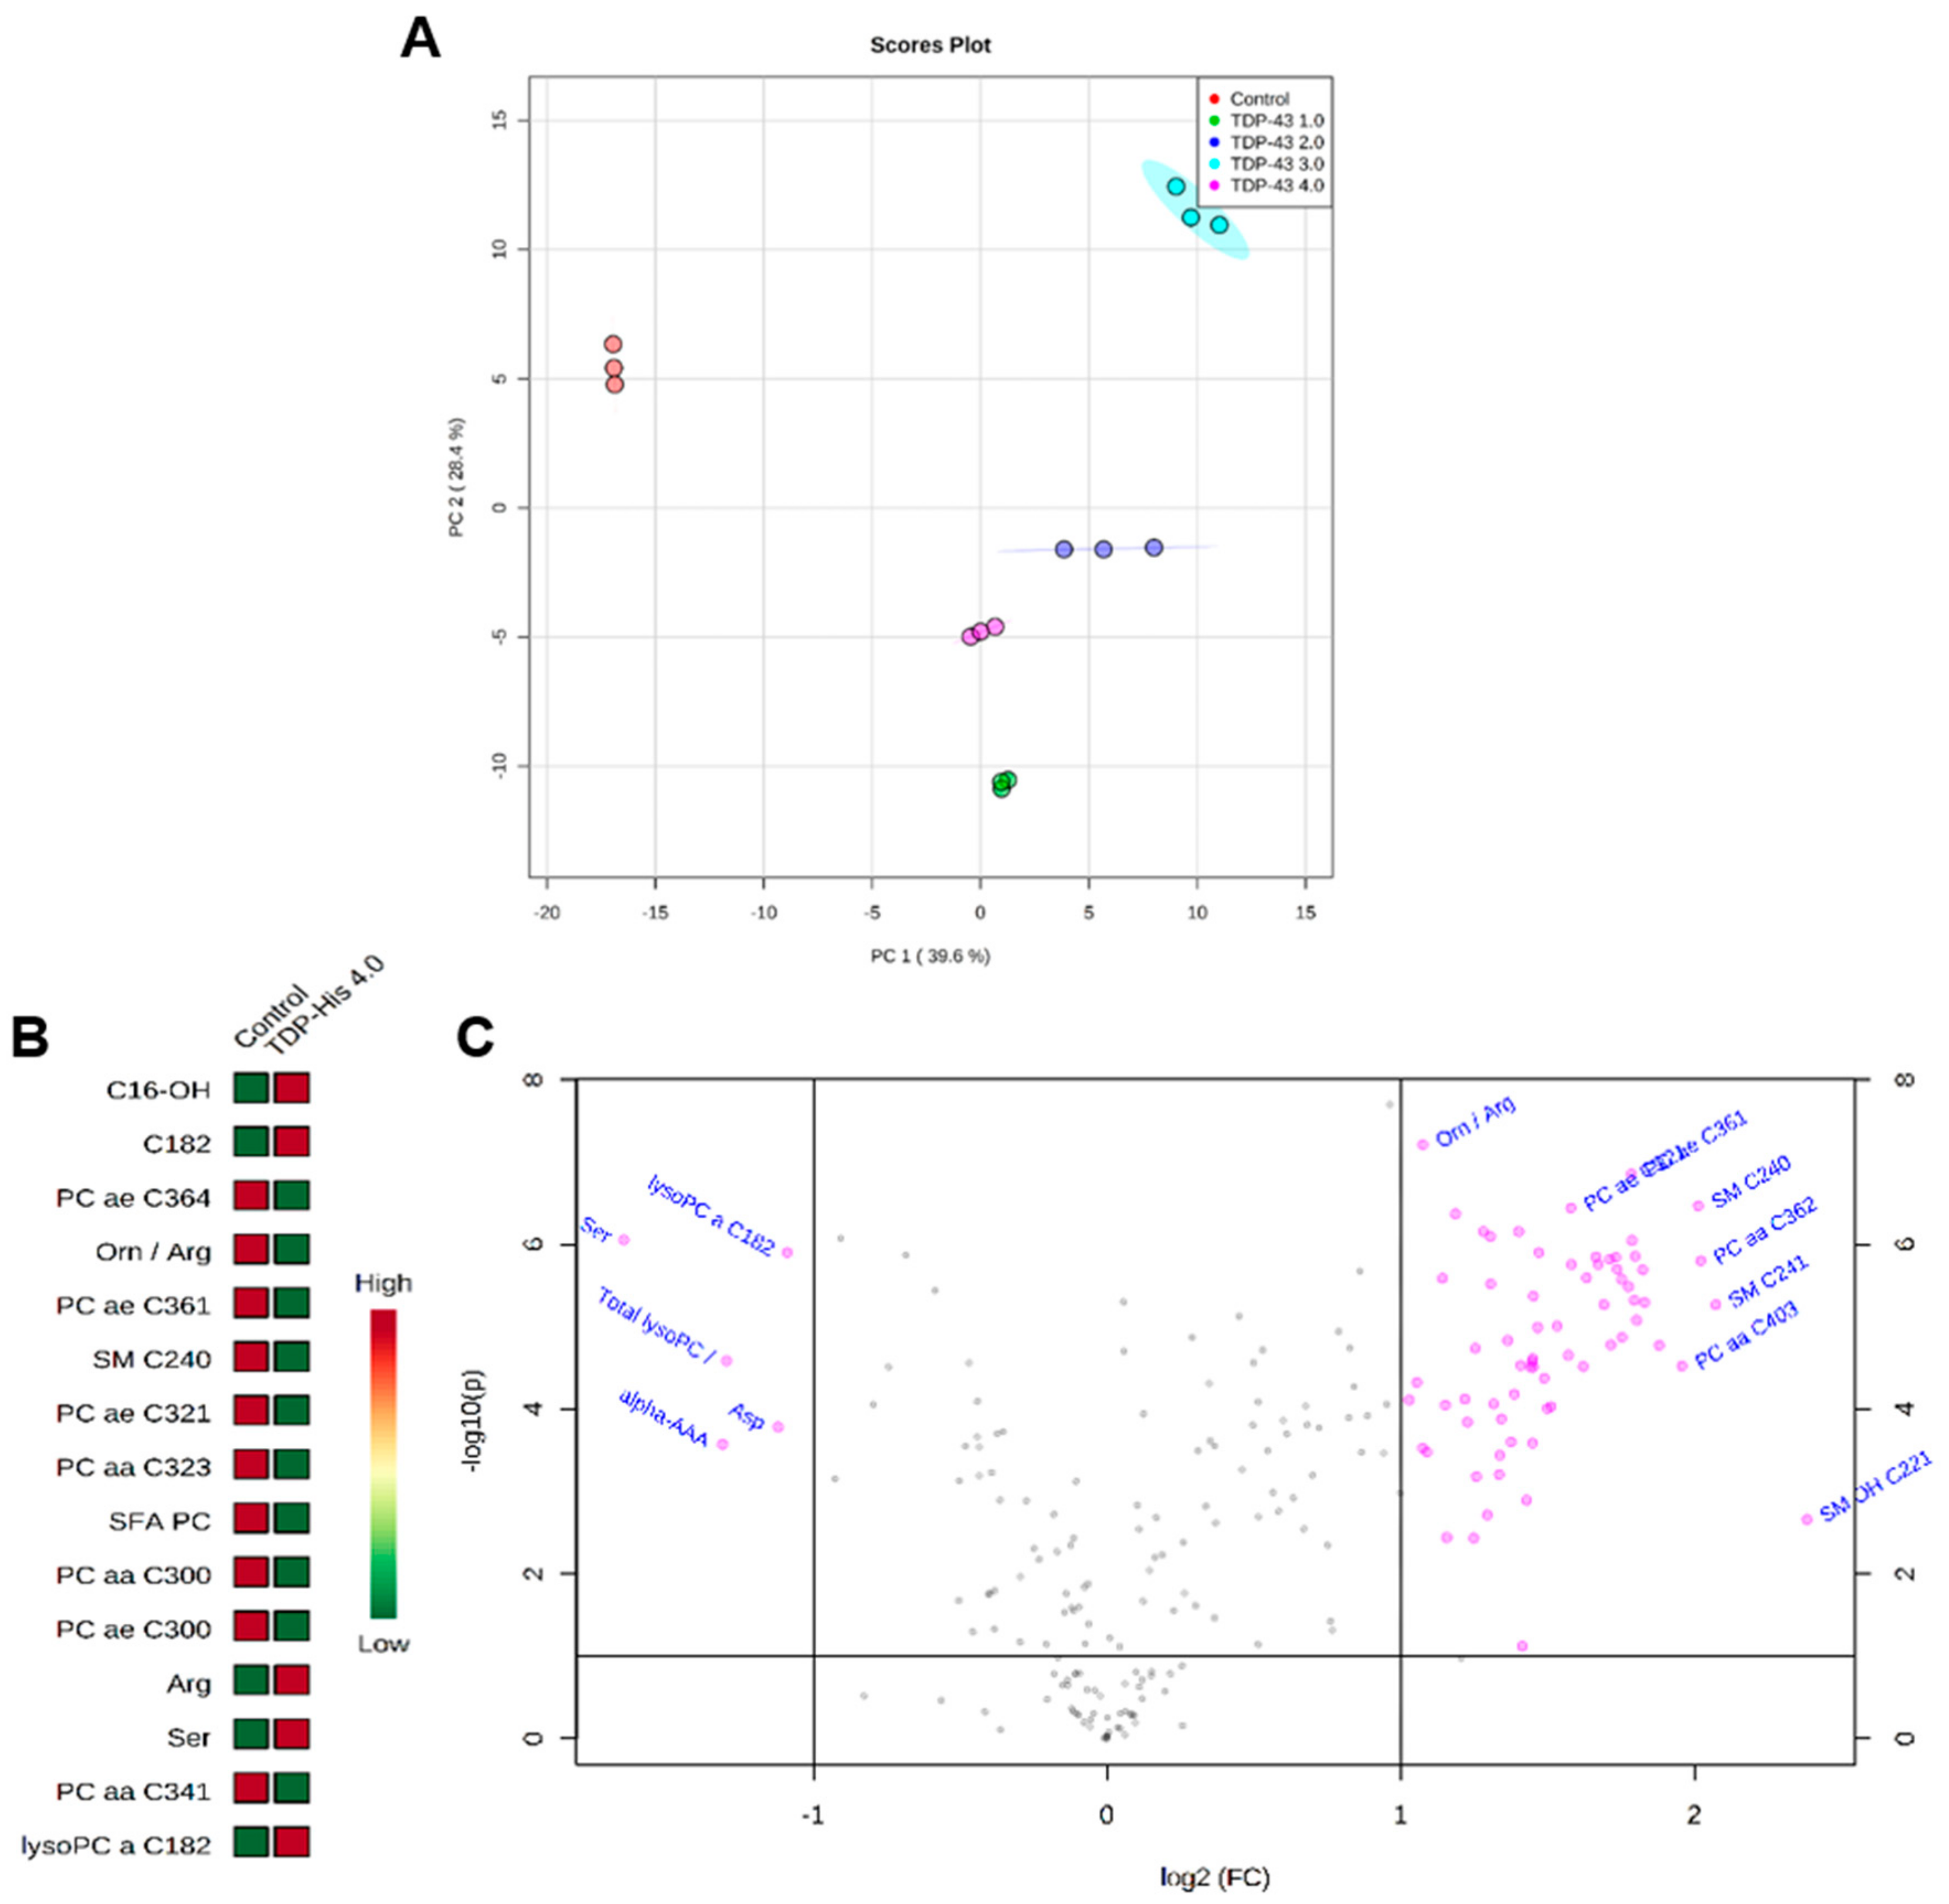
3.4. Metabolome Profile
4. Discussion
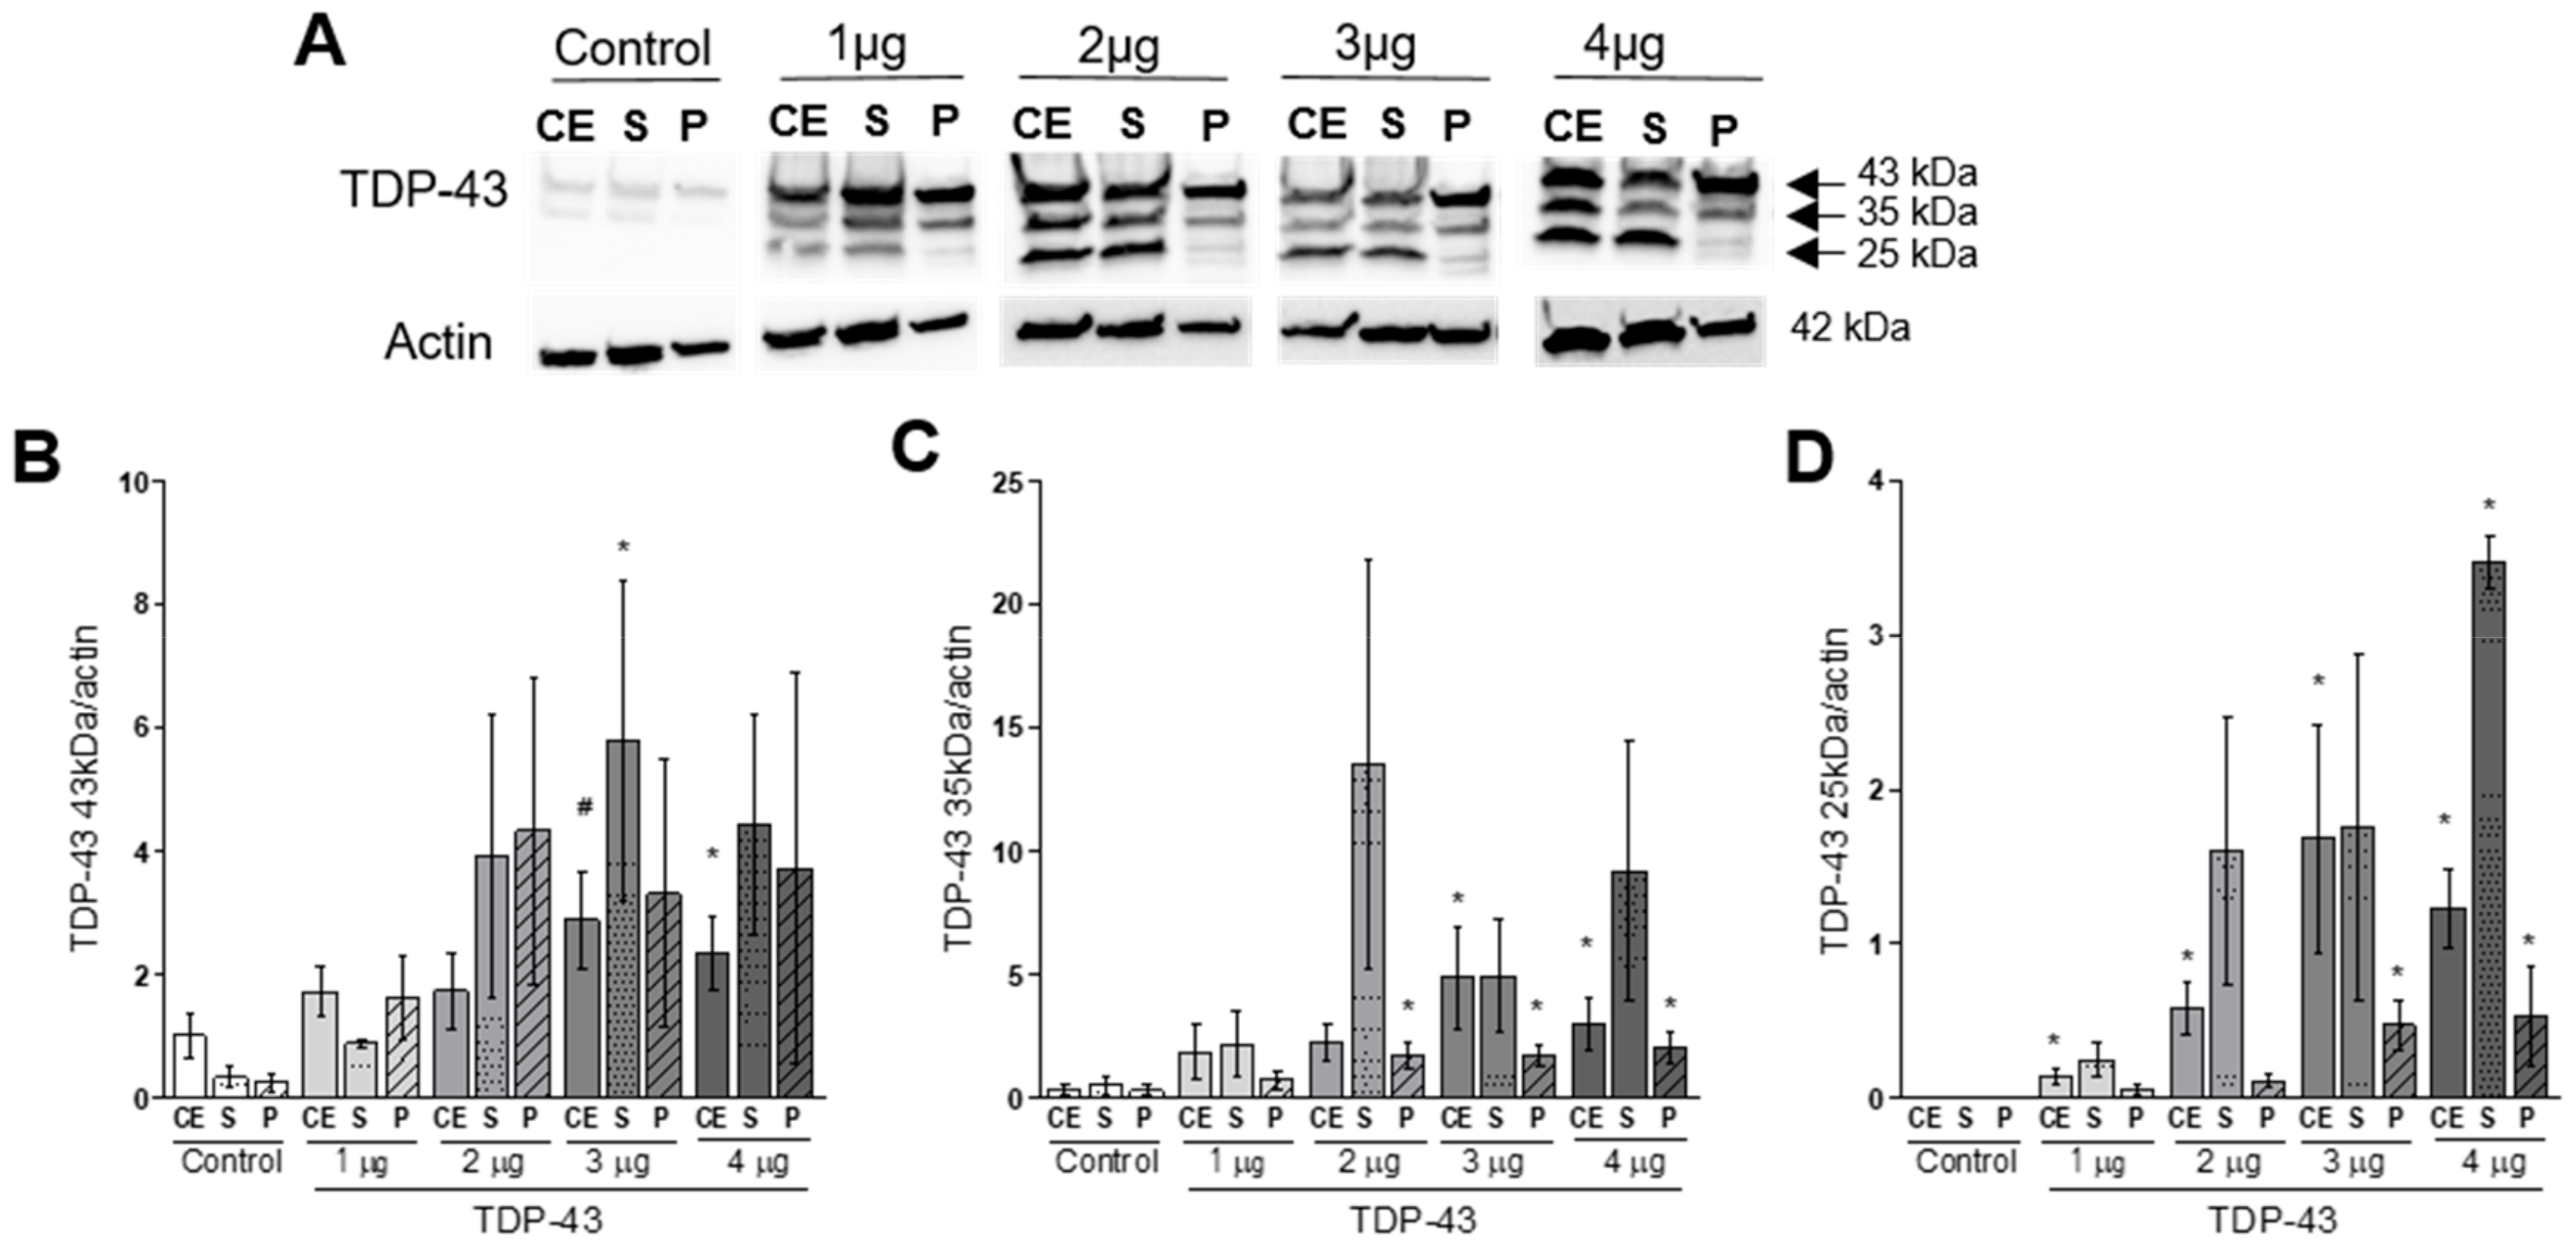
4.1. TDP-43 Overexpression Induces Protein Aggregation and Fragmentation.
4.2. Decrease in Cellular Viability Induced by TDP-43 Overexpression
4.3. TDP-43 Overexpression and Mitochondrial Function
4.4. Alteration of Cell Metabolome Induced by TDP-43 Overexpression
Supplementary Materials
Author Contributions
Funding
Acknowledgments
Conflicts of Interest
References
- Buratti, E.; Baralle, F.E. Characterization and functional implications of the RNA binding properties of nuclear factor TDP-43, a novel splicing regulator of CFTR exon 9. J. Biol. Chem. 2001, 276, 36337–36343. [Google Scholar] [CrossRef] [PubMed]
- Polymenidou, M.; Lagier-Tourenne, C.; Hutt, K.R.; Huelga, S.C.; Moran, J.; Liang, T.Y.; Ling, S.C.; Sun, E.; Wancewicz, E.; Mazur, C.; et al. Long pre-MRNA depletion and RNA missplicing contribute to neuronal vulnerability from loss of TDP-43. Nat. Neurosci. 2011, 14, 459–468. [Google Scholar] [CrossRef] [PubMed]
- Hergesheimer, R.C.; Chami, A.A.; de Assis, D.R.; Vourc’h, P.; Andres, C.R.; Corcia, P.; Lanznaster, D.; Blasco, H. The debated toxic role of aggregated TDP-43 in amyotrophic lateral sclerosis: A resolution in sight? Brain J. Neurol. 2019, 142, 1176–1194. [Google Scholar] [CrossRef] [PubMed]
- Baralle, M.; Buratti, E.; Baralle, F.E. The role of TDP-43 in the pathogenesis of ALS and FTLD. Biochem. Soc. Trans. 2013, 41, 1536–1540. [Google Scholar] [CrossRef] [PubMed]
- Prasad, A.; Bharathi, V.; Sivalingam, V.; Girdhar, A.; Patel, B.K. Molecular mechanisms of TDP-43 misfolding and pathology in amyotrophic lateral sclerosis. Front. Mol. Neurosci. 2019, 12, 25. [Google Scholar] [CrossRef] [PubMed]
- Crowley, L.C.; Chojnowski, G.; Waterhouse, N.J. Measuring the DNA content of cells in apoptosis and at different cell-cycle stages by propidium iodide staining and flow cytometry. Cold Spring Harb. Protoc. 2016, 2016, 10. [Google Scholar] [CrossRef] [PubMed]
- Patin, F.; Baranek, T.; Vourc’h, P.; Nadal-Desbarats, L.; Goossens, J.F.; Marouillat, S.; Dessein, A.F.; Descat, A.; Hounoum, B.M.; Bruno, C.; et al. Combined metabolomics and transcriptomics approaches to assess the IL-6 blockade as a therapeutic of ALS: Deleterious alteration of lipid metabolism. Neurother. J. Am. Soc. Exp. NeuroTher. 2016, 13, 905–917. [Google Scholar] [CrossRef]
- Eskelinen, M.H.; Kivipelto, M. Caffeine as a protective factor in dementia and alzheimer’s disease. J. Alzheimers Dis. JAD 2010, 20, S167–S174. [Google Scholar] [CrossRef]
- Xia, J.; Wishart, D.S. Using metaboanalyst 3.0 for comprehensive metabolomics data analysis. Curr. Protoc. Bioinform. 2016, 55, 14.10.1–14.10.91. [Google Scholar] [CrossRef]
- Madji Hounoum, B.; Blasco, H.; Coque, E.; Vourc’h, P.; Emond, P.; Corcia, P.; Andres, C.R.; Raoul, C.; Mavel, S. The metabolic disturbances of motoneurons exposed to glutamate. Mol. Neurobiol. 2018, 55, 7669–7676. [Google Scholar] [CrossRef]
- Ganini, D.; Leinisch, F.; Kumar, A.; Jiang, J.; Tokar, E.J.; Malone, C.C.; Petrovich, R.M.; Mason, R.P. Fluorescent proteins such as eGFP lead to catalytic oxidative stress in cells. Redox Biol. 2017, 12, 462–468. [Google Scholar] [CrossRef] [PubMed]
- Ansari, A.M.; Ahmed, A.K.; Matsangos, A.E.; Lay, F.; Born, L.J.; Marti, G.; Harmon, J.W.; Sun, Z. Cellular GFP toxicity and immunogenicity: Potential confounders in In Vivo cell tracking experiments. Stem Cell. Rev. Rep. 2016, 12, 553–559. [Google Scholar] [CrossRef] [PubMed]
- Swarup, V.; Phaneuf, D.; Dupre, N.; Petri, S.; Strong, M.; Kriz, J.; Julien, J.P. Deregulation of TDP-43 in amyotrophic lateral sclerosis triggers nuclear factor kappaB-mediated pathogenic pathways. J. Exp. Med. 2011, 208, 2429–2447. [Google Scholar] [CrossRef] [PubMed]
- Leibiger, C.; Deisel, J.; Aufschnaiter, A.; Ambros, S.; Tereshchenko, M.; Verheijen, B.M.; Buttner, S.; Braun, R.J. TDP-43 controls lysosomal pathways thereby determining its own clearance and cytotoxicity. Hum. Mol. Genet. 2018, 27, 1593–1607. [Google Scholar] [CrossRef] [PubMed]
- Budini, M.; Buratti, E.; Morselli, E.; Criollo, A. Autophagy and its impact on neurodegenerative diseases: New roles for TDP-43 and C9orf72. Front. Mol. Neurosci. 2017, 10, 170. [Google Scholar] [CrossRef]
- Cascella, R.; Fani, G.; Capitini, C.; Rusmini, P.; Poletti, A.; Cecchi, C.; Chiti, F. Quantitative assessment of the degradation of aggregated TDP-43 mediated by the ubiquitin proteasome system and macroautophagy. FASEB J. 2017, 31, 5609–5624. [Google Scholar] [CrossRef]
- Huang, C.C.; Bose, J.K.; Majumder, P.; Lee, K.H.; Huang, J.T.; Huang, J.K.; Shen, C.K. Metabolism and mis-metabolism of the neuropathological signature protein TDP-43. J. Cell Sci. 2014, 127, 3024–3038. [Google Scholar] [CrossRef]
- Li, Q.; Yokoshi, M.; Okada, H.; Kawahara, Y. The cleavage pattern of TDP-43 determines its rate of clearance and cytotoxicity. Nat. Commun. 2015, 6, 6183. [Google Scholar] [CrossRef]
- Yamashita, M.; Nonaka, T.; Hirai, S.; Miwa, A.; Okado, H.; Arai, T.; Hosokawa, M.; Akiyama, H.; Hasegawa, M. Distinct pathways leading to TDP-43-induced cellular dysfunctions. Hum. Mol. Genet. 2014, 23, 4345–4356. [Google Scholar] [CrossRef]
- Kim, E.K.; Choi, E.J. Compromised MAPK signaling in human diseases: An update. Arch. Toxicol. 2015, 89, 867–882. [Google Scholar] [CrossRef]
- Tortarolo, M.; Veglianese, P.; Calvaresi, N.; Botturi, A.; Rossi, C.; Giorgini, A.; Migheli, A.; Bendotti, C. Persistent activation of p38 mitogen-activated protein kinase in a mouse model of familial amyotrophic lateral sclerosis correlates with disease progression. Mol. Cell. Neurosci. 2003, 23, 180–192. [Google Scholar] [CrossRef]
- Wengenack, T.M.; Holasek, S.S.; Montano, C.M.; Gregor, D.; Curran, G.L.; Poduslo, J.F. Activation of programmed cell death markers in ventral horn motor neurons during early presymptomatic stages of amyotrophic lateral sclerosis in a transgenic mouse model. Brain Res. 2004, 1027, 73–86. [Google Scholar] [CrossRef] [PubMed]
- Wang, P.; Deng, J.; Dong, J.; Liu, J.; Bigio, E.H.; Mesulam, M.; Wang, T.; Sun, L.; Wang, L.; Lee, A.Y.; et al. TDP-43 induces mitochondrial damage and activates the mitochondrial unfolded protein response. PLoS Genet. 2019, 15, e1007947. [Google Scholar] [CrossRef] [PubMed]
- Gautam, M.; Jara, J.H.; Kocak, N.; Rylaarsdam, L.E.; Kim, K.D.; Bigio, E.H.; Hande Ozdinler, P. Mitochondria, ER, and nuclear membrane defects reveal early mechanisms for upper motor neuron vulnerability with respect to TDP-43 pathology. Acta Neuropathol. 2019, 137, 47–69. [Google Scholar] [CrossRef]
- Davis, S.A.; Itaman, S.; Khalid-Janney, C.M.; Sherard, J.A.; Dowell, J.A.; Cairns, N.J.; Gitcho, M.A. TDP-43 interacts with mitochondrial proteins critical for mitophagy and mitochondrial dynamics. Neurosci. Lett. 2018, 678, 8–15. [Google Scholar] [CrossRef]
- Salvatori, I.; Ferri, A.; Scaricamazza, S.; Giovannelli, I.; Serrano, A.; Rossi, S.; D’Ambrosi, N.; Cozzolino, M.; Giulio, A.D.; Moreno, S.; et al. Differential toxicity of TAR DNA-Binding protein 43 isoforms depends on their submitochondrial localization in neuronal cells. J. Neurochem. 2018, 146, 585–597. [Google Scholar] [CrossRef]
- Meyerowitz, J.; Parker, S.J.; Vella, L.J.; Ng, D.; Price, K.A.; Liddell, J.R.; Caragounis, A.; Li, Q.X.; Masters, C.L.; Nonaka, T.; et al. C-Jun N-terminal kinase controls TDP-43 accumulation in stress granules induced by oxidative stress. Mol. Neurodegener. 2011, 6, 57. [Google Scholar] [CrossRef]
- Iguchi, Y.; Katsuno, M.; Takagi, S.; Ishigaki, S.; Niwa, J.; Hasegawa, M.; Tanaka, F.; Sobue, G. Oxidative stress induced by glutathione depletion reproduces pathological modifications of TDP-43 linked to TDP-43 proteinopathies. Neurobiol. Dis. 2012, 45, 862–870. [Google Scholar] [CrossRef]
- Ayala, V.; Granado-Serrano, A.B.; Cacabelos, D.; Naudi, A.; Ilieva, E.V.; Boada, J.; Caraballo-Miralles, V.; Llado, J.; Ferrer, I.; Pamplona, R.; et al. Cell stress induces TDP-43 pathological changes associated with ERK1/2 dysfunction: Implications in ALS. Acta Neuropathol. 2011, 122, 259–270. [Google Scholar] [CrossRef]
- Dewey, C.M.; Cenik, B.; Sephton, C.F.; Dries, D.R.; Mayer, P., III; Good, S.K.; Johnson, B.A.; Herz, J.; Yu, G. TDP-43 is directed to stress granules by sorbitol, a novel physiological osmotic and oxidative stressor. Mol. Cell. Biol. 2011, 31, 1098–1108. [Google Scholar] [CrossRef]
- D’Amico, E.; Factor-Litvak, P.; Santella, R.M.; Mitsumoto, H. Clinical perspective on oxidative stress in sporadic amyotrophic lateral sclerosis. Free Radic. Biol. Med. 2013, 65, 509–527. [Google Scholar] [CrossRef] [PubMed]
- Liu, Y.J.; Lee, L.M.; Lai, H.L.; Chern, Y. Aberrant activation of AMP-activated protein kinase contributes to the abnormal distribution of HuR in amyotrophic lateral sclerosis. FEBS Lett. 2015, 589, 432–439. [Google Scholar] [CrossRef] [PubMed]
- Lanznaster, D.; de Assis, D.R.; Corcia, P.; Pradat, P.F.; Blasco, H. Metabolomics Biomarkers: A Strategy Toward Therapeutics Improvement in ALS. Front. Neurol. 2018, 9, 1126. [Google Scholar] [CrossRef] [PubMed]
- Wong, M.; Martin, L.J. Skeletal muscle-restricted expression of human SOD1 causes motor neuron degeneration in transgenic mice. Hum. Mol. Genet. 2010, 19, 2284–2302. [Google Scholar] [CrossRef] [PubMed]
- Yang, S.; Zhang, K.Y.; Kariawasam, R.; Bax, M.; Fifita, J.A.; Ooi, L.; Yerbury, J.J.; Nicholson, G.A.; Blair, I.P. Evaluation of skin fibroblasts from amyotrophic lateral sclerosis patients for the rapid study of pathological features. Neurotox. Res. 2015, 28, 138–146. [Google Scholar] [CrossRef] [PubMed]
- Arima, H.; Omura, T.; Hayasaka, T.; Masaki, N.; Hanada, M.; Xu, D.; Banno, T.; Kobayashi, K.; Takeuchi, H.; Kadomatsu, K.; et al. Reductions of docosahexaenoic acid-containing phosphatidylcholine levels in the anterior horn of an ALS mouse model. Neuroscience 2015, 297, 127–136. [Google Scholar] [CrossRef] [PubMed]
- Yu, Q.; Zhong, C. Membrane Aging as the real culprit of alzheimer’s disease: Modification of a hypothesis. Neurosci. Bull. 2018, 34, 369–381. [Google Scholar] [CrossRef]
- Nagase, M.; Yamamoto, Y.; Miyazaki, Y.; Yoshino, H. Increased oxidative stress in patients with amyotrophic lateral sclerosis and the effect of edaravone administration. Redox Rep. Commun. Free Radic. Res. 2016, 21, 104–112. [Google Scholar] [CrossRef]


© 2019 by the authors. Licensee MDPI, Basel, Switzerland. This article is an open access article distributed under the terms and conditions of the Creative Commons Attribution (CC BY) license (http://creativecommons.org/licenses/by/4.0/).
Share and Cite
Lanznaster, D.; Bourgeais, J.; Bruno, C.; Hergesheimer, R.C.; Thepault, R.-A.; Vourc’h, P.; Corcia, P.; Andres, C.R.; Herault, O.; Blasco, H. TDP-43-Mediated Toxicity in HEK293T Cells: A Fast and Reproducible Protocol To Be Employed in the Search of New Therapeutic Options against Amyotrophic Lateral Sclerosis. Cells 2020, 9, 68. https://doi.org/10.3390/cells9010068
Lanznaster D, Bourgeais J, Bruno C, Hergesheimer RC, Thepault R-A, Vourc’h P, Corcia P, Andres CR, Herault O, Blasco H. TDP-43-Mediated Toxicity in HEK293T Cells: A Fast and Reproducible Protocol To Be Employed in the Search of New Therapeutic Options against Amyotrophic Lateral Sclerosis. Cells. 2020; 9(1):68. https://doi.org/10.3390/cells9010068
Chicago/Turabian StyleLanznaster, Débora, Jérôme Bourgeais, Clement Bruno, Rudolf C. Hergesheimer, Rose-Anne Thepault, Patrick Vourc’h, Philippe Corcia, Christian R. Andres, Olivier Herault, and Hélène Blasco. 2020. "TDP-43-Mediated Toxicity in HEK293T Cells: A Fast and Reproducible Protocol To Be Employed in the Search of New Therapeutic Options against Amyotrophic Lateral Sclerosis" Cells 9, no. 1: 68. https://doi.org/10.3390/cells9010068
APA StyleLanznaster, D., Bourgeais, J., Bruno, C., Hergesheimer, R. C., Thepault, R.-A., Vourc’h, P., Corcia, P., Andres, C. R., Herault, O., & Blasco, H. (2020). TDP-43-Mediated Toxicity in HEK293T Cells: A Fast and Reproducible Protocol To Be Employed in the Search of New Therapeutic Options against Amyotrophic Lateral Sclerosis. Cells, 9(1), 68. https://doi.org/10.3390/cells9010068