Article

Understanding Calcium-Dependent Conformational Changes in S100A1 Protein: A Combination of Molecular Dynamics and Gene Expression Study in Skeletal Muscle

1
Department of Bioengineering, University of Information Science and Technology, St. Paul The Apostle, Ohrid-6000, North Macedonia
2
Department of Medical Biotechnology, Yeungnam University, Gyeongsan 38541, Korea
3
Department of Obstetrics and Gynaecology, Vardhman Mahavir Medical College and Safdarjang Hospital, New Delhi-110029, India
*
Authors to whom correspondence should be addressed.
These authors contributed equally to this work.
Cells 2020, 9(1), 181; https://doi.org/10.3390/cells9010181
Submission received: 25 December 2019 / Revised: 8 January 2020 / Accepted: 8 January 2020 / Published: 10 January 2020
(This article belongs to the Special Issue Bioinformatics and Computational Biology 2019)

Abstract

:
The S100A1 protein, involved in various physiological activities through the binding of calcium ions (Ca2+), participates in several protein-protein interaction (PPI) events after Ca2+-dependent activation. The present work investigates Ca2+-dependent conformational changes in the helix-EF hand-helix using the molecular dynamics (MD) simulation approach that facilitates the understanding of Ca2+-dependent structural and dynamic distinctions between the apo and holo forms of the protein. Furthermore, the process of ion binding by inserting Ca2+ into the bulk of the apo structure was simulated by molecular dynamics. Expectations of the simulation were demonstrated using cluster analysis and a variety of structural metrics, such as interhelical angle estimation, solvent accessible surface area, hydrogen bond analysis, and contact analysis. Ca2+ triggered a rise in the interhelical angles of S100A1 on the binding site and solvent accessible surface area. Significant configurational regulations were observed in the holo protein. The findings would contribute to understanding the molecular basis of the association of Ca2+ with the S100A1 protein, which may be an appropriate study to understand the Ca2+-mediated conformational changes in the protein target. In addition, we investigated the expression profile of S100A1 in myoblast differentiation and muscle regeneration. These data showed that S100A1 is expressed in skeletal muscles. However, the expression decreases with time during the process of myoblast differentiation.

1. Introduction

S100 proteins belong to the calcium ion (Ca2+)-binding proteins family engaged in Ca2+ regulation in various tissues and organs. Many of the S100 proteins are significantly expressed in the cardiac tissue, and has been correlated with heart failure. S100A1 is adequately expressed in the cardiac muscles, skeletal muscle fibers, and brain [1]. S100A1 is especially found in the heart and in lower concentrations in the skeletal muscles in both animals and humans [2]. S100A1 expression increases progressively during cardiac development in mice and grasps a plateau in the postnatal state in the ventricular myocardium [3]. S100A1 controls cardiac Ca2+ cycling, both the release and reuptake, and it is also essential for cardiac muscle contractility and in the regulation of mitochondrial metabolism [2,4]. Importantly, the S100A1 protein is expressively downregulated in human end-stage heart failure, interpreting S100A1 and role of Ca2+ appropriate targets for cardiac gene therapy [5,6].
The S100A1 protein typically functions as a homodimer where each monomer contains two EFsite Ca2+-binding motifs and each motif has the capacity to bind a single Ca2+ [7]. Thus, the monomer contributes two EF site domains, which play a characteristic role in Ca2+ binding [7,8]. The first EF site comprises 14 residues and the second site comprises 12 residues [9,10]. The S100A1 subunit loaded with two Ca2+ causes a conformational change from an initial to a final state characterized by the exposure of hydrophobic residues between the H3 and H4 domains [11,12]. The opening of H3 and H4 domains describes hydrophobic patches and, consequently, promotes PPI [13], similar to that observed with the calmodulin protein (Figure 1) [14,15,16,17,18].
This study involves molecular dynamics (MD) simulations of S100A1 for examining the characteristics of the apo and holo states. The study also focuses on the entry of free Ca2+ into the bulk of the apo state to observe conformational changes in forming the holo state. In addition, Ca2+- binding residues were also considered to examine the binding event and formation of new bonds through water. The results support prior molecular simulation and experimental studies [12,19], which suggests that EF site saturation with Ca2+ is required for stabilization of the unlocked state. In this study, unbiased MD simulations were performed for each level of complexity to understand the novel behavior of Ca2+ bound to the S100A1 protein.
In previous studies, our group and other researchers have explored the importance of Ca2+ signaling and that of the associated proteins in skeletal muscle functions [20,21,22]. The contractile properties of skeletal muscles are largely reliant on the protein expression involved in the signaling of Ca2+ as this is one of the main signaling and regulatory molecules of myofibers [20]. The multinucleated cells that are the fundamental units of skeletal muscles formed during the differentiation process through the fusion of myoblast cells [21,23].
The damaged skeletal muscles exhibit an extraordinary ability for repair. New muscle fibers are regenerated immediately after injury using complex physiological processes [24]. To explore the function of S100A in muscle regeneration, cardiotoxine (CTX), which is generally used to induce muscle injury, was injected in the muscles of mice. The S100A protein expression during the muscle regeneration process was determined, and found no significant effect of this protein in muscle regeneration. Additionally, we have analyzed the S100A1 expression profile during myoblast differentiation. To explicate the function of S100A1, myoblast cells were cultured in myogenic differentiation media, and mRNA and protein expressions were analyzed at different time points in the differentiated cells.

2. Materials and Methods

2.1. System Building

The S100A1 protein was simulated using the coordinates retrieved from the Protein Data Bank for the apo and holo states (PDB ID: 2LLU and 2LP3, respectively) [25,26]. Gromacs 4.6.7 suite of the package was employed to carry out MD simulations [27] with the 53a6 parameter set of the Gromos96 force field [28]. We used improved non-bonded parameters for Ca2+, as previously recommended, i.e., C6 = 2.0e-3 KJ mol−1 nm6, C12 = 1.67e-6 KJ mol−1 nm12 [29].

2.2. Simulation Details

The simulation was executed as described previously by our group [30,31]. The protein was occupied in a dodecahedron box filled with the simple point charge (SPC216) [32] water model that extended up to at least 1.2 nm from the edge of the protein. Na+ and Cl ions were added to neutralize the system up to a concentration of 100 mM. After the solvation and neutralization steps, each system went through an energy minimization process to eliminate steric clashes between atoms. The equilibrium with the solvent started with a 200 ps-long position-controlled simulation under a relentless force of 1000 kJ mol−1nm−1 at 300 K. Then, the system proceeded for simulation without restrains for 2000 ps, which allows its final equilibrium.

2.3. Trajectory Analysis

Since the holo-S100A1 system contains 4 Ca2+, an experiment for determining the entry of free Ca2+ was set up by adding the same number of Ca2+ into the water box of the apo-S100A1 system. Ions were first added into a water solvent box and were left to travel freely. The initial position of Ca2+ in the water box was selected randomly. Subsequently, the remaining charges in the system were balanced by adding Na+ and Cl ions. All the algorithms and parameters were considered similar to the holo-S100A1 system. The approximation of conformational changes during the simulation was characterized by interhelical angle estimations, solvent accessible surface area (SASA) determination, H-bond calculations, and contact map analysis. Interhelical angles have been generally employed to compare the transitions in apo-S100A1 and holo-S100A1 proteins during simulations. The average angle values between the common residue of H3, the EF site, and the H4 region of both sides were calculated separately. Trajectories obtained (Table 1) from various simulations were further analyzed. A set of Perl programs was scripted for an approximation of contact analysis within the trajectory. For graph visualization, XMGRACE (http://plasmagate.weizmann.ac.il) was used. Visual molecular dynamics (VMD) [33] and PyMOL packages were used for visualization and system inspections.

2.4. CTX-Induced Muscle Regeneration

Muscle injury experiments, for investigating the role of S100A1 in muscle regeneration, were executed as described before [34]. In total, 100 µL of CTX (10 mM) was injected into the left gastrocnemius (GAS) muscles of C57BL/6 mice, and phosphate-buffered saline was injected into the right GAS muscles as a control. Muscle tissues were collected 7 days after the injection. All treatments were administered using the standard protocol permitted by the Institutional Animal Care and Use Committee, Yeungnam University (permit number: YUMC-AEC2015-006).

2.5. C2C12 Cell Culture

C2C12 cells (murine myoblast; Korean Cell Line Bank, Seoul, Korea) were cultured in DMEM (HyClone Laboratories, UT, USA), which added 10% FBS (fetal bovine serum) and 1% P/S (Penicillin/Streptomycin, ThermoFisher Scientific, MA, USA) in a humidified CO2 incubator at 37 °C. For differentiation experiments, cells were cultured with DMEM + 2% FBS + 1% P/S for 0, 2, 4, and 6 days.

2.6. RNA Isolation, cDNA Synthesis, and Real-Time RT-PCR

RNA was isolated with a Trizol reagent (ThermoFisher Scientific) following the manufacturer’s protocols. Two micrograms of RNA in 20 µL of the reaction mixture was used for cDNA synthesis with a random hexamer, and, consequently, reverse-transcribed at 25 °C for 10 min, 37 °C for 120 min, and 85 °C for 5 min. Two microliters cDNA and 2 µL of S100A primer (10 pmole, forward: ccatggagaccctcatcaat, reverse: ttgaagtccacttccccatc) were analyzed using a 7500 real-time PCR system. A Power SYBR Green PCR Master Mix is applied as the fluorescence source.

2.7. Western Blot

Proteins at the different time points were isolated using RIPA buffer supplemented with a cocktail of protease inhibitors. Forty microgram of proteins were electrophoresed in 12% polyacrylamide gel and then transferred to a membrane (EMS–Millipore, Billerica, MA, USA). The blot was incubated with 1% skim milk for blocking non-specific binding and then incubated overnight with S100A (1:500) or a β-actin (1:1000) antibody at 4 °C. The blot was washed and incubated with a horse radish peroxidase (HRP)-conjugated secondary antibody for 1 h at 25 °C and then developed with a Super Signal West Pico Chemiluminescent Substrate (ThermoFisher Scientific).

2.8. Immunocytochemistry

Cells obtained at the different time point were fixed with 4% formaldehyde (Sigma Aldrich, St. Louis, MO, USA) and permeabilized with 0.2% Triton X and then blocked with 1% normal goat serum (KPL, MD, USA). The cells were incubated with an S100A antibody (1:100) at 4 °C in a humid environment overnight and then the goat anti-rabbit secondary antibody (1:200; ThermoFisher Scientific) was added for 1 h at room temperature. 4′,6-diamidino-2-phenylindole (DAPI) was used to stain the nucleus (Sigma-Aldrich), and the cells were imaged using a fluorescence microscope (Nikon, Tokyo, Japan).

2.9. Immunohistochemistry

The paraffin-embedded muscle sections were deparaffinized and hydrated with xylene (Junsei, Tokyo, Japan) and ethanol (Merck), respectively. Endogenous peroxidase activity was quenched with 0.3% H2O2/methanol, and these were then incubated with 1% normal goat serum. S100A antibody (1:100) was added, which was followed by incubation at 4 °C in a humid environment overnight with subsequent incubation with a horseradish peroxidase (HRP)-conjugated secondary antibody (1:100). The signals were detected by adding HRP-conjugated streptavidin (Vector, CA, USA). Nuclei of stained sections were stained with hematoxylin, and the sections were then dehydrated, mounted, and observed using a light microscope (Leica, Wetzlar, Germany).

3. Results

Table 1 shows the details of each system and durations of all-atoms unbiased MD simulations performed in the study. Each system was repeated two more times with consistent results, and the simulations were initiated with randomly selected initial velocities.

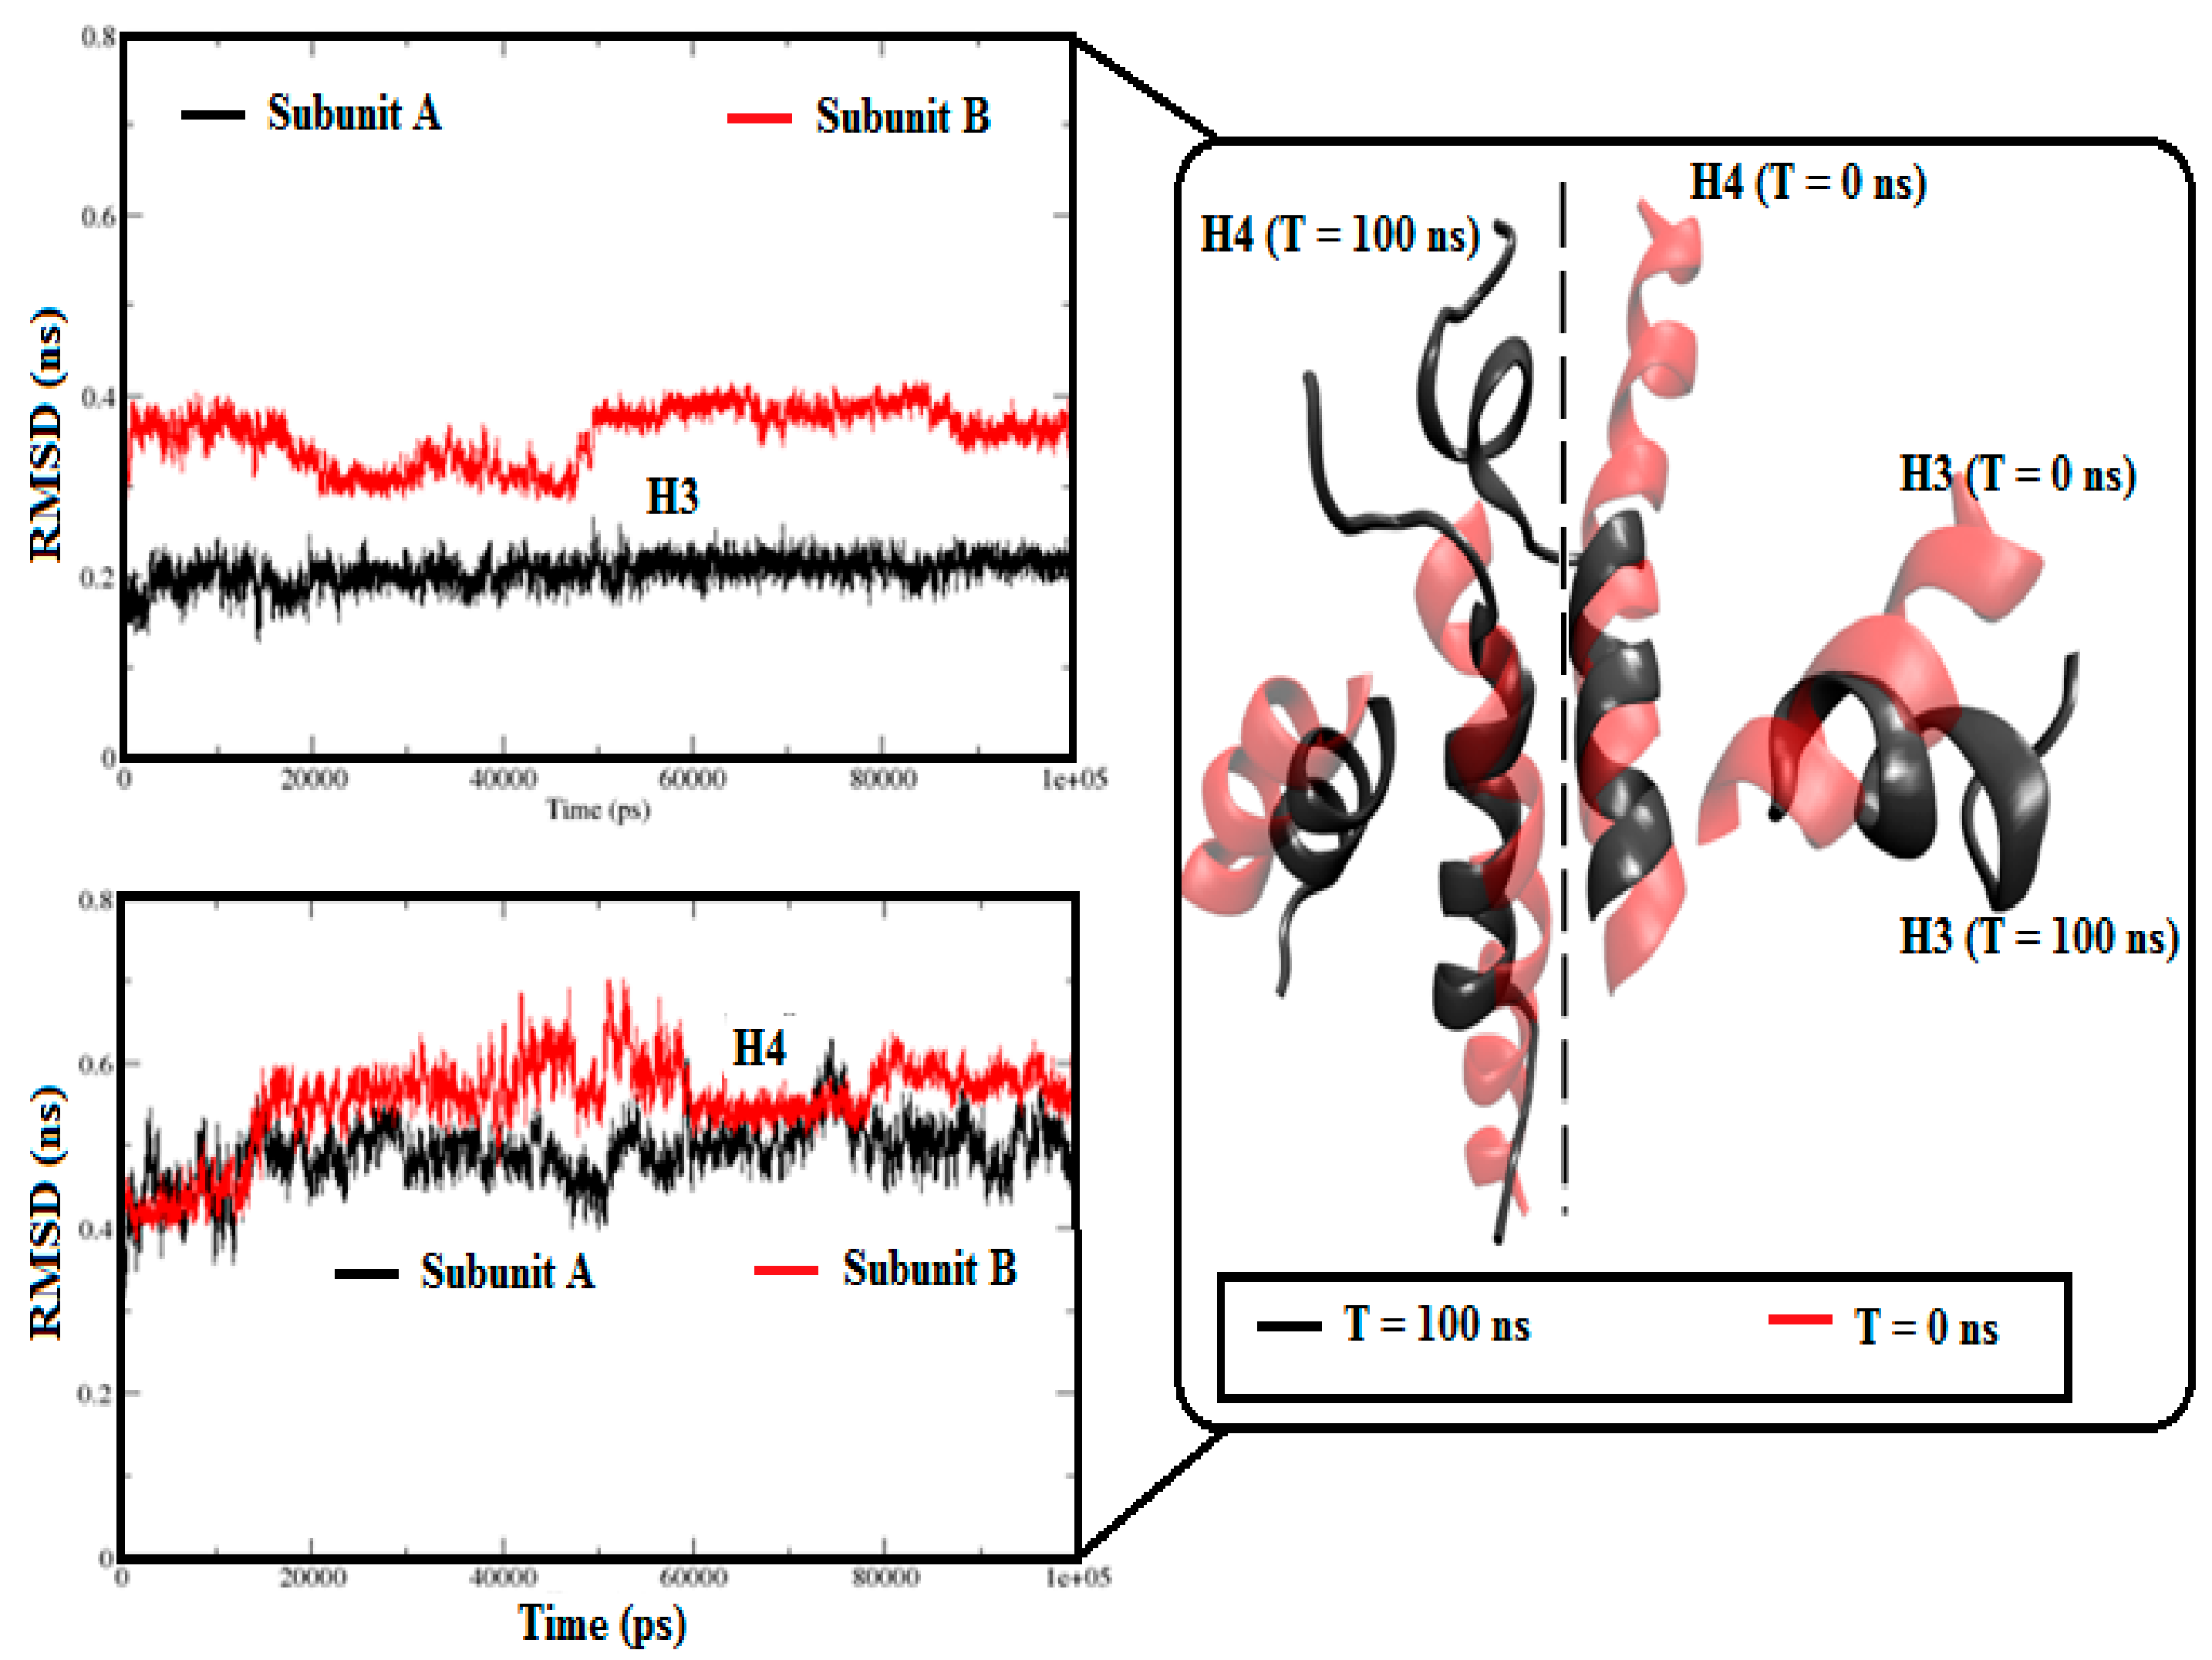
3.1. Stability Analysis of Each System

The root mean square deviation (RMSD) values of the backbone atoms (Table 1) are provided in the supporting material (supporting material S1). The RMSD values of each system increased at the beginning with respect to its native structure. In the apo-S100A1 system (black line), the values deviated from the native structure within ~5 ns of simulation and fluctuated until ~35 ns, and remained almost flat at the end of the simulation. The noted observed value on average was >0.39 nm. Yet, the initial larger RMSD values (>0.55 nm) until ~20 ns was noted in the holo-S100A1 system (red line). It was further observed that the domains of the S100A1 protein were significantly altered due to Ca2+ and that the alternations occurred significantly near the H3-EF site-H4 region. Although the holo-S100A1 system was simulated to a significant extent i.e., for 100 ns of simulation-1, the discrepancy from the initial structure within the first ~20 ns was sufficient to indicate that the S100A1 structures were substantially transformed at the H3-EF site-H4 region. In the next section, we elaborated on the RMSDs of the H3 and H4 regions independently. In the test of entry of free ions, the RMSD value (blue line) appeared to be stable and the difference of the RMSD from the native structure was noted to be ~0.1 nm. RMSD values form a plateau until the end of the simulation since ions in bulk were considered to reach the first salvation shell of protein after >10 ns simulation time. The average RMSD was noted to be ~0.22 nm in simulation-1. It shows a behavior similar to that of the holo-S100A1 system and is rooted by the effect of Ca2+.
The comparison of the root-mean-square fluctuation (RMSF), calculated for each trajectory, reveals approximately similar peak until the residue number ~40 (supporting material S2). After this, a single higher peak was found between residue numbers 40 and 60, where RMSF mean values were calculated as ~0.4 nm, which suggested a more flexible region. These noted flexibilities occurred due to conformational changes and this section was responsible mainly for H4. Nearly the same patterns of RMSF were found in two more recurrences of the simulations.
Considering little but significant RMSD variations in the holo-S100A1 system, we additionally calculated RMSDs for both sides along with the H3 and H4 domains (Figure 2). Figure 2 shows that the RMSDs of H3 and H4 in subunit A exhibited a fairly flat pattern, which revealed a reasonably stable helical domain. In contrast, the RMSDs of H3 and H4 in subunit B exhibited fairly uneven patterns and a significant departure from the native structure. The RMSD variations were due to the effect of the load of Ca2+ on the H3, EF site, and H4 topological regions. For comparison purposes, superimposition of the H3 and H4 domains of each subunit was further executed. Consequently, structural transitions were noted during the simulation. These observations revealed a conformational alteration in H3 and H4, which was more apparent in subunit B.

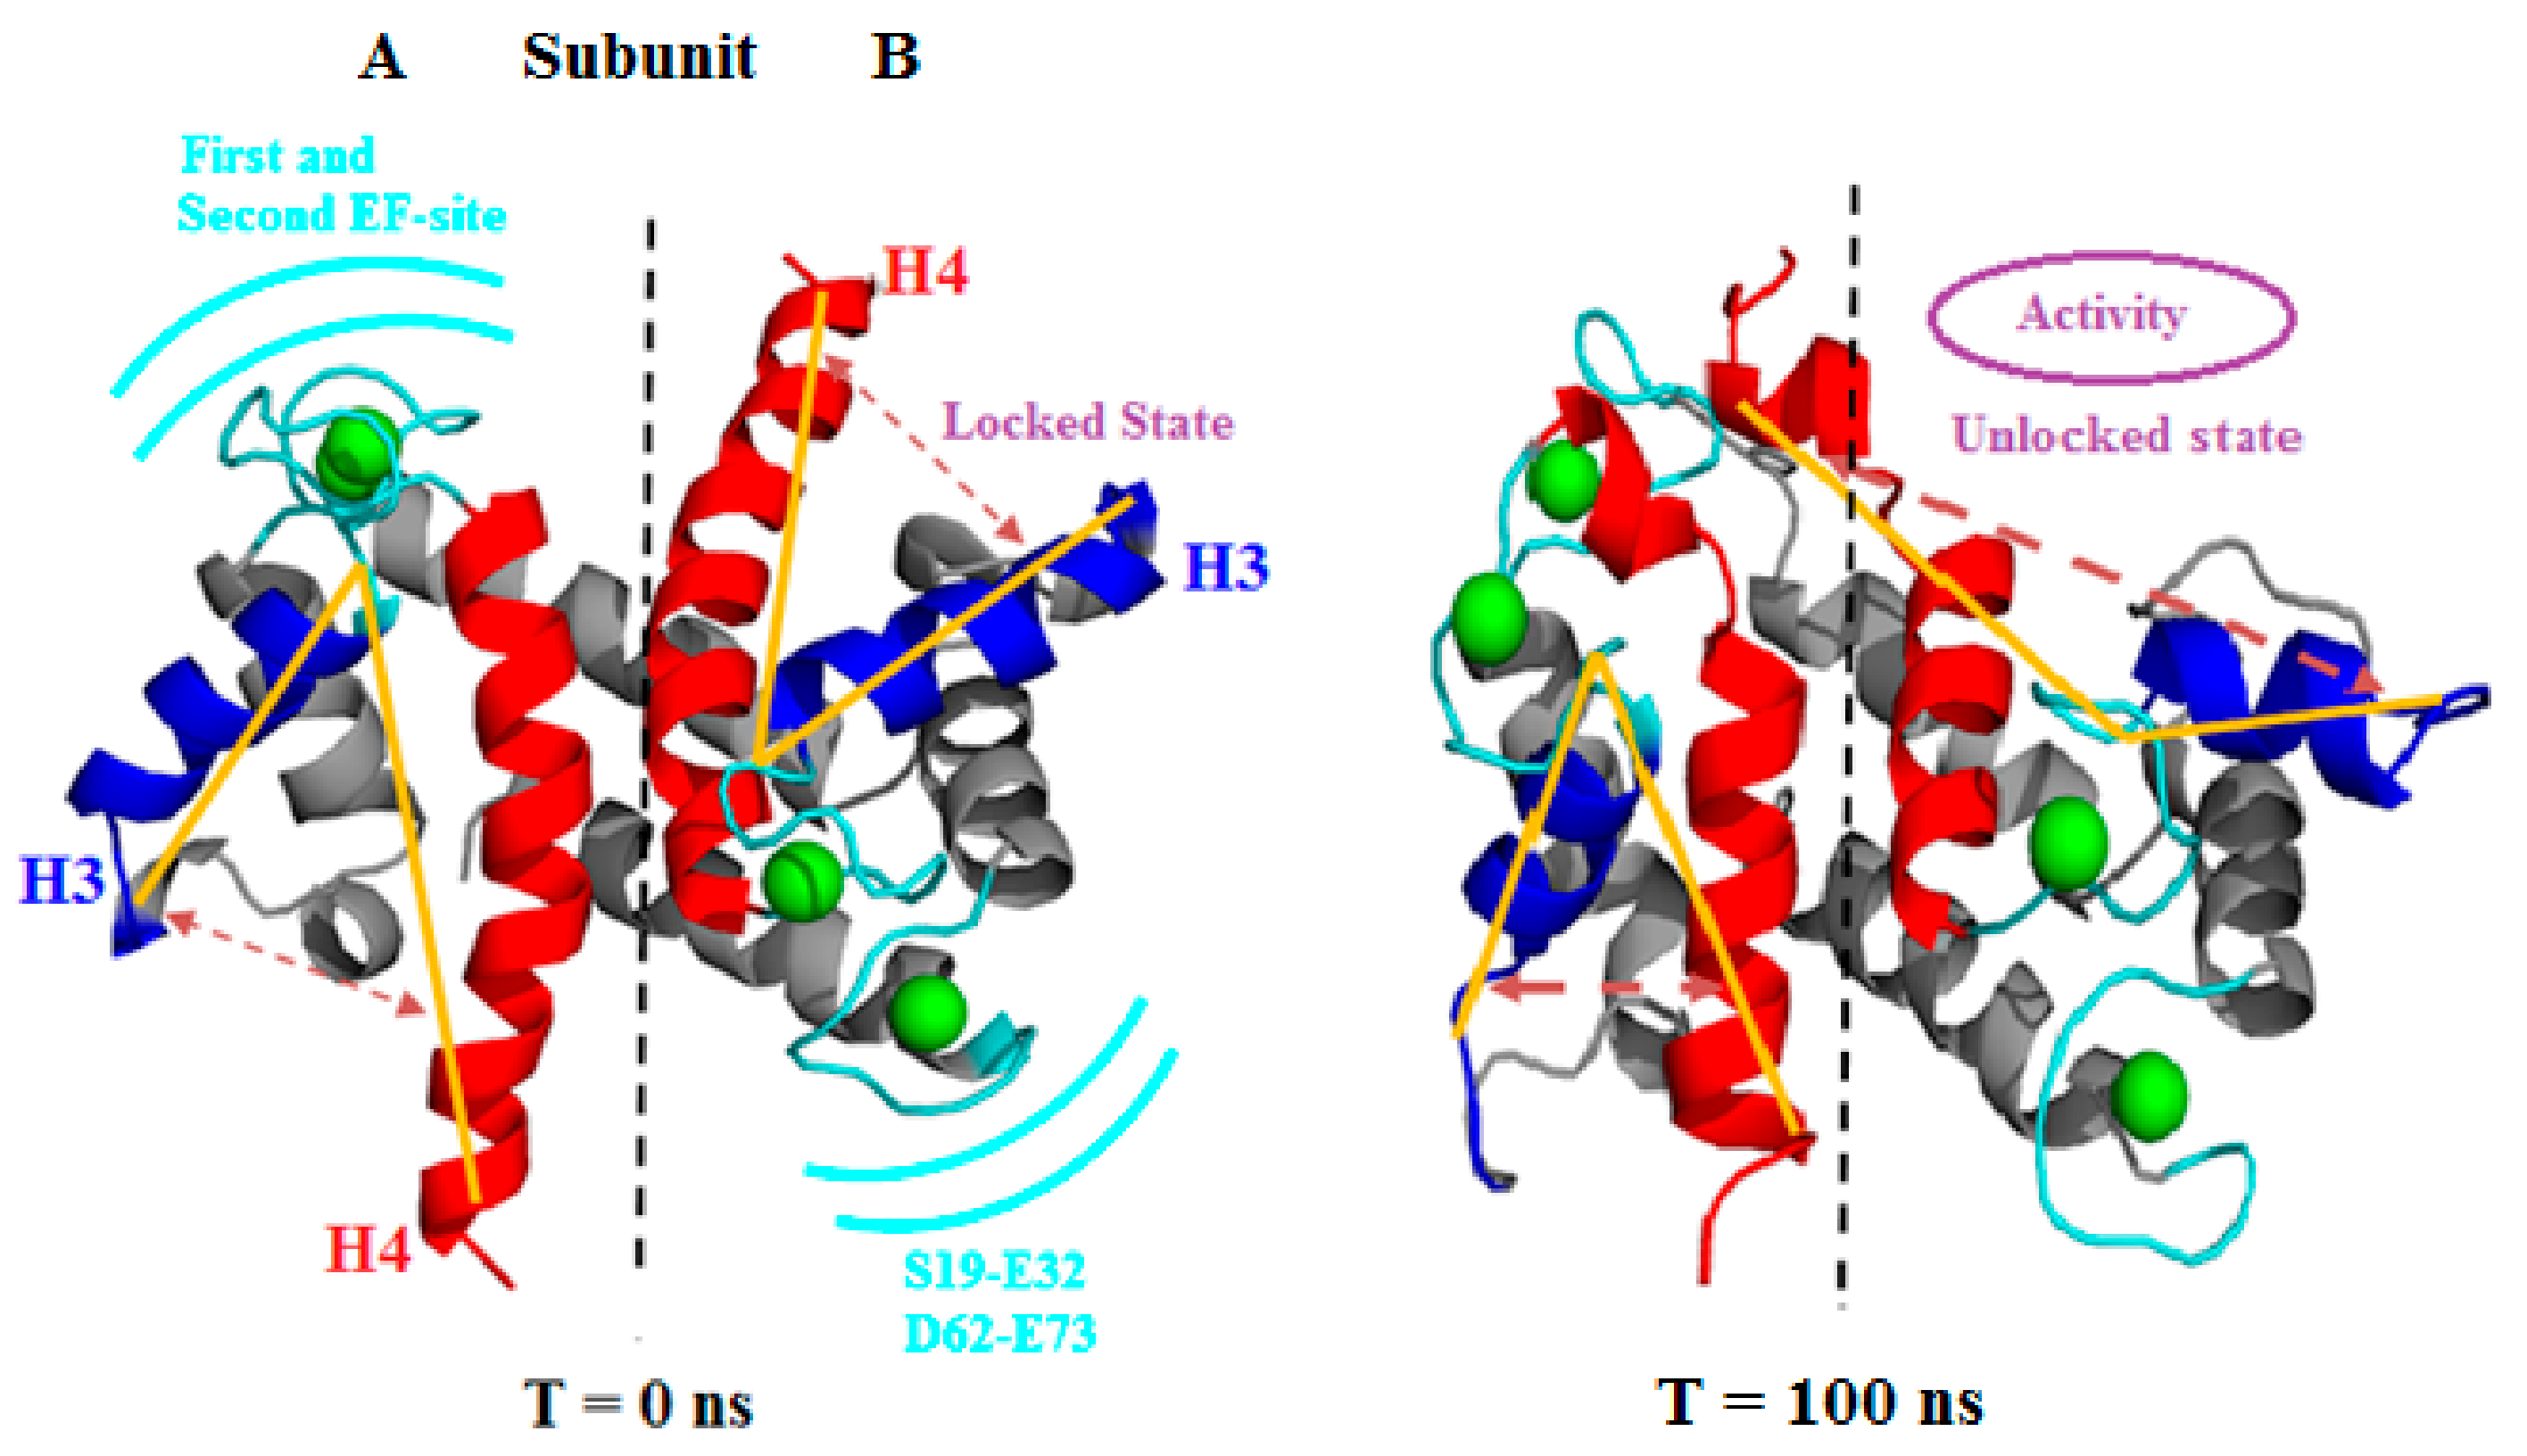
3.2. Effect of Ca2+ on the S100A1 Protein

Figure 3 shows the extensive conformational changes due to Ca2+, especially observed at the H3 site, EF site, and H4 domains of both subunits during the simulation. Eventually, both subunit transitions were originated independently.

3.2.1. Angle Estimations between Helix-Loop-Helix Domains

The angle for each subunit was calculated at 10 ns, 40 ns, and 80/100 ns time frames for the apo and holo states. We have monitored the angle at every five levels of the time frame whereas time frames of 10 ns, 40 ns, and 80/100 ns were considered during the simulation. Table 2 shows the average angle value during the simulation, and, since S100A1 protein was characterized assymmetric, Cα atom of Lys56, Glu73, and Trp90 residues that represent three points of H3, EF site, and H4 domains were considered for angle calculations. The angle value was further averaged within each time frame of subunit A in the apo-S100A1 system. It was noted to be ~67.22°. Whereas, in subunit B, a variation difference of ~10° was observed, which eventually ends with approximately the same angle value of 66.94°. In addition, we observed significant increments in the angle at each further respective time frame, found between the H3-EF site-H4 domains of the holo state, which starts opening relatively faster than the apo state. The average angle of subunit A for each time frame was calculated as 72.59° and the difference between the 10 ns and 100 ns time frame was observed to be 14.29°. In subunit B, the average angle was calculated as 84.35° and the difference between 10 ns and 100 ns was noted to be 42.73°.
Angle calculations in the apo and holo states showed a vast increment, which was in strong agreement with the findings of previous studies [25,26]. Since the interhelical angles constantly increased, the standard deviation showed little fluctuations at the later stage of simulation (after 50 ns), as compared to the initial stage.

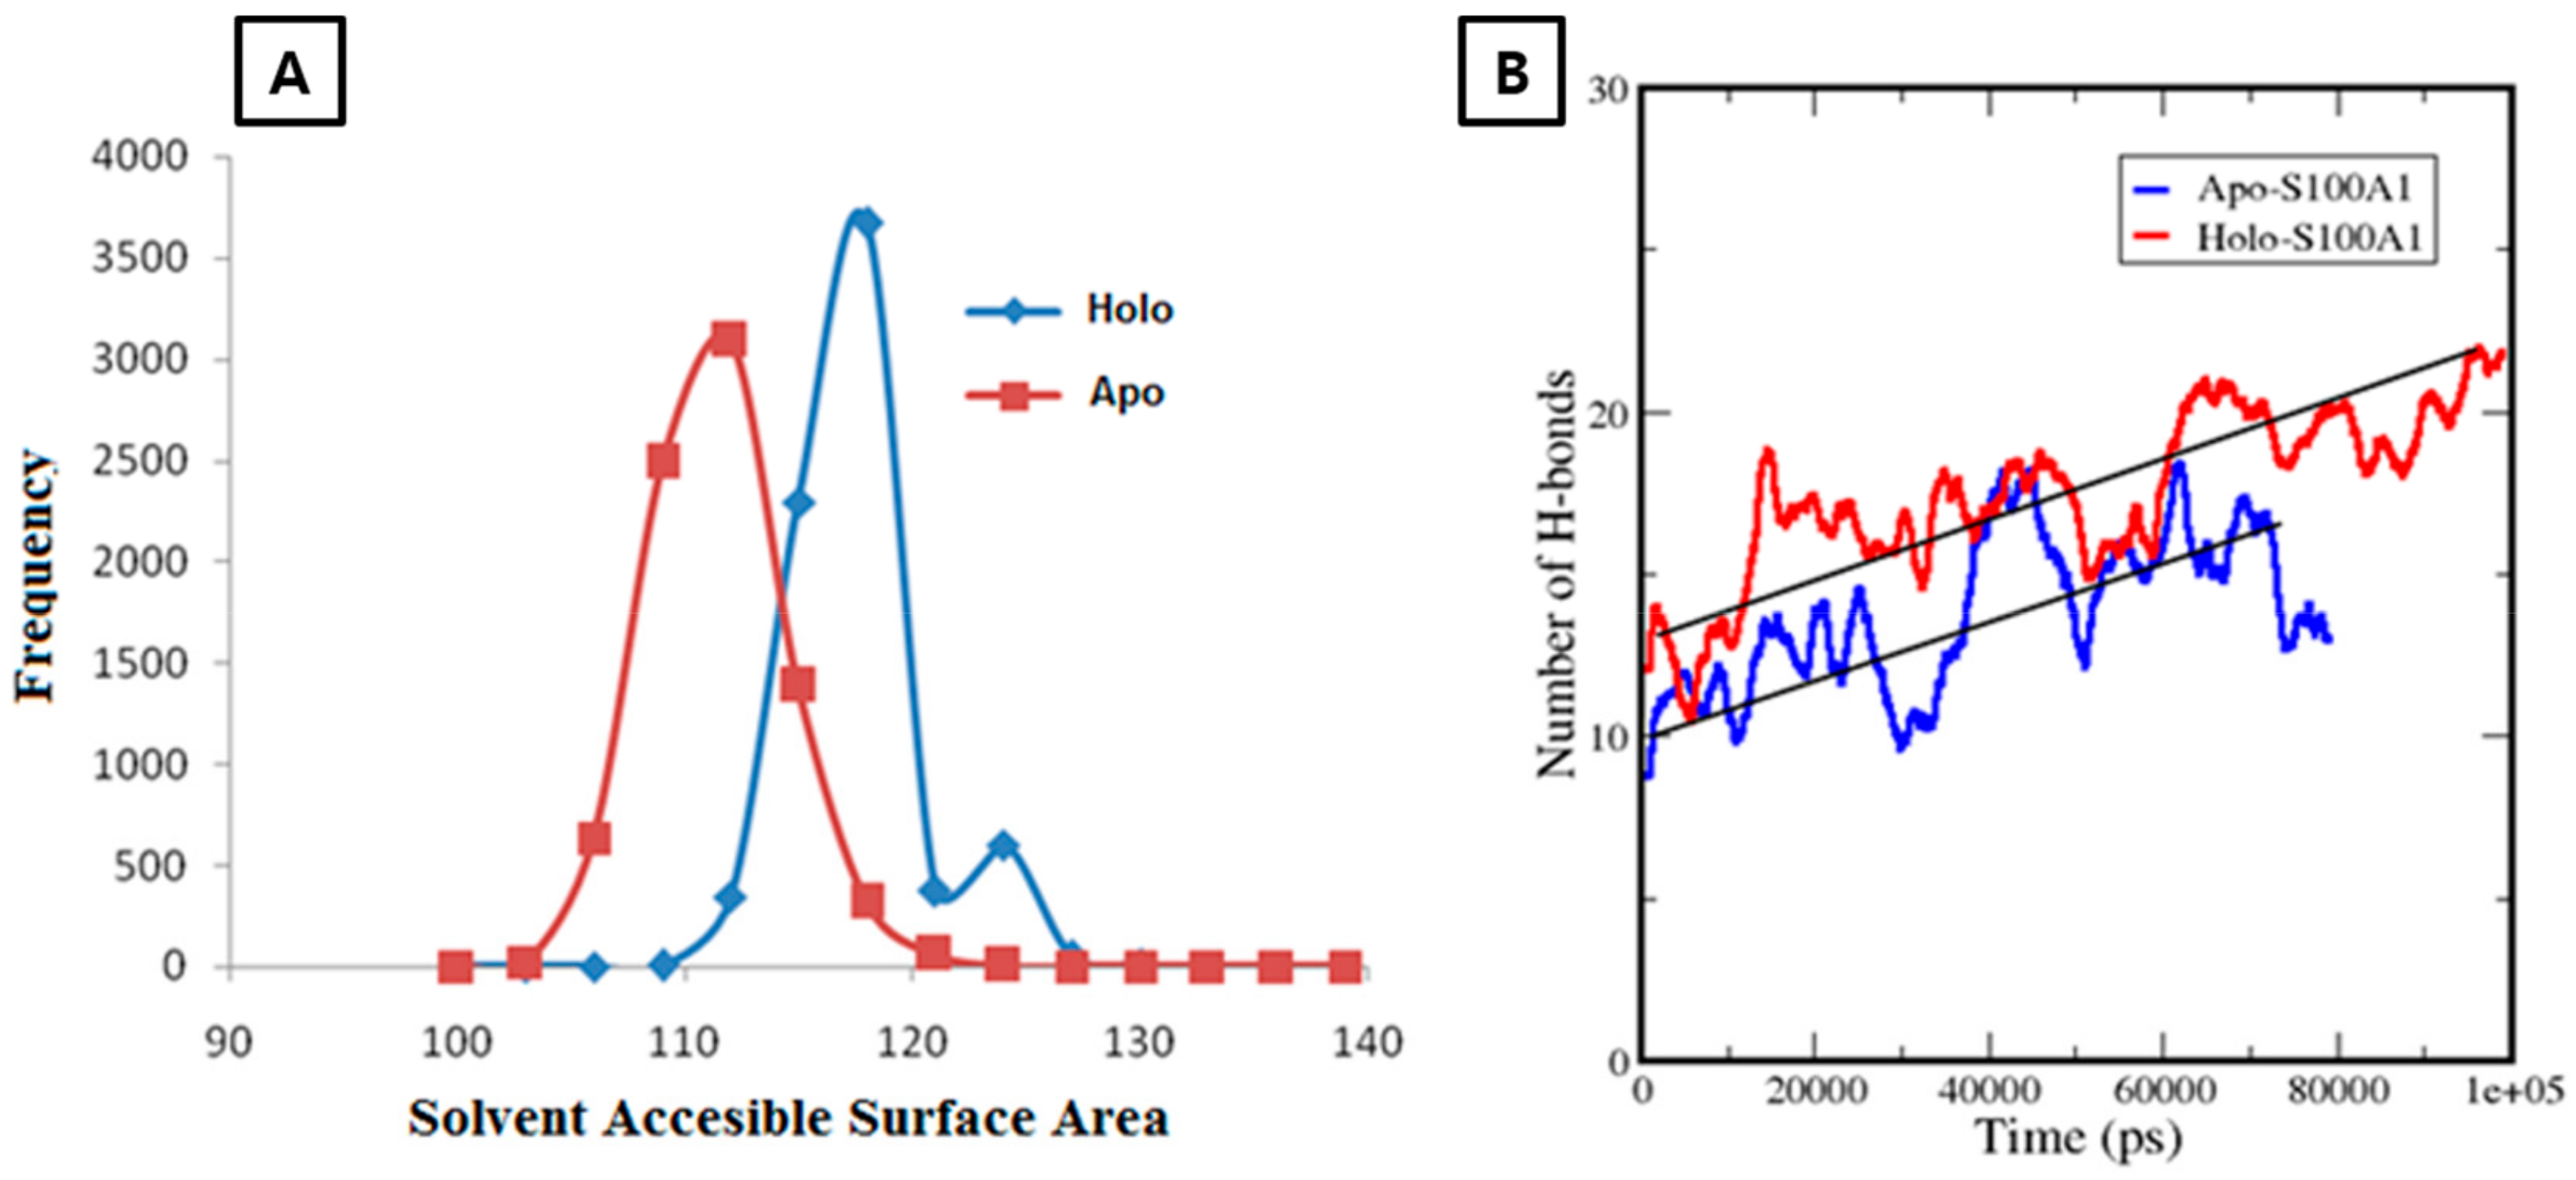
3.2.2. Calculation of a Solvent Accessible Surface Area and Hydrogen Bonds for the Apo-State and Holo-State of the Protein

To deduce the conformational changes, SASA changes at each frequency point were monitored. In the apo-S100A1 system, an increment in SASA started at a value of ~102 nm2, and later reached ~112 nm2 at a maximum frequency point of ~3250 (Figure 4). From the highest point, a considerable decrease in SASA was observed. Eventually, aggregation of frequency points was observed at the end and a frequency distribution plot showed a Gaussian distribution, which normalized the frequency at each point. Three points in SASA were observed above the 1000 frequency. In case of the holo-S100A1 system, a larger difference was found in the parallel direction, from ~110 nm2 to 128 nm2. The significant increment in areas was accounted for by the presence of Ca2+. Although differences between each point in the apo and holo system cannot be uniquely attributed, the differences are, in any case, relatively small. However, two points in SASA were observed above 1000 frequency. It was clear that the rise in surface areas is rooted because of the Ca2+ bound to the EF site.
A considerable transition in H3 and H4 was an indication that there may be a possibility to form new bonds between both subunits. This motivated the calculation of H-bonds in each trajectory. Consequently, subunit A and B were compressed toward each other and, specifically, the H4 domain of one subunit opened and effectively moved outward in the direction of the opposite subunit. To quantize this observation, we decided to take the H4 domain of each subunit as two points to calculate H-bonds. Thus, the significant mobility of H4 of each subunit was a boost and caused the formation of approximately nine H-bonds at the end of the simulation. These revealed that an extensive interaction occurred between subunit A and B through the H4 domain. These interactions were expected for a stable architecture of S100A1 as a functional protein. However, in the apo state, only about four incremental H-bonds were observed during simulation, and, as expected, no considerable conformational changes occurred (Figure 4B).

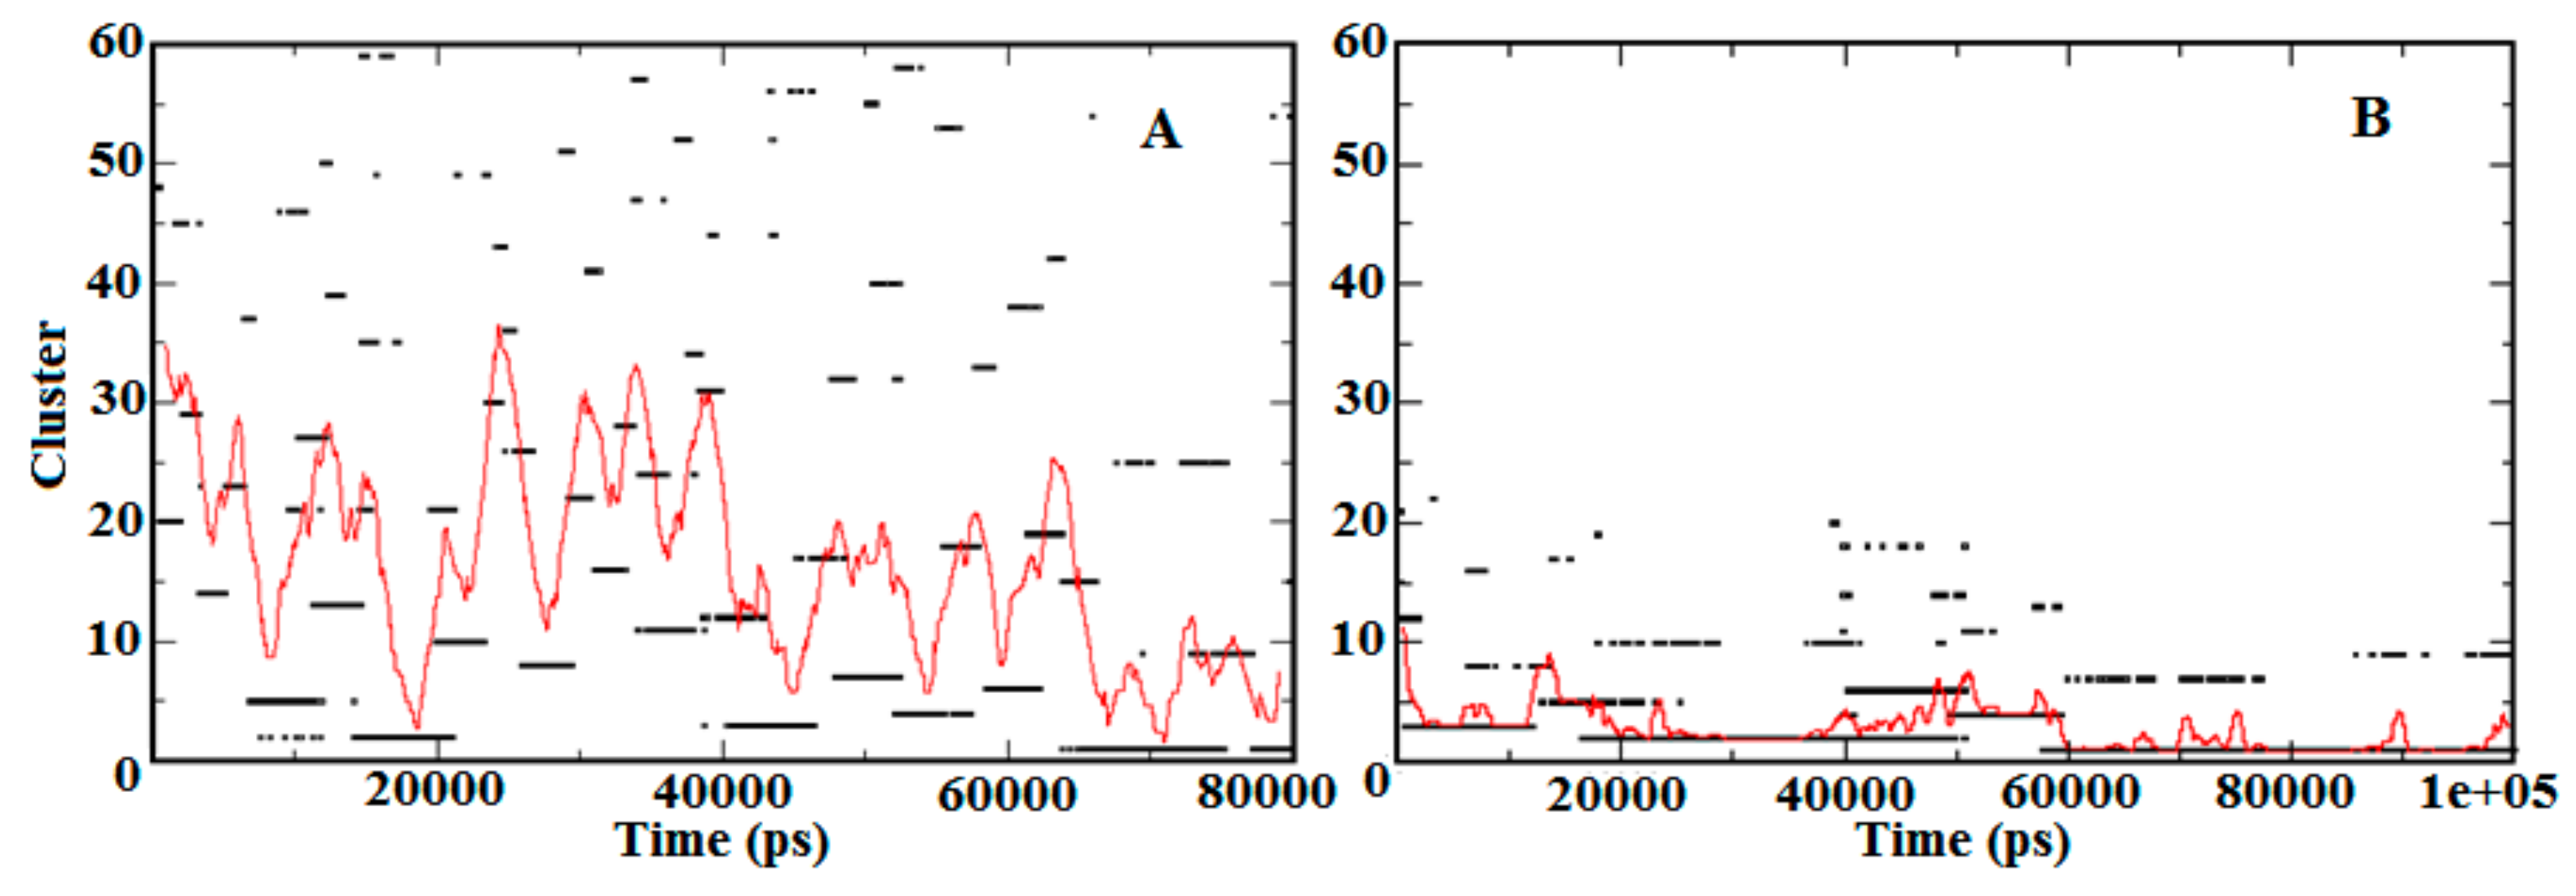
3.2.3. Temporal Distributions for Apo-State and Holo-State of the Protein

To refine the search for structural transitions that may be discriminated between the apo-S100A1 and holo-S100A1 proteins, trajectories 1 and 2 as listed in Table 1 were subjected to cluster analysis. Using a cut-off of 0.20 nm, the analysis produced about 60 clusters with sizes that were sufficient to convince statistical significance. The temporal distribution of the clusters in both states conferring to their size is shown in Figure 5. Figure 5A demonstrates the relative sizes of the clusters as calculated during simulations initiated with no Ca2+ in the subunit protein. Figure 5B presents a similar analysis for the simulations where the ion was initially located at the EF site. In the case of A, more than 60 clusters were found, which indicates less stability in the temporal distribution of the S100A1 structure. Furthermore, the distribution of clusters was somewhat noisy and the sequence of conformational changes were comparatively minor, which suggests a regular progress toward an unstable and inactive state of subunits A and B. The large dominating clusters are in rapid equilibrium with almost lesser lifetime structures. Temporal distribution shown in Figure 5B revealed the three largest clusters with a larger life span. The simulation time noted for all three representative structures was found to be from 0 ns to ~13ns, ~15 ns to ~50 ns, and ~60 ns to the end of the simulation. This less noisy and mostly rigid cluster distribution suggested stability in the representative structure of the largest cluster. Thus, the amplitude of the red trace indicates the extent to which the protein tends to sample low probability configurations. This scattering of the cluster’s popularity is a measure of fast structural transitions.
A comparative analysis between the demonstrative structures of the biggest clusters specifies that the variances between these are entirely at the EF site linking the helices H3 and H4. Examination of the average temporal distribution of the clusters (red line, Figure 5A,B) divulges that the large clusters dominate over long time stretches (10–40 ns) with brief disruptions of high probability conformations. This demonstrates that the system is in fast dynamic equilibrium toward stabilization (Figure 5B). Speciously, Ca2+ presence affects directly on the distribution function of the cluster.

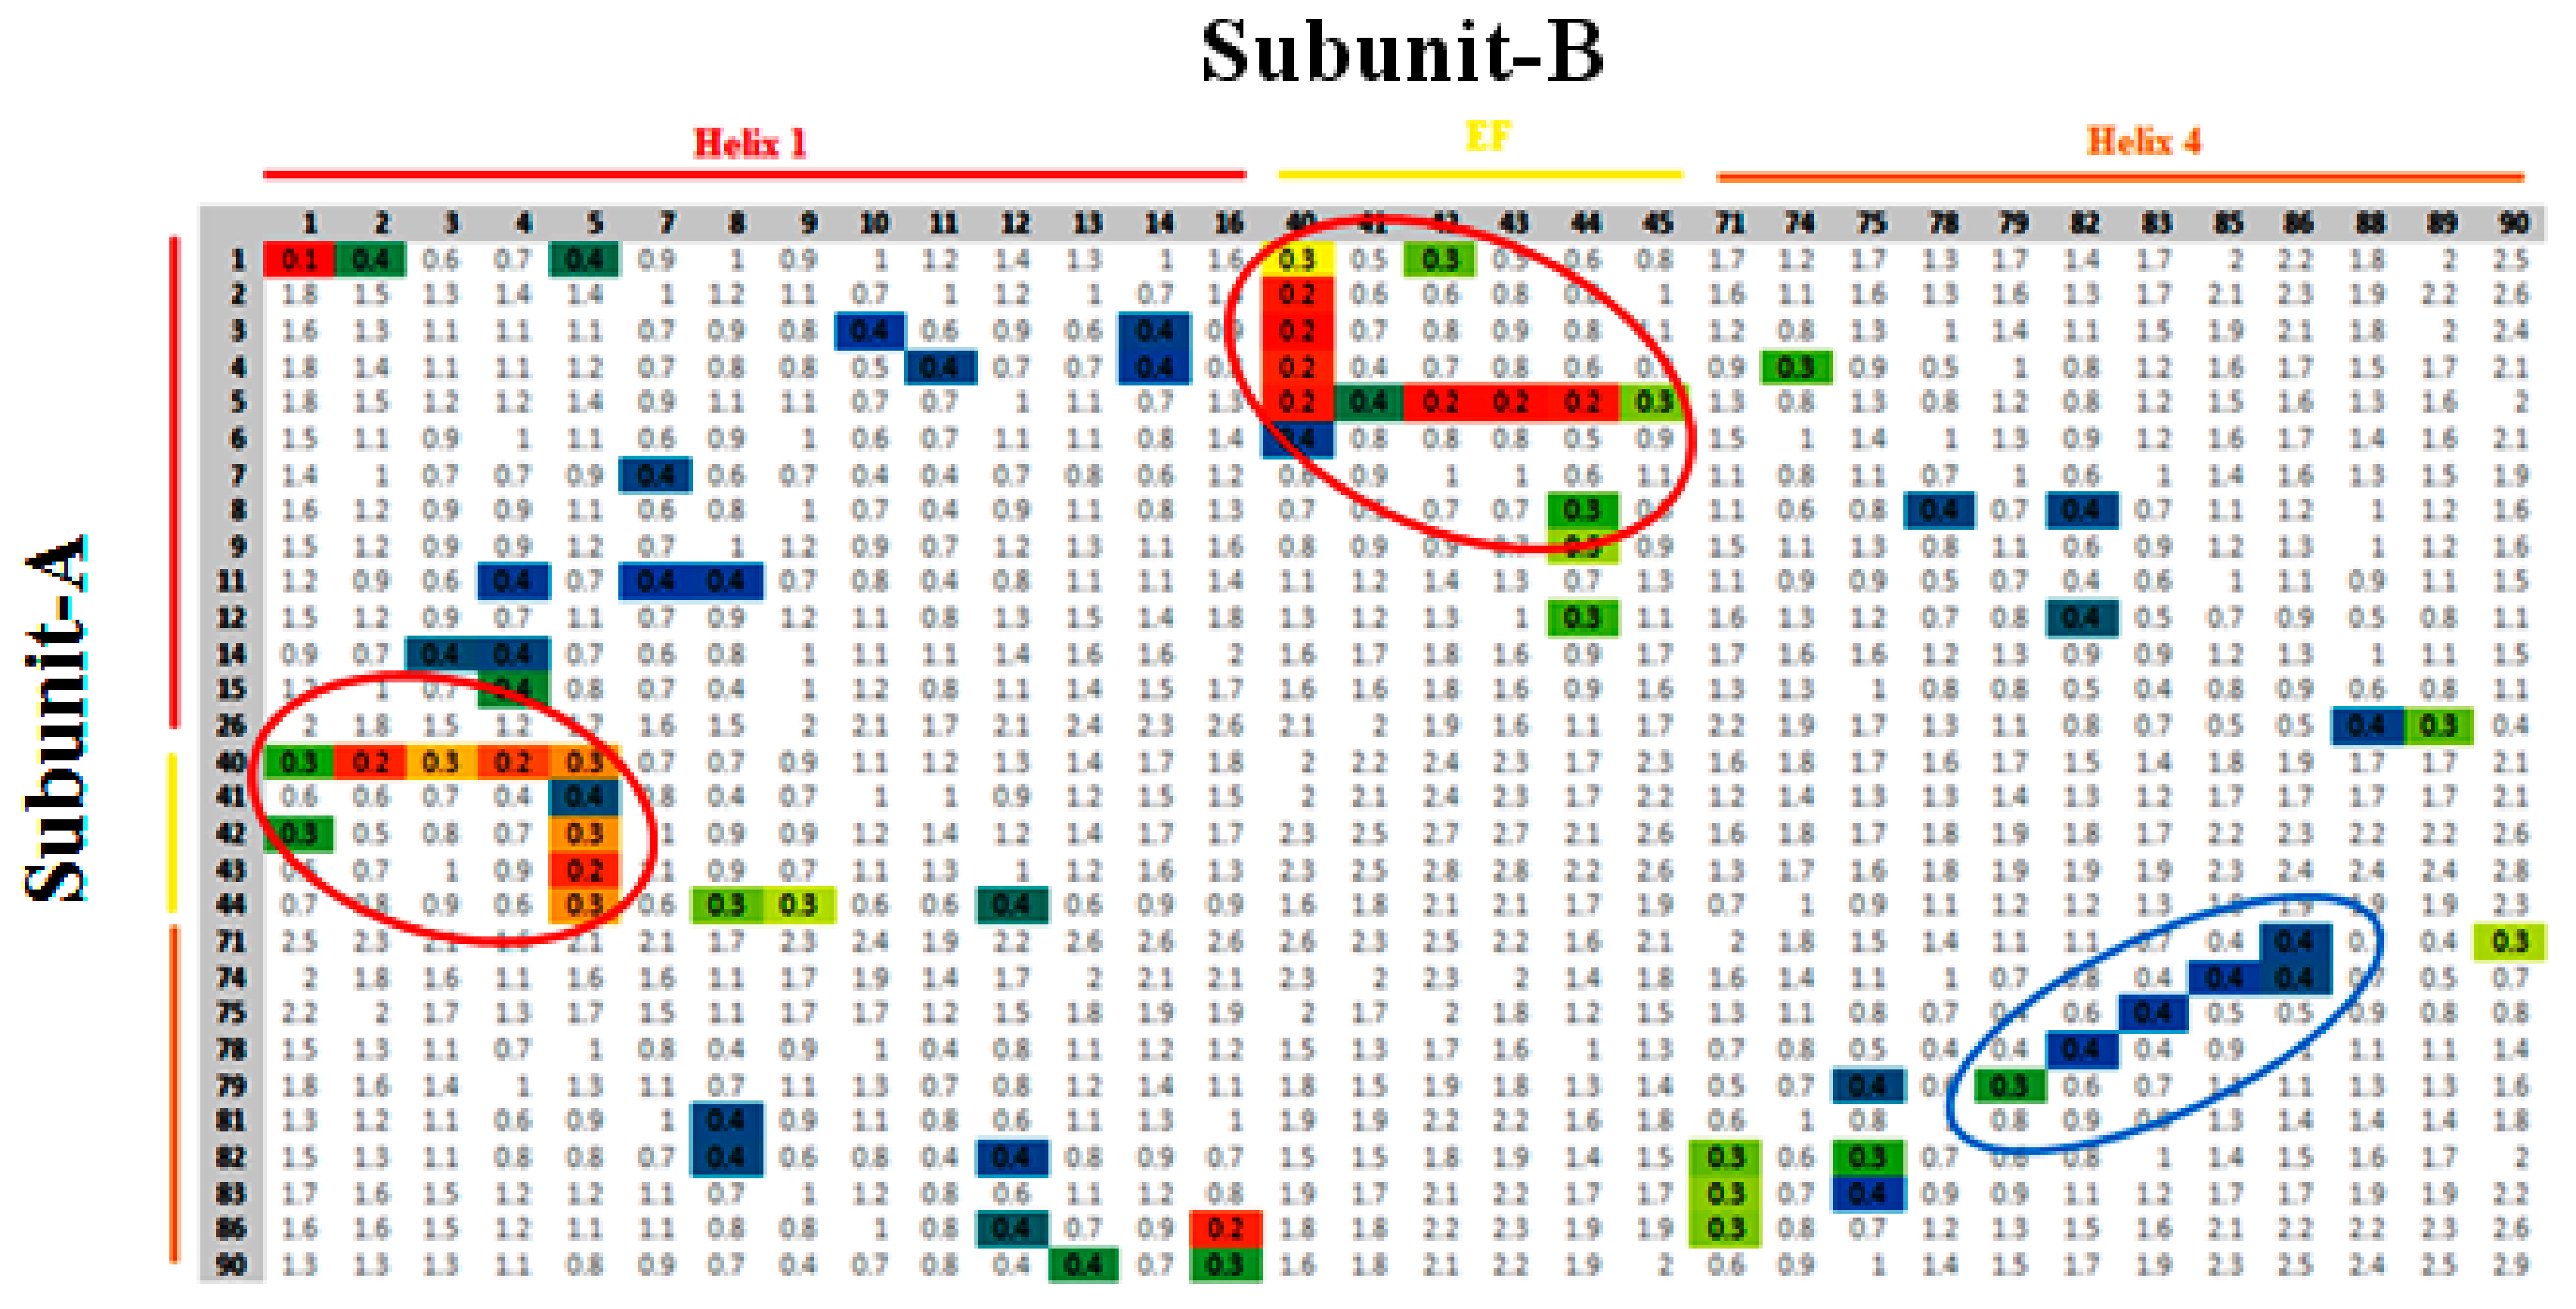
3.3. Contact Map Analysis between Subunits along the Trajectory

Since the activity of a protein-mediated unlocked state takes place due to Ca2+, it involves the relative motion of the subunits, a process where the pattern of contact, by way of minimum distances between the domains of both subunits varies. Recently, in such studies, contact analysis was attempted to elucidate the domain-domain interaction during simulation [35]. To quantify these interactions, scrutinizing all the residues intricated in the contact between the suitable domains, with further approximation of the average (geometric) distance between them throughout a particular time frame along the trajectory was carried out. The interacting residues of the subunits A and B are marked on a vertical and horizontal axes, respectively. The colored boxes describe the structural features of each domain that interact with the respective domain of another subunit. The colored eclipse represents the significant contact distances made between the residues on the H1 site, the EF site, and H4 of both subunits of the protein.
The number of contacts as calculated for the relaxed conformations of the unlocked state of holo-S100A1 protein revealed that the H1 site, the EF site, and H4 domains of each subunit were making contact during the simulation (Figure 6). The contacts between the subunits were a consequence of some structural deformations. The major deformation occurred because of the significant inclination of the EF site of subunit B toward H1 of the next subunit and vice versa. The residues Glu, Leu, Ser, Gly, and Phe (residue numbers 40–45) were recruited mainly to establish robust contacts. These contacts with distances mostly less than 0.3 nm between corresponding residues are depicted in color boxes within red eclipses. Distances between the EF site and H1 domain’s residues in each subunit retained their contacts during the simulation. Other residues in the EF site, mainly carboxylates, engaged in Ca2+ binding are illustrated in later sections. In the earlier section, we have confirmed that the H4 domain of subunit B shows enormous structural deformations, which leads to the unlocked state. The unlocked state assumed active conformational changes, which suggests that the bending of the helices can serve as enhancement of contacts with H4 of subunit A (blue eclipse, Figure 6). In this contact, mainly Ala, Leu, Thr, Val, Cys, and Asn residues of subunit B were enlisted, which effectively connected with residues Phe, Gln, Glu, Tyr, Val, Leu, and Ala of subunit A. The difference between the H4 domains appears to be an intensive translocation in the size and nature. These observations, together with some sort of major structural changes, indicate that the active-inactive transition is tied with the H1 site, the EF site, and H4 domains in both subunits.

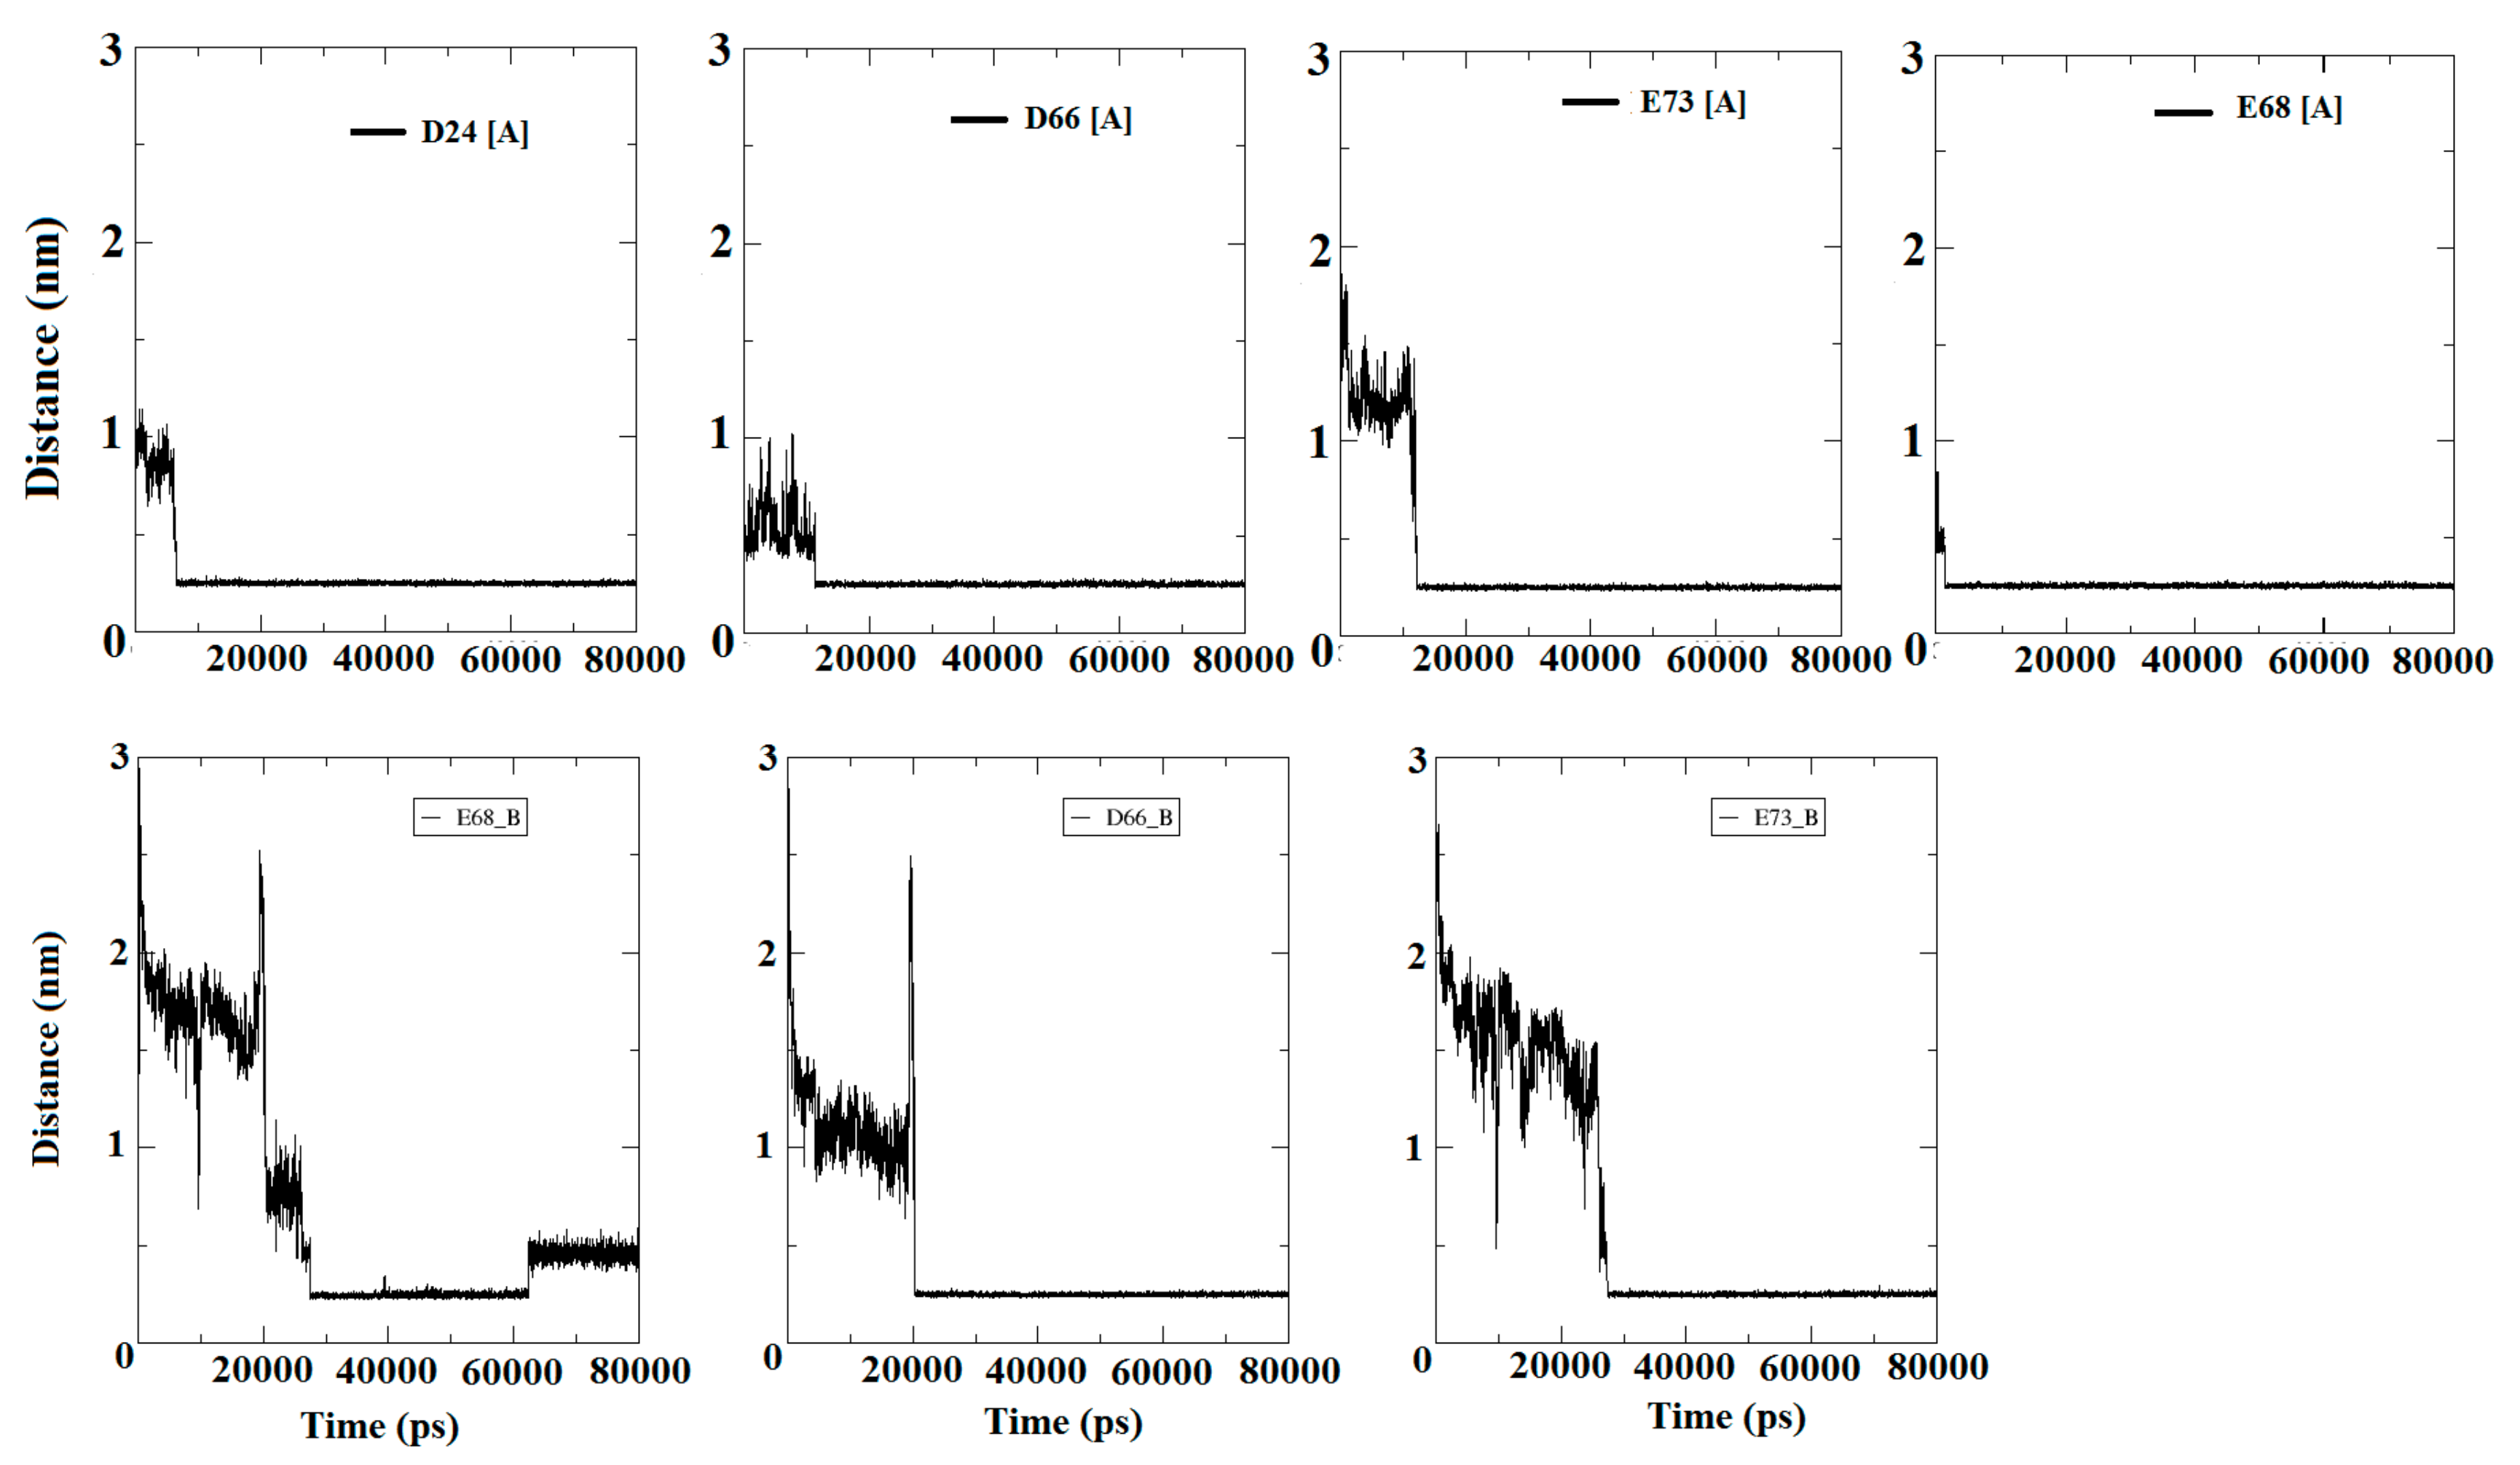
3.4. Monitoring of Ca2+ Binding Residues

Since subunit B exhibited extensive conformational changes in the topology of the H3-EF site-H4 domains, we decided to visualize subunit B independently to illustrate the binding residues. Figure 7 shows a magnified view of subunit B of the S100A1 protein with a detailed view of the binding sites and two Ca2+ depicted, as reproduced from the crystallographic structure provided by Nowakowski et al. [26]. Carboxylate moieties of the EF site participate in the coordination with Ca2+ either directly or via a water molecule. Moieties closer than 0.3 nm to Ca2+ are considered to form the salvation shell of the ion. The hydrophobic patch generated a gap that occurred due to the hydrophobic residues lying on the H3-EF site H4 topology, which is in agreement with published data [13,19]. Within the EF site domain, it was revealed that moieties such as K and carboxylate D and E interacted mostly with Ca2+, where E73 was initially located detached from the EF site. However, during simulation, it was shifted toward the Ca2+ (Figure 7 rightmost). On the other hand, additional residues that were far from the EF site, like N64 and S29, became the probable accessible moieties during the simulation. Figure 7 clearly illustrates residues that interacted with each Ca2+ in the EF site. It was observed that the carboxylate residues perform rapid dynamics and move close to each Ca2+. Therefore, carboxylate residues and K27 serve as a preferred site for ~80% and ~20% of the simulation time, respectively. Single H-bonds were generated through a water molecule between E68 and a Ca2+, which secured the propensity of the ion toward the EF site residues.
Previously, it has been reported that the 14 residues between S19 to E32 were distinguished as the first EF region, whereas the second EF region is unique to the S100 family and related proteins, with 12 residues linking D62 and E73 [9]. Binding residues indicate that the initial ligands were consistent with the carboxylate oxygen atoms of D24, E32, E63, D66, E68, and E73 (EF site), but D66 and E68 were used to recruit crucial ligands. On the other hand, N64, S29, and K27 were also involved to some extent at the beginning of the simulation. In trajectory, a high time resolution trace that expands the passage between the sites is presented in Figure 7. Following this period, there were brief events (few ns long) where the carboxylate moieties E32, D66, and E68 participated as the next encounter moieties of the ion. At the end of the transition step, residues D24, E32, D66, and E68 were the dominant moieties for the ion. A minimum distance (less than 0.25 nm) was covered for the contact with D66. E68 shifted towards Ca2+. In addition, the red circle shows a magnified view of establishing a H-bond between the E68 residue and Ca2+ through an oxygen atom of the water molecule. However, the contact with D24, K27, and E32 still continued in the middle stage of the simulation, while, at this stage, N64 was not in contact any more. At the end stage, the interaction with the residue S29 was also established and the ion was anchored to subunit B. However, since the ion can build a strong interaction with S29 and restore a brief contact with K27, the system is in a rapid transition between equipotential conformations (Figure 7).

3.5. Entry of Free Ca2+ into the Bulk of the Apo-State Protein

The mechanism, by which Ca2+ travel to the surface of the protein and find the EF site domain, was investigated by the present experiment. Moreover, specific binding residues were also emphasized while examining first and second encounters of ions. In addition, total residence time was also provided to evaluate the binding robustness. The four Ca2+ were added to the water box of the apo-S100A1 structure, which was initially in bulk, and found their positions randomly. Entry led to an average frequency of the encounter, where the Ca2+ approached the solvating shell and found preferable carboxylate moieties. Residues that were identified in the first and second encounters of a Ca2+ were mainly D24, E32, D66, E68, and E73. It was observed that all these identified residues belong to the EF site domain. Due to these residues, the EF site domain was established as a highly negative region of the structure, where ions appear to be resolved. In the first observation, to quantize this event, we approximated the minimum distance between the identified residue and, collectively, all Ca2+ (Figure 8).
Figure 8 confirms that the Ca2+ were in bulk initially and discovered crucial surface residues within the time period from ~6 ns to ~28 ns. D24, D66, E68, and E73 were identified as crucial moieties, which acquired enormous propensities in the direction of Ca2+. These residues of subunit A were reached with an appropriate distance of <0.30 nm (solvation shell) in ~6–10 ns, and remained horizontal at the same distance until the end of simulation. D66 and E73 of subunit B were identified as crucial residues that maintain a distance of approximately 0.25 nm with Ca2+ at simulation time of approximately 20 ns and 26 ns for D66 and E73, respectively. The conclusions drawn for this experiment of entry of Ca2+ in bulk were supposed to be significant for ion circulation on the surface of the EF site. In addition, all four Ca2+ were adsorbed and started disappearing from the bulk very rapidly between ~10 ns to ~20 ns. In case of the E68 residue, the ions achieved appropriate distances at the very beginning of the simulation. Such an arrest of a Ca2+ had been observed on EF sites by reason of a local attractive electrostatic potential [36,37]. A comparison of the binding phenomenon using the crystal structure revealed that the ions accumulated on the EF site and also on residues of the adjacent domain to facilitate their contribution in the role of S100A1 activity. Remarkably, once the ion is made obtainable by the protein shell, its entry to the EF site is improved. The path between the two surroundings requires no more than a few ns and is guided by reducing the water molecules in the solvation shell.
To gain insights into the free entry of ions on the EF site and its adjacent domain residues along with conformational changes, angles were again estimated by indexing the same residue numbers guided by the yellow line in Figure 3. On comparing with holo S100A1, some significant elevation in angles during the simulation was observed. Table 3 reports the angle estimations in various simulation time frames. The time frame considered was 10 ns, 40 ns, and 80 ns, where a substantial increase in angle values was noted. An angle difference of 45.46° was noted for subunit A, which possessed a high resemblance with the holo-S100A1 system. Whereas, in subunit B, the angle elevation noted was relatively slow and the difference in time frames between 10 ns and 80 ns was found to be 14.67°. Thus, due to the ion encounters, the angle values were increased, which corroborated the resemblance with the holo-S100A1 system.

3.5.1. Encounter of Ca2+

Table 4 illustrates the Ca2+ encounters and binding time on residual atoms. The binding time of Ca2+ is the contact time at which all possible moieties possess distances less than 0.5 nm. Mostly carboxylate moieties, D24, D66, E68, and E73, were identified in each subunit by means of high residence time with Ca2+. The residence time explains the total staying time of ions on the residues after the first and second encounters. Subunit A of the S100A1 protein exhibited residence time rather than Subunit B. This study revealed the motion of the Ca2+ and binding robustness of ions on the EF site residue. The total residence time was calculated using the following simple approximations. We have treated all the possibilities of the ion encounter on a residue. The maximum two encounters were obtained during the simulation time of 80 ns.
If the first encounter was found:
TRT = (80,000 − FET)
If the second encounter was found:
TRT = (80,000 − SET)
If the first and second encounters were found at different time intervals:
TRT = (SET − FET) + (80,000 − SET)
where,
TRT, FET, and SET stand for total residence time, time of first encounter, and time of second encounter, respectively.
The accumulation of Ca2+ on the EF site at this location was retained for significantly many nanoseconds. Such interactions of an ion had been observed for defined sites on the surface of the protein where there is a local attractive electrostatic potential. According to this, the interaction of ions near the EF site provides a reservoir of the ions, which facilitates its participation in the functioning of the protein. Once the ion is made available, its entry to the binding site is enhanced.

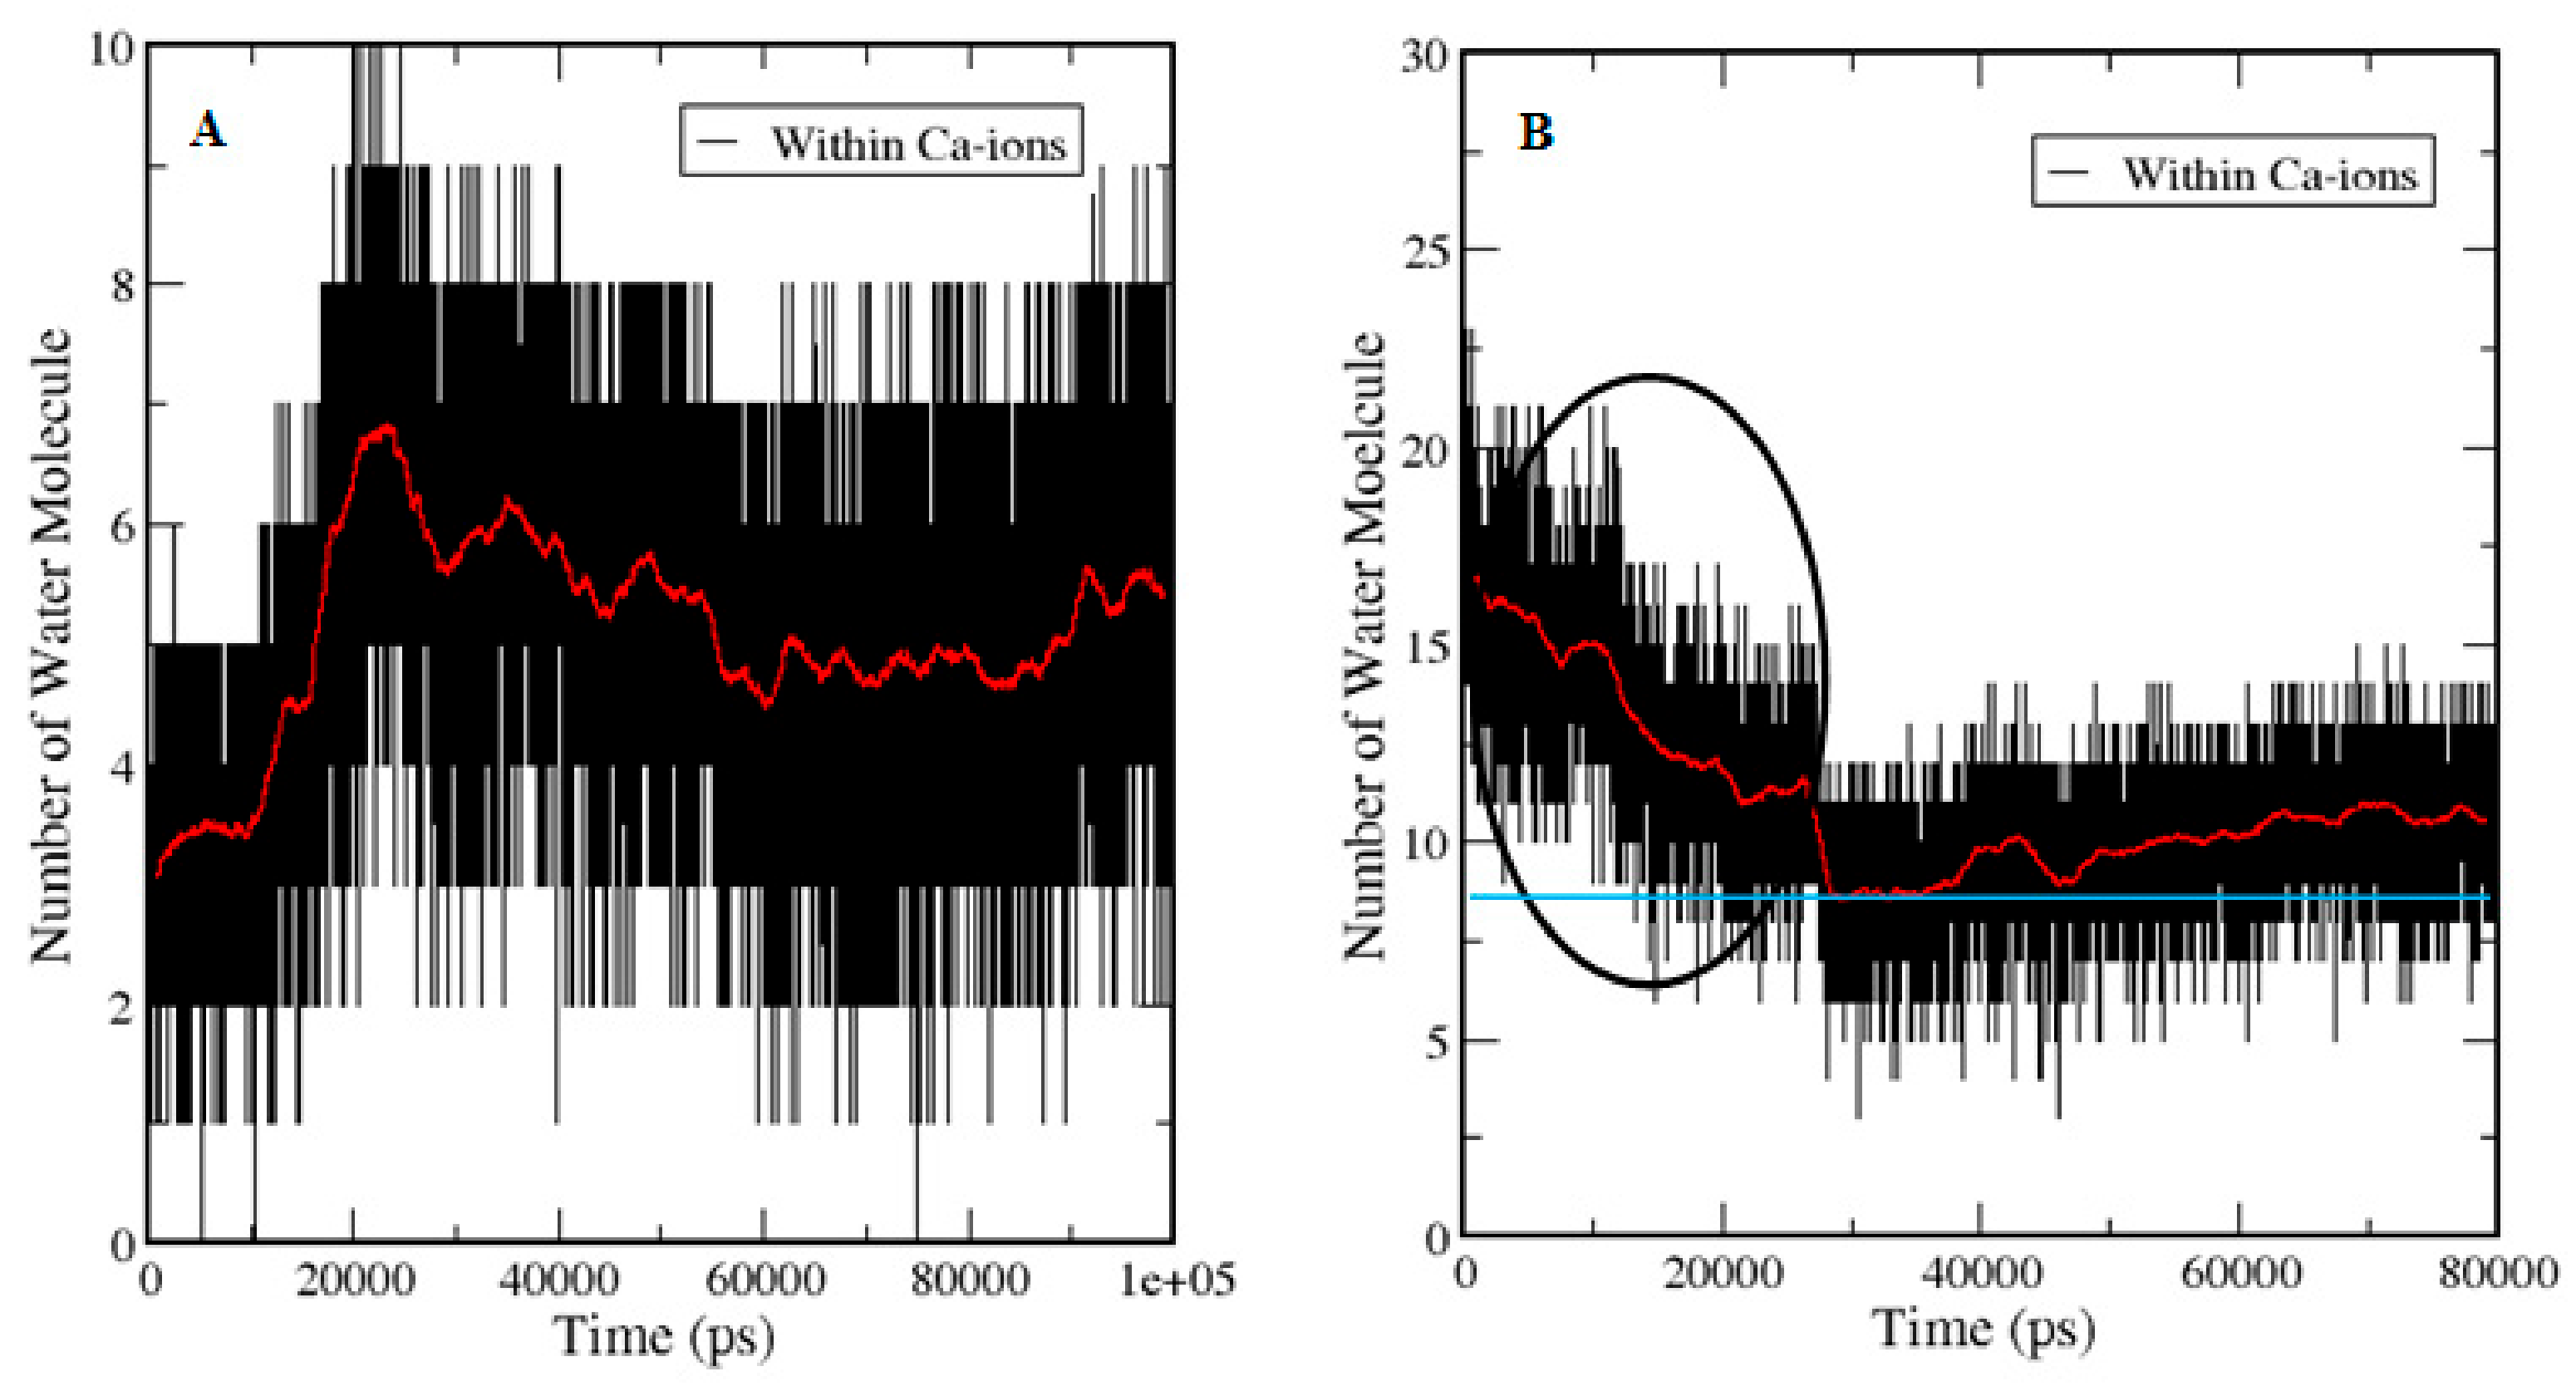
3.5.2. Ion Hydration and Dynamics of Water Molecules

The temporal distribution of the number of water molecules within the solvation shell, as calculated for the holo-state trajectories and trajectory of free entry of Ca2+, is presented in Figure 9. Calcium-binding sites per protein molecule with a dissociation constant (Kd) is in the range of 61 ± 4 μM to 210 ± 22 μM [38]. Therefore, the rate-limiting step of the ion entry is its partial desolvation event. All-atom unbiased molecular dynamic simulations allow a direct counting of the water molecules that were within the solvation shell of the ion as well as the dwell time of water molecules within this range.
In the holo state crystal structure, the ion was equally located on both subunits of the protein. During simulation, there was a fast exchange of its solvation water from the bulk. It was observed that the ions on the subunit of the protein were fully solvated and, thus, this event was calculated by selecting water molecules within the solvation shell of Ca2+, which traced their distance from the ion as a function of time (Figure 9A). The trace in Figure 9A demonstrates how water molecules approached from the bulk, and within ~20 ns, water molecules traveled into the solvation shell of the ion. The water molecules in the immediate vicinity of the ion are freely alternate within ~0.25 nm.
While, in Figure 9B, the ion is in bulk water. It was solvated by 15–18 water molecules in accordance with the published data [39]. Ions started approaching toward the salvation shell when the number of solvating water molecules was decreasing due to sharing of the surface area of the ions with carboxylate and carbonyl oxygen atoms (up to 0.25 nm) at the EF site. The lowest number of water molecules (blue line touches the red line) was reported at ~22 ns, which then started increasing, and remained elevated until the end of the simulation. In this case, the number of water molecules was decreasing and remained between 11–8 molecules. When the ion is not fully hydrated, the free coordinates were taken up by the moieties of the protein.

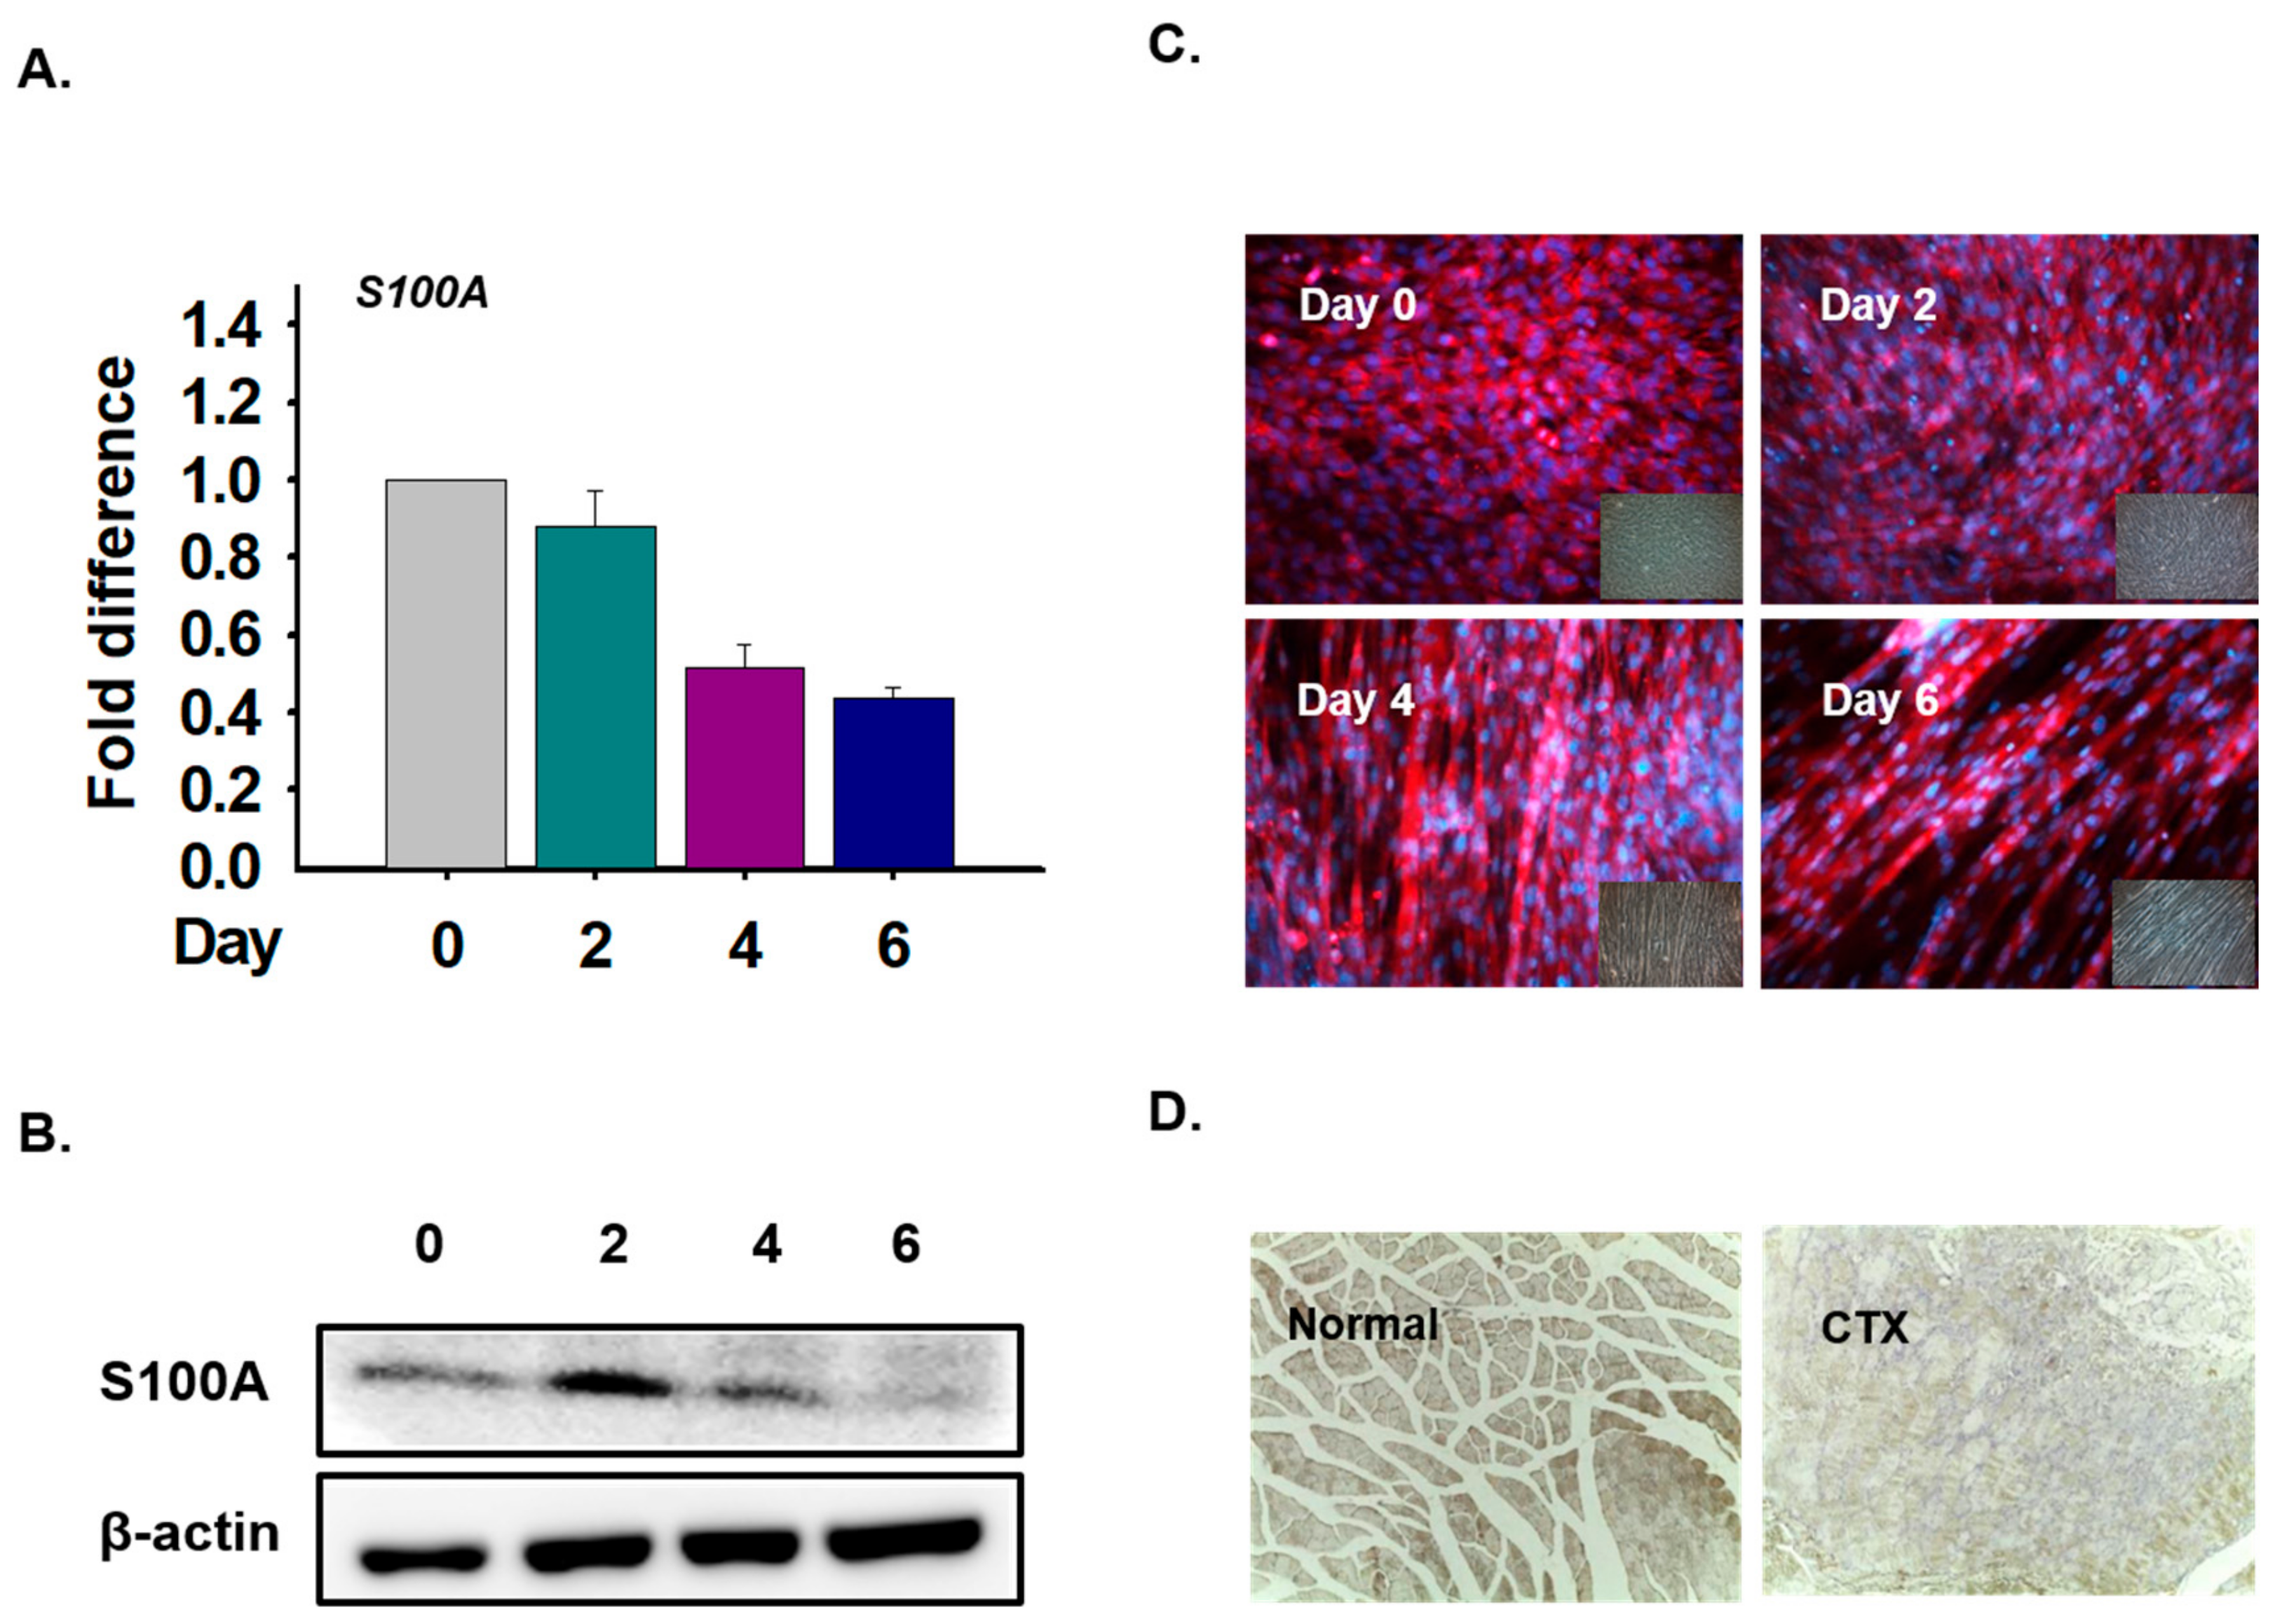
3.6. S100A Expression in Myoblast Differentiation and Muscle Regeneration

To investigate the function of the S100A1 protein in myoblast differentiation, C2C12 cells were incubated with differentiation media for 0, 2, 4, and 6 days. The expression of S100A1 mRNA decreased with differentiation time (Figure 10A). Protein expression was analyzed with Western blot and immunocytochemical techniques. The data showed that expression was detected in the cytoplasm and that protein levels were slightly increased in Day 2 cells (Figure 10B,C). In addition, S100A1 protein expression was observed in normal and CTX-injected muscles and showed that expression in normal muscles was higher than in CTX-injected muscles (Figure 10D). Thus, these data show that S100A1 expression is not significantly associated with inducing myoblast differentiation and muscle regeneration.

4. Discussion

The findings of a recent experimental study suggest that the S100 protein family can serve as diagnostic markers in neuronal and inflammatory disorders, myopathies, cancer, and many other diseases [40]. Recently, S100A protein partners were also discussed at a molecular level in normal and affected tissues [41]. Previously, genome and proteome level studies revealed specific Ca2+ binding proteins and highlighted their importance with respect to medical relevance [42,43]. Earlier, nuclear magnetic resonance studies have exposed atomic-resolution details of the S100A1 conformations in the apo-S100A1 [25,44], holo-S100A1 [11,25], and target protein-bound states [13,45].
During molecular dynamics simulation, the S100A1 protein responded mostly on the EF site of subunit B than subunit A. However, conformational changes are initiated simultaneously on both subunits (Figure 2). All the trajectories underwent stability checks, and each trajectory was found to be stable (Supplementary Materials S1 and S2). For securing convergence, the temporal distribution of clusters was calculated, which was characterized by a sequence of conformations with each persisting for longer lifetimes. This suggests a stable distribution of holo S100A1 (Figure 5). These distributions are very similar to those found in our previous study [46]. Earlier, several studies of PPI were analyzed through contact analysis [35], which contributes to the understanding of residue to residue distance analysis during this period (Figure 6). The contact map revealed vital contacts in diverse distance values between components, which illustrates a close agreement with appropriate deformations. This leads to protein activity.
The entry of four Ca2+ into the bulk provided an acquaintance. First, the effect of Ca2+ travelled toward the surface of the protein. Second, conformational dynamics, which lead to Ca2+ propagation, was extensively illustrated, and, third, the examination of Ca2+ translocation as well as reading the mobility by the entry of ions in the bulk was shown (Figure 8). Due to contact with Ca2+, significant conformational changes were observed, which was reported in previous studies [47]. Water dynamic approximation during a binding event revealed that the volume of water was noted to be significantly less during the corresponding simulation time, which assumed that Ca2+ are appreciably traveling toward the protein surface (Table 4, Figure 9).
Previously, the study of Ca2+ at low and high concentrations suggested binding events of carboxylate with the ions, given that saturation of the EF site requires Ca2+ concentrations of 100–10,000 micromolar [48,49]. The ion was first ligated on the EF site by the carboxylate of D66, E68, and a single water molecule formed a bridge between the ion and the carboxylate of E68. Second, an intermediate state where the solvation shells of the ion included both the carbonyl residue K27 and the carboxylates of D24 and E73 with no water molecule between the ion and the carboxylate moieties. Third, and the most popular residues of the Ca2+, for the crystal structure of S100A1, were found to be the carboxylate of D66 and E68.
The large-scale study of the human transcriptome established that the human heart is the leading location of S100A1. The expression of S100A1 progressively increases throughout cardiac development in mice and reaches a plateau in the ventricular myocardium in the postnatal state [3,50]. In a study, although the S100A1 protein was not uniformly expressed in the heart of an adult rat, nonetheless, it exhibited higher levels of mRNA and protein in the left ventricle but showed lower concentrations inside the right ventricle and atria [51]. There are several pieces of evidence to show a crucial role of S100A1 in fine-tuning skeletal muscle Ca2+ release. S100A1 binds to ryanodine receptor type-1 and plays an imperative role in the excitation-contraction coupling (ECC) process of skeletal muscle [52,53]. In the ECC of skeletal muscle, the sarcolemma depolarizes by means of action potentials to release Ca2+ from the sarcoplasmic reticulum [54]. The study of S100A in different stages of myogenesis and in muscle regeneration was not yet reported from scientific literature. In this study, we found that the S100A1 gene decreased during the myogenic differentiation and muscle regeneration process. In a study by Mori et al., mice lacking S100A1 as well as S100B genes exhibited normal skeletal growth from an embryonic adulthood stage [55].

5. Conclusions

The crystallization of the protein in the presence of ions could not reveal a structural feature clear enough to account for conformational changes-mediated functions. A clear outcome of the simulations is that the holo protein grossly deviates from its crystal structure. The study provides an explanation for access to the Ca2+ preferably by the EF site. Reflection of the protein function suggests that the enhancement of catalysis by the ion leads to stabilization of the conformation of the protein. The entry of free Ca2+ into the bulk explained the binding events. In addition, ion movement and water dynamics supported the observation of ion contact. These findings are valuable for understanding the function of the broad family S100 and the results may also be supportive of the study of Ca2+-mediated PPI. For instance, because of the role of the ion as a key regulator of cardiac function, cardiomyopathies, and heart failure, S100A1-based gene therapy may be developed for clinical trials. Additionally, our results demonstrate the downregulated expression of S100A1 in the differentiation steps of myogenesis with no significant effect in the muscle regeneration process.

Supplementary Materials

The following are available online at https://www.mdpi.com/2073-4409/9/1/181/s1, Figure S1: Approximations of Root mean square deviation (RMSD) of each systems of both simulation. RMSDs of Apo-crystal (black), Holo-S100A1 (red) and experiment of free entry of Ca2+ ions into bulk (blue), are showing a plateau after half of the simulation, Figure S2: Calculations of Root mean square fluctuation (RMSF) of each system which is listed in Table 1. RMSFs in each system demonstrating same pattern till residue number ~40. Panel A represents RMSF of apo-S100A1 during simulations. Panel B depicts the RMSF of holo-S100A1 and Panel C corresponds to system of free entry of Ca-ions in the bulk respectively.

Author Contributions

Conceptualization, N.C., B.S.Y., and K.A. Methodology, N.C., B.S.Y., K.A., and E.J.L. Writing, N.C., B.S.Y., and K.A. Review and editing, I.C., N.C., and N.M. Supervision, N.M. and I.C. Funding acquisition, I.C. and E.J.L. All authors have read and agreed to the published version of the manuscript.

Funding

This research was funded by the National Research Foundation of Korea (NRF) funded by the Korean government (MSIP: Grant No. NRF-2018R1A2B6001020) and a grant from the Next-Generation BioGreen 21 Program (Project No. PJ01324701), Rural Development Administration, Republic of Korea supported this research.

Acknowledgments

The authors are very grateful to Yossi Tsfadia, Tel Aviv University, Israel for providing the computational facility to run molecular dynamics simulation.

Conflicts of Interest

The authors declare that there is no conflict of interest.

References

  1. Donato, R.; Cannon, B.R.; Sorci, G.; Riuzzi, F.; Hsu, K.; Weber, D.J.; Geczy, C.L. Functions of S100 proteins. Curr. Mol. Med. 2013, 13, 24–57. [Google Scholar] [CrossRef] [PubMed] [Green Version]
  2. Völkers, M.; Rohde, D.; Goodman, C.; Most, P. S100A1: A Regulator of Striated Muscle Sarcoplasmic Reticulum Ca<sup> 2. Bio. Med. Res. Int. 2010, 2010. [Google Scholar]
  3. Kiewitz, R.; Lyons, G.E.; Schäfer, B.W.; Heizmann, C.W. Transcriptional regulation of S100A1 and expression during mouse heart development. BBA-Mol. Cell Res. 2000, 1498, 207–219. [Google Scholar] [CrossRef] [Green Version]
  4. Kraus, C.; Rohde, D.; Weidenhammer, C.; Qiu, G.; Pleger, S.T.; Voelkers, M.; Boerries, M.; Remppis, A.; Katus, H.A.; Most, P. S100A1 in cardiovascular health and disease: Closing the gap between basic science and clinical therapy. J. Mol. Cell. Cardiol. 2009, 47, 445–455. [Google Scholar] [CrossRef] [PubMed] [Green Version]
  5. Remppis, A.; Greten, T.; Schäfer, B.W.; Hunziker, P.; Erne, P.; Katus, H.A.; Heizmann, C.W. Altered expression of the Ca2+-binding protein S100A1 in human cardiomyopathy. BBA-Mol. Cell Res. 1996, 1313, 253–257. [Google Scholar] [CrossRef] [Green Version]
  6. Brinks, H.; Rohde, D.; Voelkers, M.; Qiu, G.; Pleger, S.T.; Herzog, N.; Rabinowitz, J.; Ruhparwar, A.; Silvestry, S.; Lerchenmüller, C. S100A1 genetically targeted therapy reverses dysfunction of human failing cardiomyocytes. J. Am. Coll. Cardiol. 2011, 58, 966–973. [Google Scholar] [CrossRef] [Green Version]
  7. Leclerc, E.; Heizmann, C.W. The importance of Ca2+/Zn2+ signaling S100 proteins and RAGE in translational medicine. Front. Biosci. (Schol Ed.) 2011, 3, 1232–1262. [Google Scholar]
  8. Carafoli, E. Calcium signaling: A tale for all seasons. Proc. Natl. Acad. Sci. USA 2002, 99, 1115–1122. [Google Scholar] [CrossRef] [Green Version]
  9. Grabarek, Z. Structural basis for diversity of the EF-hand calcium-binding proteins. J. Mol. Biol. 2006, 359, 509–525. [Google Scholar] [CrossRef]
  10. Ababou, A.; Zaleska, M.; Pfuhl, M. On the Ca2+ binding and conformational change in EF-hand domains: Experimental evidence of Ca2+-saturated intermediates of N-domain of calmodulin. BBA-Proteins Proteomics 2017, 1865, 640–651. [Google Scholar] [CrossRef]
  11. Wright, N.T.; Varney, K.M.; Ellis, K.C.; Markowitz, J.; Gitti, R.K.; Zimmer, D.B.; Weber, D.J. The three-dimensional solution structure of Ca2+-bound S100A1 as determined by NMR spectroscopy. J. Mol. Biol. 2005, 353, 410–426. [Google Scholar] [CrossRef] [PubMed]
  12. Romano, D.R.; Pharris, M.C.; Patel, N.M.; Kinzer-Ursem, T.L. Competitive tuning: Competition’s role in setting the frequency-dependence of Ca2+-dependent proteins. PLoS Comput. Biol. 2017, 13, e1005820. [Google Scholar] [CrossRef] [PubMed]
  13. Wright, N.T.; Cannon, B.R.; Wilder, P.T.; Morgan, M.T.; Varney, K.M.; Zimmer, D.B.; Weber, D.J. Solution structure of S100A1 bound to the CapZ peptide (TRTK12). J. Mol. Biol. 2009, 386, 1265–1277. [Google Scholar] [CrossRef] [PubMed] [Green Version]
  14. Finn, B.E.; Drakenberg, T.; Forsén, S. The structure of apo-calmodulin: A 1H NMR examination of the carboxy-terminal domain. FEBS Lett. 1993, 336, 368–374. [Google Scholar] [CrossRef] [Green Version]
  15. Finn, B.E.; Evenäs, J.; Drakenberg, T.; Waltho, J.P.; Thulin, E.; Forsén, S. Calcium-induced structural changes and domain autonomy in calmodulin. Nat. Struct. Biol. 1995, 2, 777. [Google Scholar] [CrossRef]
  16. Tan, R.-Y.; Mabuchi, Y.; Grabarek, Z. Blocking the Ca-induced conformational transitions in calmodulin with disulfide bonds. J. Biol. Chem. 1996, 271, 7479–7483. [Google Scholar] [CrossRef] [Green Version]
  17. Moorthy, A.K.; Murthy, M. Conformation and structural transitions in the EF-hands of calmodulin. J. Biomol. Struct. Dyn. 2001, 19, 47–57. [Google Scholar] [CrossRef]
  18. González-Andrade, M.; Rodríguez-Sotres, R.; Madariaga-Mazón, A.; Rivera-Chávez, J.; Mata, R.; Sosa-Peinado, A.; Pozo-Yauner, L.D.; Arias-Olguin, I.I. Insights into molecular interactions between CaM and its inhibitors from molecular dynamics simulations and experimental data. J. Biomol. Struct. Dyn. 2016, 34, 78–91. [Google Scholar] [CrossRef]
  19. Scott, C.E.; Kekenes-Huskey, P.M. Molecular basis of S100A1 activation at saturating and subsaturating calcium concentrations. Biophys. J. 2016, 110, 1052–1063. [Google Scholar] [CrossRef] [Green Version]
  20. Berchtold, M.W.; Brinkmeier, H.; Muntener, M. Calcium ion in skeletal muscle: Its crucial role for muscle function, plasticity, and disease. Physiol. Rev. 2000, 80, 1215–1265. [Google Scholar] [CrossRef] [Green Version]
  21. Lee, E.J.; Nam, J.H.; Choi, I. Fibromodulin modulates myoblast differentiation by controlling calcium channel. Biochem. Biophys. Res. Commun. 2018, 503, 580–585. [Google Scholar] [CrossRef] [PubMed]
  22. Lee, E.J.; Kamli, M.R.; Pokharel, S.; Malik, A.; Tareq, K.M.; Roouf Bhat, A.; Park, H.B.; Lee, Y.S.; Kim, S.; Yang, B.; et al. Expressed sequence tags for bovine muscle satellite cells, myotube formed-cells and adipocyte-like cells. PLoS ONE 2013, 8, e79780. [Google Scholar] [CrossRef] [Green Version]
  23. Bentzinger, C.; von Maltzahn, J.; Rudnicki, M.A. Extrinsic regulation of satellite cell specification. Stem Cell Res. Ther. 2010, 1, 27. [Google Scholar] [CrossRef] [PubMed] [Green Version]
  24. Tedesco, F.S.; Dellavalle, A.; Diaz-Manera, J.; Messina, G.; Cossu, G. Repairing skeletal muscle: Regenerative potential of skeletal muscle stem cells. J. Clin. Invest. 2010, 120, 11–19. [Google Scholar] [CrossRef] [Green Version]
  25. Živković, M.L.; Zaręba-Kozioł, M.; Zhukova, L.; Poznański, J.; Zhukov, I.; Wysłouch-Cieszyńska, A. Post-translational S-nitrosylation is an endogenous factor fine tuning the properties of human S100A1 protein. J. Biol. Chem. 2012, 287, 40457–40470. [Google Scholar] [CrossRef] [Green Version]
  26. Nowakowski, M.; Ruszczyńska-Bartnik, K.; Budzińska, M.; Jaremko, Ł.; Jaremko, M.; Zdanowski, K.; Bierzyński, A.; Ejchart, A. Impact of calcium binding and thionylation of S100A1 protein on its nuclear magnetic resonance-derived structure and backbone dynamics. Biochemistry 2013, 52, 1149–1159. [Google Scholar] [CrossRef]
  27. Van Der Spoel, D.; Lindahl, E.; Hess, B.; Groenhof, G.; Mark, A.E.; Berendsen, H.J. GROMACS: Fast, flexible, and free. J. Comput. Chem. 2005, 26, 1701–1718. [Google Scholar] [CrossRef]
  28. Oostenbrink, C.; Villa, A.; Mark, A.E.; Van Gunsteren, W.F. A biomolecular force field based on the free enthalpy of hydration and solvation: The GROMOS force-field parameter sets 53A5 and 53A6. J. Comput. Chem. 2004, 25, 1656–1676. [Google Scholar] [CrossRef]
  29. Project, E.; Nachliel, E.; Gutman, M. Parameterization of Ca+ 2–protein interactions for molecular dynamics simulations. J. Comput. Chem. 2008, 29, 1163–1169. [Google Scholar] [CrossRef]
  30. Yadav, B.S.; Chaturvedi, N.; Yadav, P.K.; Marina, N.; Ganash, M.; Barreto, G.E.; Ashraf, G.M.; Ahmad, K.; Baig, M.H. Protein modeling, molecular network and molecular dynamics study of newly sequenced interleukin-18 (IL-18) gene in Mus musculus. J. Cell Physiol. 2019, 234, 14285–14295. [Google Scholar] [CrossRef]
  31. Ahmad, K.; Balaramnavar, V.M.; Chaturvedi, N.; Khan, S.; Haque, S.; Lee, Y.H.; Choi, I. Targeting Caspase 8: Using Structural and Ligand-Based Approaches to Identify Potential Leads for the Treatment of Multi-Neurodegenerative Diseases. Molecules 2019, 24, 1827. [Google Scholar] [CrossRef] [PubMed] [Green Version]
  32. Toukan, K.; Rahman, A. Molecular-dynamics study of atomic motions in water. Phys. Rev. B 1985, 31, 2643. [Google Scholar] [CrossRef] [PubMed]
  33. Humphrey, W.; Dalke, A.; Schulten, K. VMD: Visual molecular dynamics. J. Mol. Graphics 1996, 14, 33–38. [Google Scholar] [CrossRef]
  34. Lee, E.J.; Jan, A.T.; Baig, M.H.; Ashraf, J.M.; Nahm, S.-S.; Kim, Y.-W.; Park, S.-Y.; Choi, I. Fibromodulin: A master regulator of myostatin controlling progression of satellite cells through a myogenic program. FASEB J. 2016, 30, 2708–2719. [Google Scholar] [CrossRef]
  35. Amber-Vitos, O.; Chaturvedi, N.; Nachliel, E.; Gutman, M.; Tsfadia, Y. The effect of regulating molecules on the structure of the PPAR-RXR complex. BBA-Mol. Cell Biol. Lipids 2016, 1861, 1852–1863. [Google Scholar] [CrossRef]
  36. Friedman, R.; Nachliel, E.; Gutman, M. Molecular dynamics of a protein surface: Ion-residues interactions. Biophys. J. 2005, 89, 768–781. [Google Scholar] [CrossRef] [Green Version]
  37. Gdalya, H.; Nachliel, E.; Gutman, M.; Einav, Y.; Tsfadia, Y. The translocation of Na+ ion inside human thrombin accounts for the activation of the enzyme. Isr. J. Chem. 2017, 57, 413–423. [Google Scholar] [CrossRef]
  38. Wojtas, M.; Hołubowicz, R.; Poznar, M.; Maciejewska, M.; Ożyhar, A.; Dobryszycki, P. Calcium ion binding properties and the effect of phosphorylation on the intrinsically disordered starmaker protein. Biochemistry 2015, 54, 6525–6534. [Google Scholar] [CrossRef]
  39. Di Tommaso, D.; Ruiz-Agudo, E.; de Leeuw, N.H.; Putnis, A.; Putnis, C.V. Modelling the effects of salt solutions on the hydration of calcium ions. Phys. Chem. Chem. Phys. 2014, 16, 7772–7785. [Google Scholar] [CrossRef] [Green Version]
  40. Steiner, J.; Bogerts, B.; Schroeter, M.L.; Bernstein, H.-G. S100B protein in neurodegenerative disorders. Clin. Chem. Lab. Med. 2011, 49, 409–424. [Google Scholar] [CrossRef]
  41. Cmoch, A.; Groves, P.; Palczewska, M.; Pikula, S. S100A proteins in propagation of a calcium signal in norm and pathology. Postepy Biochem. 2012, 58, 429–436. [Google Scholar] [PubMed]
  42. Chaturvedi, N.; Pandey, P.N. Phylogenetic analysis of gammaproteobacterial arsenate reductase proteins specific to Enterobacteriaceae family, signifying arsenic toxicity. Interdisciplin. Sci.: Comput. Life Sci. 2014, 6, 57–62. [Google Scholar] [CrossRef] [PubMed]
  43. Chaturvedi, N.; Kajsik, M.; Forsythe, S.; Pandey, P.N. Protein sequences insight into heavy metal tolerance in Cronobacter sakazakii BAA-894 encoded by plasmid pESA3. Arch. Microbial. 2015, 197, 1141–1149. [Google Scholar] [CrossRef] [PubMed] [Green Version]
  44. Rustandi, R.R.; Baldisseri, D.M.; Inman, K.G.; Nizner, P.; Hamilton, S.M.; Landar, A.; Landar, A.; Zimmer, D.B.; Weber, D.J. Three-dimensional solution structure of the calcium-signaling protein apo-S100A1 as determined by NMR. Biochemistry 2002, 41, 788–796. [Google Scholar] [CrossRef] [PubMed]
  45. Wright, N.T.; Prosser, B.L.; Varney, K.M.; Zimmer, D.B.; Schneider, M.F.; Weber, D.J. S100A1 and calmodulin compete for the same binding site on ryanodine receptor. J. Biol. Chem. 2008, 283, 26676–26683. [Google Scholar] [CrossRef] [PubMed] [Green Version]
  46. Chaturvedi, N.; Yadav, B.S.; Pandey, P.N.; Tripathi, V. The effect of β-glucan and its potential analog on the structure of Dectin-1 receptor. J. Mol. Graphics Modell. 2017, 74, 315–325. [Google Scholar] [CrossRef]
  47. Kazakov, A.S.; Sokolov, A.S.; Vologzhannikova, A.A.; Permyakova, M.E.; Khorn, P.A.; Ismailov, R.G.; Denessiouk, K.A.; Denesyuk, A.I.; Rastrygina, V.A.; Baksheeva, V.E. Interleukin-11 binds specific EF-hand proteins via their conserved structural motifs. J. Biomol. Struct. Dyn. 2017, 35, 78–91. [Google Scholar] [CrossRef]
  48. Berridge, M.J.; Lipp, P.; Bootman, M.D. The versatility and universality of calcium signalling. Nature Rev. Mol. Cell Biol. 2000, 1, 11. [Google Scholar] [CrossRef]
  49. Shannon, T.R.; Wang, F.; Puglisi, J.; Weber, C.; Bers, D.M. A mathematical treatment of integrated Ca dynamics within the ventricular myocyte. Biophys. J. 2004, 87, 3351–3371. [Google Scholar] [CrossRef] [Green Version]
  50. Su, A.I.; Wiltshire, T.; Batalov, S.; Lapp, H.; Ching, K.A.; Block, D.; Zhang, J.; Soden, R.; Hayakawa, M.; Kreiman, G. A gene atlas of the mouse and human protein-encoding transcriptomes. Proc. Natl. Acad. Sci. USA 2004, 101, 6062–6067. [Google Scholar] [CrossRef] [Green Version]
  51. Pleger, S.T.; Most, P.; Boucher, M.; Soltys, S.; Chuprun, J.K.; Pleger, W.; Gao, E.; Dasgupta, A.; Rengo, G.; Remppis, A. CLINICAL PERSPECTIVE. Circulation 2007, 115, 2506–2515. [Google Scholar] [CrossRef] [PubMed] [Green Version]
  52. Prosser, B.L.; Wright, N.T.; Hernandez-Ochoa, E.O.; Varney, K.M.; Liu, Y.; Olojo, R.O.; Zimmer, D.B.; Weber, D.J.; Schneider, M.F. S100A1 binds to the calmodulin-binding site of ryanodine receptor and modulates skeletal muscle excitation-contraction coupling. J. Biol. Chem. 2008, 283, 5046–5057. [Google Scholar] [CrossRef] [PubMed] [Green Version]
  53. Yamaguchi, N.; Prosser, B.L.; Ghassemi, F.; Xu, L.; Pasek, D.A.; Eu, J.P.; Hernández-Ochoa, E.O.; Cannon, B.R.; Wilder, P.T.; Lovering, R.M. Modulation of sarcoplasmic reticulum Ca2+ release in skeletal muscle expressing ryanodine receptor impaired in regulation by calmodulin and S100A1. Am. J. Physiol.-Cell Physiol. 2011, 300, C998–C1012. [Google Scholar] [CrossRef] [Green Version]
  54. Numa, S.; Tanabe, T.; Takeshima, H.; Mikami, A.; Niidome, T.; Nishimura, S.; Adams, B.; Beam, K. Molecular insights into excitation-contraction coupling. In Proceedings of Cold Spring Harbor Symposia on Quantitative Biology; Cold Spring Harbor Laboratory Press: Cold Spring Harbor, NY, USA, 1990; Volume 55, pp. 1–7. [Google Scholar] [CrossRef]
  55. Mori, Y.; Mori, D.; Chung, U.I.; Tanaka, S.; Heierhorst, J.; Buchou, T.; Baudier, J.; Kawaguchi, H.; Saito, T. S100A1 and S100B are dispensable for endochondral ossification during skeletal development. Biomed. Res. 2014, 35, 243–250. [Google Scholar] [CrossRef] [PubMed] [Green Version]
Figure 1. Visualization of homo-subunit S100A1 protein structure (PDB-ID: 2LP3). H3-EF site-H4 topology is depicted, using, respectively, the blue-cyan-red color code pattern. Ca2+ (green balls) are positioned on the EF site loop (cyan).
Cells 09 00181 g001
Figure 2. RMSD approximations of H3 and H4 domains in both subunits of the holo-S100A1 system. RMSDs of H3 and H4 domains of the two sides are represented in a red and black color code. A comparative superimposition between the structure of T = 0 ns (cartoon in red) and T = 100 ns (cartoon in black) of H3 and H4 of the two sides. Comprehensible structural transitions can be seen after simulation.
Cells 09 00181 g002
Figure 3. Visualization of first (T = 0 ns) and last (T = 100 ns) frame of the holo (PDB: 2LP3) S100A1 protein. The figure clearly shows the locked and unlocked states in both sides A and B. The yellow lines are drawn to show the expansion of the opening that leads to the unlocked state (hydrophobic patch) and activates the PPI. H3 and H4 of each subunit are colored in blue and red, respectively. The position of the first and second EF site are represented in a cyan color along with a residue range. Ca2+ are depicted as green balls.
Cells 09 00181 g003
Figure 4. A represents the solvent accessible surface area (SASA) over the frequency distribution of apo-S100A1 and holo-S100A1. B shows H-bond changes in an apo (red) and holo (blue) state during simulation of 80 ns and 100 ns, respectively. Calculations take place between subunits A and B of each system separately at a cut-off of 0.35 nm. Straight black lines are drawn to depict the average of H-bonds of each system. A rise of ~10 H-bonds in holo-S100A1 revealed firmness of the system.
Cells 09 00181 g004
Figure 5. Temporal distribution of the apo-S100A1 and holo-S100A1 state. A denotes cluster distribution approximation of the apo-S100A1 protein, which demonstrates larger clusters by time, and B represents the holo-S100A1 (Ca2+ loaded) protein illustrating ~20 clusters noted until 60 ns and the remaining 10 clusters in the last 40 ns of simulation. The estimation of cluster analysis is computed using the cut-off value of 0.2 nm. The red trace represents the mean cluster value calculated for a 100 ps wide running time-window.
Cells 09 00181 g005
Figure 6. Contact analysis between adjacent domains of subunit A and B in the S100A1 protein during the simulation. The residues of subunit A are detailed in rows, while the subunit B residues are listed in columns. The pattern of contacts between the residues of H1, EF site, and H4, are colored in red, orange, and yellow bars, respectively. The colored pixels represent residues that are at a distance of less than 0.4 nm. The color code of separation distance, shown as mean distance, is blue, which represents a mean distance of more than 0.35 nm. Green represents a mean separation of less than 0.35 nm and more than 0.3 nm. Yellow represents a mean distance of less than 0.3 nm. Red and orange symbolize an average distance of 0.1 nm and 0.2 nm, respectively. The analysis was performed over the time frames of the largest clusters of unlocked and locked states. Red eclipse denotes all significant contacts made by the H1 and EF site of each subunit, whereas the blue eclipse defines the interaction between H4 of each subunit.
Cells 09 00181 g006
Figure 7. Visualization of subunit B of holo S100A1 after simulation. Residue atoms closer than 0.3 nm are denoted as a line (oxygen in red, carbon in cyan, and nitrogen in blue). The left frame at T = 0 depicts the inverted position of subunit B. Right frame B represents the propensities of binding residues with Ca2+ at T = 100 ns. A magnified view in the red circle denotes the H-bond formation where the oxygen atom of E68 forms a H-bond with Ca2+ via oxygen in water. Ca2+ are also shown (in CPK style) along with the relevant distances.
Cells 09 00181 g007
Figure 8. Distance calculations from Ca2+ to specific residues listed in the above analysis. Residues and its identifiers given along with subunits A and B demonstrated four and three carboxylate moieties in subunit A and B, respectively. Each Ca2+ reaches a significant distance between ~5 ns to 25 ns simulation time and maintains equivalence throughout.
Cells 09 00181 g008
Figure 9. Hydration of Ca2+ and execution of water dynamics. A represents the calculation of water molecules in the holo-S100A1 system during simulation and B denotes the system of free entry of Ca2+ into the bulk. Red lines show the average number of water molecules around Ca2+ ions. The blue line in frame B indicates the mean point of the lowest number of water molecules. At the beginning of simulation, elevation in the number of water molecules is shown in A, whereas, in fB, a drop in water molecules is noted, revealing that the Ca2+ are approaching the surface of protein (black circle). However, after contacting the blue line, an elevation is noted similar to A, which suggests that a similar behavior occurred in holo S100A1.
Cells 09 00181 g009
Figure 10. S100A1 expression in myoblast differentiation and muscle regeneration. C2C12 cells were cultured with 2% FBS for 0, 2, 4, and 6 days. mRNA protein expression was analyzed using real-time RT-PCR, Western blot, and immunocytochemical techniques. (A) mRNA expression using real-time RT-PCR. (B) and (C) S100A1 protein expression using Western blot and immunocytochemical techniques. CTX was injected in the GAS muscle and maintained for 7 days. (D) S100A1 protein expression in normal and CTX-injected muscles.
Cells 09 00181 g010
Table 1. Details of the systems and the duration of simulations and recurrence.
Serial NoSystemPDB idNumber of Ca2+ in Solvent PhaseDuration of Simulations (ns)
Simulation-1Simulation-2
1.Apo-S100A12LLUnil800
2.Holo-S100A12LP3410080
3.Entry of free Ca2+2LLU48080
Table 2. Angle estimations between H3-EF site-H4 topology at various simulation time intervals for each subunit. Angles are calculated based on the yellow line in Figure 3. More than 10° angle differences in apo and holo states are depicted in bold and italic fonts.
SystemSubunit ASubunit B
10 ns40 ns80 ns/100 ns10 ns40 ns80 ns/100 ns
Apo-S100A164.34 +/− 5.8268.71 +/− 5.1869.82 +/− 4.7246.42 +/− 6.8654.89 +/− 13.3466.94 +/− 17.02
Holo-S100A165.65 +/−5.1272.19 +/− 7.5979.94 +/− 9.9766.40 +/− 1.6479.66 +/− 6.58106.13 +/− 11.99
Table 3. The experiment of entry of four Ca2+ from the bulk for each simulation is approximated between the H3 site, the EF site, and H4 topology in the respective time intervals for each subunit. Angles are calculated according to the same residues, as directed by the yellow line of Figure 3.
SystemTime
Entry of Ca2+-S100A110 ns40 ns80 ns
Subunit A66.75 +/− 8.2377.50 +/− 5.9780.31 +/− 5.84
Subunit B47.34 +/− 5.9642.30 +/− 5.9362.01 +/− 8.76
Table 4. The estimation of the total residence time of a Ca2+ on the corresponding residue whose distance is less than 0.5 nm. The time of primary and secondary encounters of Ca2+ on the residue is counted. The encounters in bold indicate significant residence time.
ResiduesCa2+ Encounter on
Subunit A (Time in ps)
TRT (ps)Ca2+ Encounter on
Subunit B (Time in ps)
TRT (ps)
FETSETFETSET
D247948072,0579411033,566
E32000000
K2758,59477,38522,856000
D62000588019,118
D6611,028068,97520,135 59,865
E68280079,72022,750040,004
E73588079,41228,882051,118
S29320211,046539421,15625,7501548
N6410,04601980000
S19000000
E6311,69941,92815,6861078018,138

