Abstract
Hypertrophic cardiomyopathy (HCM) is the most common inherited cardiac disorder. It is mainly caused by mutations in genes encoding sarcomere proteins. Mutant forms of these highly abundant proteins likely stress the protein quality control (PQC) system of cardiomyocytes. The PQC system, together with a functional microtubule network, maintains proteostasis. We compared left ventricular (LV) tissue of nine donors (controls) with 38 sarcomere mutation-positive (HCMSMP) and 14 sarcomere mutation-negative (HCMSMN) patients to define HCM and mutation-specific changes in PQC. Mutations in HCMSMP result in poison polypeptides or reduced protein levels (haploinsufficiency, HI). The main findings were (1) several key PQC players were more abundant in HCM compared to controls, (2) after correction for sex and age, stabilizing heat shock protein (HSP)B1, and refolding, HSPD1 and HSPA2 were increased in HCMSMP compared to controls, (3) α-tubulin and acetylated α-tubulin levels were higher in HCM compared to controls, especially in HCMHI, (4) myosin-binding protein-C (cMyBP-C) levels were inversely correlated with α-tubulin, and (5) α-tubulin levels correlated with acetylated α-tubulin and HSPs. Overall, carrying a mutation affects PQC and α-tubulin acetylation. The haploinsufficiency of cMyBP-C may trigger HSPs and α-tubulin acetylation. Our study indicates that proliferation of the microtubular network may represent a novel pathomechanism in cMyBP-C haploinsufficiency-mediated HCM.
1. Introduction
Hypertrophic cardiomyopathy (HCM) is a common familial cardiac disease with an estimated prevalence of 1:200 [1]. It is characterized by an asymmetrically hypertrophied, non-dilated left ventricle and an impaired diastolic function [2]. More than 1500 pathogenic mutations that most frequently encode proteins in the sarcomere have been identified. Previous studies have shown that sarcomere mutations alter myofilament function (reviewed recently in [3]). However, while the same sarcomere mutation is present in members of one family, the age of onset and disease severity vary greatly between patients, spanning from asymptomatic mutation carriers to symptomatic patients with severe cardiac remodeling [4]. This large clinical heterogeneity implies that HCM pathophysiology is more complex than the functional defects triggered by the gene mutation. Furthermore, pathogenic mutations were only found in ~50% of all HCM patients [4]. Moreover, a recent large international clinical HCM study showed that patients with a mutation in a sarcomere gene had a 2-fold higher risk of adverse outcomes (e.g., heart failure and atrial fibrillation) compared to patients with no known mutations [5]. The exact mechanisms underlying the difference in disease severity between sarcomere mutation-positive (HCMSMP) and mutation-negative (HCMSMN) patients are currently unknown.
A mechanism implicated in HCM progression is perturbed protein quality control (PQC) [6,7]. Cardiomyocytes contain a multilayered PQC system for maintaining proper protein conformation and for reorganizing and removing misfolded or aggregated (mutant) proteins [8]. The PQC system comprises heat shock proteins (HSPs), the ubiquitin-proteasome system (UPS), and autophagy [9]. HSPs are involved at all stages of sustaining protein homeostasis: during protein biosynthesis and maturation, in chaperoning the folding, in protection from environmental stress, in rearrangements of cellular macromolecules during the functional cycles of assembly and disassembly, and finally, in targeting proteins for degradation [10]. Terminally misfolded and aggregation-prone proteins are cleared by the two degradation systems, UPS and autophagy [11]. Furthermore, pathways of PQC are strongly linked to cell architecture, such as the microtubules network [12]. As sarcomere proteins are the most abundant proteins in the heart, maintenance of sarcomere structure and functions depends on functioning PQC mechanisms.
Perturbations in PQC mechanisms may be aggravated by the presence of sarcomere gene mutations that may explain the difference in disease severity between HCMSMP and HCMSMN patient groups. Moreover, the proteotoxic burden on PQC may depend on the type of mutation: in HCM, gene mutations either result in a ‘poison polypeptide’ (an expressed protein containing a mutated sequence) or haploinsufficiency, where up-regulation of the wild-type protein levels failed to compensate for reduced total protein [13,14].
Here, we identified and quantified key PQC players, such as HSPs and degradation markers (ubiquitinated proteins, p62, LC3BII) and microtubule network markers (for example acetylation of α-tubulin) in a large set of myectomy samples from HCMSMP and HCMSMN patients to define if the presence of a sarcomere mutation differentially affects PQC. In addition, mutation-specific PQC changes were assessed by comparing HCM with missense mutations and MYBPC3 (cardiac myosin-binding protein-C) mutations, which cause haploinsufficiency.
2. Materials and Methods
2.1. Septal Myectomy
Cardiac tissue from the interventricular septum was obtained during myectomy surgery to relieve left ventricular (LV) outflow tract obstruction. Patients were selected for surgery at our HCM center on the basis of the following indications: (1) peak left ventricular outflow tract (LVOT) gradient ≥ 50 mmHg at rest or on provocation and (2) presence of unacceptable symptoms, despite maximally tolerated medications consisting of β-blocking agents and/or calcium channel blockers. The decision to perform surgery was made after the consensus of a heart team consisting of a cardiothoracic surgeon, an interventional cardiologist, and a cardiologist specialized in HCM care [15]. Hypertrophic obstructive cardiomyopathy was evident from the increased septal thickness with a mean (± SD) of 21 (± 6) mm and high LV outflow tract pressure gradient with a mean (± SD) of 66 (± 37) mmHg. Next-generation-sequencing was used to check 48 different HCM-associated genes for variants [16].
This study included 52 septal myectomy patients, as summarized in Table 1. A total of 38 HCM patients were tested positive for carrying a gene variant in one of the genes encoding for the sarcomeric protein. The ages of all 38 HCMSMP patients ranged between 15 and 72, with a mean (± SD) of 49 (± 16) years, and 68% of these were males. Depending on the reported pathomechanism, this group was subdivided into haploinsufficiency (HI) and poison polypeptide (PP) subgroups.

Table 1.
Characteristics of controls and manifest HCM patients.
Seven patients of the HCMHI group were identified as carrying the Dutch founder mutation (c.2373dupG) in MYBPC3, the gene encoding the A band protein, cardiac myosin-binding protein-C (cMyBP-C) and twelve patients carried other mutations in MYBPC3, of which three were missense and the remainder were truncations. Patient ages ranged between 21 and 71 years, with a mean (± SD) of 43 (± 15) years, and 79% of these were males. We collected 19 myectomy samples from HCMPP patients carrying a missense mutation. Nine patients presented with mutations in the gene for the cardiac myosin heavy chain (MYH7), the second most commonly mutated gene in HCM patients. Four patients carried mutations in the gene for troponin I (TNNI3), three patients carried troponin T (TNNT2) mutations and two patients carried myosin light chain 2 (MYL2) mutations. The HCMPP patients were aged between 15 and 72 years, with a mean (± SD) of 55 (± 15) years, and 58% of these were males.
Our study included 14 patients with no known sarcomere gene mutation. HCMSMN patient ages ranged between 22 to 74, with a mean (± SD) of age 57 (± 14), and 64% of these were males. Not all the myectomy samples were sufficiently large to perform all the analyses.
Finally, the 52 HCM samples were compared with nine samples of healthy donor hearts that were not used for heart transplantation, mostly because of poor tissue matching against patients in the heart failure clinic of St Vincent’s Hospital. While these controls had no history of cardiac disease, their validity as “controls” was based on their extensive use as such in publications from a wide range of other laboratories. We therefore assumed that these donors are representative of the diverse human population. Consistent with the HCM patients, these donors were 67% male, with a mean age (± SD) of 43 (± 14) years, ranging from 19 to 65. All donor hearts were perfused with ice-cold cardioplegia and transported on ice to the Sydney Heart Bank where ~1 g samples were snap frozen and stored in liquid nitrogen. The average values of the control cardiac samples (n = 9) are indicated by the dotted lines in Figures 1 to 4 and Figure 6. The distribution of the controls is shown in the Supplementary Materials (Figure S1), as well as uncropped full-width images of the membranes (Figure S2). The patients study protocol was approved by the local ethics committees and the donor hearts were approved by the University of Sydney (HREC #7326). All the collections were made with written informed consent obtained from each patient prior to surgery and from the donors’ next of kin.
2.2. Whole Protein Isolation
Frozen tissue was dissected on dry ice and homogenized with RIPA buffer (0.05 M C4H11NO3·HCl pH 8.0, 0.15 M NaCl, 1% IGEPAL CA-630, 0.5% sodium deoxycholate, 1% sodium dodecyl sulfate) using a Tissuelyser II (Qiagen). The lysates were centrifuged and the supernatant was collected and passed through an insulin syringe (Becton Dickinson Microlance needle, 25 gauge). Whole protein lysate was mixed with the 4× Laemmli sample buffer (8% sodium dodecyl sulfate, 40% glycerol, 0.04% bromophenol blue, 0.240 M C4H11NO3·HCl pH 6.8, 10 mM β-mercaptoethanol, 0.01 M NaF, 0.001 M Na3VO4, cOmplete mini protease inhibitor cocktail (Roche)), boiled for 5 min and stored at −80 °C.
2.3. Electrophoresis and Western Blots
Equal amounts of protein (10 µg) were separated on pre-cast SDS-PAGE 4–12% criterion gels (Bio-Rad) and transferred onto nitrocellulose membranes (Bio-Rad). The membranes were blocked in 5% skim milk/1× TBST for 1 h at room temperature and incubated overnight at 4 °C with the following primary antibodies in 3% BSA/1× TBST: mouse anti-acetylated α-tubulin (T7451, Sigma-Aldrich, Saint Louis, MO, USA, mouse anti-α-actinin (A7811, Merck KGaA, Darmstadt, Germany), mouse anti-HSPA1 (ADI-SPA-810, Enzo Life Sciences, Zandhoven, Belgium), mouse anti-HSPA2 (66291-1, Proteintech Group, Rosemont, IL, USA), mouse anti-HSPB1 (ADI-SPA-800, Enzo Life Sciences, Zandhoven, Belgium), rabbit anti-HSPB5 (ADI-SPA-223, Enzo Life Sciences, Zandhoven, Belgium), rabbit anti-HSPB7 (ab150390, Abcam, Cambridge, UK), rabbit anti-HSPD1 (ADI-SPA-805, Enzo Life Sciences, Zandhoven, Belgium), mouse anti-GAPDH (10R-G109a, Fitzgerald Industries International, Acton, MA, USA), mouse anti-LC3B (#2775, Cell Signaling Technology, Danvers, MA, USA), rabbit anti-p62 (#5114, Cell Signaling Technology), mouse anti-α-tubulin (T9026, Sigma-Aldrich), and rabbit anti-ubiquitin (#3933, Cell Signaling Technology). The membranes were incubated for 1 h at room temperature with horseradish peroxidase-conjugated secondary antibody (DakoCytomation, Santa Clara, CA, USA), raised in goat, in 3% BSA/1x TBST. Signals were detected by Amersham Imager 600 (GE Healthcare, Chicago, IL, USA) and quantified by densitometry (ImageQuant TL, GE Healthcare). To correct for loading differences, protein amounts were expressed relative to GAPDH.
2.4. Statistical Analyses
Data were analyzed with SPSS Statistics version 22.0 for Windows (IBM Corporation, Armonk, NY, USA) and GraphPad Prism version 7.0 (GraphPad Software Inc., San Diego, CA, USA). Data in figures are presented as means ± standard errors of the mean (SEM) per group and in the text, data are presented as means ± standard deviations (SD). The distribution of each data set was determined by Q-Q plots and then double checked by Kolmogorov-Smirnov and Shapiro Wilk tests after data collection was completed. Normally distributed data were analyzed with unpaired t-test (comparing 2 groups) and ordinary one-way ANOVA (comparing > 2 groups) with Tukey’s multiple comparisons post-hoc test (comparing ≤ 3 groups) and Dunnett’s multiple comparisons post-hoc test (comparing > 3 groups). To analyze non-parametric data, the Mann-Whitney U test (comparing 2 groups) and the Kruskal-Wallis test with Dunn’s multiple comparisons post-hoc test (comparing > 2 groups) were used. A two-sided p < 0.05 was considered to indicate statistical significance. Multivariate generalized linear model testing (detailed description in the Supplementary Materials) was performed to study the main effects of different mutation groupings, sex, and age at operation on PQC proteins, which were used as dependent variables.
3. Results
3.1. Changes of Protein Quality Control in HCMSMP and HCMSMN
We investigated the expression levels of key PQC proteins to determine if they were altered in patients with HCM at the time of myectomy compared with the levels in LV samples from healthy controls. As the mutant sarcomere proteins may directly affect PQC, we used Western blots to compare myectomy samples from 38 HCMSMP and 14 HCMSMN patients with LV tissue from nine healthy controls that were age- and sex-matched to the HCM samples (Table 1).
3.1.1. HSPs that Stabilize Target Proteins
Dependent on their function, HSPs were classified in two categories: stabilizing HSPs and HSPs with refolding capacity. Stabilizing HSPs (HSPB1 (also known as HSP27), HSPB5 (αB-crystallin), HSPB7 (cardiovascular HSP)) have relatively low molecular weights (15–30 kDa). They stabilize misfolded proteins using an ATP-independent holdase activity, thereby preventing their aggregation (Figure 1A). Compared to controls, the HCMSMP samples expressed significantly higher levels of HSPB1 and HSPB7, while HSPB5 appeared to be unaltered (Figure 1C; Table 2).
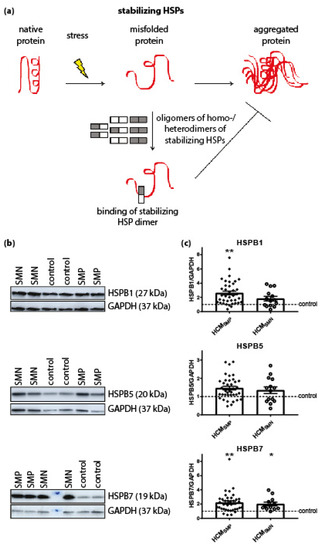
Figure 1.
Stabilizing HSPs. (a) Under stress conditions when native proteins are destabilized and begin to unfold, stabilizing HSPs dissociate from homo- and/or heterogeneous oligomeric complexes into dimers to bind these partially misfolded proteins. Thereby, stabilizing HSPs prevent the aggregation of misfolded proteins. Figure reproduced and adapted with permission from Dorsch, L.M. et al., Pflügers Archiv–European Journal of Physiology; published by Springer Berlin Heidelberg, 2018. (b) Representative blot images for HSPB1, HSPB5, and HSPB7 expression. (c) Higher levels of HSPB1 and HSPB7 in HCMSMP (n = 38) compared to controls. Higher HSPB7 levels in HCMSMN (n = 12) compared to controls (n = 9; average is shown as dotted line). HSPB1 and HSPB5 protein levels were not different in HCMSMP (n = 14) compared to controls. There were no significant differences between HCMSMP and HCMSMN. Each dot in the scatter plots represents an individual sample. * p < 0.05 and ** p < 0.01 versus controls.
Table 2.
Overview of results on statistical testing for differences between controls, HCMSMP and HCMSMN.
We then quantified the protein levels of these stabilizing HSPs (HSPB1, HSPB5 and HSPB7) in HCMSMN samples. Only HSPB7 was significantly higher in HCMSMN compared to controls (Figure 1C; Table 2). Despite this, there were no significant differences in stabilizing HSPs levels between HCMSMP and HCMSMN.
3.1.2. HSPs That Refold Target Proteins
Next we investigated the expression levels of HSPD1 (HSP60), HSPA1 (HSP70 and HSP72) and HSPA2 (HSP70-2) that have an ATP-dependent folding activity. These HSPs have molecular weights >30 kDa and either refold misfolded proteins or assist in their degradation. HSPD1 is mainly located in mitochondria while HSPA1 and HSPA2 are cytosolic, but when they are exposed to heat stress, both translocate to the nucleus [60,61]. Compared to controls, significantly higher levels of HSPD1 and HSPA2 were observed in HCMSMP samples, while HSPA1 levels were not significantly changed. Levels of HSPs with a refolding capacity were not significantly different in HCMSMN compared to controls, although HSPD1 and HSPA2 showed a trend to higher levels. There were no significant differences in HSPs with a refolding capacity between the two HCM groups (Figure 2; Table 2).
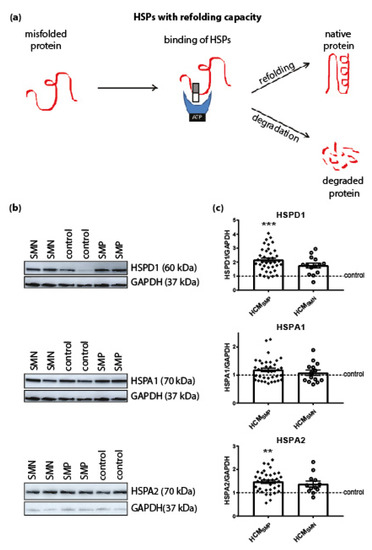
Figure 2.
HSPs with a refolding capacity. (a) HSPs with ATPase activity and stabilizing HSPs bind to the misfolded protein to stabilize and further process it. HSPs with a refolding capacity either refold the misfolded protein to its native structure or, if refolding is impossible, the HSPs assist in the degradation pathways to degrade the misfolded protein. Figure reproduced and adapted with permission from Dorsch, L.M. et al., Pflügers Archiv—European Journal of Physiology, published by Springer Berlin Heidelberg, 2018. (b) Representative blot images for HSPD1, HSPA1, and HSPA2 expression. (c) Higher levels of HSPD1 and HSPA2 in HCMSMP (n = 38) compared to controls. HSPs with refolding capacity were unaltered in HCMSMN (HSPD1, HSPA1: n = 14; HSPA2: n = 12) compared to controls. There were no significant differences between HCMSMP and HCMSMN. Each dot in the scatter plots represents an individual sample. ** p < 0.01 and *** p < 0.001 versus controls.
3.1.3. Degradation of Proteins
PQC is also involved in the degradation of proteins and therefore levels of ubiquitination, p62 and LC3BII were assessed. The antibody used for ubiquitin recognizes polyubiquitinated proteins without distinguishing between K48-linked polyubiquitin chains (predominantly targeted by proteasomal degradation) and K63-linked polyubiquitin chains (targeted by autophagic degradation) [62]. Levels of ubiquitin and the ubiquitin-binding autophagic adaptor protein p62 were unaltered in both HCM groups compared to controls. Levels of the autophagosome marker LC3BII were significantly higher in HCMSMP compared to controls, while only some samples of the HCMSMN group had higher levels of LC3BII (Figure 3, Table 2).
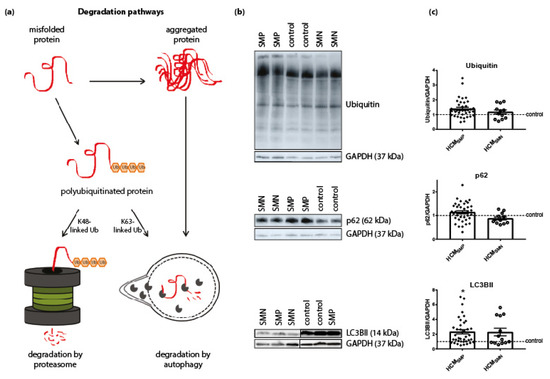
Figure 3.
Degradation pathways. (a) Misfolded proteins with polyubiquitin chains linked via lysine 48 (K48) are mainly degraded by the proteasome. Misfolded proteins carrying K63-linked polyubiquitin chains and aggregated proteins enter the autophagic pathway. Figure reproduced and adapted with permission from Dorsch, L.M. et al., Pflügers Archiv—European Journal of Physiology; published by Springer Berlin Heidelberg, 2018. (b) Representative blot images for ubiquitin, p62, and LC3BII expression. (c) Protein levels of ubiquitin and p62 did not differ between HCM and controls samples. Higher levels of LC3BII in HCMSMP (n = 38) compared to controls. There were no significant differences between HCMSMP and HCMSMN (ubiquitin, p62: n = 12; LC3BII: n = 13). Each dot in the scatter plots represents an individual sample. * p < 0.05 versus controls.
To ensure that the significant differences detected by ANOVA testing were not related to differences in age and/or sex of the myectomy patients, we performed multivariate testing (Wilks’ Lambda test). This test uses age, sex and the HCM grouping (controls, HCMSMP and HCMSMN) as the effects and the HSPs, ubiquitination, p62, and LC3BII as dependent variables. We found an overall significant difference in the levels of key PQC players based on the different mutation groups (Table 3), while sex and age at operation had no significant effect on levels of key PQC players. To determine which of the individual key PQC players differed among groups when taking into account sex and age, we performed tests for between-subjects effects. This test revealed statistically significant differences among groups for HSPB1 and HSPD1 (Table 4).
Table 3.
Multivariate Tests a: HCM grouping (controls, HCMSMP, and HCMSMN), sex and age at operation.
Table 4.
Tests for between-subjects: HCM grouping (controls, HCMSMP, HCMSMN) as an effect and correction for differences in sex and age at operation.
Since we found between-subjects main effects, we performed a contrast analysis to determine significant pairwise differences between controls and the two HCM patient groups corrected for age and sex. A simple main effects analysis revealed significantly higher levels of HSPB1, HSPD1 and HSPA2 in HCMSMP compared to controls (Table 5), while a trend to higher levels of HSPD1 was observed in HCMSMN.
Table 5.
Simple Contrast Results (K Matrix) for HCM grouping (controls, HCMSMP, HCMSMN) as an effect and correction for differences in age at operation and sex.
Overall, our analyses showed increased levels of several HSPs in HCMSMP and HCMSMN compared to controls, while no significant differences between HCMSMP and HCMSMN were observed.
3.2. Changes of Protein Quality Control: HCM Disease Mechanism
All the studied HCMSMP patients were heterozygous for the mutation, implying the potential to produce either or both the mutant and wild-type protein [14]. Either the expression of the mutant protein, which above a threshold (the ‘poison polypeptide’ mechanism) level might become toxic or have an inability to upregulate the haplotype protein levels to meet the needs of the heart (the ‘haploinsufficiency’ mechanism) might underlie HCM [14]. Truncation and missense MYBPC3 mutations usually involve haploinsufficiency as the disease mechanism since total cMyBP-C protein level is lower and the mutant protein has not been detected in human myectomy samples [13,63].
We determined whether key PQC players were differently changed in samples with haploinsufficiency (HI) and poison polypeptide (PP) by comparing 19 MYBPC3 mutation samples (HCMHI) with 19 HCMSMP samples carrying a missense mutation (HCMPP). Proteomics analysis using mass spectrometry revealed significantly lower cMyBP-C protein levels in the HCMHI samples compared to the HCMPP patients, consistent with a protein haploinsufficiency mechanism (Figure 4) [64]. No significant differences in PQC components were observed between HCMHI and HCMPP (Figure 5, Table 6).
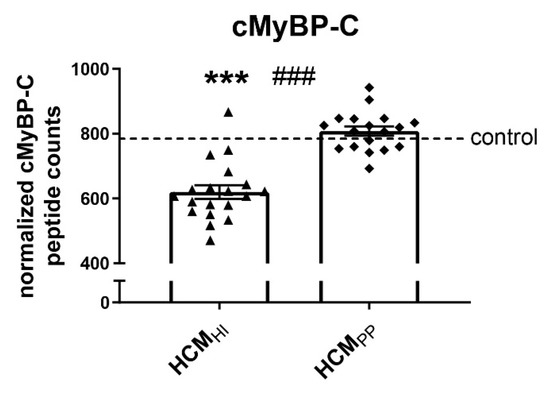
Figure 4.
cMyBP-C haploinsufficiency. Mass spectrometry-based proteomics analysis revealed lower levels of cMyBP-C in HCMHI (n = 19) compared to controls (n = 5) and HCMPP (n = 18). Each dot on the scatter plot represents an individual sample. *** p < 0.001 versus controls and ### p < 0.001 versus HCMPP.
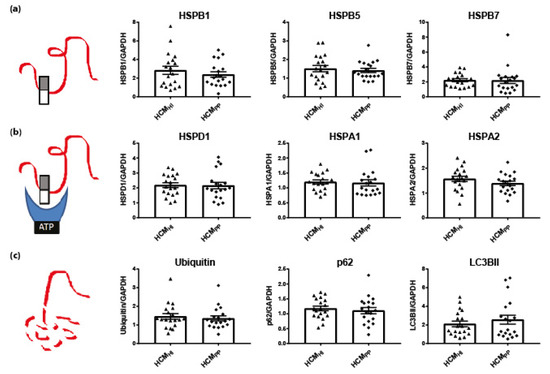
Figure 5.
Pathomechanism of HCM and key PQC players. (a) Stabilizing HSPs (HSPB1, HSPB5, HSPB7), (b) HSPs with refolding capacity (HSPD1, HSPA1 HSPA2) and (c) degradation markers (ubiquitin, p62, LC3BII) were not significantly different between HCMHI (n = 19) and HCMPP (n = 19). Each dot in the scatter plots represents an individual sample. Figure reproduced and adapted with permission from Dorsch, L.M. et al., Pflügers Archiv–European Journal of Physiology; published by Springer Berlin Heidelberg, 2018.
Table 6.
Overview of results on statistical testing for differences between HCMHI and HCMPP.
3.3. Microtubule Network
Microtubule-based transport of proteins is required for autophagy and is thus an essential part of PQC. Acetylation of α-tubulin is associated with stable microtubules and is used as a marker of their stability [65,66]. Mouse models of familial HCM showed higher levels of acetylated α-tubulin [67]. Compared to controls, α-tubulin expression levels were significantly higher in both HCMSMP and HCMSMN (Figure 6A,B; Table 2). In addition, acetylation of α-tubulin was significantly higher in both HCM patient groups compared to controls (Figure 6A,B). The increases in the levels of α-tubulin and acetylated α-tubulin were significantly higher in HCMSMP compared to HCMSMN.
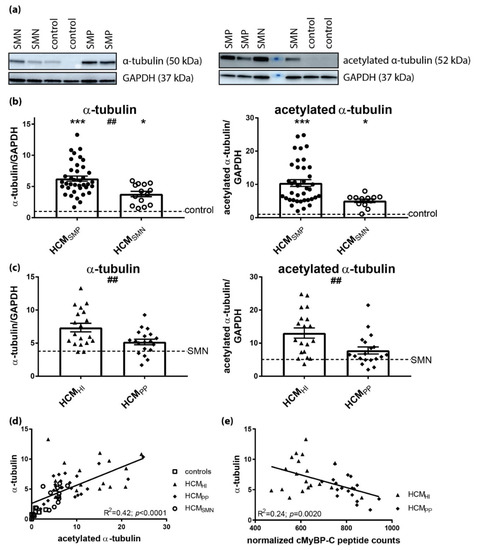
Figure 6.
Pathomechanism of HCM and acetylation of α-tubulin. (a) Representative blot images for α-tubulin and acetylated α-tubulin. (b) Higher levels of α-tubulin and acetylated α-tubulin in HCMSMP (n = 38) and HCMSMN (α-tubulin: n = 14; acetylated α-tubulin: n = 12) compared to controls. Significant difference of α-tubulin levels between HCMSMP and HCMSMN (##p < 0.01). (c) Higher levels of α-tubulin and acetylated α-tubulin in HCMHI (n = 19) than HCMPP (n = 19). (d) The levels of α-tubulin correlated well with acetylated α-tubulin (e) Significant inverse linear correlation of α-tubulin with cMyBP-C. Controls = open squares, HCMSMP = filled circles, HCMSMN = open circles, HCMHI = filled triangles, HCMPP = filled rhomboids. Each dot in the scatter plots and the correlation analyses represents an individual sample. * p < 0.05 and *** p < 0.001 versus controls and ## p < 0.01 and ### p < 0.001 versus HCMPP.
When comparing mutation types, significantly higher levels of α-tubulin and acetylated α-tubulin were observed in HCMHI compared to HCMPP (Figure 6C, Table 6). The levels of acetylated α-tubulin significantly correlated with α-tubulin (Figure 6D), which is in line with the observation that acetylation of α-tubulin compartmentalized on the stable microtubules. Moreover, a significant inverse linear correlation was present between the cMyBP-C protein level and α-tubulin in HCM with a sarcomere gene mutation (Figure 6E). Overall, these data show that the presence of a sarcomere mutation coincides with a more extensive and stabilized microtubule network in HCM.
3.4. Strong Correlation of HSPs with α-tubulin
Since the PQC is strongly linked to the microtubules network, we performed multivariate testing (Wilks’ Lambda test) using levels of α-tubulin, sex, and age at operation as effects and the HSPs, ubiquitination, p62, and LC3BII as dependent variables. There was an overall statistically significant difference in the levels of key PQC players based on the α-tubulin levels (Table 7).
Table 7.
Multivariate Tests a: α-tubulin (all samples), sex, and age at operation.
To determine which of the key PQC players differed when α-tubulin levels changed, we performed tests for between-subjects effects. This test revealed that α-tubulin had a significant effect on all the measured HSPs, but not on the degradation markers (Table 8). The correlation of HSPs and α-tubulin levels is visualized in Figure S3.
Table 8.
Tests for between-subjects: α-tubulin as an effect and correction for differences in sex and age at operation.
4. Discussion
The incomplete penetrance, age-related onset and the large clinical variability in disease severity imply a complex HCM pathophysiology mechanism. Patients with a sarcomere mutation have a particularly higher risk for adverse outcomes. The underlying causes for the difference in disease between HCMSMP and HCMSMN remain unclear.
Here, we determined the protein levels of key PQC players, including HSPs and degradation markers, and the acetylation of α-tubulin by Western blot analysis in a large set of cardiac samples from HCMSMP and HCMSMN patients to define PQC changes in HCM at the time of myectomy, and identified if the presence of a sarcomere mutation mediates changes in PQC mechanisms and tubulin network. One of the limitations of the current study was that patients had a severe phenotype with LVOT obstruction. Therefore, this group may not be representative for all patients with HCM.
The main findings of our PQC assessment were that: (1) several HSPs and autophagy markers were higher in HCM compared to controls, but there are no major differences between HCMSMP and HCMSMN or mutation type (haploinsufficiency versus poison polypeptide) at the time of myectomy, (2) after correction for sex and age at operation, the major increases in HCMSMP compared to controls were observed in the stabilizing HSPB1 and the refolding HSPD1 and HSPA2, (3) the most significant increase compared to control samples was observed in the levels of α-tubulin and acetylated α-tubulin, with significant differences between the mutation groups: HCMHI > HCMPP > HCMSMN, and (4) the levels of α-tubulin significantly correlated with the levels of acetylated α-tubulin and all the HSPs (Figure 7).
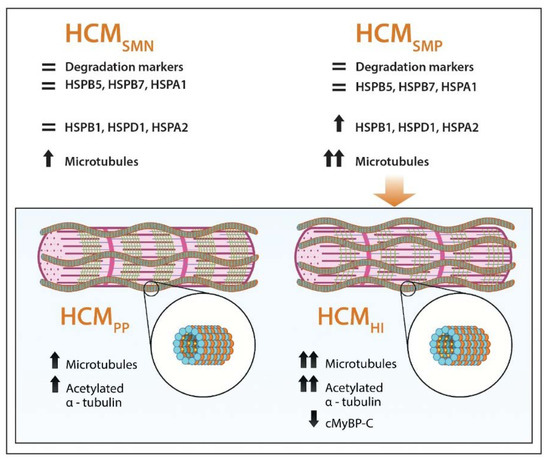
Figure 7.
Schematic representation of PQC and microtubular system assessment in HCM. Our analyses show that HSPB1, HSPD1 HSPA2, α-tubulin and acetylated α-tubulin were increased in HCM, especially when a sarcomere mutation is present, while HSPB5, HSPB7, HSPA1 and degradation markers are not changed in HCM compared to controls. Levels of α-tubulin (orange balls) and acetylated α-tubulin (small yellow balls attached to α-tubulin in the lumen of polymerized microtubules (blue and orange balls)) were more increased when haploinsufficiency (HI), characterized by lower levels of cardiac myosin-binding protein-C (green lines), was the underlying pathomechanism instead of poison polypeptides (PP). =: similar to controls; ↑: significantly increased compared to controls; ↑↑: highly significantly increased compared to controls; ↓: significantly decreased compared to controls.
Overall, our analyses indicate that carrying a HCM-causing mutation affects PQC and α-tubulin acetylation. We propose that reduced levels of cMyBP-C caused by MYBPC3 mutations trigger HSPs and α-tubulin acetylation, and may present a pathomechanism in cMyBP-C haloinsufficiency-mediated HCM. The possible impact of the observed PQC changes is discussed below.
4.1. Elevated Levels of HSPs in Human HCM
We identified higher levels of HSPB1, HSPD1, and HSPA2 in HCMSMP compared to controls, which could not be explained by differences in sex and age at operation (Table 5). Our findings are in line with studies in human end-stage heart failure studies samples, which showed increases in HSPD1 and HSPB1 compared to controls [68].
HSPB1 is implicated in different cardio-protective processes involving interception of misfolded proteins, cytoskeletal organization, anti-apoptotic and anti-oxidant properties [69]. Therefore, its expression may improve the resistance of tissue exposed to stress and injuries [70]. While moderate cardiac expression of HSPB1 protects against doxorubicin-induced cardiac dysfunction through anti-oxidative stress, reports on the effects of HSPB1 overexpression have been inconsistent [71]. Overexpression of HSPB1 conferred protection against myocardial ischemia-reperfusion injury [72], whereas overexpression of HSPB1 caused reductive stress and cardiomyopathy in another study [73]. Further experiments are needed to clarify if the observed increase in HSPB1 is actually beneficial and may be a response to stress exposure.
HSPD1 fulfills multiple tasks in a cell by refolding key proteins after their import into the mitochondria, transporting proteins between the mitochondrial matrix and the cytoplasm of the cell, and binding to cytosolic pro-apoptotic proteins to sequester them [74]. Upregulation of HSPD1 due to mitochondrial impairment is suggested to be an indicator of mitochondrial stress [75]. A total of 15–20% of HSPD1 is located at extra-mitochondrial sites, suggesting important physiological roles at other locations [61]. In human end-stage heart failure, HSPD1 localizes to the plasma membrane, thereby losing anti-apoptotic and protective effects and becoming detrimental to the cell [76]. Impairment of HSPD1-mediated anti-stress response has been reported in dilated cardiomyopathy (DCM) which progressed to end stage heart failure [77]. Here, we identified higher levels of HSPD1, which may indicate mitochondrial stress, as has been reported in HCM [78].
The Western blot analysis showed higher levels of HSPA2 in HCMSMP compared to controls. In our mass-spectrometry-based proteomics study, HSPA2 was highly upregulated in cardiac disease (Figure 8A) [64]. HSPA2 has been reported in heart tissue and low expression was identified in fibroblasts [60,79]. Recently, HSPA-family chaperones have been suggested to interact with cMyBP-C to regulate its turnover [80]. Moreover, a significant inverse linear correlation was present between cMyBP-C protein levels and HSPA2 (Figure 8B). Therefore, HSPA2 may be an additional regulator of cMyBP-C. Further experiments are warranted to explain the role of HSPA2 in haploinsufficiency for cMyBP-C.
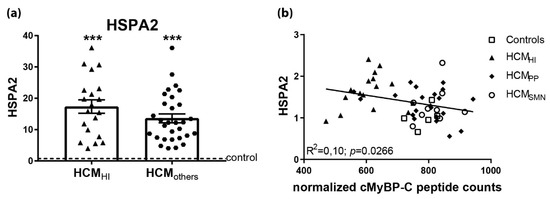
Figure 8.
Upregulated HSPA2 in HCM in proteomics screen. (a) In a mass-spectrometry based proteomics study, HSPA2 levels were higher in HCMHI (n = 20) and HCMothers (n = 30) samples, including HCMPP and HCMSMN, compared to controls (n = 8). (b) Significant inverse correlation of HSPA2 levels, determined by Western blot analysis with cMyBP-C. Controls = open squares, HCMHI = filled triangles, HCMPP = filled rhomboids, HCMSMN = open circles, HCMothers = hexagons. Each dot in the scatter plots and correlation analysis represents an individual sample. *** p < 0.001 versus controls.
In contrast, the levels of the HSPB5 and HSPA1 in HCM samples were not different compared to controls after adjusting for sex and age differences. Several studies have shown that HSPB5 and HSPA1 are both increased early in response to acute hypertrophic signaling, but with opposite functions. While HSPB5 is involved in counteracting acute cardiac remodeling by suppressing hypertrophic signaling pathways, HSPA1 supports pro-hypertrophic signaling pathways [81,82]. The increase of HSPA1 was transient and attenuated 14 days after isoproterenol-infusion in a mouse model for cardiac hypertrophy [82]. Consistent with our findings in myectomy samples from patient with advanced disease, HSPA1 levels were not changed in septal myectomy samples of HCM patients and end-stage heart failure patients compared to controls [68,80]. Increased HSPA1 in the heart protects against acute cardiac stress, but not against chronic cardiac stress [83].
Based on these studies, we propose that HSPB5 and HSPA1 levels were not changed in the HCM myectomy samples because of persistent chronic hypertrophic stimuli leading to their blunted response. Further research is warranted to investigate if the failure to increase HSPB5 implies a loss of responsiveness at advanced disease stage because HSPB5 seems to play a beneficial role in hypertrophic signaling.
4.2. Protein Degradation in HCM
Defects in the turnover of key sarcomere proteins may account for both hypertrophic and functional defects [9]. UPS dysfunction is characterized by the accumulation of ubiquitinated proteins, altered proteasome activity, and changes in expression of UPS proteins or E2 and E3 enzymes [84]. Upon correction for sex and age, no significant changes were observed in the levels of degradation-associated markers in HCM, such as HSPB7, ubiquitin, p62 and LC3BII. Compared to the protein folding-supportive HSPB1 and HSPB5, HSPB7 plays a critical role in preventing protein aggregation [85]. Genetic variants in HSPB7 have been associated with advanced heart failure and systolic dysfunction [86]. In a zebrafish model, HSPB7 was involved in early post-damage processing of large cytoskeletal proteins and the loss of HSPB7 function was accompanied by an increased damaged protein load, protein aggregation and a risk of cardiomyopathy [87]. Due to the use of an antibody recognizing both K48- and K63-linked polyubiquitinated chains, we do not know if the ratio between K48- and K63-linked polyubiquitinated proteins was altered in HCM. Therefore, we cannot draw any conclusion about the functionality of the proteasome, which would be indicated by an increase in K48-linked polyubiquitinated proteins. LC3BII and p62 are both markers for autophagosomes because in selective autophagy, the cargo adapter protein p62 links polyubiquitinated proteins to the autophagic machinery via LC3 [88]. We did not find a change in autophagosome markers, but this finding does not exclude the prospect that the autophagic flux might be impaired. Autophagy has been implicated in the pathogenesis of a wide range of cardiac pathologies [62,88]. Pre-clinical models of pressure overload-induced cardiac hypertrophy showed that the increase of autophagic flux correlated with the degree of hypertrophy and therapeutic inhibition of autophagy was accompanied by reduced amount of fibrosis [89].
Our analysis of protein degradation markers indicates that there is no enhancement of protein degradation pathways at the time of myectomy. This may indicate that boosting protein degradation may actually represent a treatment option to prevent cardiac dysfunction and remodeling.
4.3. Increased Mutation-Dependent Proliferation and Acetylation of α-tubulin
Our protein analyses revealed significantly increased levels of α-tubulin in both HCM groups (Figure 6A), which correlated with an increase in α-tubulin acetylation and the levels of all HSPs. Changes of microtubules distribution occurred at the onset of hypertrophy [90]. In chronically hypertrophied hearts, the increase of microtubules has been shown to be a major cause of contractile defects [91]. Two different hypotheses may explain microtubule densification: (1) microtubules may be involved in myofibrillogenesis and an increase in microtubules would be required when new myofibrils are formed in hypertrophied cardiomyocytes, and (2) microtubules may be intracellular compression-bearing elements needed to cope with increased contractile stress on cardiomyocytes [92,93]. In failing human hearts, the accumulation of microtubules impedes sarcomere motion and contributes to a decreased ventricular compliance [94]. Our results are in line with literature, showing an increase in α-tubulin in the HCM myocardial tissue [95]. The underlying pathomechanism seems to have an effect on extent of increase in α-tubulin and acetylated α-tubulin, since we observed the largest increase in samples with haploinsufficiency for cMyBP-C.
An intact microtubule-based cytoskeleton contributes to the stabilization of myofibril structure in the cardiomyocytes and HSPs may preserve this relationship [96]. Post-chaperonin tubulin-folding cofactors, such as HSPs and other tubulin-associated proteins, regulate the synthesis, transport, and storage of α- and β-tubulin [97]. For instance, HSPA1 binds to native tubulin dimers and microtubules to assist in proper tubulin folding [98]. In addition, HSPB5 prevents the aggregation of tubulin and the chaperone activity is accompanied by the formation of large complexes between HSPB5 and tubulin [99]. We identified that α-tubulin level significantly correlates with all the investigated HSPs.
In addition to HSPs, acetylation of α-tubulin was higher in both HCM groups (Figure 6B). Acetylation of α-tubulin directly tunes the compliance and resilience from mechanical breakage to ensure the persistence of long-lived microtubules [100]. Moreover, acetylation of α-tubulin most often compartmentalizes on the stable microtubules and is suggested to increase the assembly of autophagic cargo along microtubules, thereby initiating augmented autophagic degradation in the heart [101,102]. Interestingly, there is a strong linear relation between acetylated and total α-tubulin levels (Figure 6D). This may suggest hyperacetylation of α-tubulin, which is a common response to several cellular stresses. For example, acetyltransferase induction is triggered by the release of mitochondrial reactive oxygen species (ROS) and by AMP kinase [103,104]. Noteworthily, the underlying pathomechanism (HI versus PP) seems to have an effect on the extent of the increase in α-tubulin and the acetylation of α-tubulin, since we observed the largest increase in samples with haploinsufficiency for cMyBP-C. As such, our analyses suggest that proliferation of the microtubular network represents a pathomechanism in HI-mediated HCM. Based on previous studies [100,101,102,103,104], we propose that the increased tubulin network may function to maintain cellular stability and enhance autophagic flux of damaged proteins, while it may impair contractile function [95,105]. Future studies are warranted to establish this link (cause-consequence) between reduced cMyBP-C protein levels, increased α-tubulin acetylation and cardiomyocyte contractile function and hypertrophy that may underlie initiation and progression of cardiac disease in MYBPC3 mutation carriers.
4.4. Inter-Individual Differences
We observed large inter-individual differences in various key PQC players and tubulin networks, especially in the presence of a sarcomere mutation. This variability may be explained by the large variability among HCM-causing mutations, which may all have a distinct effect on cellular PQC. Most of the mutation sites of proteins affect stability and aggregation but rarely its function [106]. This concept is supported by the fact that HCMHI mutations cause a rather heterogeneous cMyBP-C haploinsufficiency, with some samples having relatively low cMyBP-C, and others having still relatively high protein level. The loss of cMyBP-C levels correlates very well with α-tubulin, thereby supporting the diverse response to a change in sarcomere protein composition in the case of HCMHI. The microtubule response correlates significantly with the expression level of cMyBP-C, and may represent a direct compensation for the loss of cMyBP-C as cMyBP-C is known to have a central regulatory role in myofibril development and stability [107]. In line with this, reduced myofibril density was detected in septal myectomy samples from HCMSMP patients compared to HCMSMN patients [18]. While the excessive microtubular response to cMyBP-C haploinsufficiency may be an attempt to maintain myofibril stability, it may aggravate cardiac dysfunction by altering cytoskeletal mechanical properties [95,105].
5. Conclusions
In summary, our data show that the hypertrophied muscle of HCM patients is characterized by an increased and stabilized tubular network which may be an adaptive response to cardiomyocyte growth. While this compensatory response may aid to stabilize cardiomyocyte architecture, this structural adaption may contribute to a reduced function of the HCM myocardium.
Supplementary Materials
The following are available online at https://www.mdpi.com/2073-4409/8/7/741/s1.
Author Contributions
L.M.D., D.W.D.K., B.J.J.M.B and J.v.d.V. conceived, designed and coordinated the study and wrote the manuscript. L.D. and M.S. performed and/or analyzed the experiments. C.d.R., A.F.L.S., P.L.d.J. and M.M. provided the heart samples and patient data and gave input for the manuscript. All authors reviewed the manuscript.
Funding
We acknowledge the support from the Netherlands Cardiovascular Research Initiative: An initiative with support of the Dutch Heart Foundation, CVON2014-40 DOSIS and CVON-STW2016-14728 AFFIP.
Acknowledgments
We would like to thank Ruud Zaremba for technical assistance with the LC3BII Western blots and Peter van de Ven for statistical analyses.
Conflicts of Interest
The authors declare no conflict of interest.
References
- Semsarian, C.; Ingles, J.; Maron, M.S.; Maron, B.J. New perspectives on the prevalence of hypertrophic cardiomyopathy. J. Am. Coll. Cardiol. 2015, 65, 1249–1254. [Google Scholar] [CrossRef] [PubMed]
- Michels, M.; Olivotto, I.; Asselbergs, F.W.; Van der Velden, J. Life-long tailoring of management for patients with hypertrophic cardiomyopathy: Awareness and decision-making in changing scenarios. Neth. Heart J. 2017, 25, 186–199. [Google Scholar] [CrossRef] [PubMed]
- van der Velden, J.; Stienen, G.J.M. Cardiac disorders and pathophysiology of sarcomeric proteins. Physiol. Rev. 2019, 99, 381–426. [Google Scholar] [CrossRef] [PubMed]
- Maron, B.J.; Olivotto, I.; Spirito, P.; Casey, S.A.; Bellone, P.; Gohman, T.E.; Graham, K.J.; Burton, D.A.; Cecchi, F. Epidemiology of hypertrophic cardiomyopathy-related death: Revisited in a large non-referral-based patient population. Circulation 2000, 102, 858–864. [Google Scholar] [CrossRef] [PubMed]
- Ho, C.Y.; Day, S.M.; Ashley, E.A.; Michels, M.; Pereira, A.C.; Jacoby, D.; Cirino, A.L.; Fox, J.C.; Lakdawala, N.K.; Ware, J.S.; et al. Genotype and lifetime burden of disease in hypertrophic cardiomyopathy: Insights from the sarcomeric human cardiomyopathy registry (share). Circulation 2018, 138, 1387–1398. [Google Scholar] [CrossRef] [PubMed]
- Willis, M.S.; Patterson, C. Proteotoxicity and cardiac dysfunction--alzheimer’s disease of the heart? N. Engl. J. Med. 2013, 368, 455–464. [Google Scholar] [CrossRef]
- Henning, R.H.; Brundel, B. Proteostasis in cardiac health and disease. Nat. Rev. Cardiol. 2017, 14, 637–653. [Google Scholar] [CrossRef]
- Wang, X.; Robbins, J. Heart failure and protein quality control. Circ. Res. 2006, 99, 1315–1328. [Google Scholar] [CrossRef]
- Wang, X.; Su, H.; Ranek, M.J. Protein quality control and degradation in cardiomyocytes. J. Mol. Cell Cardiol. 2008, 45, 11–27. [Google Scholar] [CrossRef]
- Latchman, D.S. Heat shock proteins and cardiac protection. Cardiovasc. Res. 2001, 51, 637–646. [Google Scholar] [CrossRef]
- Tannous, P.; Zhu, H.; Nemchenko, A.; Berry, J.M.; Johnstone, J.L.; Shelton, J.M.; Miller, F.J., Jr.; Rothermel, B.A.; Hill, J.A. Intracellular protein aggregation is a proximal trigger of cardiomyocyte autophagy. Circulation 2008, 117, 3070–3078. [Google Scholar] [CrossRef] [PubMed]
- Sontag, E.M.; Vonk, W.I.M.; Frydman, J. Sorting out the trash: The spatial nature of eukaryotic protein quality control. Curr. Opin. Cell Biol. 2014, 26, 139–146. [Google Scholar] [CrossRef] [PubMed]
- Marston, S.; Copeland, O.; Jacques, A.; Livesey, K.; Tsang, V.; McKenna, W.J.; Jalilzadeh, S.; Carballo, S.; Redwood, C.; Watkins, H. Evidence from human myectomy samples that mybpc3 mutations cause hypertrophic cardiomyopathy through haploinsufficiency. Circ. Res. 2009, 105, 219–222. [Google Scholar] [CrossRef] [PubMed]
- Seidman, J.G.; Seidman, C. The genetic basis for cardiomyopathy: From mutation identification to mechanistic paradigms. Cell 2001, 104, 557–567. [Google Scholar] [CrossRef]
- Vriesendorp, P.A.; Schinkel, A.F.; Soliman, O.I.; Kofflard, M.J.; de Jong, P.L.; van Herwerden, L.A.; Ten Cate, F.J.; Michels, M. Long-term benefit of myectomy and anterior mitral leaflet extension in obstructive hypertrophic cardiomyopathy. Am. J. Cardiol. 2015, 115, 670–675. [Google Scholar] [CrossRef] [PubMed]
- Van Velzen, H.G.; Vriesendorp, P.A.; Oldenburg, R.A.; van Slegtenhorst, M.A.; van der Velden, J.; Schinkel, A.F.L.; Michels, M. Value of genetic testing for the prediction of long-term outcome in patients with hypertrophic cardiomyopathy. Am. J. Cardiol. 2016, 118, 881–887. [Google Scholar] [CrossRef] [PubMed]
- Parbhudayal, R.Y.; Garra, A.R.; Gotte, M.J.W.; Michels, M.; Pei, J.; Harakalova, M.; Asselbergs, F.W.; van Rossum, A.C.; van der Velden, J.; Kuster, D.W.D. Variable cardiac myosin binding protein-c expression in the myofilaments due to mybpc3 mutations in hypertrophic cardiomyopathy. J. Mol. Cell Cardiol. 2018, 123, 59–63. [Google Scholar] [CrossRef] [PubMed]
- Witjas-Paalberends, E.R.; Piroddi, N.; Stam, K.; Van Dijk, S.J.; Oliviera, V.S.; Ferrara, C.; Scellini, B.; Hazebroek, M.; ten Cate, F.J.; van Slegtenhorst, M.; et al. Mutations in myh7 reduce the force generating capacity of sarcomeres in human familial hypertrophic cardiomyopathy. Cardiovasc. Res. 2013, 99, 432–441. [Google Scholar] [CrossRef] [PubMed]
- Witjas-Paalberends, E.R.; Guclu, A.; Germans, T.; Knaapen, P.; Harms, H.J.; Vermeer, A.M.; Christiaans, I.; Wilde, A.A.; Dos Remedios, C.; Lammertsma, A.A.; et al. Gene-specific increase in the energetic cost of contraction in hypertrophic cardiomyopathy caused by thick filament mutations. Cardiovasc. Res. 2014, 103, 248–257. [Google Scholar] [CrossRef] [PubMed]
- Nijenkamp, L.; Bollen, I.A.E.; van Velzen, H.G.; Regan, J.A.; van Slegtenhorst, M.; Niessen, H.W.M.; Schinkel, A.F.L.; Kruger, M.; Poggesi, C.; Ho, C.Y.; et al. Sex differences at the time of myectomy in hypertrophic cardiomyopathy. Circ. Heart Fail. 2018, 11, e004133. [Google Scholar] [CrossRef] [PubMed]
- van Dijk, S.J.; Paalberends, E.R.; Najafi, A.; Michels, M.; Sadayappan, S.; Carrier, L.; Boontje, N.M.; Kuster, D.W.; van Slegtenhorst, M.; Dooijes, D.; et al. Contractile dysfunction irrespective of the mutant protein in human hypertrophic cardiomyopathy with normal systolic function. Circ. Heart Fail. 2012, 5, 36–46. [Google Scholar] [CrossRef] [PubMed]
- Kuster, D.W.; Mulders, J.; Ten Cate, F.J.; Michels, M.; Dos Remedios, C.G.; da Costa Martins, P.A.; van der Velden, J.; Oudejans, C.B. Microrna transcriptome profiling in cardiac tissue of hypertrophic cardiomyopathy patients with mybpc3 mutations. J. Mol. Cell Cardiol. 2013, 65, 59–66. [Google Scholar] [CrossRef] [PubMed]
- Sequeira, V.; Najafi, A.; Wijnker, P.J.; Dos Remedios, C.G.; Michels, M.; Kuster, D.W.; van der Velden, J. Adp-stimulated contraction: A predictor of thin-filament activation in cardiac disease. Proc. Natl. Acad. Sci. USA 2015, 112, E7003–E7012. [Google Scholar] [CrossRef] [PubMed]
- van Dijk, S.J.; Boontje, N.M.; Heymans, M.W.; Ten Cate, F.J.; Michels, M.; Dos Remedios, C.; Dooijes, D.; van Slegtenhorst, M.A.; van der Velden, J.; Stienen, G.J. Preserved cross-bridge kinetics in human hypertrophic cardiomyopathy patients with mybpc3 mutations. Pflug. Arch. 2014, 466, 1619–1633. [Google Scholar] [CrossRef] [PubMed]
- Sequeira, V.; Wijnker, P.J.; Nijenkamp, L.L.; Kuster, D.W.; Najafi, A.; Witjas-Paalberends, E.R.; Regan, J.A.; Boontje, N.; Ten Cate, F.J.; Germans, T.; et al. Perturbed length-dependent activation in human hypertrophic cardiomyopathy with missense sarcomeric gene mutations. Circ. Res. 2013, 112, 1491–1505. [Google Scholar] [CrossRef] [PubMed]
- Witjas-Paalberends, E.R.; Ferrara, C.; Scellini, B.; Piroddi, N.; Montag, J.; Tesi, C.; Stienen, G.J.; Michels, M.; Ho, C.Y.; Kraft, T.; et al. Faster cross-bridge detachment and increased tension cost in human hypertrophic cardiomyopathy with the r403q myh7 mutation. J. Physiol. 2014, 592, 3257–3272. [Google Scholar] [CrossRef]
- Robinson, A.A.; Dunn, M.J.; McCormack, A.; dos Remedios, C.; Rose, M.L. Protective effect of phosphorylated hsp27 in coronary arteries through actin stabilization. J. Mol. Cell Cardiol. 2010, 49, 370–379. [Google Scholar] [CrossRef]
- Polden, J.; McManus, C.A.; Dos Remedios, C.; Dunn, M.J. A 2-d gel reference map of the basic human heart proteome. Proteomics 2011, 11, 3582–3586. [Google Scholar] [CrossRef]
- Narolska, N.A.; Piroddi, N.; Belus, A.; Boontje, N.M.; Scellini, B.; Deppermann, S.; Zaremba, R.; Musters, R.J.; dos Remedios, C.; Jaquet, K.; et al. Impaired diastolic function after exchange of endogenous troponin i with c-terminal truncated troponin i in human cardiac muscle. Circ. Res. 2006, 99, 1012–1020. [Google Scholar] [CrossRef]
- Zhang, P.; Kirk, J.A.; Ji, W.; dos Remedios, C.G.; Kass, D.A.; Van Eyk, J.E.; Murphy, A.M. Multiple reaction monitoring to identify site-specific troponin i phosphorylated residues in the failing human heart. Circulation 2012, 126, 1828–1837. [Google Scholar] [CrossRef]
- Kooij, V.; Zhang, P.; Piersma, S.R.; Sequeira, V.; Boontje, N.M.; Wijnker, P.J.; Jimenez, C.R.; Jaquet, K.E.; dos Remedios, C.; Murphy, A.M.; et al. Pkcalpha-specific phosphorylation of the troponin complex in human myocardium: A functional and proteomics analysis. PLoS ONE 2013, 8, e74847. [Google Scholar] [CrossRef] [PubMed]
- Wijnker, P.J.; Li, Y.; Zhang, P.; Foster, D.B.; dos Remedios, C.; Van Eyk, J.E.; Stienen, G.J.; Murphy, A.M.; van der Velden, J. A novel phosphorylation site, serine 199, in the c-terminus of cardiac troponin i regulates calcium sensitivity and susceptibility to calpain-induced proteolysis. J. Mol. Cell Cardiol. 2015, 82, 93–103. [Google Scholar] [CrossRef] [PubMed]
- Krysiak, J.; Unger, A.; Beckendorf, L.; Hamdani, N.; von Frieling-Salewsky, M.; Redfield, M.M.; Dos Remedios, C.G.; Sheikh, F.; Gergs, U.; Boknik, P.; et al. Protein phosphatase 5 regulates titin phosphorylation and function at a sarcomere-associated mechanosensor complex in cardiomyocytes. Nat. Commun. 2018, 9, 262. [Google Scholar] [CrossRef] [PubMed]
- Gotzmann, M.; Grabbe, S.; Schone, D.; von Frieling-Salewsky, M.; Dos Remedios, C.G.; Strauch, J.; Bechtel, M.; Dietrich, J.W.; Tannapfel, A.; Mugge, A.; et al. Alterations in titin properties and myocardial fibrosis correlate with clinical phenotypes in hemodynamic subgroups of severe aortic stenosis. Jacc. Basic Transl. Sci. 2018, 3, 335–346. [Google Scholar] [CrossRef] [PubMed]
- Kruger, M.; Kotter, S.; Grutzner, A.; Lang, P.; Andresen, C.; Redfield, M.M.; Butt, E.; dos Remedios, C.G.; Linke, W.A. Protein kinase g modulates human myocardial passive stiffness by phosphorylation of the titin springs. Circ. Res. 2009, 104, 87–94. [Google Scholar] [CrossRef] [PubMed]
- Kotter, S.; Gout, L.; Von Frieling-Salewsky, M.; Muller, A.E.; Helling, S.; Marcus, K.; Dos Remedios, C.; Linke, W.A.; Kruger, M. Differential changes in titin domain phosphorylation increase myofilament stiffness in failing human hearts. Cardiovasc. Res. 2013, 99, 648–656. [Google Scholar] [CrossRef] [PubMed]
- Huang, Z.P.; Ding, Y.; Chen, J.; Wu, G.; Kataoka, M.; Hu, Y.; Yang, J.H.; Liu, J.; Drakos, S.G.; Selzman, C.H.; et al. Long non-coding rnas link extracellular matrix gene expression to ischemic cardiomyopathy. Cardiovasc. Res. 2016, 112, 543–554. [Google Scholar] [CrossRef] [PubMed]
- Lin, Z.; Guo, H.; Cao, Y.; Zohrabian, S.; Zhou, P.; Ma, Q.; VanDusen, N.; Guo, Y.; Zhang, J.; Stevens, S.M.; et al. Acetylation of vgll4 regulates hippo-yap signaling and postnatal cardiac growth. Dev. Cell 2016, 39, 466–479. [Google Scholar] [CrossRef] [PubMed]
- Kong, S.W.; Hu, Y.W.; Ho, J.W.; Ikeda, S.; Polster, S.; John, R.; Hall, J.L.; Bisping, E.; Pieske, B.; dos Remedios, C.G.; et al. Heart failure-associated changes in rna splicing of sarcomere genes. Circ. Cardiovasc. Genet. 2010, 3, 138–146. [Google Scholar] [CrossRef] [PubMed]
- Lu, Z.; Xu, X.; Hu, X.; Lee, S.; Traverse, J.H.; Zhu, G.; Fassett, J.; Tao, Y.; Zhang, P.; dos Remedios, C.; et al. Oxidative stress regulates left ventricular pde5 expression in the failing heart. Circulation 2010, 121, 1474–1483. [Google Scholar] [CrossRef] [PubMed]
- Fermin, D.R.; Barac, A.; Lee, S.; Polster, S.P.; Hannenhalli, S.; Bergemann, T.L.; Grindle, S.; Dyke, D.B.; Pagani, F.; Miller, L.W.; et al. Sex and age dimorphism of myocardial gene expression in nonischemic human heart failure. Circ. Cardiovasc. Genet. 2008, 1, 117–125. [Google Scholar] [CrossRef] [PubMed][Green Version]
- McNamara, J.W.; Li, A.; Lal, S.; Bos, J.M.; Harris, S.P.; van der Velden, J.; Ackerman, M.J.; Cooke, R.; Dos Remedios, C.G. Mybpc3 mutations are associated with a reduced super-relaxed state in patients with hypertrophic cardiomyopathy. PLoS ONE 2017, 12, e0180064. [Google Scholar] [CrossRef] [PubMed]
- Montag, J.; Syring, M.; Rose, J.; Weber, A.L.; Ernstberger, P.; Mayer, A.K.; Becker, E.; Keyser, B.; Dos Remedios, C.; Perrot, A.; et al. Intrinsic myh7 expression regulation contributes to tissue level allelic imbalance in hypertrophic cardiomyopathy. J. Muscle Res. Cell Motil. 2017, 38, 291–302. [Google Scholar] [CrossRef] [PubMed]
- Montag, J.; Kowalski, K.; Makul, M.; Ernstberger, P.; Radocaj, A.; Beck, J.; Becker, E.; Tripathi, S.; Keyser, B.; Muhlfeld, C.; et al. Burst-like transcription of mutant and wildtype myh7-alleles as possible origin of cell-to-cell contractile imbalance in hypertrophic cardiomyopathy. Front. Physiol. 2018, 9, 359. [Google Scholar] [CrossRef] [PubMed]
- Iorga, B.; Schwanke, K.; Weber, N.; Wendland, M.; Greten, S.; Piep, B.; Dos Remedios, C.G.; Martin, U.; Zweigerdt, R.; Kraft, T.; et al. Differences in contractile function of myofibrils within human embryonic stem cell-derived cardiomyocytes vs. Adult ventricular myofibrils are related to distinct sarcomeric protein isoforms. Front. Physiol. 2017, 8, 1111. [Google Scholar] [CrossRef]
- Messer, A.E.; Gallon, C.E.; McKenna, W.J.; Dos Remedios, C.G.; Marston, S.B. The use of phosphate-affinity sds-page to measure the cardiac troponin i phosphorylation site distribution in human heart muscle. Proteom. Clin. Appl. 2009, 3, 1371–1382. [Google Scholar] [CrossRef] [PubMed]
- Hoskins, A.C.; Jacques, A.; Bardswell, S.C.; McKenna, W.J.; Tsang, V.; dos Remedios, C.G.; Ehler, E.; Adams, K.; Jalilzadeh, S.; Avkiran, M.; et al. Normal passive viscoelasticity but abnormal myofibrillar force generation in human hypertrophic cardiomyopathy. J. Mol. Cell Cardiol. 2010, 49, 737–745. [Google Scholar] [CrossRef] [PubMed]
- Bayliss, C.R.; Jacques, A.M.; Leung, M.C.; Ward, D.G.; Redwood, C.S.; Gallon, C.E.; Copeland, O.; McKenna, W.J.; Dos Remedios, C.; Marston, S.B.; et al. Myofibrillar ca(2+) sensitivity is uncoupled from troponin i phosphorylation in hypertrophic obstructive cardiomyopathy due to abnormal troponin t. Cardiovasc. Res. 2013, 97, 500–508. [Google Scholar] [CrossRef] [PubMed]
- Messer, A.E.; Bayliss, C.R.; El-Mezgueldi, M.; Redwood, C.S.; Ward, D.G.; Leung, M.C.; Papadaki, M.; Dos Remedios, C.; Marston, S.B. Mutations in troponin t associated with hypertrophic cardiomyopathy increase ca(2+)-sensitivity and suppress the modulation of ca(2+)-sensitivity by troponin i phosphorylation. Arch. Biochem. Biophys. 2016, 601, 113–120. [Google Scholar] [CrossRef] [PubMed]
- Mamidi, R.; Gresham, K.S.; Li, A.; dos Remedios, C.G.; Stelzer, J.E. Molecular effects of the myosin activator omecamtiv mecarbil on contractile properties of skinned myocardium lacking cardiac myosin binding protein-c. J. Mol. Cell Cardiol. 2015, 85, 262–272. [Google Scholar] [CrossRef]
- Mamidi, R.; Li, J.; Gresham, K.S.; Verma, S.; Doh, C.Y.; Li, A.; Lal, S.; Dos Remedios, C.G.; Stelzer, J.E. Dose-dependent effects of the myosin activator omecamtiv mecarbil on cross-bridge behavior and force generation in failing human myocardium. Circ. Heart Fail. 2017, 10. [Google Scholar] [CrossRef] [PubMed]
- Coats, C.J.; Heywood, W.E.; Virasami, A.; Ashrafi, N.; Syrris, P.; Dos Remedios, C.; Treibel, T.A.; Moon, J.C.; Lopes, L.R.; McGregor, C.G.A.; et al. Proteomic analysis of the myocardium in hypertrophic obstructive cardiomyopathy. Circ. Genom. Precis Med. 2018, 11, e001974. [Google Scholar] [CrossRef] [PubMed]
- Mollova, M.; Bersell, K.; Walsh, S.; Savla, J.; Das, L.T.; Park, S.Y.; Silberstein, L.E.; Dos Remedios, C.G.; Graham, D.; Colan, S.; et al. Cardiomyocyte proliferation contributes to heart growth in young humans. Proc. Natl. Acad. Sci. USA 2013, 110, 1446–1451. [Google Scholar] [CrossRef] [PubMed]
- Polizzotti, B.D.; Ganapathy, B.; Walsh, S.; Choudhury, S.; Ammanamanchi, N.; Bennett, D.G.; dos Remedios, C.G.; Haubner, B.J.; Penninger, J.M.; Kuhn, B. Neuregulin stimulation of cardiomyocyte regeneration in mice and human myocardium reveals a therapeutic window. Sci. Transl. Med. 2015, 7, 281ra245. [Google Scholar] [CrossRef] [PubMed]
- Bollen, I.A.E.; Ehler, E.; Fleischanderl, K.; Bouwman, F.; Kempers, L.; Ricke-Hoch, M.; Hilfiker-Kleiner, D.; Dos Remedios, C.G.; Kruger, M.; Vink, A.; et al. Myofilament remodeling and function is more impaired in peripartum cardiomyopathy compared with dilated cardiomyopathy and ischemic heart disease. Am. J. Pathol. 2017, 187, 2645–2658. [Google Scholar] [CrossRef]
- Bergmann, O.; Zdunek, S.; Felker, A.; Salehpour, M.; Alkass, K.; Bernard, S.; Sjostrom, S.L.; Szewczykowska, M.; Jackowska, T.; Dos Remedios, C.; et al. Dynamics of cell generation and turnover in the human heart. Cell 2015, 161, 1566–1575. [Google Scholar] [CrossRef]
- Gomez-Arroyo, J.; Mizuno, S.; Szczepanek, K.; Van Tassell, B.; Natarajan, R.; dos Remedios, C.G.; Drake, J.I.; Farkas, L.; Kraskauskas, D.; Wijesinghe, D.S.; et al. Metabolic gene remodeling and mitochondrial dysfunction in failing right ventricular hypertrophy secondary to pulmonary arterial hypertension. Circ. Heart Fail. 2013, 6, 136–144. [Google Scholar] [CrossRef]
- Martin-Garrido, A.; Biesiadecki, B.J.; Salhi, H.E.; Shaifta, Y.; Dos Remedios, C.G.; Ayaz-Guner, S.; Cai, W.; Ge, Y.; Avkiran, M.; Kentish, J.C. Monophosphorylation of cardiac troponin-i at ser-23/24 is sufficient to regulate cardiac myofibrillar ca(2+) sensitivity and calpain-induced proteolysis. J. Biol. Chem. 2018, 293, 8588–8599. [Google Scholar] [CrossRef]
- Piroddi, N.; Witjas-Paalberends, E.R.; Ferrara, C.; Ferrantini, C.; Vitale, G.; Scellini, B.; Wijnker, P.J.M.; Sequiera, V.; Dooijes, D.; Dos Remedios, C.; et al. The homozygous k280n troponin t mutation alters cross-bridge kinetics and energetics in human hcm. J. Gen. Physiol. 2019, 151, 18–29. [Google Scholar] [CrossRef]
- Brocchieri, L.; Conway de Macario, E.; Macario, A.J. Hsp70 genes in the human genome: Conservation and differentiation patterns predict a wide array of overlapping and specialized functions. Bmc. Evol. Biol. 2008, 8, 19. [Google Scholar] [CrossRef]
- Soltys, B.J.; Gupta, R.S. Immunoelectron microscopic localization of the 60-kda heat shock chaperonin protein (hsp60) in mammalian cells. Exp. Cell Res. 1996, 222, 16–27. [Google Scholar] [CrossRef]
- Dorsch, L.M.; Schuldt, M.; Knezevic, D.; Wiersma, M.; Kuster, D.W.D.; van der Velden, J.; Brundel, B. Untying the knot: Protein quality control in inherited cardiomyopathies. Pflug. Arch. 2018. [Google Scholar] [CrossRef]
- van Dijk, S.J.; Dooijes, D.; dos Remedios, C.; Michels, M.; Lamers, J.M.; Winegrad, S.; Schlossarek, S.; Carrier, L.; ten Cate, F.J.; Stienen, G.J.; et al. Cardiac myosin-binding protein c mutations and hypertrophic cardiomyopathy: Haploinsufficiency, deranged phosphorylation, and cardiomyocyte dysfunction. Circulation 2009, 119, 1473–1483. [Google Scholar] [CrossRef]
- Schuldt, M.; Pei, J.; Harakalova, M.; Dorsch, L.M.; Mokry, M.; Knol, J.C.; Pham, T.V.; Schelfhorst, T.; Piersma, S.R.; dos Remedios, C.; et al. Detyrosinated tubulin as treatment target in genetic heart disease: Proteomic and functional studies in hypertrophic cardiomyopathy. Status: Manuscript in preparation.
- Matsuyama, A.; Shimazu, T.; Sumida, Y.; Saito, A.; Yoshimatsu, Y.; Seigneurin-Berny, D.; Osada, H.; Komatsu, Y.; Nishino, N.; Khochbin, S.; et al. In vivo destabilization of dynamic microtubules by hdac6-mediated deacetylation. Embo J. 2002, 21, 6820–6831. [Google Scholar] [CrossRef]
- Hubbert, C.; Guardiola, A.; Shao, R.; Kawaguchi, Y.; Ito, A.; Nixon, A.; Yoshida, M.; Wang, X.F.; Yao, T.P. Hdac6 is a microtubule-associated deacetylase. Nature 2002, 417, 455–458. [Google Scholar] [CrossRef]
- Ng, D.C.; Ng, I.H.; Yeap, Y.Y.; Badrian, B.; Tsoutsman, T.; McMullen, J.R.; Semsarian, C.; Bogoyevitch, M.A. Opposing actions of extracellular signal-regulated kinase (erk) and signal transducer and activator of transcription 3 (stat3) in regulating microtubule stabilization during cardiac hypertrophy. J. Biol. Chem. 2011, 286, 1576–1587. [Google Scholar] [CrossRef]
- Knowlton, A.A.; Kapadia, S.; Torre-Amione, G.; Durand, J.B.; Bies, R.; Young, J.; Mann, D.L. Differential expression of heat shock proteins in normal and failing human hearts. J. Mol. Cell Cardiol. 1998, 30, 811–818. [Google Scholar] [CrossRef]
- Benjamin, I.J.; McMillan, D.R. Stress (heat shock) proteins: Molecular chaperones in cardiovascular biology and disease. Circ. Res. 1998, 83, 117–132. [Google Scholar] [CrossRef]
- Arrigo, A.P. Mammalian hspb1 (hsp27) is a molecular sensor linked to the physiology and environment of the cell. Cell Stress Chaperones 2017, 22, 517–529. [Google Scholar] [CrossRef]
- Liu, L.; Zhang, X.; Qian, B.; Min, X.; Gao, X.; Li, C.; Cheng, Y.; Huang, J. Over-expression of heat shock protein 27 attenuates doxorubicin-induced cardiac dysfunction in mice. Eur. J. Heart Fail. 2007, 9, 762–769. [Google Scholar] [CrossRef]
- Efthymiou, C.A.; Mocanu, M.M.; de Belleroche, J.; Wells, D.J.; Latchmann, D.S.; Yellon, D.M. Heat shock protein 27 protects the heart against myocardial infarction. Basic Res. Cardiol. 2004, 99, 392–394. [Google Scholar] [CrossRef]
- Zhang, X.; Min, X.; Li, C.; Benjamin, I.J.; Qian, B.; Zhang, X.; Ding, Z.; Gao, X.; Yao, Y.; Ma, Y.; et al. Involvement of reductive stress in the cardiomyopathy in transgenic mice with cardiac-specific overexpression of heat shock protein 27. Hypertension 2010, 55, 1412–1417. [Google Scholar] [CrossRef]
- Knowlton, A.A.; Srivatsa, U. Heat-shock protein 60 and cardiovascular disease: A paradoxical role. Future Cardiol. 2008, 4, 151–161. [Google Scholar] [CrossRef]
- Pellegrino, M.W.; Nargund, A.M.; Haynes, C.M. Signaling the mitochondrial unfolded protein response. Biochim. Biophys. Acta 2013, 1833, 410–416. [Google Scholar] [CrossRef]
- Lin, L.; Kim, S.C.; Wang, Y.; Gupta, S.; Davis, B.; Simon, S.I.; Torre-Amione, G.; Knowlton, A.A. Hsp60 in heart failure: Abnormal distribution and role in cardiac myocyte apoptosis. Am. J. Physiol. Heart Circ. Physiol. 2007, 293, H2238–H2247. [Google Scholar] [CrossRef]
- Sidorik, L.; Kyyamova, R.; Bobyk, V.; Kapustian, L.; Rozhko, O.; Vigontina, O.; Ryabenko, D.; Danko, I.; Maksymchuk, O.; Kovalenko, V.N.; et al. Molecular chaperone, hsp60, and cytochrome p450 2e1 co-expression in dilated cardiomyopathy. Cell Biol. Int. 2005, 29, 51–55. [Google Scholar] [CrossRef]
- Unno, K.; Isobe, S.; Izawa, H.; Cheng, X.W.; Kobayashi, M.; Hirashiki, A.; Yamada, T.; Harada, K.; Ohshima, S.; Noda, A.; et al. Relation of functional and morphological changes in mitochondria to myocardial contractile and relaxation reserves in asymptomatic to mildly symptomatic patients with hypertrophic cardiomyopathy. Eur. Heart J. 2009, 30, 1853–1862. [Google Scholar] [CrossRef]
- Roux, A.F.; Nguyen, V.T.; Squire, J.A.; Cox, D.W. A heat shock gene at 14q22: Mapping and expression. Hum. Mol. Genet. 1994, 3, 1819–1822. [Google Scholar] [CrossRef]
- Glazier, A.A.; Hafeez, N.; Mellacheruvu, D.; Basrur, V.; Nesvizhskii, A.I.; Lee, L.M.; Shao, H.; Tang, V.; Yob, J.M.; Gestwicki, J.E.; et al. Hsc70 is a chaperone for wild-type and mutant cardiac myosin binding protein c. JCI Insight 2018, 3. [Google Scholar] [CrossRef]
- Kumarapeli, A.R.; Su, H.; Huang, W.; Tang, M.; Zheng, H.; Horak, K.M.; Li, M.; Wang, X. Alpha b-crystallin suppresses pressure overload cardiac hypertrophy. Circ. Res. 2008, 103, 1473–1482. [Google Scholar] [CrossRef]
- Kee, H.J.; Eom, G.H.; Joung, H.; Shin, S.; Kim, J.R.; Cho, Y.K.; Choe, N.; Sim, B.W.; Jo, D.; Jeong, M.H.; et al. Activation of histone deacetylase 2 by inducible heat shock protein 70 in cardiac hypertrophy. Circ. Res. 2008, 103, 1259–1269. [Google Scholar] [CrossRef]
- Bernardo, B.C.; Weeks, K.L.; Patterson, N.L.; McMullen, J.R. Hsp70: Therapeutic potential in acute and chronic cardiac disease settings. Future Med. Chem. 2016, 8, 2177–2183. [Google Scholar] [CrossRef]
- Day, S.M. The ubiquitin proteasome system in human cardiomyopathies and heart failure. Am. J. Physiol. Heart Circ. Physiol. 2013, 304, H1283–H1293. [Google Scholar] [CrossRef]
- Vos, M.J.; Zijlstra, M.P.; Kanon, B.; van Waarde-Verhagen, M.A.; Brunt, E.R.; Oosterveld-Hut, H.M.; Carra, S.; Sibon, O.C.; Kampinga, H.H. Hspb7 is the most potent polyq aggregation suppressor within the hspb family of molecular chaperones. Hum. Mol. Genet. 2010, 19, 4677–4693. [Google Scholar] [CrossRef]
- Villard, E.; Perret, C.; Gary, F.; Proust, C.; Dilanian, G.; Hengstenberg, C.; Ruppert, V.; Arbustini, E.; Wichter, T.; Germain, M.; et al. A genome-wide association study identifies two loci associated with heart failure due to dilated cardiomyopathy. Eur. Heart J. 2011, 32, 1065–1076. [Google Scholar] [CrossRef]
- Mercer, E.J.; Lin, Y.F.; Cohen-Gould, L.; Evans, T. Hspb7 is a cardioprotective chaperone facilitating sarcomeric proteostasis. Dev. Biol. 2018, 435, 41–55. [Google Scholar] [CrossRef]
- Lavandero, S.; Troncoso, R.; Rothermel, B.A.; Martinet, W.; Sadoshima, J.; Hill, J.A. Cardiovascular autophagy: Concepts, controversies, and perspectives. Autophagy 2013, 9, 1455–1466. [Google Scholar] [CrossRef]
- Weng, L.Q.; Zhang, W.B.; Ye, Y.; Yin, P.P.; Yuan, J.; Wang, X.X.; Kang, L.; Jiang, S.S.; You, J.Y.; Wu, J.; et al. Aliskiren ameliorates pressure overload-induced heart hypertrophy and fibrosis in mice. Acta Pharm. Sin. 2014, 35, 1005–1014. [Google Scholar] [CrossRef]
- Samuel, J.L.; Bertier, B.; Bugaisky, L.; Marotte, F.; Swynghedauw, B.; Schwartz, K.; Rappaport, L. Different distributions of microtubules, desmin filaments and isomyosins during the onset of cardiac hypertrophy in the rat. Eur. J. Cell Biol. 1984, 34, 300–306. [Google Scholar]
- Tagawa, H.; Rozich, J.D.; Tsutsui, H.; Narishige, T.; Kuppuswamy, D.; Sato, H.; McDermott, P.J.; Koide, M.; Cooper, G.t. Basis for increased microtubules in pressure-hypertrophied cardiocytes. Circulation 1996, 93, 1230–1243. [Google Scholar] [CrossRef]
- Stamenovic, D.; Mijailovich, S.M.; Tolic-Norrelykke, I.M.; Chen, J.; Wang, N. Cell prestress. Ii. Contribution of microtubules. Am. J. Physiol. Cell Physiol. 2002, 282, C617–C624. [Google Scholar] [CrossRef]
- Watkins, S.C.; Samuel, J.L.; Marotte, F.; Bertier-Savalle, B.; Rappaport, L. Microtubules and desmin filaments during onset of heart hypertrophy in rat: A double immunoelectron microscope study. Circ. Res. 1987, 60, 327–336. [Google Scholar] [CrossRef]
- Heling, A.; Zimmermann, R.; Kostin, S.; Maeno, Y.; Hein, S.; Devaux, B.; Bauer, E.; Klovekorn, W.P.; Schlepper, M.; Schaper, W.; et al. Increased expression of cytoskeletal, linkage, and extracellular proteins in failing human myocardium. Circ. Res. 2000, 86, 846–853. [Google Scholar] [CrossRef]
- Robison, P.; Caporizzo, M.A.; Ahmadzadeh, H.; Bogush, A.I.; Chen, C.Y.; Margulies, K.B.; Shenoy, V.B.; Prosser, B.L. Detyrosinated microtubules buckle and bear load in contracting cardiomyocytes. Science 2016, 352, aaf0659. [Google Scholar] [CrossRef]
- Decker, R.S.; Decker, M.L.; Nakamura, S.; Zhao, Y.S.; Hedjbeli, S.; Harris, K.R.; Klocke, F.J. Hsc73-tubulin complex formation during low-flow ischemia in the canine myocardium. Am. J. Physiol. Heart Circ. Physiol. 2002, 283, H1322–H1333. [Google Scholar] [CrossRef]
- Lopez-Fanarraga, M.; Avila, J.; Guasch, A.; Coll, M.; Zabala, J.C. Review: Postchaperonin tubulin folding cofactors and their role in microtubule dynamics. J. Struct Biol. 2001, 135, 219–229. [Google Scholar] [CrossRef]
- Sanchez, C.; Padilla, R.; Paciucci, R.; Zabala, J.C.; Avila, J. Binding of heat-shock protein 70 (hsp70) to tubulin. Arch Biochem. Biophys. 1994, 310, 428–432. [Google Scholar] [CrossRef]
- Ohto-Fujita, E.; Fujita, Y.; Atomi, Y. Analysis of the alphab-crystallin domain responsible for inhibiting tubulin aggregation. Cell Stress Chaperones 2007, 12, 163–171. [Google Scholar] [CrossRef]
- Xu, Z.; Schaedel, L.; Portran, D.; Aguilar, A.; Gaillard, J.; Marinkovich, M.P.; Thery, M.; Nachury, M.V. Microtubules acquire resistance from mechanical breakage through intralumenal acetylation. Science 2017, 356, 328–332. [Google Scholar] [CrossRef]
- Geeraert, C.; Ratier, A.; Pfisterer, S.G.; Perdiz, D.; Cantaloube, I.; Rouault, A.; Pattingre, S.; Proikas-Cezanne, T.; Codogno, P.; Pous, C. Starvation-induced hyperacetylation of tubulin is required for the stimulation of autophagy by nutrient deprivation. J. Biol. Chem. 2010, 285, 24184–24194. [Google Scholar] [CrossRef]
- McLendon, P.M.; Ferguson, B.S.; Osinska, H.; Bhuiyan, M.S.; James, J.; McKinsey, T.A.; Robbins, J. Tubulin hyperacetylation is adaptive in cardiac proteotoxicity by promoting autophagy. Proc. Natl. Acad. Sci. USA 2014, 111, E5178–E5186. [Google Scholar] [CrossRef] [PubMed]
- Mackeh, R.; Lorin, S.; Ratier, A.; Mejdoubi-Charef, N.; Baillet, A.; Bruneel, A.; Hamai, A.; Codogno, P.; Pous, C.; Perdiz, D. Reactive oxygen species, amp-activated protein kinase, and the transcription cofactor p300 regulate alpha-tubulin acetyltransferase-1 (alphatat-1/mec-17)-dependent microtubule hyperacetylation during cell stress. J. Biol. Chem. 2014, 289, 11816–11828. [Google Scholar] [CrossRef] [PubMed]
- Li, L.; Yang, X.J. Tubulin acetylation: Responsible enzymes, biological functions and human diseases. Cell Mol. Life Sci. 2015, 72, 4237–4255. [Google Scholar] [CrossRef] [PubMed]
- Caporizzo, M.A.; Chen, C.Y.; Salomon, A.K.; Margulies, K.B.; Prosser, B.L. Microtubules provide a viscoelastic resistance to myocyte motion. Biophys. J. 2018, 115, 1796–1807. [Google Scholar] [CrossRef]
- DePristo, M.A.; Weinreich, D.M.; Hartl, D.L. Missense meanderings in sequence space: A biophysical view of protein evolution. Nat. Rev. Genet. 2005, 6, 678–687. [Google Scholar] [CrossRef] [PubMed]
- Ehler, E.; Gautel, M. The sarcomere and sarcomerogenesis. Adv. Exp. Med. Biol. 2008, 642, 1–14. [Google Scholar]
© 2019 by the authors. Licensee MDPI, Basel, Switzerland. This article is an open access article distributed under the terms and conditions of the Creative Commons Attribution (CC BY) license (http://creativecommons.org/licenses/by/4.0/).