GEDS: A Gene Expression Display Server for mRNAs, miRNAs and Proteins


Abstract
1. Introduction
2. Data Sources and Implementation
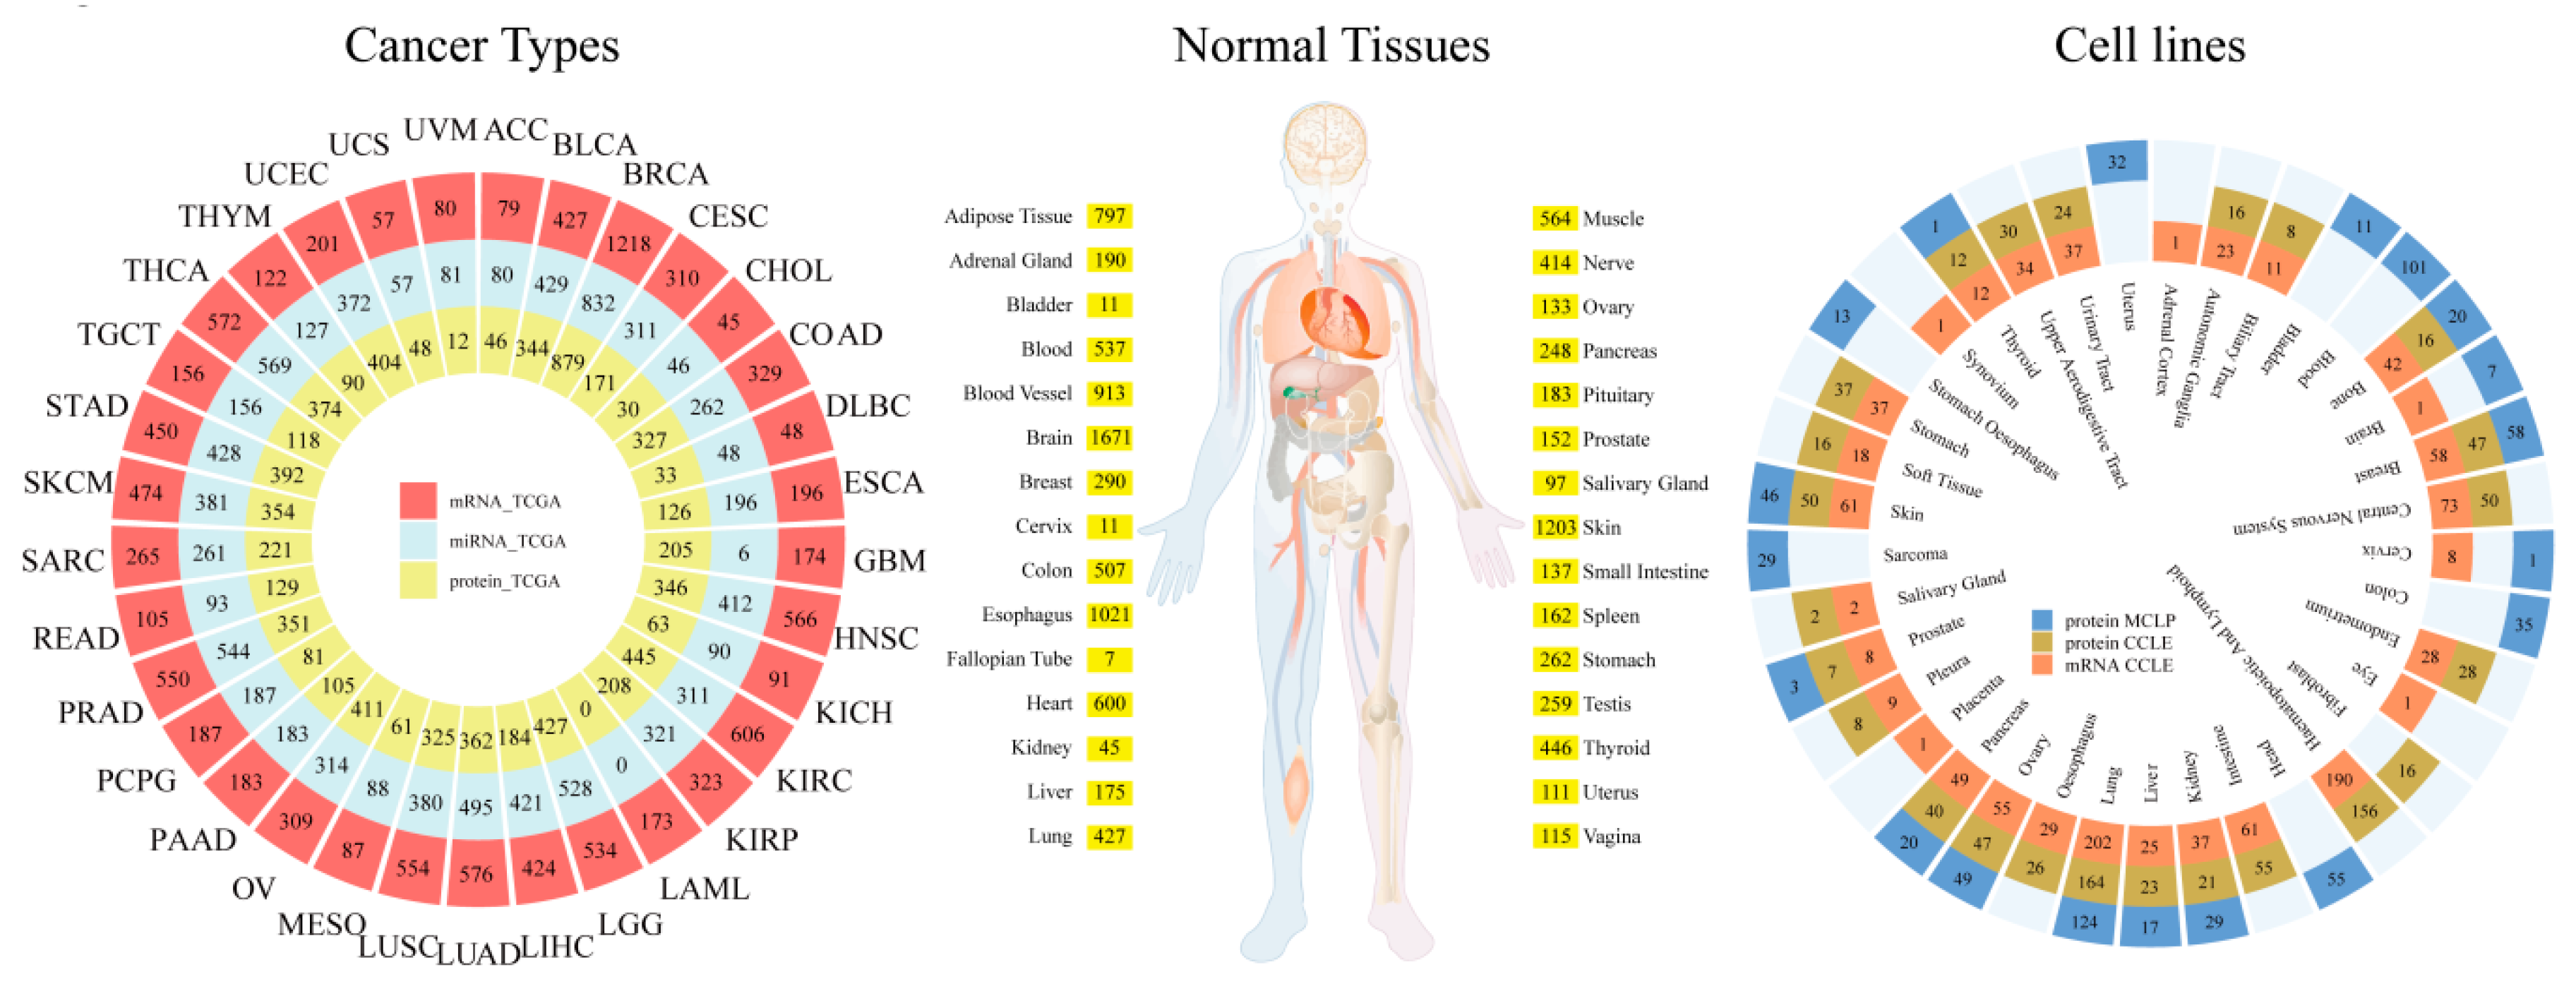
2.1. Data Curation
2.2. User Interface
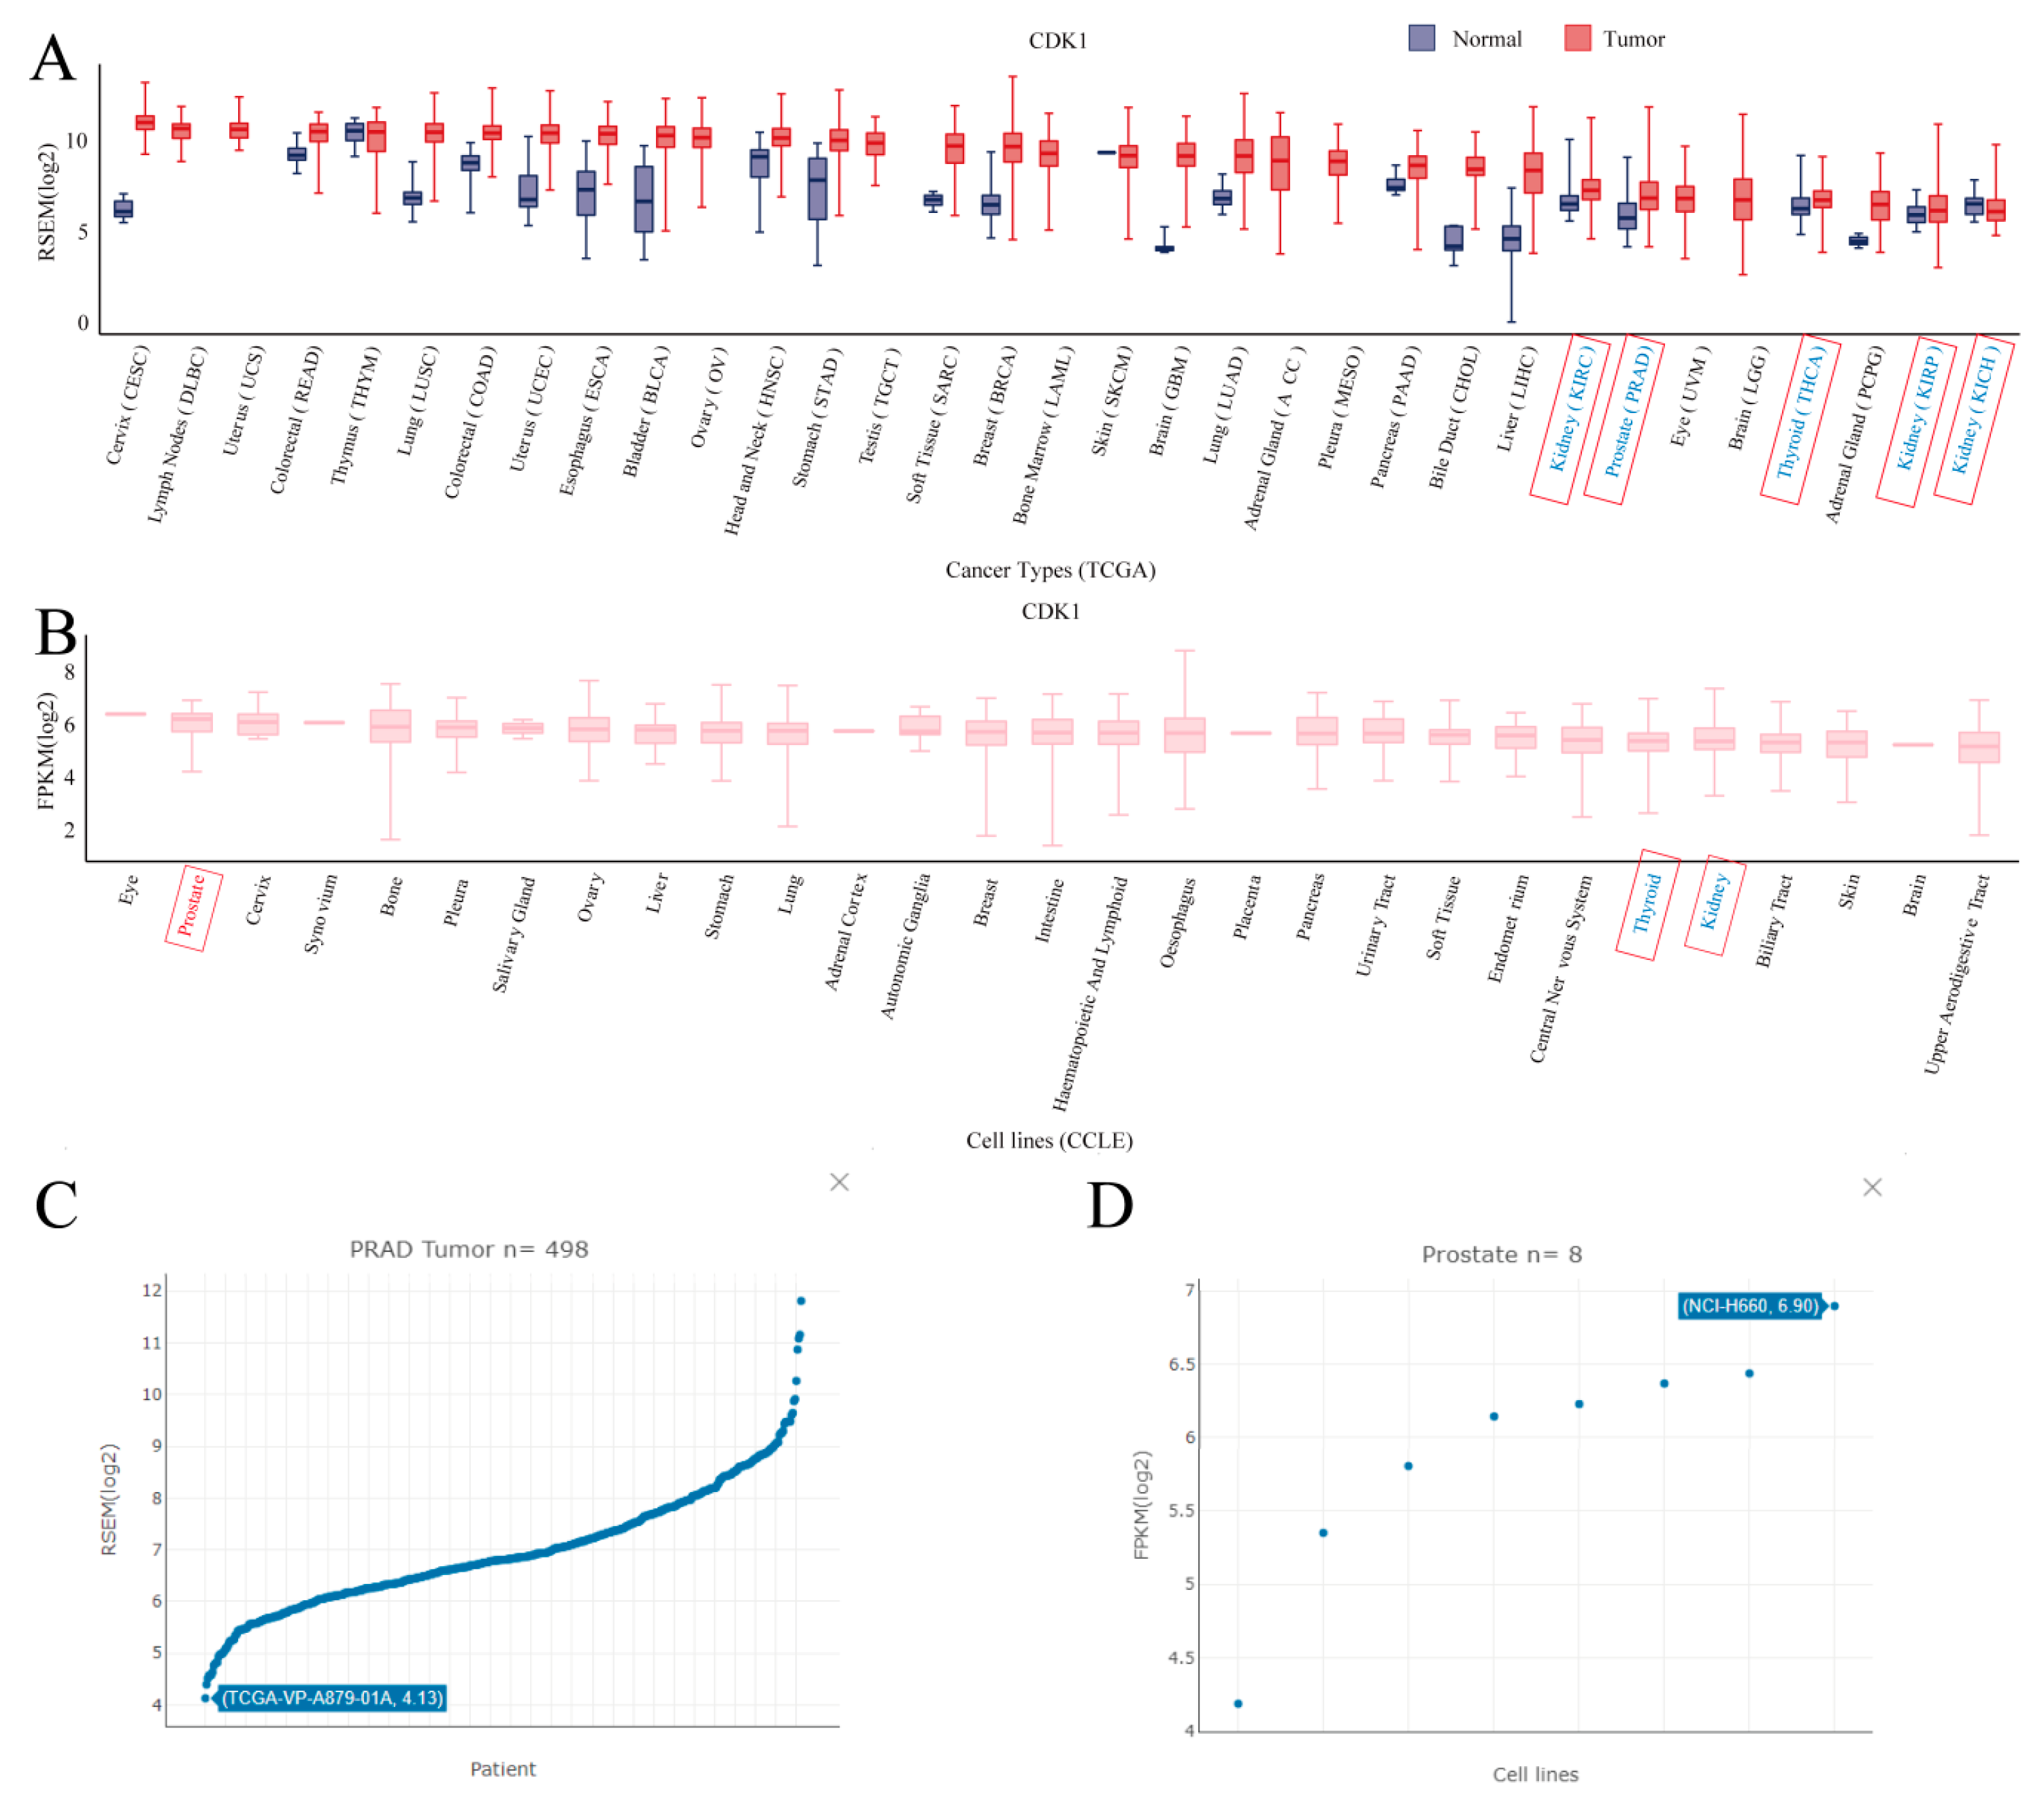
3. Use Case
4. Discussion
Author Contributions
Funding
Conflicts of Interest
References
- Wang, Z.; Gerstein, M.; Snyder, M. RNA-Seq: A revolutionary tool for transcriptomics. Nat. Rev. Genet. 2009, 10, 57–63. [Google Scholar] [CrossRef] [PubMed]
- O’Mahony, F.C.; Nanda, J.; Laird, A.; Mullen, P.; Caldwell, H.; Overton, I.M.; Eory, L.; O’Donnell, M.; Faratian, D.; Powles, T.; et al. The Use of Reverse Phase Protein Arrays (RPPA) to Explore Protein Expression Variation within Individual Renal Cell Cancers. J. Vis. Exp. 2013. [Google Scholar] [CrossRef] [PubMed]
- Weinstein, J.N.; Collisson, E.A.; Mills, G.B.; Shaw, K.M.; Ozenberger, B.A.; Ellrott, K.; Shmulevich, I.; Sander, C.; Stuart, J.M. The Cancer Genome Atlas Pan-Cancer Analysis Project. Nat. Genet. 2013, 45, 1113–1120. [Google Scholar] [CrossRef] [PubMed]
- The Genotype-Tissue Expression (GTEx) pilot analysis: Multitissue gene regulation in humans. Science 2015, 348, 648–660. [CrossRef] [PubMed]
- Ghandi, M.; Huang, F.W.; Jané-Valbuena, J.; Kryukov, G.V.; Lo, C.C.; McDonald, E.R.; Barretina, J.; Gelfand, E.T.; Bielski, C.M.; Li, H.; et al. Next-generation characterization of the Cancer Cell Line Encyclopedia. Nature 2019, 569, 503–508. [Google Scholar] [CrossRef] [PubMed]
- Li, J.; Zhao, W.; Akbani, R.; Liu, W.; Ju, Z.; Ling, S.; Vellano, C.P.; Roebuck, P.; Yu, Q.; Eterovic, A.K.; et al. Characterization of Human Cancer Cell Lines by Reverse-Phase Protein Arrays. Cancer Cell 2017, 31, 225–239. [Google Scholar] [CrossRef] [PubMed]
- Liu, C.-J.; Hu, F.-F.; Xia, M.-X.; Han, L.; Zhang, Q.; Guo, A.-Y. GSCALite: A web server for gene set cancer analysis. Bioinformatics 2018, 34, 3771–3772. [Google Scholar] [CrossRef] [PubMed]
- Cerami, E.; Gao, J.; Dogrusoz, U.; Gross, B.E.; Sumer, S.O.; Aksoy, B.A.; Jacobsen, A.; Byrne, C.J.; Heuer, M.L.; Larsson, E.; et al. The cBio cancer genomics portal: An open platform for exploring multidimensional cancer genomics data. Cancer Discov. 2012, 2, 401–404. [Google Scholar] [CrossRef] [PubMed]
- Petryszak, R.; Keays, M.; Tang, Y.A.; Fonseca, N.A.; Barrera, E.; Burdett, T.; Füllgrabe, A.; Fuentes, A.M.-P.; Jupp, S.; Koskinen, S.; et al. Expression Atlas update--an integrated database of gene and protein expression in humans, animals and plants. Nucleic Acids Res. 2016, 44, D746–D752. [Google Scholar] [CrossRef] [PubMed]
- Tang, Z.; Li, C.; Kang, B.; Gao, G.; Li, C.; Zhang, Z. GEPIA: A web server for cancer and normal gene expression profiling and interactive analyses. Nucleic Acids Res. 2017, 45, W98–W102. [Google Scholar] [CrossRef] [PubMed]
- Liu, K.; Newbury, P.A.; Glicksberg, B.S.; Zeng, W.Z.D.; Paithankar, S.; Andrechek, E.R.; Chen, B. Evaluating cell lines as models for metastatic breast cancer through integrative analysis of genomic data. Nat. Commun. 2019, 10, 2138. [Google Scholar] [CrossRef] [PubMed]


© 2019 by the authors. Licensee MDPI, Basel, Switzerland. This article is an open access article distributed under the terms and conditions of the Creative Commons Attribution (CC BY) license (http://creativecommons.org/licenses/by/4.0/).
Share and Cite
Xia, M.; Liu, C.-J.; Zhang, Q.; Guo, A.-Y. GEDS: A Gene Expression Display Server for mRNAs, miRNAs and Proteins. Cells 2019, 8, 675. https://doi.org/10.3390/cells8070675
Xia M, Liu C-J, Zhang Q, Guo A-Y. GEDS: A Gene Expression Display Server for mRNAs, miRNAs and Proteins. Cells. 2019; 8(7):675. https://doi.org/10.3390/cells8070675
Chicago/Turabian StyleXia, Mengxuan, Chun-Jie Liu, Qiong Zhang, and An-Yuan Guo. 2019. "GEDS: A Gene Expression Display Server for mRNAs, miRNAs and Proteins" Cells 8, no. 7: 675. https://doi.org/10.3390/cells8070675
APA StyleXia, M., Liu, C.-J., Zhang, Q., & Guo, A.-Y. (2019). GEDS: A Gene Expression Display Server for mRNAs, miRNAs and Proteins. Cells, 8(7), 675. https://doi.org/10.3390/cells8070675