Pooling of Patient-Derived Mesenchymal Stromal Cells Reduces Inter-Individual Confounder-Associated Variation without Negative Impact on Cell Viability, Proliferation and Osteogenic Differentiation


Abstract
1. Introduction
2. Materials and Methods
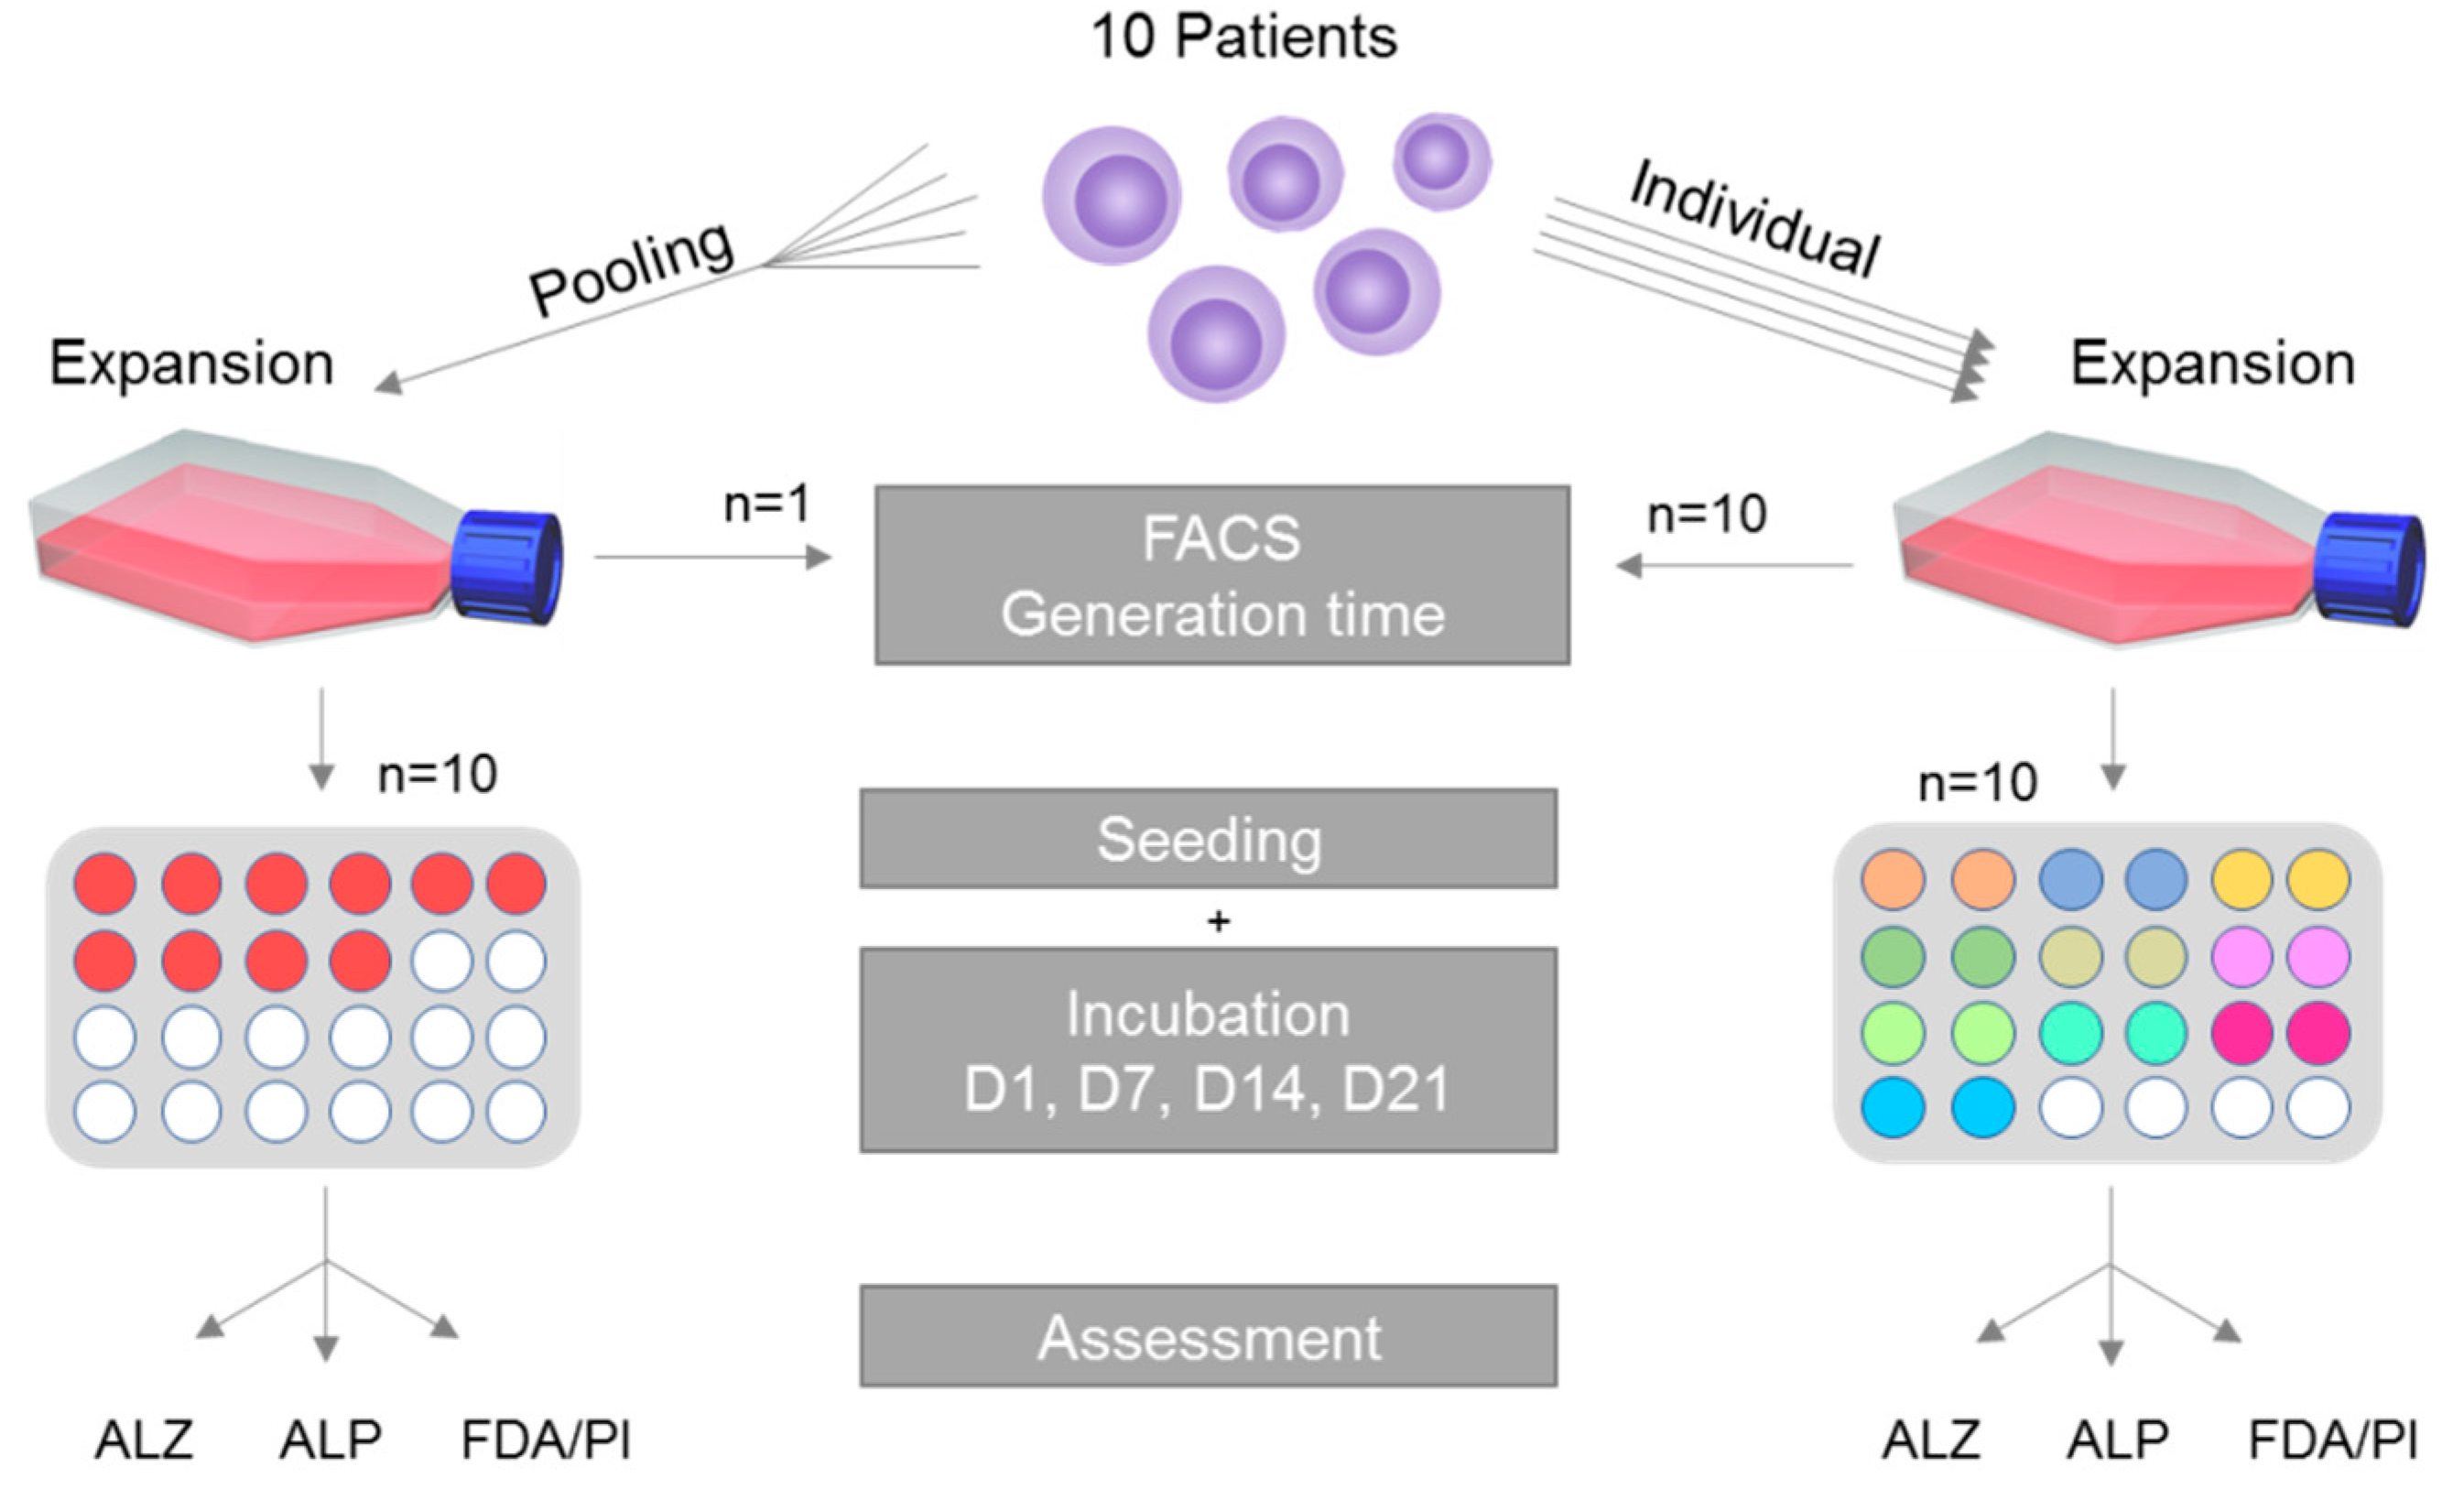
2.1. Study Overview
2.2. Study Ethics, Demography of Donor Patients and Primary Cell Culture
2.3. Single Cultivation, Pooled Cultivation and Generation Time
2.4. Cell Characterization
2.4.1. Flow Cytometry
2.4.2. Adipogenic Differentiation
2.4.3. Chondrogenic Differentiation
2.5. Osteogenic Differentiation: General Culture Setting
2.6. Osteogenic Differentiation: Quantification of Alkaline Phosphatase (ALP) Activity
2.7. Osteogenic Differentiation: Quantification of Extracellular Calcium Depositions
2.8. Osteogenic Differentiation: Evaluation of Cell Proliferation, Growth Patterns and Viability
2.9. Statistics
3. Results
3.1. Patient Collective
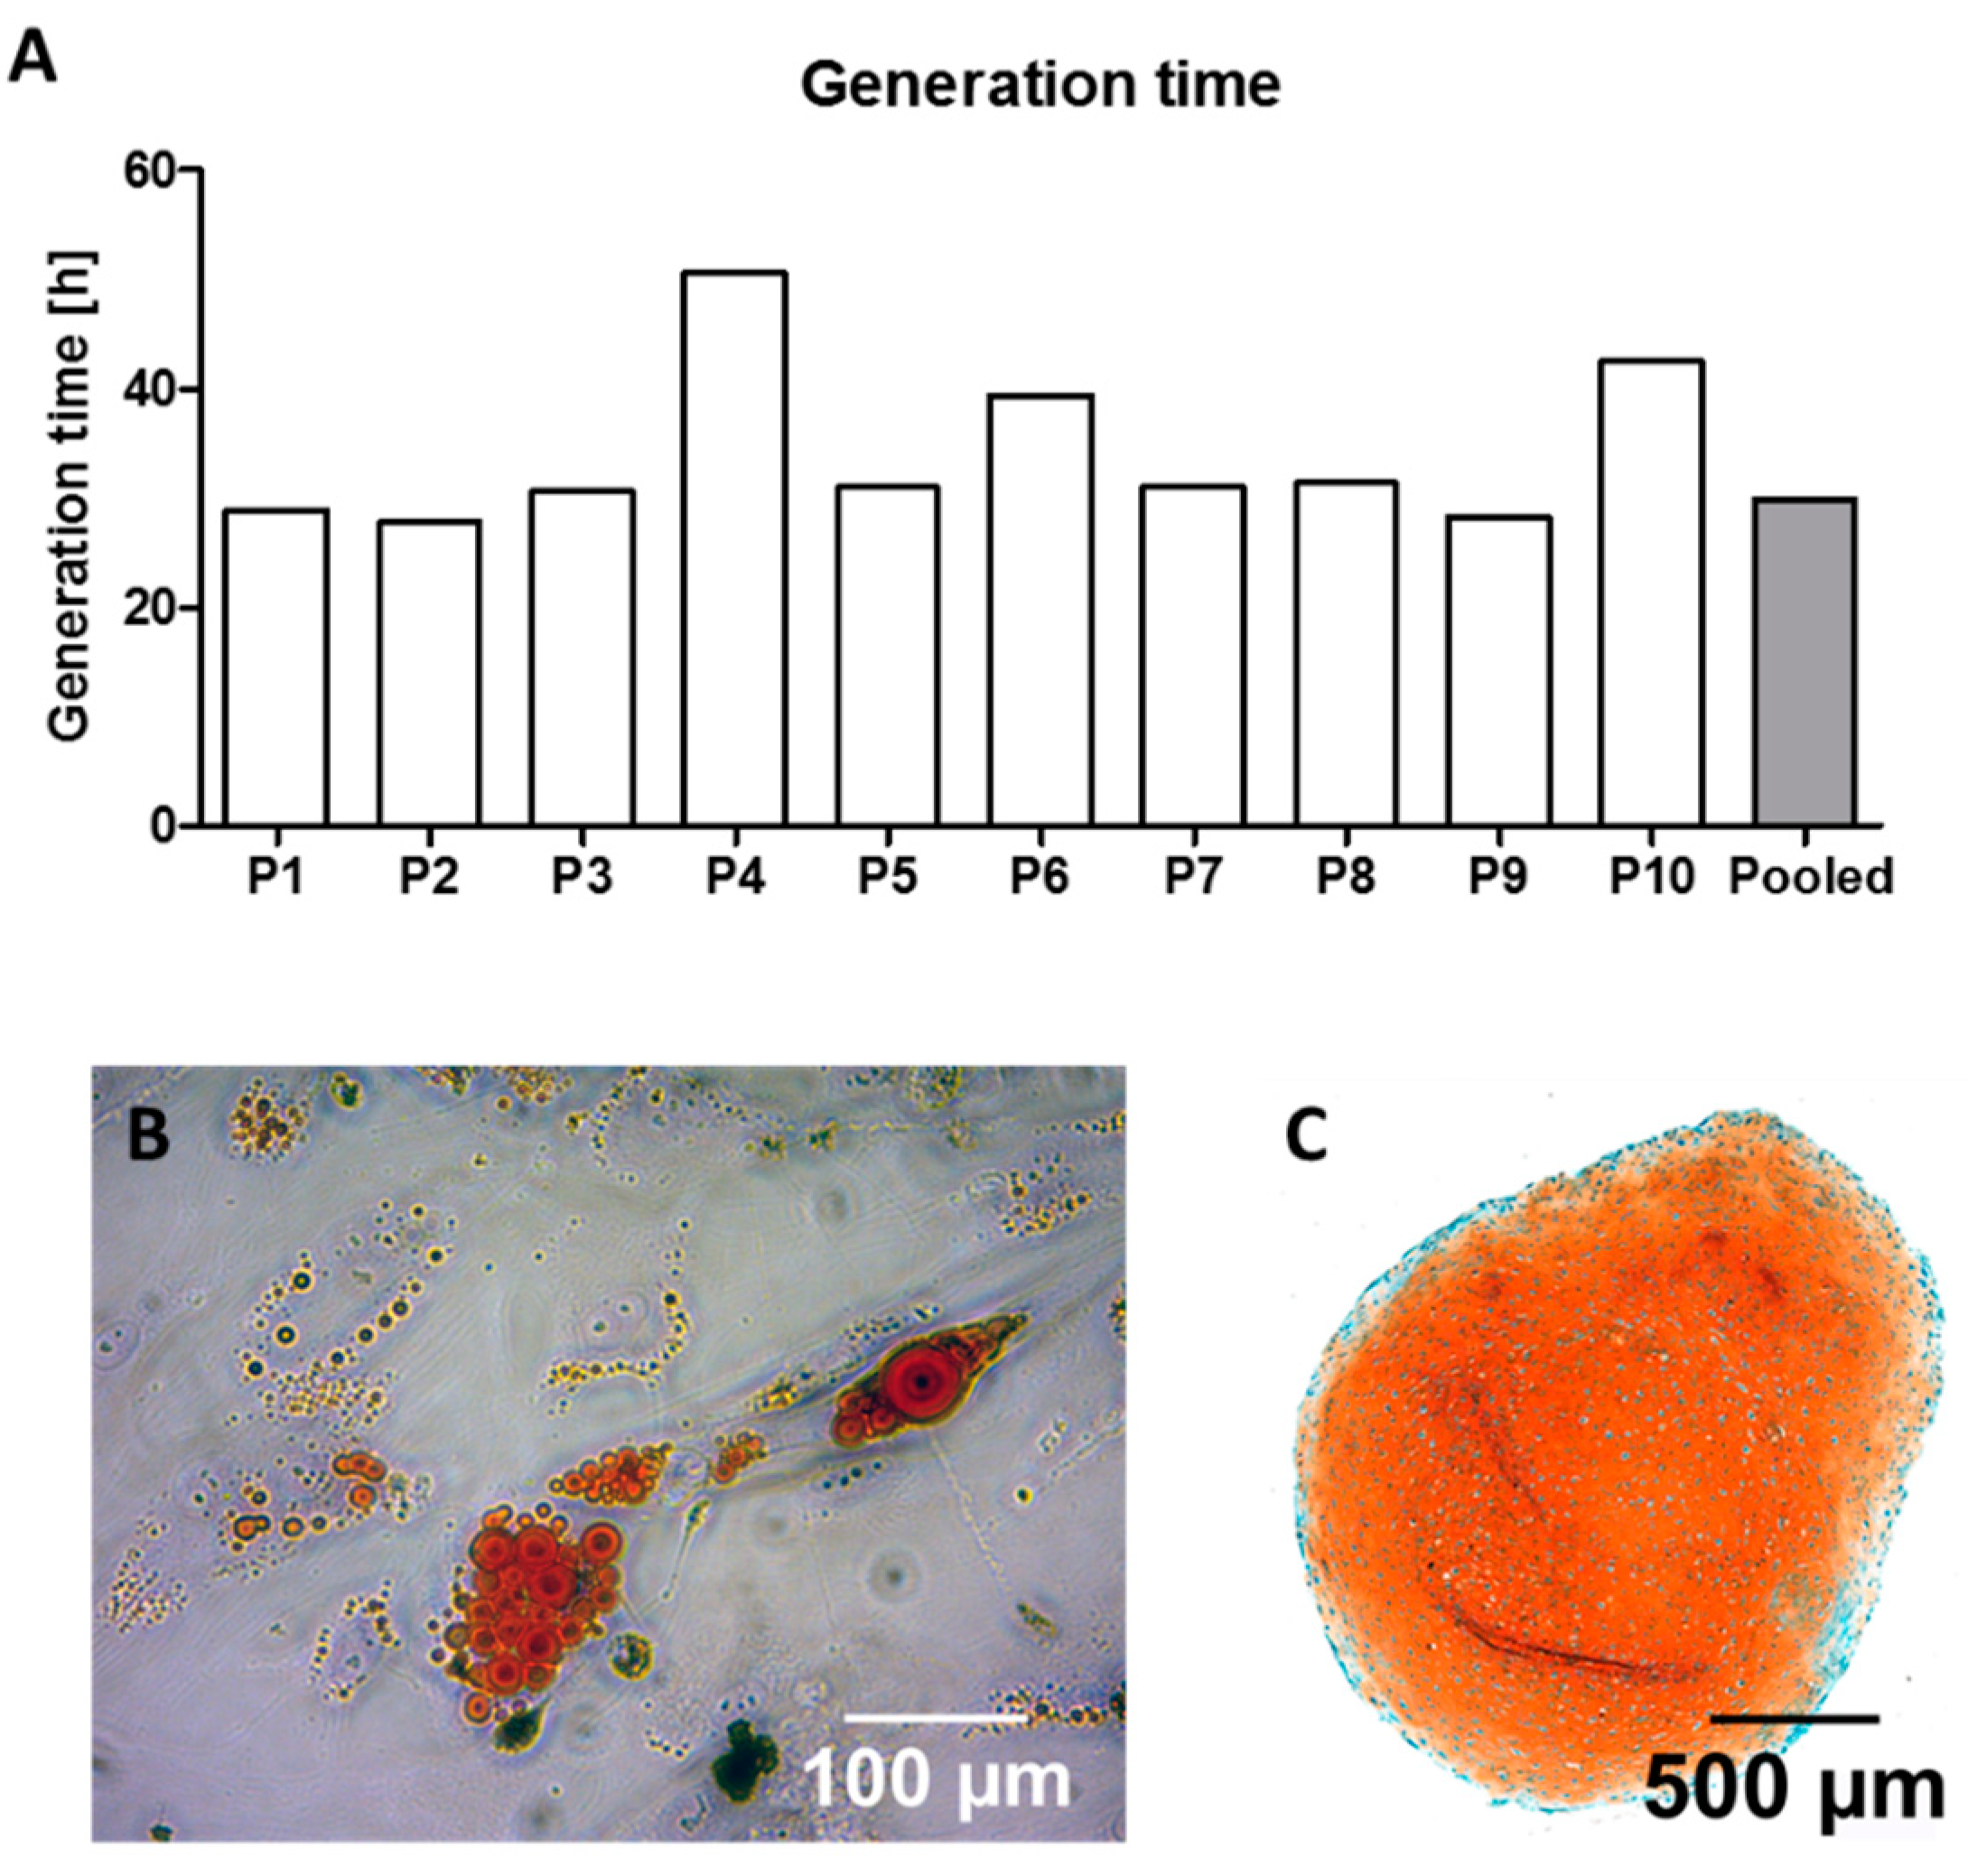
3.2. Generation Time and Cell Characteristics under Expansion Conditions
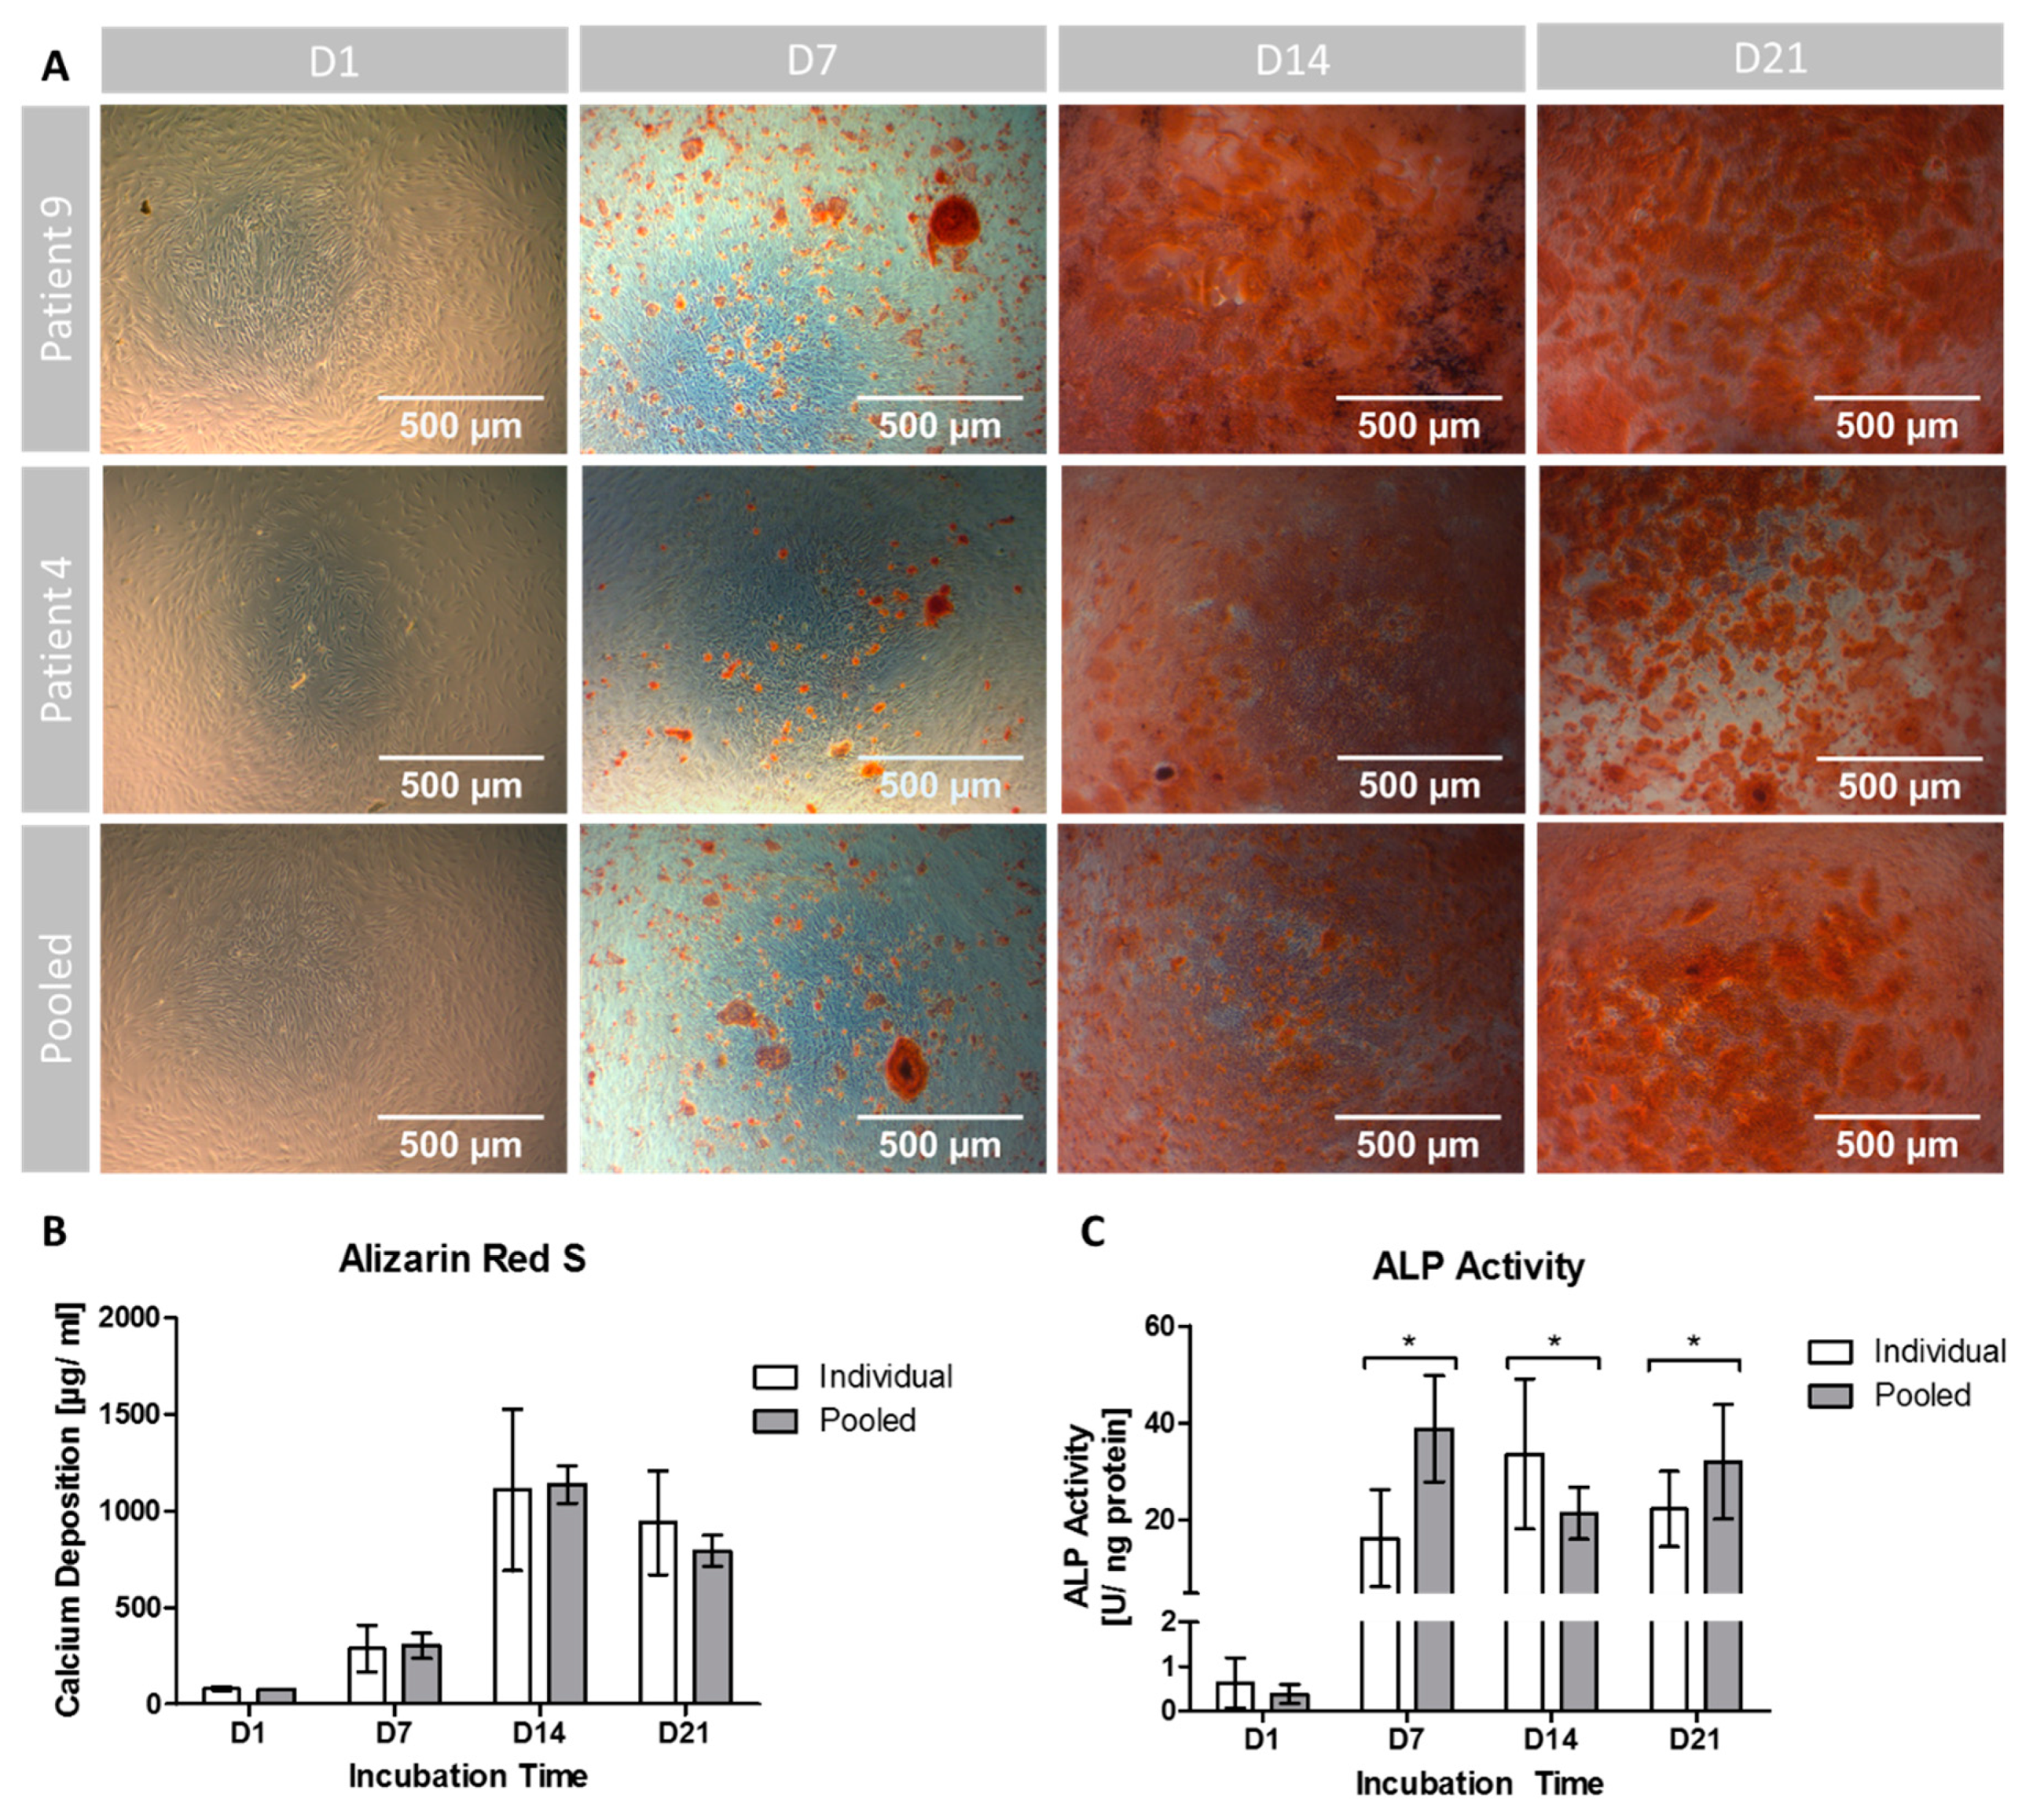
3.3. Extracellular Calcium Deposition
3.4. ALP Activity
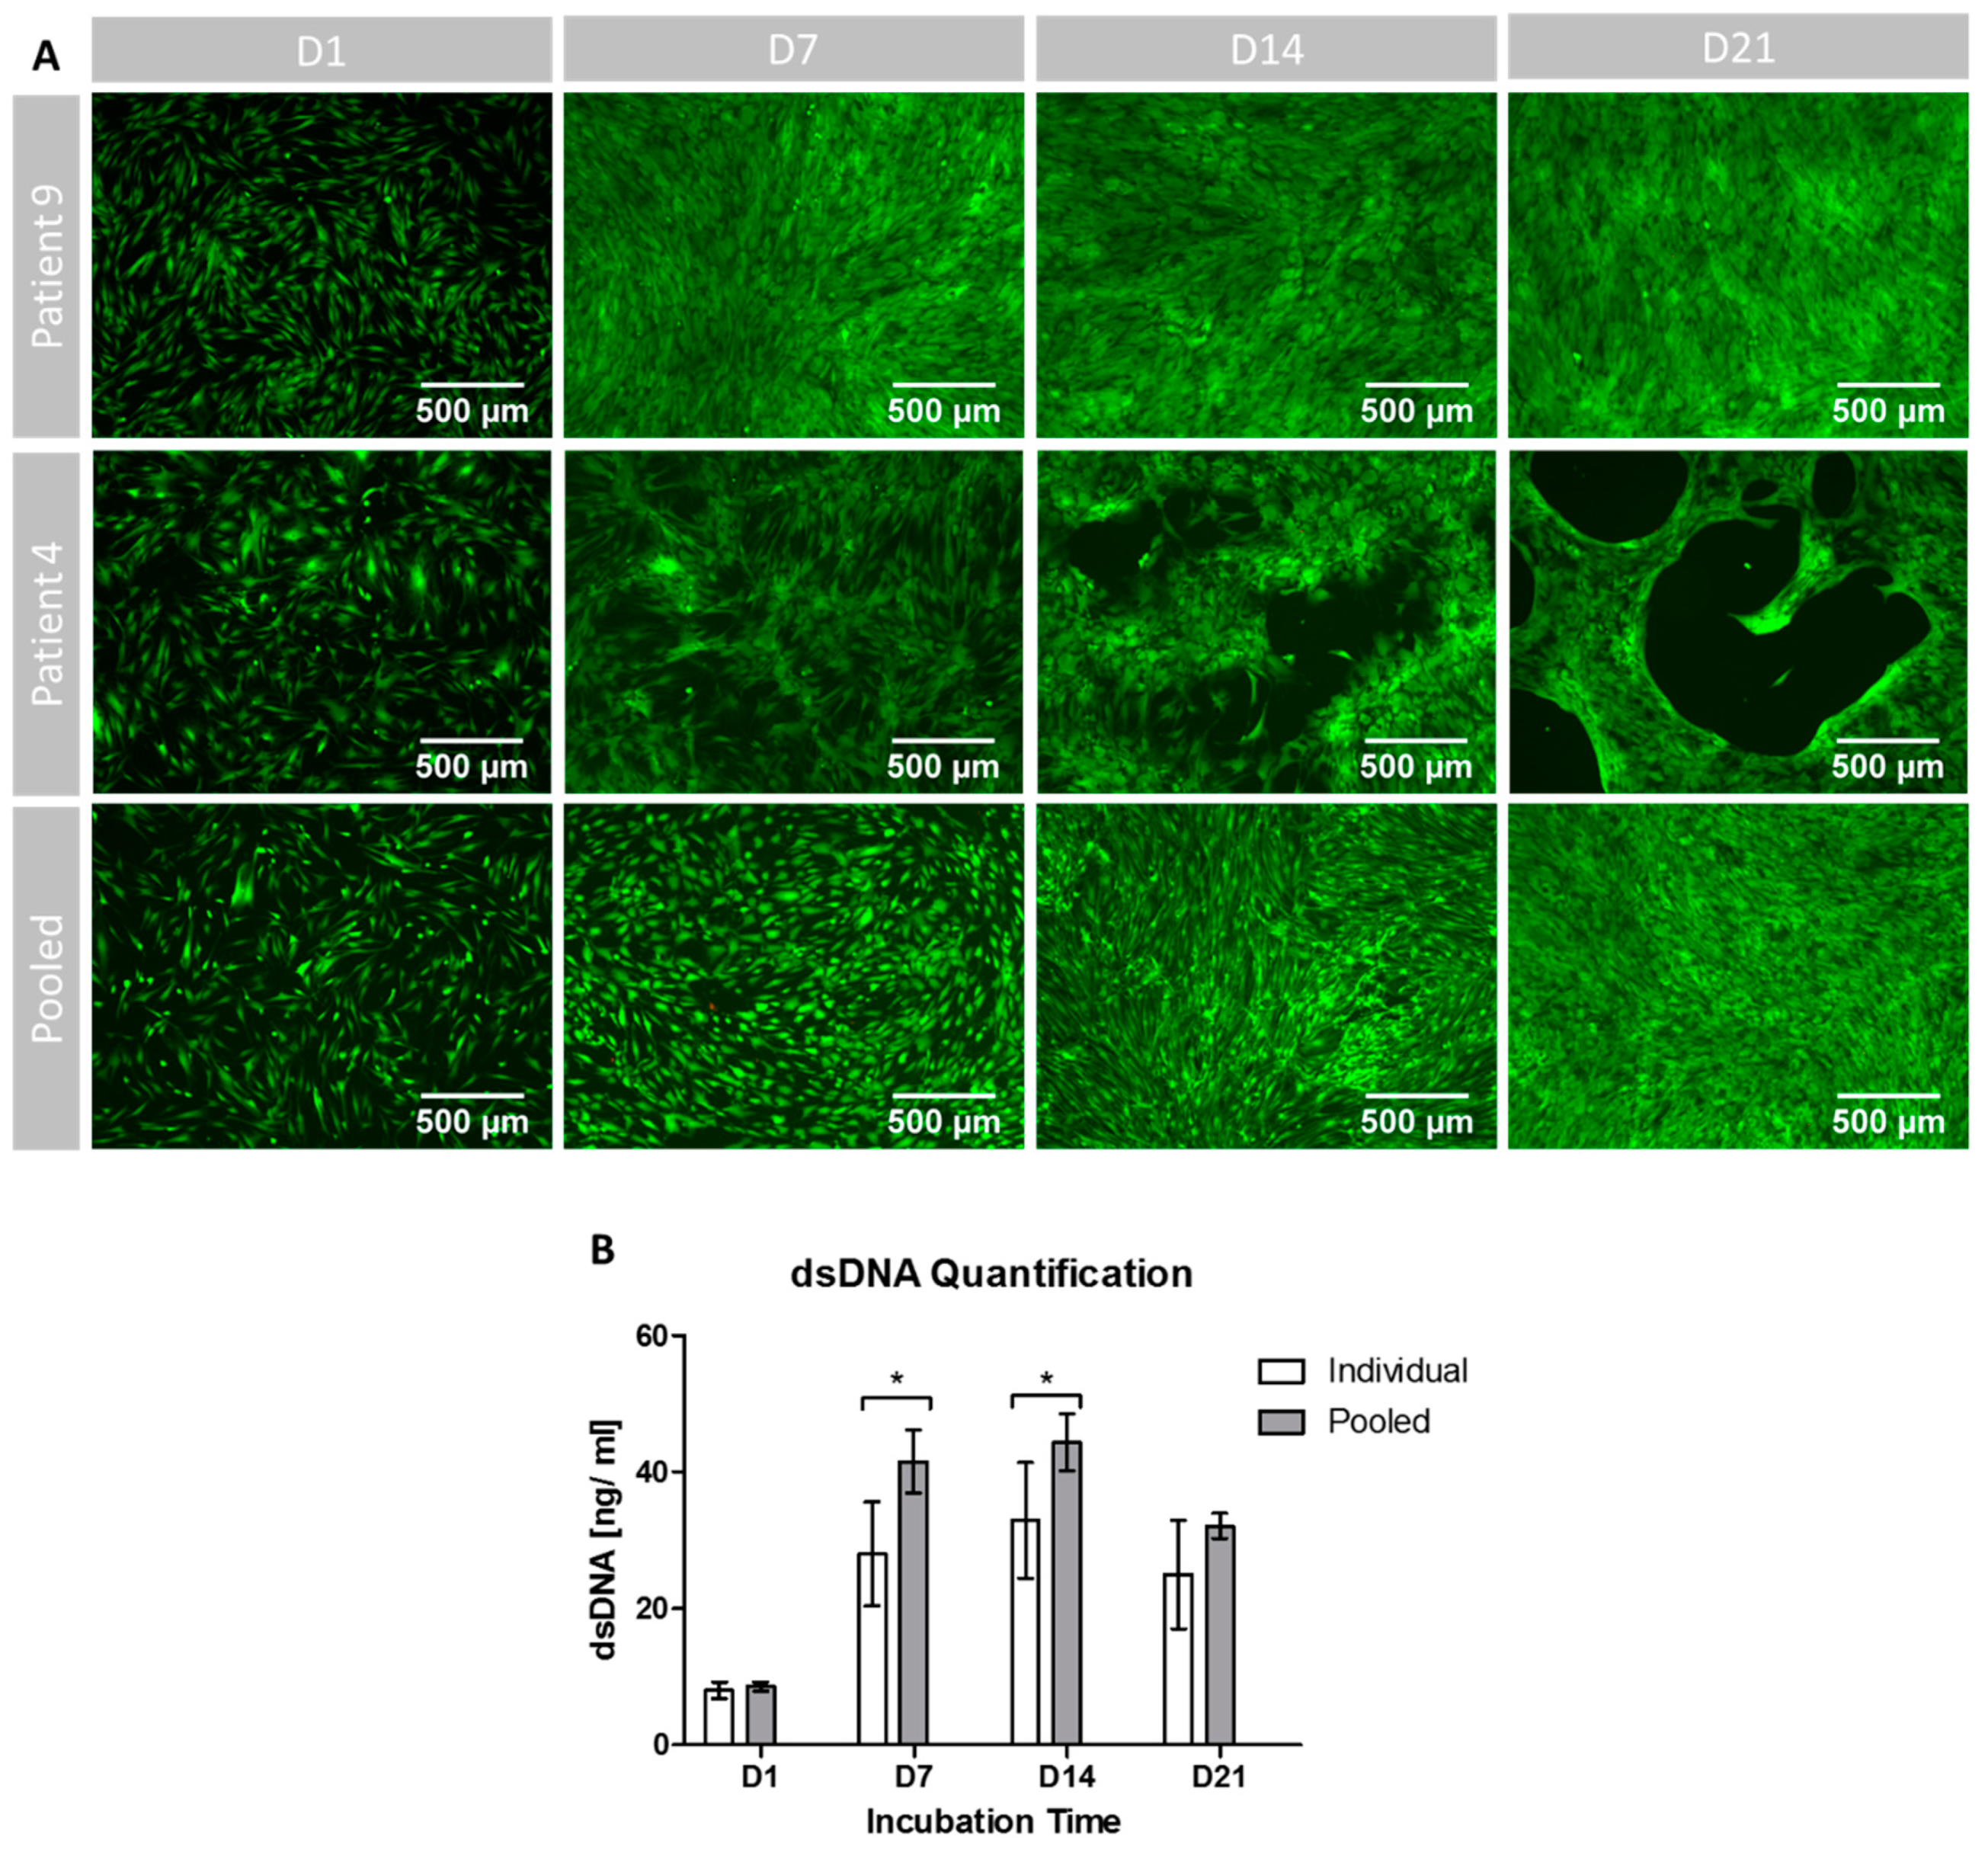
3.5. Cell Proliferation, Growth Patterns and Viability during Osteogenic Differentiation
4. Discussion
5. Conclusions
Author Contributions
Funding
Acknowledgments
Conflicts of Interest
References
- Amini, A.R.; Laurencin, C.T.; Nukavarapu, S.P. Bone tissue engineering: Recent advances and challenges. Crit. Rev. Biomed. Eng. 2012, 40, 363–408. [Google Scholar] [CrossRef] [PubMed]
- Wang, W.; Yeung, K.W.K. Bone grafts and biomaterials substitutes for bone defect repair: A review. Bioact. Mater. 2017, 2, 224–247. [Google Scholar] [CrossRef] [PubMed]
- Karadjian, M.; Essers, C.; Tsitlakidis, S.; Reible, B.; Moghaddam, A.; Boccaccini, A.R.; Westhauser, F. Biological Properties of Calcium Phosphate Bioactive Glass Composite Bone Substitutes: Current Experimental Evidence. Int. J. Mol. Sci. 2019, 20. [Google Scholar] [CrossRef] [PubMed]
- Deschaseaux, F.; Sensebe, L.; Heymann, D. Mechanisms of bone repair and regeneration. Trends Mol. Med. 2009, 15, 417–429. [Google Scholar] [CrossRef] [PubMed]
- Westhauser, F.; Karadjian, M.; Essers, C.; Senger, A.S.; Hagmann, S.; Schmidmaier, G.; Moghaddam, A. Osteogenic differentiation of mesenchymal stem cells is enhanced in a 45S5-supplemented β-TCP composite scaffold: An in-vitro comparison of Vitoss and Vitoss BA. PLoS ONE 2019, 14, e0212799. [Google Scholar] [CrossRef] [PubMed]
- Price, N.; Bendall, S.P.; Frondoza, C.; Jinnah, R.H.; Hungerford, D.S. Human osteoblast-like cells (MG63) proliferate on a bioactive glass surface. J. Biomed. Mater. Res. 1997, 37, 394–400. [Google Scholar] [CrossRef]
- Ohgushi, H. Osteogenically differentiated mesenchymal stem cells and ceramics for bone tissue engineering. Expert Opin. Biol. 2014, 14, 197–208. [Google Scholar] [CrossRef] [PubMed]
- Zhang, J.; Chen, J. Bone Tissue Regeneration - Application of Mesenchymal Stem Cells and Cellular and Molecular Mechanisms. Curr. Stem Cell Res. 2017, 12, 357–364. [Google Scholar] [CrossRef]
- Castren, E.; Sillat, T.; Oja, S.; Noro, A.; Laitinen, A.; Konttinen, Y.T.; Lehenkari, P.; Hukkanen, M.; Korhonen, M. Osteogenic differentiation of mesenchymal stromal cells in two-dimensional and three-dimensional cultures without animal serum. Stem Cell Res. 2015, 6, 167. [Google Scholar] [CrossRef]
- Friedl, G.; Schmidt, H.; Rehak, I.; Kostner, G.; Schauenstein, K.; Windhager, R. Undifferentiated human mesenchymal stem cells (hMSCs) are highly sensitive to mechanical strain: Transcriptionally controlled early osteo-chondrogenic response in vitro. Osteoarthr. Cartil. 2007, 15, 1293–1300. [Google Scholar] [CrossRef] [PubMed]
- Friedman, M.S.; Long, M.W.; Hankenson, K.D. Osteogenic differentiation of human mesenchymal stem cells is regulated by bone morphogenetic protein-6. J. Cell Biochem. 2006, 98, 538–554. [Google Scholar] [CrossRef] [PubMed]
- Bragdon, B.; Burns, R.; Baker, A.H.; Belkina, A.C.; Morgan, E.F.; Denis, G.V.; Gerstenfeld, L.C.; Schlezinger, J.J. Intrinsic Sex-Linked Variations in Osteogenic and Adipogenic Differentiation Potential of Bone Marrow Multipotent Stromal Cells. J. Cell Physiol. 2015, 230, 296–307. [Google Scholar] [CrossRef] [PubMed]
- Chen, Q.; Shou, P.; Zheng, C.; Jiang, M.; Cao, G.; Yang, Q.; Cao, J.; Xie, N.; Velletri, T.; Zhang, X.; et al. Fate decision of mesenchymal stem cells: Adipocytes or osteoblasts? Cell Death Differ. 2016, 23, 1128–1139. [Google Scholar] [CrossRef] [PubMed]
- Coipeau, P.; Rosset, P.; Langonne, A.; Gaillard, J.; Delorme, B.; Rico, A.; Domenech, J.; Charbord, P.; Sensebe, L. Impaired differentiation potential of human trabecular bone mesenchymal stromal cells from elderly patients. Cytotherapy 2009, 11, 584–594. [Google Scholar] [CrossRef] [PubMed]
- Hong, L.; Sultana, H.; Paulius, K.; Zhang, G. Steroid regulation of proliferation and osteogenic differentiation of bone marrow stromal cells: A gender difference. J. Steroid Biochem. Mol. Biol. 2009, 114, 180–185. [Google Scholar] [CrossRef] [PubMed]
- Kume, S.; Kato, S.; Yamagishi, S.; Inagaki, Y.; Ueda, S.; Arima, N.; Okawa, T.; Kojiro, M.; Nagata, K. Advanced glycation end-products attenuate human mesenchymal stem cells and prevent cognate differentiation into adipose tissue, cartilage, and bone. J. Bone Miner. Res. 2005, 20, 1647–1658. [Google Scholar] [CrossRef] [PubMed]
- Oliva-Olivera, W.; Leiva Gea, A.; Lhamyani, S.; Coin-Araguez, L.; Alcaide Torres, J.; Bernal-Lopez, M.R.; Garcia-Luna, P.P.; Morales Conde, S.; Fernandez-Veledo, S.; El Bekay, R.; et al. Differences in the Osteogenic Differentiation Capacity of Omental Adipose-Derived Stem Cells in Obese Patients With and Without Metabolic Syndrome. Endocrinology 2015, 156, 4492–4501. [Google Scholar] [CrossRef] [PubMed]
- Valenti, M.T.; Dalle Carbonare, L.; Mottes, M. Osteogenic Differentiation in Healthy and Pathological Conditions. Int. J. Mol. Sci. 2016, 18. [Google Scholar] [CrossRef]
- Wahl, E.A.; Schenck, T.L.; Machens, H.G.; Egana, J.T. Acute stimulation of mesenchymal stem cells with cigarette smoke extract affects their migration, differentiation, and paracrine potential. Sci. Rep. 2016, 6, 22957. [Google Scholar] [CrossRef]
- Ye, X.; Zhang, C. Effects of Hyperlipidemia and Cardiovascular Diseases on Proliferation, Differentiation and Homing of Mesenchymal Stem Cells. Curr. Stem Cell Res. 2017, 12, 377–387. [Google Scholar] [CrossRef]
- Zaim, M.; Karaman, S.; Cetin, G.; Isik, S. Donor age and long-term culture affect differentiation and proliferation of human bone marrow mesenchymal stem cells. Ann. Hematol. 2012, 91, 1175–1186. [Google Scholar] [CrossRef] [PubMed]
- Gong, Z.; Wezeman, F.H. Inhibitory effect of alcohol on osteogenic differentiation in human bone marrow-derived mesenchymal stem cells. Alcohol. Clin. Exp. Res. 2004, 28, 468–479. [Google Scholar] [CrossRef] [PubMed]
- Böhrnsen, F.; Schliephake, H. Supportive angiogenic and osteogenic differentiation of mesenchymal stromal cells and endothelial cells in monolayer and co-cultures. Int. J. Oral Sci. 2016, 8, 223. [Google Scholar] [CrossRef] [PubMed]
- Kasten, P.; Beyen, I.; Niemeyer, P.; Luginbuhl, R.; Bohner, M.; Richter, W. Porosity and pore size of beta-tricalcium phosphate scaffold can influence protein production and osteogenic differentiation of human mesenchymal stem cells: An in vitro and in vivo study. Acta Biomater. 2008, 4, 1904–1915. [Google Scholar] [CrossRef] [PubMed]
- Kasten, P.; Vogel, J.; Luginbuhl, R.; Niemeyer, P.; Tonak, M.; Lorenz, H.; Helbig, L.; Weiss, S.; Fellenberg, J.; Leo, A.; et al. Ectopic bone formation associated with mesenchymal stem cells in a resorbable calcium deficient hydroxyapatite carrier. Biomaterials 2005, 26, 5879–5889. [Google Scholar] [CrossRef] [PubMed]
- Reible, B.; Schmidmaier, G.; Moghaddam, A.; Westhauser, F. Insulin-Like Growth Factor-1 as a Possible Alternative to Bone Morphogenetic Protein-7 to Induce Osteogenic Differentiation of Human Mesenchymal Stem Cells in Vitro. Int. J. Mol. Sci. 2018, 19. [Google Scholar] [CrossRef] [PubMed]
- Reible, B.; Schmidmaier, G.; Prokscha, M.; Moghaddam, A.; Westhauser, F. Continuous stimulation with differentiation factors is necessary to enhance osteogenic differentiation of human mesenchymal stem cells in-vitro. Growth Factors (Churswitzerland) 2017, 35, 179–188. [Google Scholar] [CrossRef]
- Gstraunthaler, G.; Lindl, T. Zell- und Gewebekultur; Springer Spektrum: Berlin/Heidelberg, Germany, 2013; Volume 7. [Google Scholar]
- Dominici, M.; Le Blanc, K.; Mueller, I.; Slaper-Cortenbach, I.; Marini, F.; Krause, D.; Deans, R.; Keating, A.; Prockop, D.; Horwitz, E. Minimal criteria for defining multipotent mesenchymal stromal cells. The International Society for Cellular Therapy position statement. Cytotherapy 2006, 8, 315–317. [Google Scholar] [CrossRef]
- World Health Organization Europe. Body mass index - BMI. Available online: http://www.euro.who.int/en/health-topics/disease-prevention/nutrition/a-healthy-lifestyle/body-mass-index-bmi (accessed on 21 March 2019).
- Di Rocco, G.; Baldari, S.; Pani, G.; Toietta, G. Stem cells under the influence of alcohol: Effects of ethanol consumption on stem/progenitor cells. Cell Mol. Life Sci. 2019, 76, 231–244. [Google Scholar] [CrossRef]
- Kornicka, K.; Marycz, K.; Tomaszewski, K.A.; Maredziak, M.; Smieszek, A. The Effect of Age on Osteogenic and Adipogenic Differentiation Potential of Human Adipose Derived Stromal Stem Cells (hASCs) and the Impact of Stress Factors in the Course of the Differentiation Process. Oxidative Med. Cell Longev. 2015, 2015, 309169. [Google Scholar] [CrossRef]
- Jin, H.J.; Bae, Y.K.; Kim, M.; Kwon, S.J.; Jeon, H.B.; Choi, S.J.; Kim, S.W.; Yang, Y.S.; Oh, W.; Chang, J.W. Comparative analysis of human mesenchymal stem cells from bone marrow, adipose tissue, and umbilical cord blood as sources of cell therapy. Int. J. Mol. Sci. 2013, 14, 17986–18001. [Google Scholar] [CrossRef] [PubMed]
- Kuehlfluck, P.; Moghaddam, A.; Helbig, L.; Child, C.; Wildemann, B.; Schmidmaier, G. RIA fractions contain mesenchymal stroma cells with high osteogenic potency. Injury 2015, 46 (Suppl 8), S23–S32. [Google Scholar] [CrossRef]
- Hagmann, S.; Moradi, B.; Frank, S.; Dreher, T.; Kammerer, P.W.; Richter, W.; Gotterbarm, T. Different culture media affect growth characteristics, surface marker distribution and chondrogenic differentiation of human bone marrow-derived mesenchymal stromal cells. BMC Musculoskelet Disord. 2013, 14, 223. [Google Scholar] [CrossRef] [PubMed]
- Dexheimer, V.; Frank, S.; Richter, W. Proliferation as a requirement for in vitro chondrogenesis of human mesenchymal stem cells. Stem Cells Dev. 2012, 21, 2160–2169. [Google Scholar] [CrossRef] [PubMed]
- Neuhuber, B.; Swanger, S.A.; Howard, L.; Mackay, A.; Fischer, I. Effects of plating density and culture time on bone marrow stromal cell characteristics. Exp. Hematol. 2008, 36, 1176–1185. [Google Scholar] [CrossRef] [PubMed]
- Abo-Aziza, F.A.M.; Zaki, A.A. The Impact of Confluence on Bone Marrow Mesenchymal Stem (BMMSC) Proliferation and Osteogenic Differentiation. Int. J. Hematol. Oncol. Stem Cell Res. 2017, 11, 121–132. [Google Scholar]
- Jones, K.H.; Senft, J.A. An improved method to determine cell viability by simultaneous staining with fluorescein diacetate-propidium iodide. J. Histochem. Cytochem. 1985, 33, 77–79. [Google Scholar] [CrossRef]
- Sun, J.; Zhao, J.; Bao, X.; Wang, Q.; Yang, X. Alkaline Phosphatase Assay Based on the Chromogenic Interaction of Diethanolamine with 4-Aminophenol. Anal. Chem. 2018, 90, 6339–6345. [Google Scholar] [CrossRef]
- Birmingham, E.; Niebur, G.L.; McHugh, P.E.; Shaw, G.; Barry, F.P.; McNamara, L.M. Osteogenic differentiation of mesenchymal stem cells is regulated by osteocyte and osteoblast cells in a simplified bone niche. Eur. Cells Mater. 2012, 23, 13–27. [Google Scholar] [CrossRef]
- Huang, Z.; Nelson, E.R.; Smith, R.L.; Goodman, S.B. The sequential expression profiles of growth factors from osteoprogenitors [correction of osteroprogenitors] to osteoblasts in vitro. Tissue Eng. 2007, 13, 2311–2320. [Google Scholar] [CrossRef]
- Aubin, J.E. Regulation of osteoblast formation and function. Rev. Endocr. Metab. Disord. 2001, 2, 81–94. [Google Scholar] [CrossRef] [PubMed]
- Hoemann, C.D.; El-Gabalawy, H.; McKee, M.D. In vitro osteogenesis assays: Influence of the primary cell source on alkaline phosphatase activity and mineralization. Pathol. Biol. 2009, 57, 318–323. [Google Scholar] [CrossRef] [PubMed]
- Adamzyk, C.; Emonds, T.; Falkenstein, J.; Tolba, R.; Jahnen-Dechent, W.; Lethaus, B.; Neuss, S. Different Culture Media Affect Proliferation, Surface Epitope Expression, and Differentiation of Ovine MSC. Stem Cells Int. 2013, 2013, 387324. [Google Scholar] [CrossRef] [PubMed]
- Yang, Y.-H.K.; Ogando, C.R.; Wang See, C.; Chang, T.-Y.; Barabino, G.A. Changes in phenotype and differentiation potential of human mesenchymal stem cells aging in vitro. Stem Cell Res. Ther. 2018, 9, 131. [Google Scholar] [CrossRef] [PubMed]


| Patient # | Age | Sex | BMI | Further Confounders |
|---|---|---|---|---|
| P1 | 69 | W | 22.7 | None |
| P2 | 40 | W | 28.9 | Analgesic abuse |
| P3 | 50 | M | 31.9 | Cortisone therapy |
| P4 | 73 | W | 35.1 | None |
| P5 | 29 | M | 41.6 | None |
| P6 | 31 | M | 37.1 | Cortisone therapy |
| P7 | 61 | M | 39.6 | Metabolic syndrome, nicotine and alcohol abuse |
| P8 | 62 | M | 31.8 | None |
| P9 | 39 | M | 22.4 | None |
| P10 | 42 | W | 34.3 | Nicotine abuse |
| Group | CD105 | CD73 | CD90 | Negative Control |
|---|---|---|---|---|
| Pooled | 99.43% | 96.59% | 98.42% | 1.14% |
| Individual | 99.44 ± 0.14% | 96.67 ± 1.60% | 98.47 ± 0.77% | 1.71 ± 0.24% |
© 2019 by the authors. Licensee MDPI, Basel, Switzerland. This article is an open access article distributed under the terms and conditions of the Creative Commons Attribution (CC BY) license (http://creativecommons.org/licenses/by/4.0/).
Share and Cite
Widholz, B.; Tsitlakidis, S.; Reible, B.; Moghaddam, A.; Westhauser, F. Pooling of Patient-Derived Mesenchymal Stromal Cells Reduces Inter-Individual Confounder-Associated Variation without Negative Impact on Cell Viability, Proliferation and Osteogenic Differentiation. Cells 2019, 8, 633. https://doi.org/10.3390/cells8060633
Widholz B, Tsitlakidis S, Reible B, Moghaddam A, Westhauser F. Pooling of Patient-Derived Mesenchymal Stromal Cells Reduces Inter-Individual Confounder-Associated Variation without Negative Impact on Cell Viability, Proliferation and Osteogenic Differentiation. Cells. 2019; 8(6):633. https://doi.org/10.3390/cells8060633
Chicago/Turabian StyleWidholz, Benedikt, Stefanos Tsitlakidis, Bruno Reible, Arash Moghaddam, and Fabian Westhauser. 2019. "Pooling of Patient-Derived Mesenchymal Stromal Cells Reduces Inter-Individual Confounder-Associated Variation without Negative Impact on Cell Viability, Proliferation and Osteogenic Differentiation" Cells 8, no. 6: 633. https://doi.org/10.3390/cells8060633
APA StyleWidholz, B., Tsitlakidis, S., Reible, B., Moghaddam, A., & Westhauser, F. (2019). Pooling of Patient-Derived Mesenchymal Stromal Cells Reduces Inter-Individual Confounder-Associated Variation without Negative Impact on Cell Viability, Proliferation and Osteogenic Differentiation. Cells, 8(6), 633. https://doi.org/10.3390/cells8060633