Article

Gγ and Gα Identity Dictate a G-Protein Heterotrimer Plasma Membrane Targeting

Department of Physical Biochemistry, Faculty of Biochemistry Biophysics and Biotechnology, Jagiellonian University, Gronostajowa 7, 30-387 Kraków, Poland
*
Author to whom correspondence should be addressed.
Cells 2019, 8(10), 1246; https://doi.org/10.3390/cells8101246
Submission received: 17 September 2019 / Revised: 10 October 2019 / Accepted: 11 October 2019 / Published: 13 October 2019
(This article belongs to the Special Issue New Advances in Cyclic AMP Signalling)

Abstract

:
Heterotrimeric G-proteins along with G-protein-coupled receptors (GPCRs) regulate many biochemical functions by relaying the information from the plasma membrane to the inside of the cell. The lipid modifications of Gα and Gγ subunits, together with the charged regions on the membrane interaction surface, provide a peculiar pattern for various heterotrimeric complexes. In a previous study, we found that Gαs and Gαi3 prefer different types of membrane-anchor and subclass-specific lipid domains. In the present report, we examine the role of distinct Gγ subunits in the membrane localization and spatiotemporal dynamics of Gαs and Gαi3 heterotrimers. We characterized lateral diffusion and G-protein subunit interactions in living cells using fluorescence recovery after photobleaching (FRAP) microscopy and fluorescence resonance energy transfer (FRET) detected by fluorescence lifetime imaging microscopy (FLIM), respectively. The interaction of Gγ subunits with specific lipids was confirmed, and thus the modulation of heterotrimeric G-protein localization. However, the Gα subunit also modulates trimer localization, and so the membrane distribution of heterotrimeric G-proteins is not dependent on Gγ only.

1. Introduction

G-protein-coupled receptor (GPCR) stimulation results in the activation of a Gα subunit and a Gβγ complex of the heterotrimeric G-protein. Both the activated components of the heterotrimer modulate the function of downstream effector proteins located on the cytosolic surface of the cell membrane. The intracellular response effect is caused by second messenger molecules after the stimulation of effector proteins such as adenylyl cyclase, phospholipase C-β, and ion channels. There are 18 Gα, five Gβ, and 12 Gγ genes in the human genome [1]. The Gα subunit family is the most diverse among G-proteins and is responsible for the specificity of interactions with GPCRs [2]. There is evidence of distinct activity of the Gβγ dimer in terms of G-protein activation and modulation of effector proteins [3].
Several different lipids are covalently attached to Gα and Gγ subunits, and as hydrophobic anchors, lipids promote localization to cellular membranes. Apart from the subunits Gαt and Gαgust, all Gα subunits are palmitoylated, and some are also myristylated. Palmitoylation is a post-translational modification that involves the addition of saturated 16-carbon palmitic acid to a specific cysteine in an amino acid sequence through a thioester bond (S-palmitoylation). This modification is unique among lipidations and can be quickly reversed under in vivo conditions [4,5]. It is also possible to attach palmitoleic acid by an amide bond to the glycine residue in the N-terminal fragment of the Gαs protein (N-palmitoylation) [6]. Myristylation is a co-translation or post-translation modification which consists of attaching the myristate (a 14-carbon saturated fatty acid) to the N-terminal glycine residue through a peptide bond [7]. The non-myristylated Gα subunits (Gαs, Gαq, and Gα12/13 families) contain the motif of basic residues, arginines and lysines, forming a charged surface on one side of the N-terminal helix [8,9,10,11]. Such a charged protein area is able to interact with negatively-charged lipid head groups. A positively charged surface is also present in the Gβ structure. Such a region, through electrostatic interactions favors binding to acidic membrane phospholipids [12].
All Gγ subunits undergo post-translational isoprenylation. Prenylation is an irreversible multistage modification that involves the transfer of a C15 farnesyl or C20 geranylgeranyl group to a cysteine residue within the C-terminal CaaX motif via a thioether bond. Farnesylation occurs in the Gγ1, Gγ9, and Gγ11 subunits; the other subunits of Gγ are geranylgeranylated [13]. According to the two-signal hypothesis or kinetic trapping [14,15,16,17,18] a single membrane binding signal might be insufficient for proper membrane docking. However, a combination of two or more signals such as lipid anchor, poly-basic sequence or other motifs can ensure high-affinity interaction with cellular membranes.
Apart from differences in the length of anchors, the literature distinguishes three groups of gamma subunits based on transient translocation to endomembranes. The γ1, γ11, γ9, and γ13 belong to a group characterized by rapid translocation, γ5 and γ10 translocate slowly, while the other Gγ subunits, previously identified as non-translocating, are currently described as the slowest translocating [19,20]. It is noteworthy, that the translocation process is acylation/deacylation cycle dependent and the activation of G-protein is not necessary [21]. It is currently accepted that the factors that influence the behavior of activated G-proteins are not only heterotrimer composition and lipid modification but also local membrane environment, receptor coupling, the presence or absence of effector proteins or accessibility of other interacting partners.
In previous reports, we showed a separate location of heterotrimers of Gαs and Gαi3 subunits with Gβ1γ2 complex in HEK 293 cells [22]. Here we examined the effect of distinct Gγ subunits, Gγ2 and Gγ9, on heterotrimer behavior prior to receptor activation. The combined approach of two fluorescence microscopy techniques was used, fluorescence lifetime imaging microscopy–fluorescence resonance energy transfer (FLIM–FRET) technique to examine protein-protein interactions and the fluorescence recovery after photobleaching (FRAP) technique to monitor membrane dynamics of complexes. We confirmed the interaction of the Gγ subunit with specific lipids and thus the modulation of heterotrimeric G-protein localization. However, the membrane distribution of heterotrimeric G-proteins is not only Gγ dependent. Results presented herein indicate that the Gα subunit also modulates trimer localization and the nature of that impact is to some extent similar to that of Gγ. Therefore, the role of other subunits of G-protein trimer partitioning process appears to be significant.

2. Materials and Methods

2.1. Chemicals and Protein Constructs

All chemicals were purchased from Sigma (Sigma Aldrich, Poznań, Poland) unless otherwise indicated. All DNA sequences of Gα, β, and γ subunits in pcDNA3.1+ used were purchased from UMR cDNA Resource Center (Bloomsberg, PA, USA). Plasmids pEYFP–N1, pEGFP–N1, and pmCherry–N1 were purchased at Clontech (Mountain View, CA, USA). The fusion proteins of the Gα subunits with fluorescent proteins (FP) was performed as described earlier [22]. In the GαsIEK chimeric protein, the conserved region Ile26–Glu27–Lys28 (G.HN.43–45; (I/L)-(E/D)-(K/R) motif in Gα family) was modified into a sequence of three alanine residues. These mutations were carried out using the Quick Change method and resulted in the elimination of the interaction of the mutant GαsIEK protein with the Gβγ dimer [23]. The restriction-free cloning method [24] was used to modify the Gβ1 subunit. As a first step, the FP sequence was multiplied and cloned at the N-terminus of the Gβ1 subunit and this construct was used in the FLIM-FRET experiments. In the next PCR, a His-tag sequence was added at the N-terminus of the FP. This modification enabled carrying out pull-down experiments. All constructs were checked by determining the nucleotide sequence.

2.2. Cell Culture

The HEK 293 cells (American Type Culture Collection, Manassas, VA, USA) were cultivated and transiently transfected as described earlier [22]. The cells were transfected with 0.15–0.6 μg of DNA/dish and the ratio of the DNA coding of the Gα, Gβ, and Gγ subunits was 2:3:3. For the pull-down assay, cells were cultured on a 100 mm diameter dish and the amount of DNA for transfection was increased accordingly.

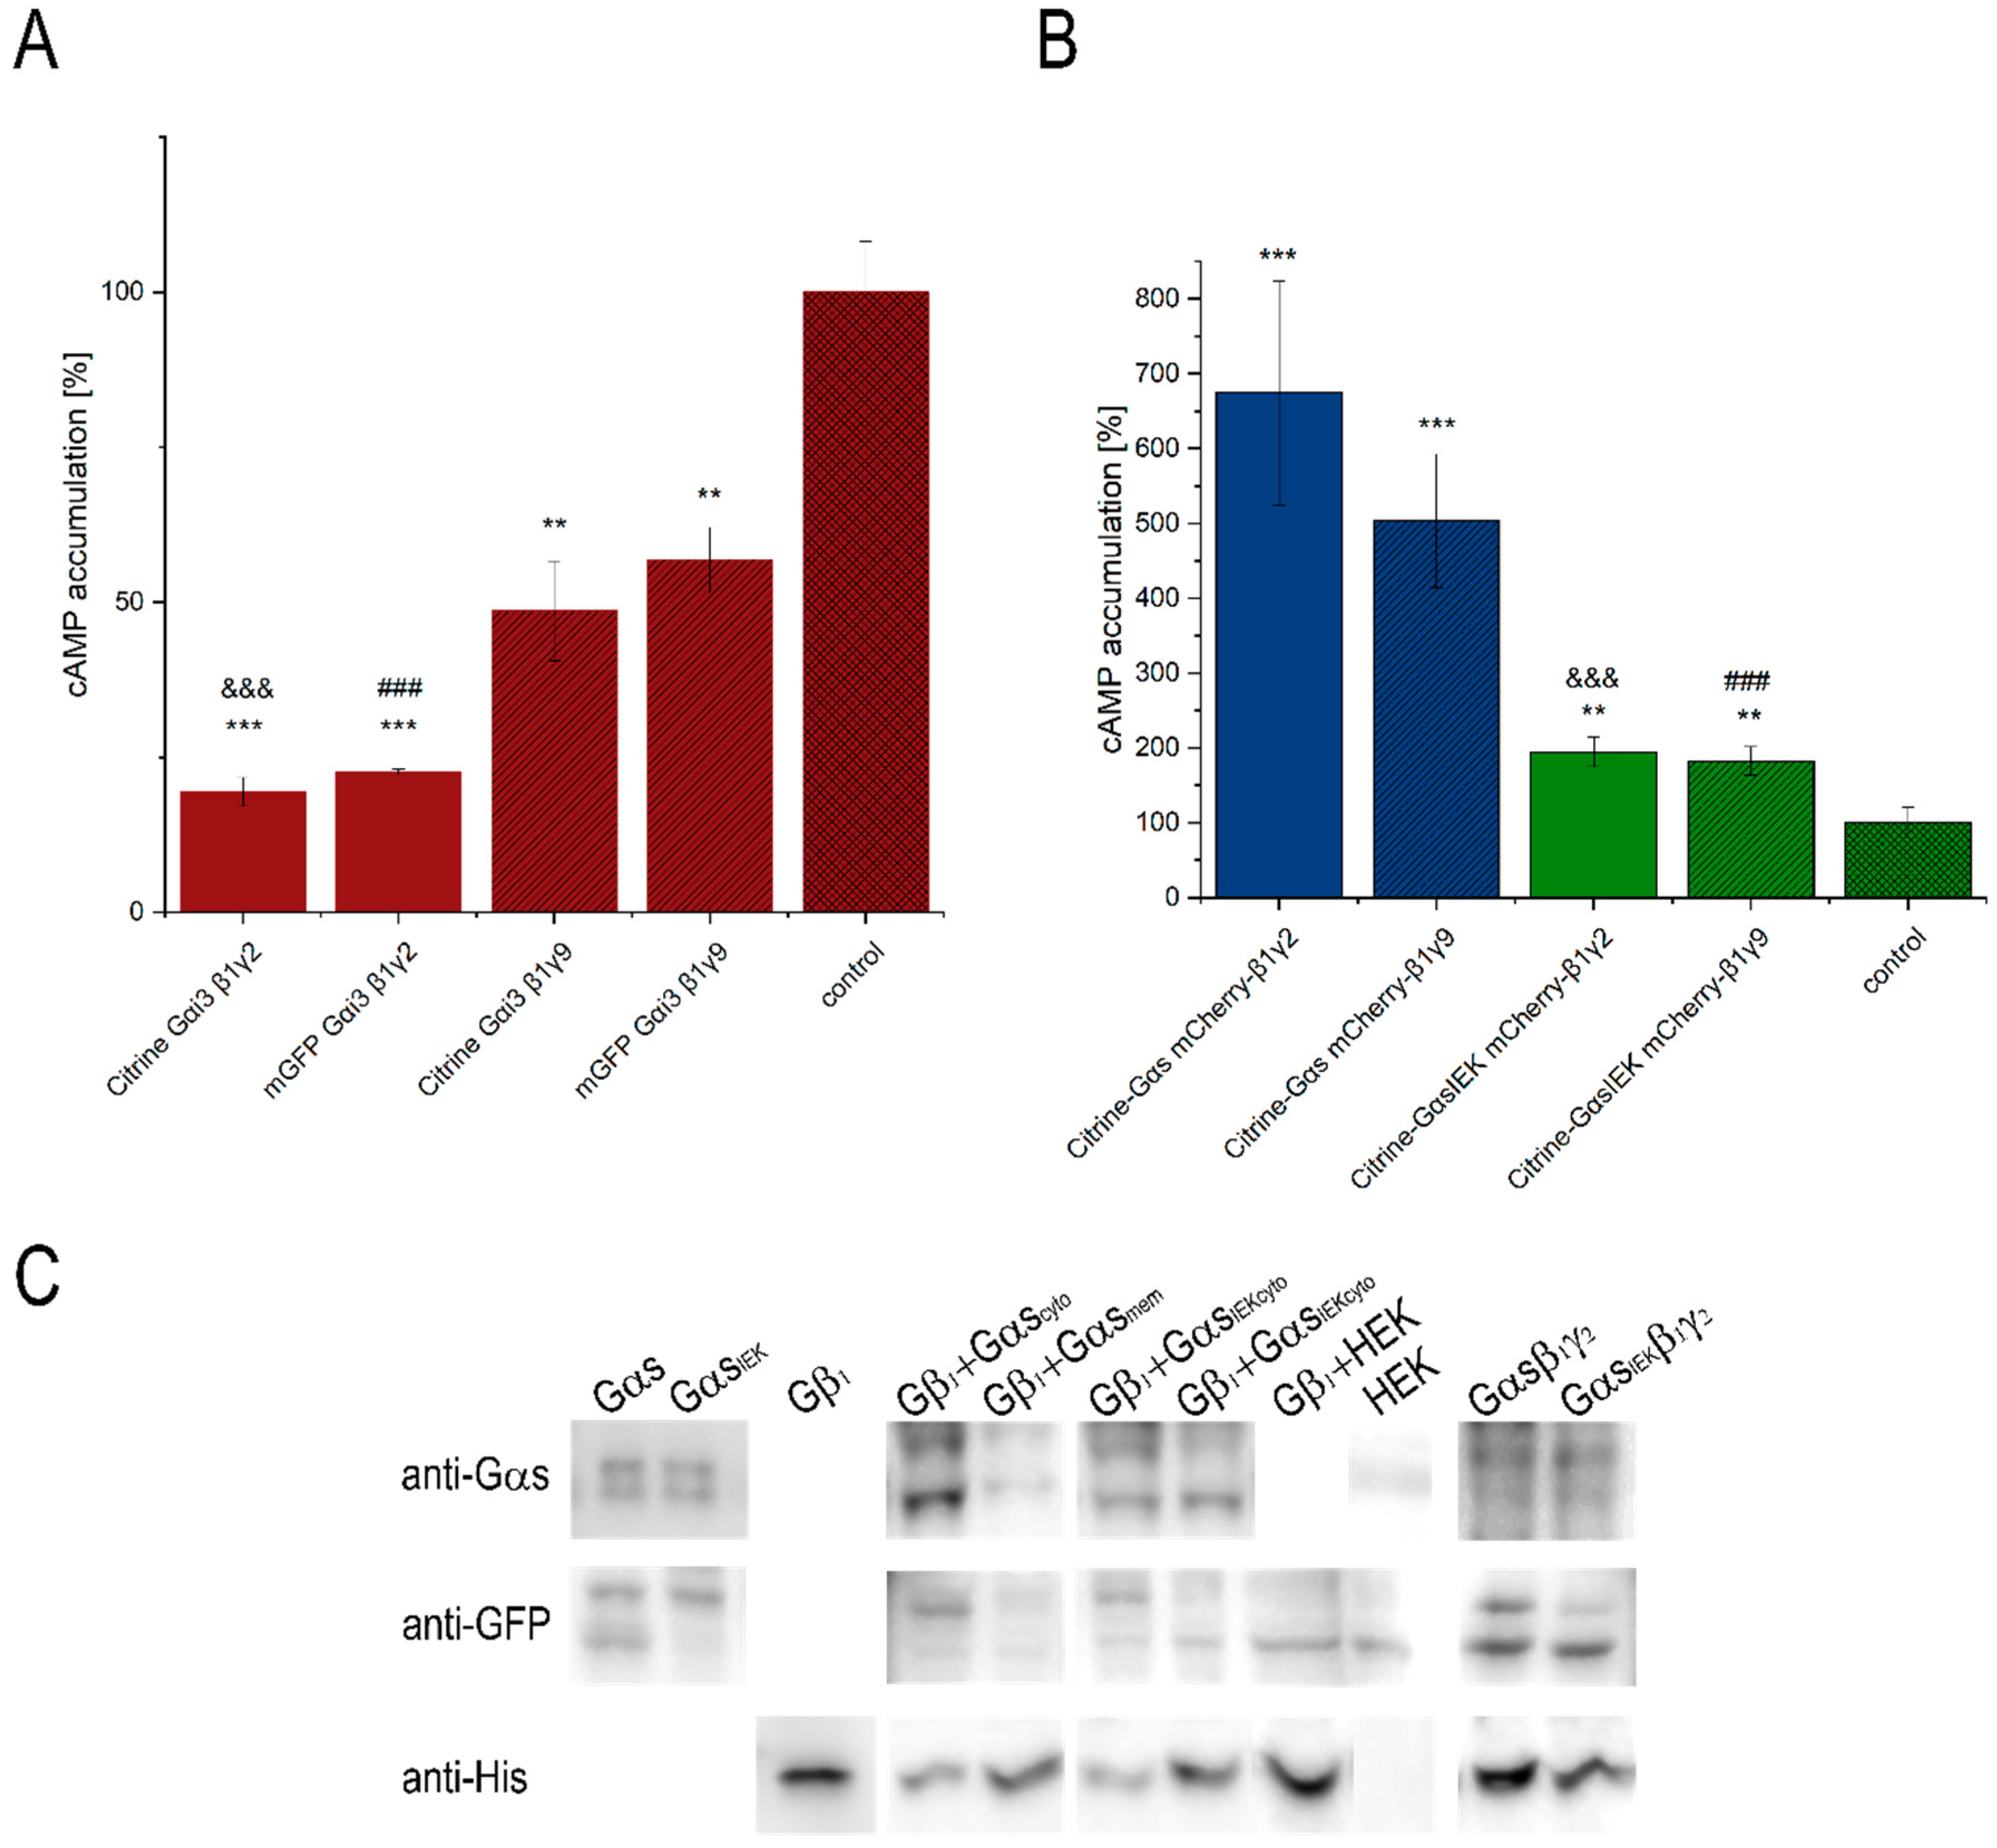
2.3. Determination of Intercellular cAMP Concentration

Changes in cAMP concentration were determined by using the cAMP ELISA chemiluminescent kit (STA-500, Cell Biolabs Inc, San Diego, CA, USA). Cells were seeded onto six-well plates and 24 h later transfected with 1.85 μg plasmid DNA/well. HEK 293 cells were co-transfected with the D2R dopamine receptor in the case of Gαi3 or adenosine A2AR receptor in the case of Gαs and GαsIEK. Three days after transfection the cells were treated for 10 min with 1 μM sumanirole maleate in minimum essential medium (MEM) containing 0.5% fetal bovine serum (FBS) and phosphodiesterase inhibitors 0.5 mM 3-isobutyl-1-methylxanthine (IBMX) and 0.1 mM 4-(3-butoxy-4-methoxybenzyl)imidazolidin-2-one (Ro 20–1724) or for 15 min with 1 μM 2–phenylaminoadenosine in MEM medium containing 0.5% FBS. Non-transfected cells were used as controls. After stimulation, the concentration of cAMP in harvested cell lysates was determined according to the manufacturer’s instruction. The chemiluminescent signal was measured by using a Synergy H1 microplate reader (BioTek Instruments, Winooski, VT, USA). To minimize batch-to-batch variations, in each experiment the signals were normalized to the average signal in the control group (non-transfected cells), and the normalized data were summarized across all experiments.

2.4. Pull-Down Assay

Interaction of Gαs or GαsIEK mutants with the Gβ1 or Gβ1γ2 dimers was studied by pull-down on a nickel-charged affinity beads (NiNTA agarose). HEK 293 cells, transiently expressing bait His-tagged Gβ1-mCherry alone or full heterotrimeric Gαsβ1γ2 or GαsIEKβ1γ2 complexes, were lysed in ice-cold lysis buffer (50 mM Tris, pH 8.0, 5 mM MgCl2, 10 mM β-mercaptoethanol, 100 mM NaCl, 20 μM GDP, benzonase, inhibitors). After sonication and centrifugation (50,000× g, 45 min, 4 °C), the supernatant (cytoplasmic fraction) containing His6-tagged mCherry-Gβ1 was loaded onto the NiNTA resin and washed with wash buffer (lysis buffer with 50 µM guanosine-5′-triphosphate, GTP, and without benzonase and inhibitors) and utilized for studying interactions with Gαs. The membrane fractions containing membrane-bound Gαsβ1γ2 or GαsIEKβ1γ2 heterotrimers were suspended in wash buffer supplemented with 1% n-dodecyl-β-D-maltopyranoside, DDM (Anatrace, Maumee, OH, USA) and homogenized (Teflon–glass homogenizer, Sigma Aldrich, Poznań, Poland). After overnight solubilization (4 °C), clarified membrane fractions (50,000× g, 45 min, 4 °C) were incubated for 3 h at 4 °C with NiNTA resin.
In the next step, lysate from cells expressing Gαs or GαsIEK, after sonication and centrifugation (cytoplasmic fraction), were incubated for 3 h at 4 °C with His-Gβ1-trapped NiNTA. The membrane-bound Gαs or GαsIEK were isolated in the same way as full heterotrimers, followed by incubation with His-Gβ1-trapped NiNTA. Complexes bound to the beads were isolated by centrifugation, washed three times with ice-cold lysis buffer and eluted in wash buffer containing 0.5 M imidazole. As negative control, a cell lysate without protein expression (negative cell lysate) was used. The eluted complexes were separated on 15% polyacrylamide-SDS gel and visualized by Western blot using antibodies against Gαs (Novus, Centennial, CO, USA), His-tag (Proteintech, Rosemont, IL, USA), and mCherry (Proteintech).

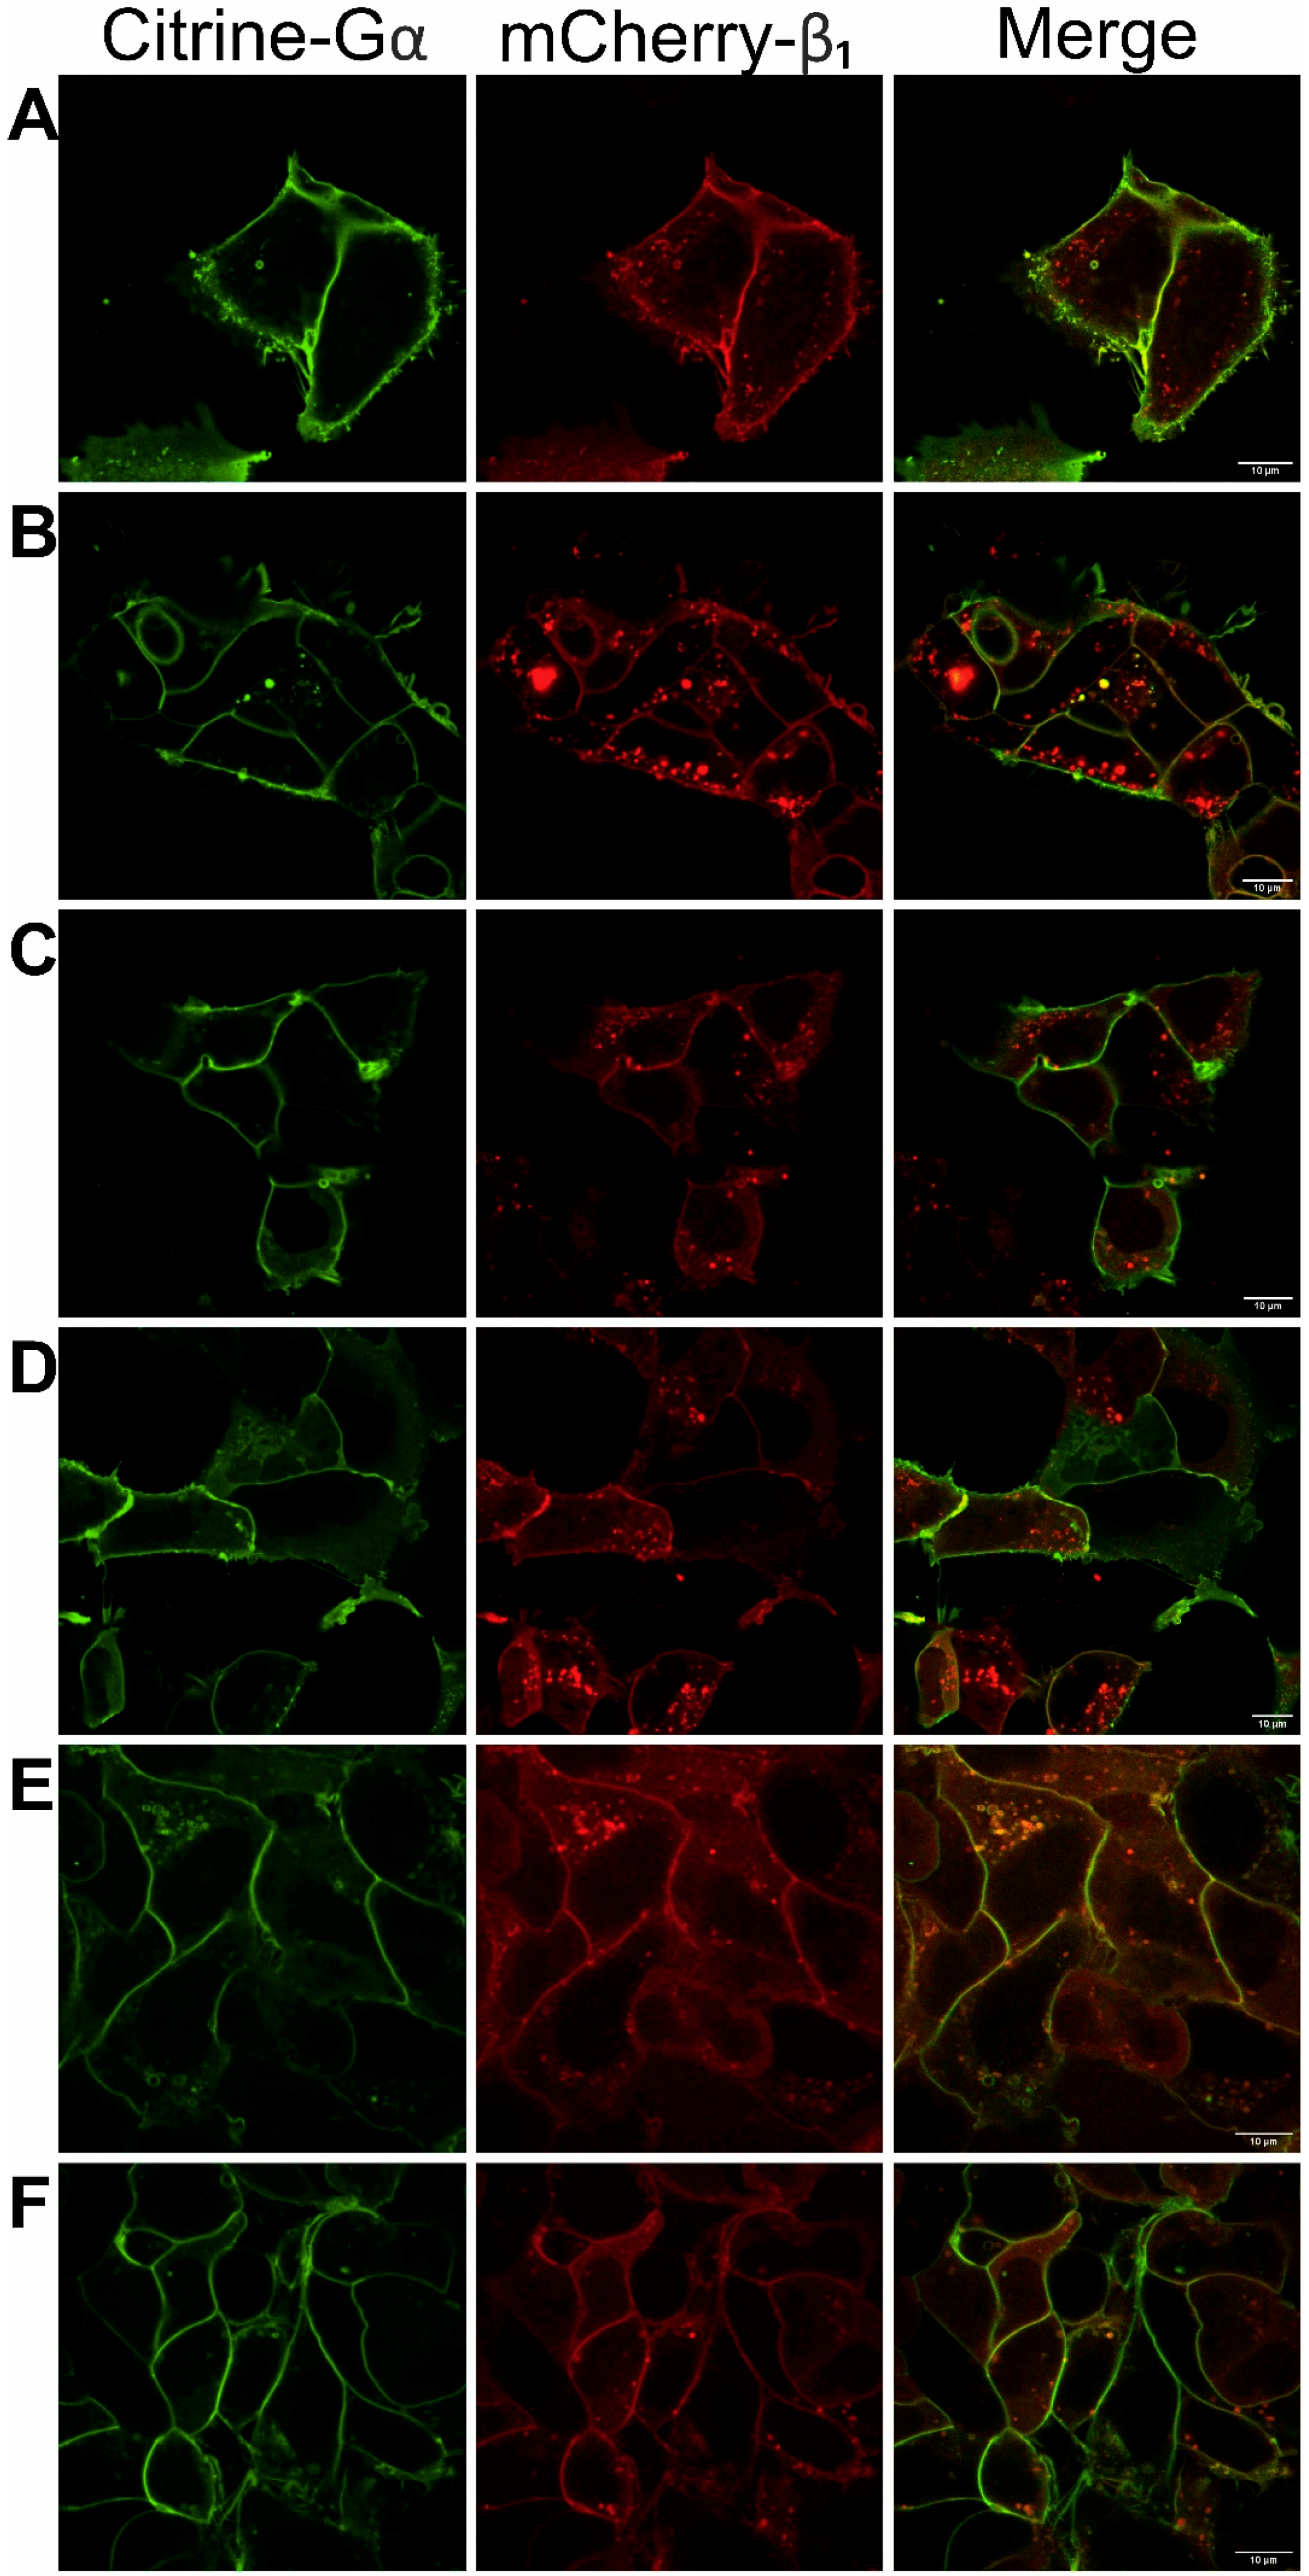
2.5. Confocal Microscopy

HEK 293 cells producing Gαs, GαsIEK or Gαi3 or full heterotrimeric complexes (Gαsβ1γ2, Gαsβ1γ9, GαsIEKβ1γ2, GαsIEKβ1γ9, Gαi3β1γ2, Gαi3β1γ9) were imaged with the TCS SP5 laser-scanning confocal microscope (Leica Microsystems, Mannheim, Germany) with a 63 × 1.4 numerical aperture (NA) oil-immersion objective at 37 °C. Green or yellow fluorescence (mGFP or Citrine FP) was detected at 495–570 nm with 488 nm excitation (argon ion laser) and red (mCherry) at 610–700 nm with 594 nm excitation (laser diode). All measurements were taken on living cells at 37 °C in an air-stream cube incubator. Before imaging, the culture medium was replaced with fresh Dulbecco’s modified Eagle medium/nutrient mixture F-12 (DMEM-F12) containing 2% FBS without phenol red.

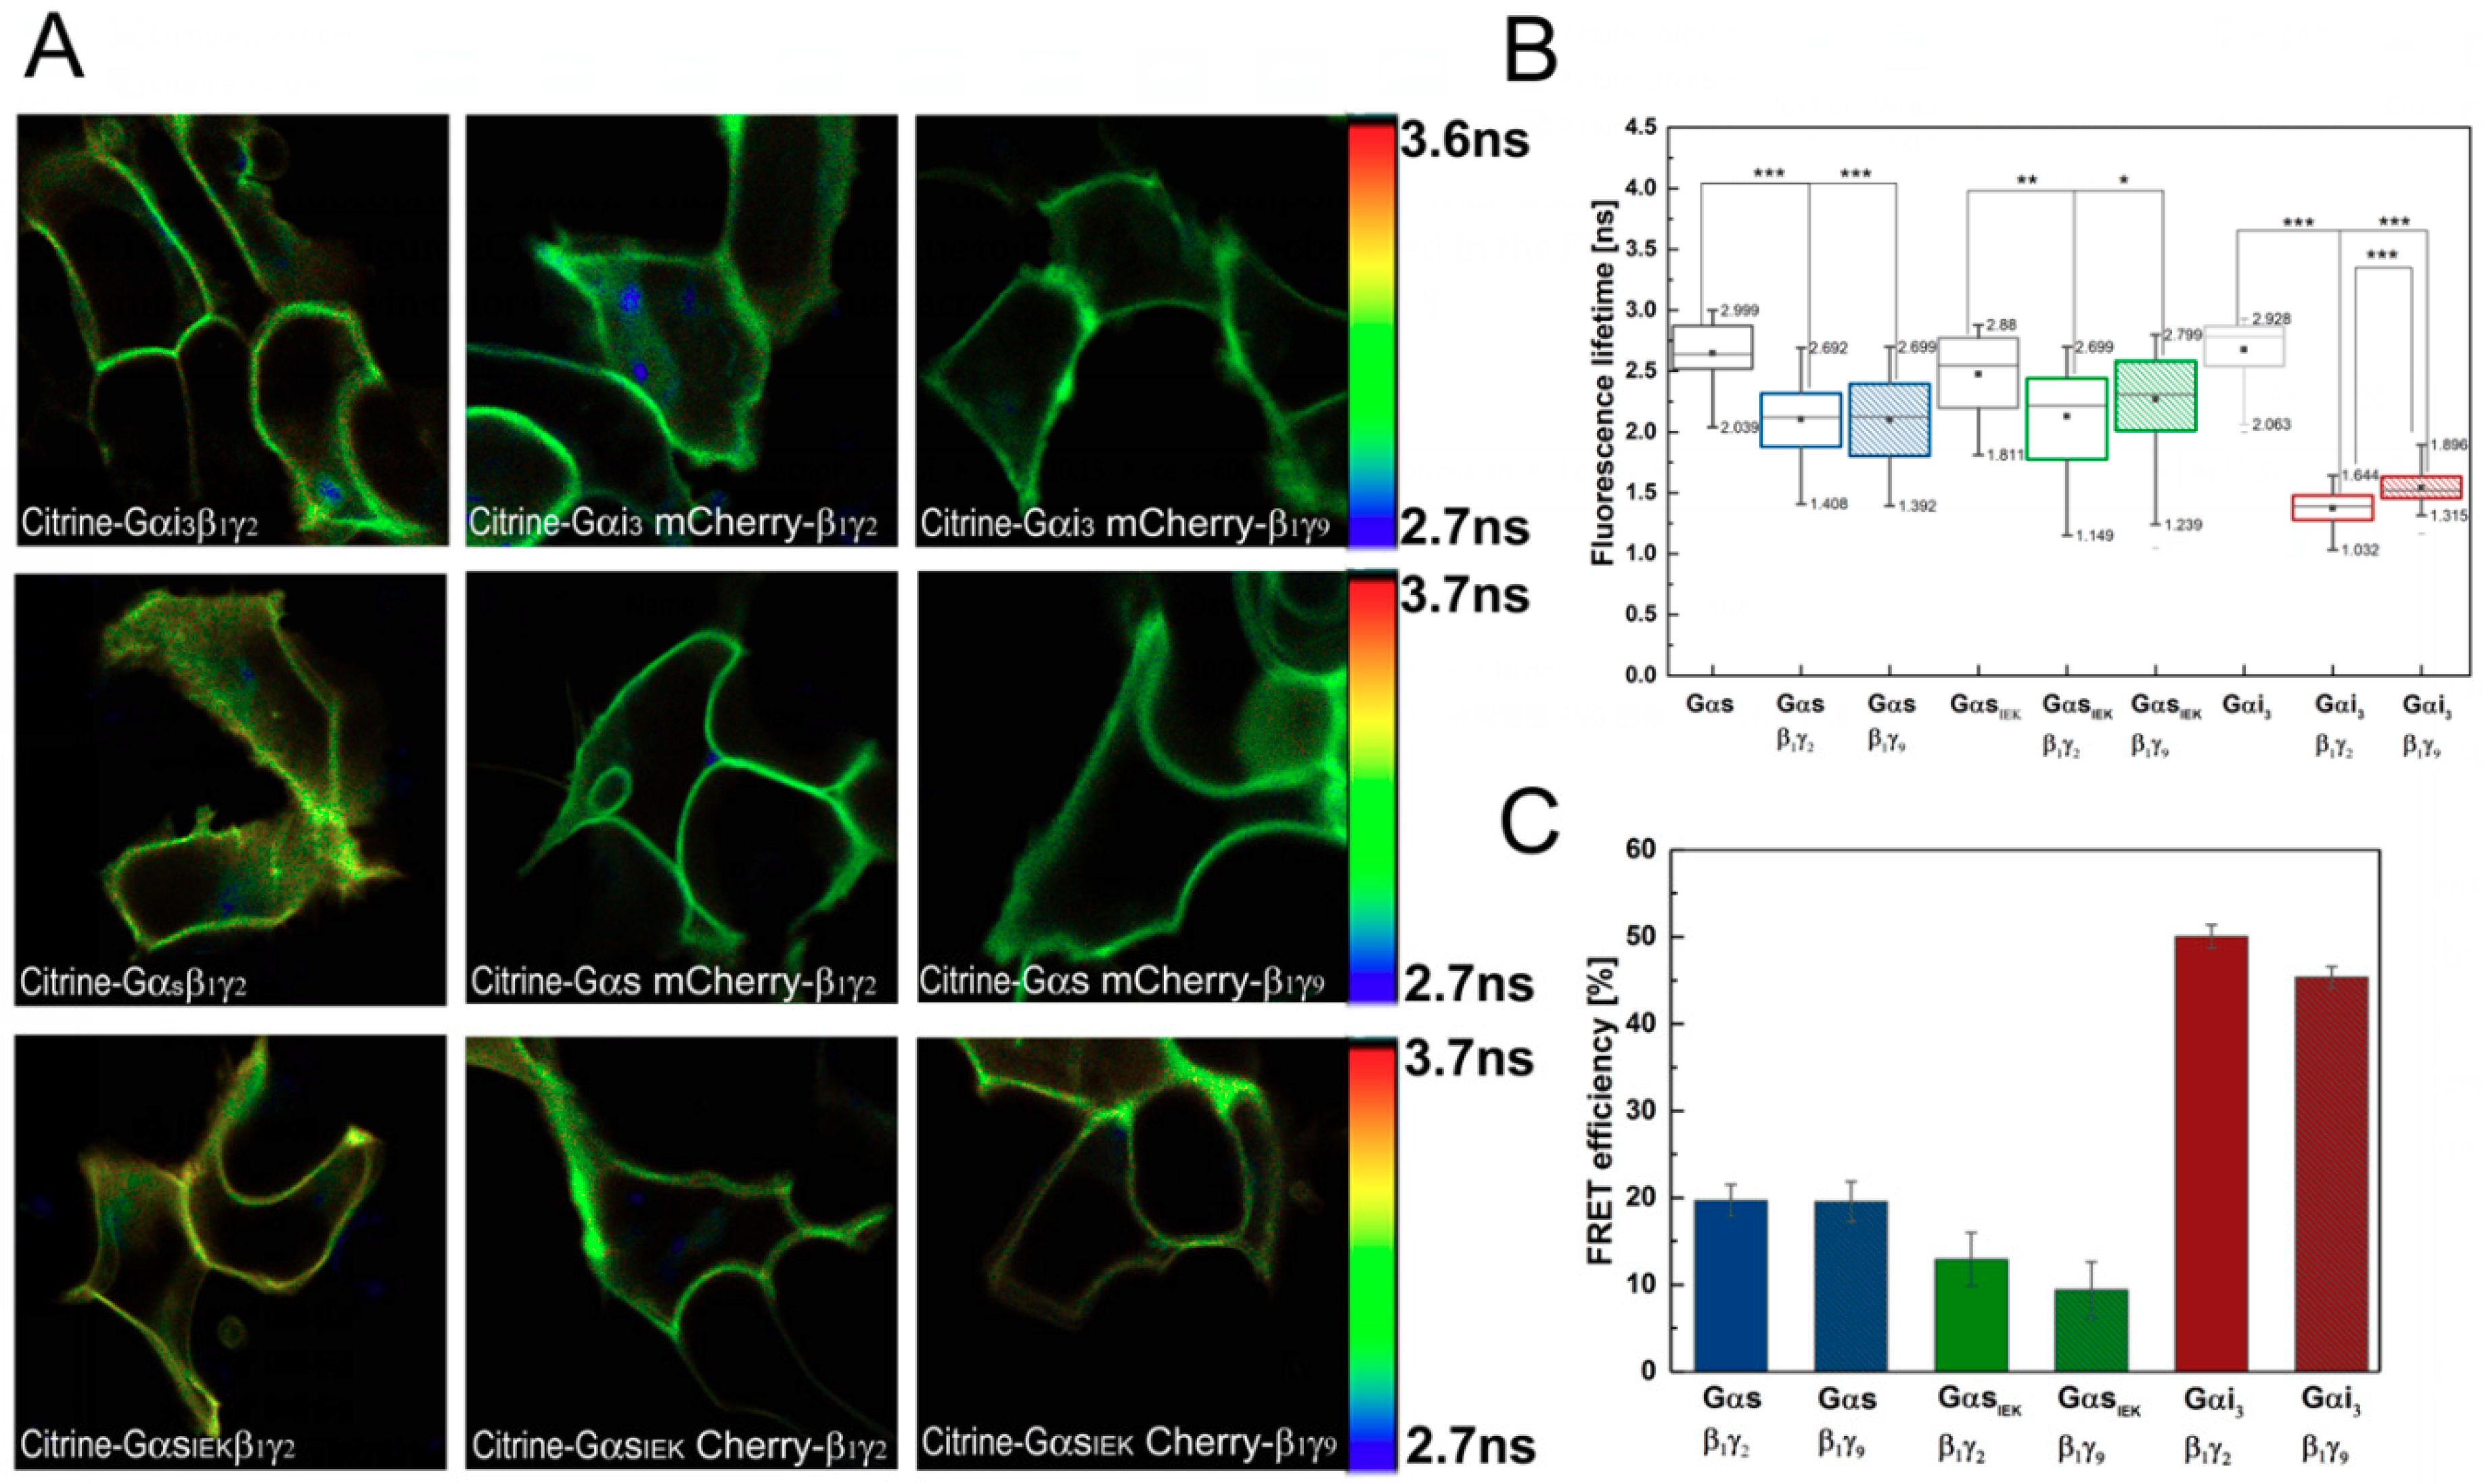
2.6. Fluorescence Lifetime Imaging

A time-domain fluorescence lifetime imaging FLIM was performed with a confocal laser-scanning microscope (TCS SP5; Leica Microsystems, Mannheim) additionally equipped with a single-photon counting device with picosecond time resolution (PicoHarp 300, PicoQuant, Berlin, Germany). Details of the instrumentation are as described previously [22,25]. Images were recorded using the following settings: 63× oil-immersion objective with numerical aperture (NA) 1.4 at 37 °C with a frame size of 512 × 512 pixels and 470 nm laser in pulse mode at 40 MHz. Fluorescence was detected by a single-photon avalanche photodiode (τ-SPAD, PicoQuant) in a narrow range of 500–550 nm (band-pass filter). Citrine and mCherry fluorophores were used as FRET pairs. SPAD signals were analyzed with the SymPhoTime software (PicoQuant). The decay of Citrine intensity distribution was approximated in the subsequent fluorescence lifetime analysis by a bi-exponential decay model wherein we estimated four parameters—fluorescence lifetimes (τ) and relative abundances of the components of the donor molecules in the sample. FLIM images were generated using the SymPhoTime software (PicoQuant) by displaying pixel-wise average lifetimes in pseudo-colors. During the analysis, the instrument response function (IRF) was applied to obtain short lifetime components with a high accuracy.
Reduction of fluorescence lifetime between donor-only and FRET samples were calculated from the means of donor-only and FRET samples, with inclusion of fractional standard errors. The FRET efficiency (E) was calculated based on the following equation:
E = 1 − τda/τd,
where: τda is the lifetime of donor in the presence of acceptor molecules, and τd is the lifetime of the donor only [26]. The energy transfer was analyzed only at the plasma membrane.

2.7. FRAP Measurements

All experiments using the FRAP microscopy technique were performed and analyzed as described earlier [22]. Briefly, FRAP images were collected by using the Leica TCS SP5 confocal scanning microscope with LAS AF software and an immersion lens 63 × 1.4 NA. Experiments were performed on transiently transfected live cells of the HEK 293 line at 37 °C. Just before imaging, the culture medium was replaced with fresh DMEM-F12 medium without phenol red and enriched with 2% FBS serum. Data was collected for at least 100 s after the photobleaching impulse.

2.8. Statistical Analyses

The FRAP and FLIM-FRET data was collected for at least five independent experiments. The distribution of data was determined (normality by Shapiro–Wilks’ W test; additionally, shape of the distribution by skewness and kurtosis analysis). Data were presented as mean ± standard error of the mean (S.E.M.) and the unpaired t-test was performed when the data were normally distributed. The assumption of equality of variances was verified by Levene’s test. Otherwise, data were represented as median ± median absolute deviation (MAD) and the Mann–Whitney U test was executed. Outliers, whose presence was evaluated by the box plot method or Grubbs’s test, were excluded from statistical analysis. The number of samples in each experiment (n) and p-values are presented in figure legends and tables. Statistical analysis was performed with Statistica (data analysis software system), version 13 (TIBCO Software Inc., Palo Alto, CA, USA, 2017; http://statistica.io).

3. Results

3.1. Functionality of Fluorescently-Tagged G-Proteins

We have shown previously that stimulatory Gαs and inhibitory Gαi3 subunits are located in distinct types of the membrane domains, depending on their specific activation state [22,25]. In previous experiments we reported that co-transfection of Gαs or Gαi3 with the Gβ1γ2 dimer and the dopamine D1 receptor influences the membrane location of Gαs and, to a lesser extent, of the Gαi3 [25]. In their presence, Gα, complexed with Gβ1γ2, relocates outside the liquid-ordered membrane domains. Because of the possibility that this result arose from the concurrent actions of the Gβ1γ2 dimer and the D1 receptor, in the present study we focused solely on the effect of Gβγ. More specifically, we addressed the question whether the localization of the heterotrimer at the plasma membrane was controlled only by the Gβγ dimer.
Tagging proteins of interest with FP might reduce their biological function due to undesired conformational changes or steric hindrance introduced by the tags. In order to avoid this, we selected loop-tagged Gαs and Gαi3 and amino-terminal-tagged Gβ1 for further optimization and analyses. The FP sequence was inserted into the L1 loop in the Gαs subunit (the loop from Glu71 to Ser82 residue (G.h1ha.7-G.h1ha.18) was exchanged), and into the second loop (αBC loop) within the helical domain of the Gαi3 subunit (FP sequence cloned after Ala114 residue (H.hbhc.2)). All investigated proteins displayed plasma membrane localization as shown by the fluorescence images, confirming that the presence of tags does not disturb their membrane-binding ability (Figure 1). The loop fusion Gαs has been reported to be functional [27]. Additionally, intracellular cAMP level was measured in order to check the functional activity of all designed fusion proteins.
The Gαs and Gαi3 subunits are distinct and provide the specificity for activation and inhibition, respectively, of adenylyl cyclase. Depending on the Gα subclass, HEK 293 cells were co-transfected with adenosine A2A or the dopamine D2 receptor. In response to extracellular stimuli with a suitable agonist (2-phenylaminoadenosine or sumanirole), a rapid increase or reduction in the production of cAMP was detected for Gαs or Gαi3, respectively (Figure 1A,B). These results indicate that the tagged G-protein heterotrimers are signaling-active. The Gαs heterotrimers were capable of more than eight-fold induction in cAMP over the basal level. In turn, Gαi3 heterotrimers showed pronounced inhibitory effect. Gαi3, tagged with Citrine or mGFP, was examined and no significant differences in cAMP production between these fusion proteins were found. Intriguingly, trimers composed of Gβ1γ9 changed the basal cAMP level in HEK 293 cells less efficiently than trimers consisting of Gβ1γ2, especially Gαi3β1γ9. This finding may be explained by a potentially less effective formation of the full heterotrimeric Gαβ1γ9 complex than Gαβ1γ2. It was previously reported that some combinations of Gα and Gβγ were less stable and dissociated over longer periods of time [28]. On the other hand, the coupling of the Gαβ1γ2 protein to dopamine D2R or adenosine A2AR, in response to agonist activation, may be more productive than interaction with Gαβ1γ9. In cryogenic electron microscopy (cryo-EM) structures, there are no visible interactions between the Gγ subunit and A2AR [29] or with other receptors like 5-HT1B [29], A1R [30] or μOR [31]. Nonetheless, the subclass of the Gγ subunit is essential in governing the formation of a GPCR–G-protein complex, as it was reported for NTR1, adenosine A1 and muscarinic M2 receptors [28,32,33]. It has been shown that, especially, the C-terminal amino acid sequence of the Gγ subunit and its native acyl group are important determinants for the interaction between GPCR and the G-protein heterotrimer [33].

3.2. Analysis of G-Protein Interactions in Live Cells Using FLIM–FRET Microscopy

FLIM–FRET was employed to assess whether the Gγ subunits played a role in plasma membrane localization and formation of the G-protein heterotrimer. For these reasons, we performed experiments to evaluate the molecular interactions of two dimers, Gβ1γ2 and Gβ1γ9, with Gαs and Gαi3. As we have reported, these two different Gα subclasses show different lipid preferences and, consequently, are localized in distinct types of membrane domains [25]. Thus, we examined here if heterotrimer formation was also controlled in a Gα-subclass dependent manner.
We monitored FRET by measuring the lifetime of the donor fluorophore (Citrine) in the absence and presence of the acceptor (mCherry), as described in the Materials and Methods section. In our experimental system, Citrine (Citrine–Gαi3β1γ2, Citrine–Gαsβ1γ2) exhibited a double exponential decay with lifetimes of 2.7 ± 0.1 ns (τ1) and 3.4 ± 0.15 ns (τ2), implying the existence of two donor species. The amplitude of each of these lifetimes was approximately 50%. The presence of multi-exponential fluorescence decays in various intrinsically FP such as Citrine, cyan fluorescent protein (CFP), enhanced cyan fluorescent protein (ECFP), monomeric green fluorescent protein (mGFP), and Discosoma red fluorescent protein (DsRed) has been reported in several articles [34,35,36]. In the FRET system (the cells expressing Citrine–Gα were additionally transfected with mCherry–Gβ1 and the appropriate Gγ), the donor emission curves were also fitted to a double exponential decay model. However, a shortening of the fluorescence lifetime due to FRET was observed only for the short component τ1, while τ2 remained almost unchanged (compared to the donor alone). This indicates that only one donor species (characterized by lifetime τ1) underwent FRET (FRETing donor fluorophore state) and that the other species with the longer lifetime (τ2) was not engaged in FRET (non-FRETing donor fluorophore state). Therefore, only the FRETing component was used to calculate FRET efficiency (Figure 2C). Lifetime shortening due to FRET was also observed in the FLIM images as a uniform change in color toward the blue hues across all pixels (Figure 2A).
As shown in Figure 2B, different combinations of Gα subunits and Gβ1γ dimers gave varying levels of donor lifetime changes (box chart), and thus unequal FRET efficiencies. The highest FRET efficiency of 50% was obtained in cells expressing Gαi3β1γ2 and the efficiency was only 5% lower for the Gαi3β1γ9 heterotrimer. In contrast to Citrine–Gαi3, Citrine–Gαs exhibited a lower FRET signal when paired with either mCherry–Gβ1γ2 or mCherry–Gβ1γ9. The lifetime of Citrine–Gαs in cells co-expressing the mCherry–Gβ1γ2 dimer was found to be 2.12 ± 0.21 ns, amounting to 19.7% energy transfer efficiency, and a similar value was obtained for the complex with the mCherry–Gβ1γ9 dimer, giving a FRET signal of 19.5%.
An important question is whether the differences in FRET efficiency we observed are a measure of the efficiency of association between the interacting proteins or a consequence of structural differences between the heterotrimers. In the case of two proteins labeled with donor and acceptor molecules, FRET is highly dependent not only on the distance between the donor and acceptor but also on the stoichiometry of macromolecular interactions as well as on the donor fraction taking part in complex formation with acceptors. Therefore, an increase in FRET efficiency in our system can be interpreted as a quantitatively higher percentage of complexes formed between a particular Gα and Gβγ, especially when we are comparing trimers with the same Gα. Since Citrine in fusion proteins is integrated into other loops in the Gαs and Gαi3 structure (Figure 3), the structural differences between their heterotrimers should also be considered.
Considering the results of intracellular cAMP concentrations obtained for Gαi3 heterotrimers, it seems reasonable to conclude that FRET efficiency for these complexes may be related to their content at the plasma membrane. The smaller FRET efficiency between Citrine–Gαi3 and mCherry–Gβ1γ9 is reflected in a smaller decrease in cAMP concentration when compared to Gαi3β1γ2. No differences were found in FRET efficiency between the investigated Gαs heterotrimers, indicating a similar level of Gαsβ1γ2 and Gαsβ1γ9 complexes at the plasma membrane. However, as shown in Figure 4B, a slight difference in the cAMP concentrations of Gαsβ1γ2 and Gαsβ1γ9 can be observed, although it is not statistically significant and is smaller than between Gαi3 heterotrimers. Thus, even if there is a difference in the concentrations of these complexes at the plasma membrane, it is not substantial. On the contrary, there are significant differences in FRET signals between Gαs and Gαi3 heterotrimers which cannot be uniquely attributed to only a single factor. Most probably the FRET signal reflects a mixture of effects, i.e., a potentially lower percentage of trimers composed of Gαs and Gβ1γ2 or Gβ1γ9 dimers than Gαi3 heterotrimers, and structural differences between these heterotrimers due to different localizations of fluorescence donors (Figure 3). The estimated difference in the distance separating mCherry–Gβ1 and Citrine–Gαs is, on average, 6.5 Å longer than in the Gαi3 heterotrimer. Thus, the energy transfer efficiency in the Gαs heterotrimers should be lower by about 7% than in Gαi3 heterotrimers, assuming Förster distance R0 of 56.6 Å for this pair of fluorophores [38,39].
As all the investigated Gα subunits and Gβγ dimers exist as complexes and interact directly in our FRET-FLIM assays (Figure 2A–C), we further examined the sensitivity and specificity of the measured FRET signals. In order to improve the detection sensitivity of FRET, we treated the cells with GppNHp (5′-guanylimidodiphosphate; concentration: 0.1 or 0.2 mM; time frame: 0–60 min.), a non-hydrolysable analog of GTP, to induce subsequent dissociation of the Gα–GppNHp complex from Gβγ. Since the G-protein is continuously active, the FRET signal between Citrine–Gα and mCherry-Gβ1 was expected to be significantly reduced; however, no such changes were observed for any of the examined heterotrimers. We also tested GppNHp at an eight-fold higher concentration and again observed insensitivity or occasional reduction of the FRET signal. This suggests that the heterotrimer was not affected by GppNHp added to the cell culture. These findings prompted us to construct a mutant of Gαs, defective in the formation of functional heterotrimers rather than in the permeabilization of cell membranes, leading to a disruption of the native membrane. The residue Ile26–Glu27–Lys28 of Gαs has long been recognized as being essential for its interaction with Gβ, and a suitable mutation is believed to impair the assembly of a functional heterotrimer [40]. We engineered a GαsIEK mutant in which each of the interacting amino acid residues was substituted with alanine and expected that the formation of the heterotrimer would be impaired. Similar mutation constructs were previously shown to have a strong propensity to disrupt membrane localization and palmitoylation of the Gαs subunit as well as deficient binding to Gβγ [23]. To examine the effect of the IEK mutation on the ability of Gαs to interact with Gβγ, GαsIEK was co-expressed with Gβ1γ2 or Gβ1γ9 in HEK 293 cells. As shown in Figure 1, GαsIEK exhibited plasma membrane localization and co-localization with Gβ1γ2 or Gβ1γ9, but to a lower extent than the wild-type Gαs. We also examined cAMP production to ensure that the mutation introduced in Gαs fulfilled its role. As shown in Figure 4B, a clear reduction in cAMP production was observed as compared to the wild-type Gαs and the cAMP concentration was approximately three times lower than for Gαs. These findings suggest a lower GαsIEK heterotrimer content than that of Gαs at the plasma membrane, which led to a reduced activation of adenylyl cyclase.
To further confirm that the observed increase in cAMP concentration over the basal level resulted from the direct interaction of Gβ1 with GαsIEK, we performed a pull-down assay. Cell lysates containing Citrine–GαsIEK or Citrine–Gαs were loaded onto NiNTA agarose baited with His6-tagged forms of mCherry–Gβ1 and then the complexes were eluted. Furthermore, purified proteins were detected by immunoblotting with an antibody against the N-terminal epitope of Gαs and against the His6-tag of Gβ1. Figure 4C summarizes the results of all pull-down experiments, showing the binding of GαsIEK to His6-tagged Gβ1. No clear signal was observed for the negative cell lysate (Figure 4C), thus confirming that the band detected by the anti-Gαs antibody is GαsIEK associated with Gβ1 and not endogenous Gαs present in the cell lysate. Incubation of the membrane fraction of cells overexpressing GαsIEK and Gβ1γ2 with the NiNTA resin resulted in a signal from GαsIEK, once again indicating the presence of the full GαsIEKβ1γ2 heterotrimer. Since these pull-down experiments are qualitative or at best semi-quantitative in nature, we did not attempt to quantify the relative amounts of the GαsIEKβ1γ2 and Gαsβ1γ2 heterotrimers.
Our data strongly suggest that the IEK mutation in Gαs is Gβγ binding-deficient, the heterotrimer is formed less efficiently and has impaired activity but is still able to activate adenylyl cyclase. The examined Gβ-binding surface on the Gα subunit may not be the only essential interacting region of the heterotrimer assembly. The mutation did not prevent the heterotrimer formation but confirmed the specificity and sensitivity of the measured FRET signals. The FRET efficiency between Citrine–GαsIEK and mCherry–Gβγ dimers was reduced to 12.9% and 9.4% as compared to wild-type Gαs in the presence of Gβ1γ2 and Gβ1γ9 dimers, respectively (Figure 2C). These results demonstrate that differences in the heterotrimer levels of the mutant GαsIEK and the wild-type protein are reflected in the detection of a lower FRET signal and are also consistent with the results of intracellular cAMP concentration measurements. Overall, this study confirmed the sensitivity and accuracy of FLIM–FRET as a suitable tool for studying the interactions of signaling proteins.

3.3. Effect of Gβγ Dimer on Gα Diffusion

As stated earlier, the apparent diffusion coefficients of full heterotrimers differ significantly from those of monomers of Gα subunits. The formation of the complex of the Gα subunit with the Gβγ dimer modulates the mobility of the full heterotrimer, while the presence of a specific receptor is significant as well. Here, the presence of the Gβ1γ9 dimer caused an increase in apparent diffusion coefficients for all observed Gα subunits but in a different manner (Table 1). In the case of co-expression of the Gαi3 subunit with the Gβ1γ9 dimer, the diffusion coefficient was 0.475 μm2/s, and was significantly higher compared to the value of 0.424 μm2/s obtained with the Gβ1γ2 dimer (Table 1). Conversely, for the Gαs subunit, the measured value of apparent diffusion coefficient in the presence of the Gβ1γ9 dimer was 0.202 μm2/s and was higher than for the Gαs subunit itself (0.130 μm2/s, Table 1), but significantly lower than the value measured in the presence of the Gβ1γ2 dimer–0.246 μm2/s (Table 1).
For the modified GαsIEK subunit, the apparent diffusion coefficient obtained in the presence of the Gβ1γ2 or Gβ1γ9 dimers was the same (0.214 μm2/s). The modification of the GαsIEK subunit did not affect the diffusion of this trimer subunit with the Gβ1γ9 dimer and the difference was statistically insignificant. However, the diffusion rate was reduced significantly for the subunit GαsIEK in the presence of the Gβ1γ2 dimer in comparison to the Gαsβ1γ2 heterotrimer (0.246 μm2/s, Table 1). This may indicate a selective character of mutations within the region of interaction of the Gαs subunit with the Gβγ dimer. On the other hand, the modified GαsIEK subunit was less effective in creating complexes with a Gβγ dimer (lower FRET efficiency). The diffusion coefficient observed may, therefore, be reduced by the presence of a monomeric subunit at the cell membrane.

4. Discussion

In this study, we have combined two live-cell imaging microscopic methods, FLIM–FRET and FRAP, to investigate the molecular-level assembly properties and the trafficking dynamics of G-protein heterotrimers within the cell membrane. The membrane dynamics of heterotrimer complexes were monitored by FRAP. The studied Gαs and Gαi3 subunits are expressed in most types of cells. Similarly, the Gβ1 and Gγ2 subunit expression is ubiquitous, whereas Gγ9 is mostly present in olfactory epithelium [1].
Although much progress has been made in understanding the molecular details of how G-proteins interact with GPCRs and regulate the activity of their downstream targets, it is less clear how activated GPCRs initiate this process and what the trafficking pathway of the heterotrimeric G-proteins is within the plasma membrane. The role of the plasma membrane lateral organization in the spatiotemporal distribution of GPCRs and G-proteins appears to be essential in the process of extracellular signal transduction. However, the molecular basis for the interaction of signaling molecules with lipids is still not fully understood but seems to be of key importance in understanding the functional selectivity and activation speed of cellular responses to G-protein activation. Previous evidence supports the direct role of the Gγ subunit in G-protein activation by a receptor [41,42,43], and also suggests Gγ diversity as a crucial modulator of G-protein membrane localization behaviors as well as trimer assembly [44,45,46]. Using the same FLIM–FRET and FRAP approach, we previously reported that preferences in localization within the membrane of the stimulatory and inhibitory Gα subunits, Gαs and Gαi3, are different and further modulated by the dopamine D1 receptor, as well as by the Gβ1γ2 dimer [22,25]. The association of Gβ1γ2 with the GDP-bound Gα subunit translocates G-proteins outside the liquid-ordered membrane domains, which is particularly evident for Gαs [25]. Here we confirmed the ability of the Gγ subunit to bind specific lipids, and consequently, to influence the membrane localization of the full heterotrimeric complex of the G-protein; but our results further showed that its membrane distribution was not only Gγ-subclass dependent.
In this study, we examined the impact of two distinct Gγ subunits, Gγ2, and Gγ9, on the membrane localization of G-proteins. These Gγ differ, among others, in membrane anchors at carboxyl-terminal cysteine in the CaaX motif. The prenyl group promotes tethering of Gβγ complexes to membranes, sorting of particular lipid domains, as well as playing a role in the translocation properties of the Gβγ dimer and effector activation [47,48]. The Gγ2 belongs to the group of slowest translocating Gγ subunits (t1/2 ~130 s) whereas Gγ9 belongs to the fastest one (t1/2 ~ 10 s) [19,20]. The prenylation of Gγ2 with a 20-carbon geranylgeranyl lipid, together with positively charged residues in the C-terminal domain, provides it with a higher affinity for the plasma membrane than Gγ9 with the 15-carbon farnesyl lipid attachment and fewer positively charged residues. The presence of a five-residue or six-residue cluster of positively charged amino acids in the pre-CaaX region modulates Gγ–membrane interactions, strengthening the plasma membrane affinity [20], and also governs the membrane-interacting ability of Gβγ [42]. Considering how many possible Gβγ and Gα combinations exist, a key question in G-protein signaling is whether the plasma membrane location of heterotrimers composed of distinct subunits is only Gβγ-dependent. Indeed, our FRAP data for Gγ subunits correlated well with translocation rates in a Gγ-dependent manner only for heterotrimers composed of Gαi3. The mobility of Gαi3β1γ9 is much higher than that of Gαi3β1γ2 and its population in the membrane is also lower. On the contrary, Gβ1γ2 associated with Gαs diffuses faster than Gαsβ1γ9. In fact, both Gαsβγ heterotrimers diffused significantly slower when compared with their Gαi3 associates. At the same time, if the concentrations of both the Gαs heterotrimers at the plasma membrane are comparable, the reduced mobility of Gαsβ1γ9 cannot be considered to be the result of a higher proportion of uncomplexed Gαs. The diffusion data thus indicated that the membrane localization of G-proteins was dependent not only on Gβγ but also on the Gα subtype since distinct heterotrimeric combinations showed different mobility characteristics.
The Gα subunits are palmitoylated and mostly myristoylated, depending on the specific Gα-subclass. The dual, N-palmitoylation and S-palmitoylation, of Gαs is similar to the N-myristoylation and S-palmitoylation motif of the Gαi class, but they differ in the number of positive charge residues at the N-terminus [6,49]. The membrane binding area of Gαs or Gαi3 is limited to two sites on the surface of the protein and the membrane [50]. However, most of the membrane binding area of Gα is formed by the N-terminus with covalently attached lipids. Consequently, since the IEK mutation reduces palmitoylation, apart from disrupting Gβ1 coupling, it also affects proper membrane localization of Gαs. Since this mutation reduces palmitoylation, it affects the specific binding of Gαs to the plasma membrane [23]. Indeed, our diffusion data suggest that the N-termini residues of Gαs function as an essential signal to ensure the correct localization of the subunit at the plasma membrane. Unlike for the heterotrimers formed by the wild-type Gαs and Gαi3, the diffusion coefficient of distinct GαsIEKβ1γ2 and GαsIEKβ1γ9 heterotrimers is equal, as is the intracellular cAMP concentration, indicating that the mutation eliminates the specificity of the GαsIEK heterotrimers. However, it is difficult to clearly indicate whether the substitution of charged residues in the Gβγ interacting surface or the reduced palmitoylation impairs the specificity of heterotrimer membrane targeting. Nevertheless, the presented results support the notion of the presence of membrane attachment signals in the N-termini of Gα subunits.
As we previously reported, preferences in localization within the membrane of the stimulatory and inhibitory Gα subunits are different [25]. Gαs prefers solid-like domains (insensitive to cholesterol and structure or composition of lipid rafts), while Gαi3 prefers the more fluid regions of the membrane and also detergent-resistant lipid rafts. The membrane mobility of Gαs is relatively slow, while the Gαi3 diffusion is much faster. When Gβγ dimer binds to the Gα, despite the increase in the molecular weight of the complex, it accelerates the lateral diffusion of Gα in all tested heterotrimers. Thus, this finding again strengthens the hypothesis that the Gβγ dimer not only affects the diffusion of Gα but also relocates complexed Gα within the plasma membrane. Notably, it is evident in the case of Gαs heterotrimers because the apparent diffusion coefficient is more than 1.5 times greater than for the uncomplexed subunit. As demonstrated previously, the Gβγ dimer is responsible for the rapid relocation of Gα from the lamellar membrane region where it resides as a monomer [25,51]. The Gβγ complex remains associated with the non-lamellar regions which may explain the acceleration of the diffusion rate of heterotrimers compared to monomeric Gα [51]. Interestingly, as mentioned above, the lateral mobility of the G-proteins composed of the Gβ1γ2 dimer differs significantly from those containing Gβ1γ9 dimer; the diffusion rates of distinct heterotrimers are characterized by different values of diffusion coefficients. Hence, while the Gβγ dimer defines the affinity of the complete heterotrimer for the lipid phase, the differences in the prenyl moieties are not sufficient to explain the differential diffusion of the full heterotrimers. Our data correspond with the FRET-clustering analysis of fluorescently-tagged heterotrimeric G-protein-derived membrane anchors [52]. The authors have shown that the N-terminal sequences of Gαi/o and Gαq and their heterotrimers (the N-terminal part of Gαi2 or Gαq merging with the C-terminal part of Gγ2) were clustered together in different domains. Moreover, postulated membrane domains partially share their area causing overlapping domains, thus strengthening co-clustering. Upon activation the heterotrimers dissociate and the Gα subunits displace into a subclass-specific domains. Our FRAP data do not support the pre-activation co-clustering of the distinct heterotrimeric G-proteins. A possible explanation for this discrepancy in conclusions correlates with the use of membrane anchors of Gα and Gγ subunits but not, as in the present study, with full-length G-proteins.
In addition to those previously identified, both components, Gβγ dimer and Gα, determine final membrane localization of the full heterotrimer. These findings imply that the dissociation of the G-protein on activation and subsequent re-association on deactivation, are also influenced by the subclass of the Gα subunit. Yet, the FRAP measurements could not precisely resolve membrane distribution of G-protein but strongly suggested the possibility of different localizations at the plasma membrane of particular heterotrimers (membrane domains/regions differing in lipid composition and properties). The results presented here indicate that the diffusion rates of heterotrimers composed of different Gβγ and Gα subunits were not directly related to the membrane dissociation Gγ-pattern that were determined by the nature of the prenyl group and by basic residues in the C termini of Gγ. The role of the Gα subunit in determining the membrane localization by interacting with lipids and Gβγ dimers shown in the present study suggests that the Gγ translocation rate can, consequently, be also affected by the Gα subunit.
The mobility of the G-proteins and dissociated subunits is heterogeneous, suggesting non-random distribution within the cell membranes, which may strongly reflect the natural functions of these proteins. Many studies have emphasized the importance of the clustering of membrane proteins in a manner dependent on their functional state [53,54]. Results obtained in the present study show that divergent heterotrimers localize to distinct membrane locations due to the combined lipid modifications on Gα and Gγ, together with a different number and distribution of adjacent positively charged residues (i.e., various classes of G-proteins located in distinct domains relocate upon activation and dissociation into subunits). Since the cell membrane is currently considered as a highly complex structure, the role of distinct types of membrane domains in the spatiotemporal organization of GPCRs and G-proteins in the process of signal transduction needs further studies.

Author Contributions

Conceptualization: A.P. and P.M. Formal analysis: A.P., P.M. and B.R. Funding acquisition: A.P. Investigation: Genetics constructs: P.M. and J.G. FRAP experiments: P.M. FLIM–FRET experiments: A.P. and J.G. cAMP production experiments: B.R. Pull-down assay: A.P. and P.M. Project administration: A.P. Visualization: A.P., P.M. and B.R. Writing—original draft: A.P. and P.M. Writing—review and editing: A.P., M.D.-W. and P.M.

Funding

This work was supported by a grant awarded by Polish National Center for Science (NCN) no. 2016/23/B/NZ1/00530.

Acknowledgments

The authors would like to thank Jerzy Dobrucki—the head of the Department of Cell Biophysics of Jagiellonian University for providing access to the confocal microscopes.

Conflicts of Interest

The authors declare no competing financial interest.

References

  1. Syrovatkina, V.; Alegre, K.O.; Dey, R.; Huang, X.Y. Regulation, Signaling, and Physiological Functions of G-Proteins. J. Mol. Biol. 2016, 428, 3850–3868. [Google Scholar] [CrossRef] [PubMed] [Green Version]
  2. Cabrera-Vera, T.M.; Vanhauwe, J.; Thomas, T.O.; Medkova, M.; Preininger, A.; Mazzoni, M.R.; Hamm, H.E. Insights into G Protein Structure, Function, and Regulation. Endocr. Rev. 2003, 24, 765–781. [Google Scholar] [CrossRef] [PubMed] [Green Version]
  3. Yang, W.; Hildebrandt, J.D. Genomic analysis of G protein γ subunits in human and mouse—The relationship between conserved gene structure and G protein βγ dimer formation. Cell. Signal. 2006, 18, 194–201. [Google Scholar] [CrossRef] [PubMed]
  4. Degtyarev, M.Y.; Spiegel, A.M.; Jones, T.L.Z. Increased palmitoylation of the G(s) protein α subunit after activation by the β-adrenergic receptor or cholera toxin. J. Biol. Chem. 1993, 268, 23769–23772. [Google Scholar]
  5. Loisel, T.P.; Adam, L.; Hebert, T.E.; Bouvier, M. Agonist stimulation increases the turnover rate of β2AR-bound palmitate and promotes receptor depalmitoylation. Biochemistry 1996, 35, 15923–15932. [Google Scholar] [CrossRef] [PubMed]
  6. Kleuss, C.; Krause, E. Gαs is palmitoylated at the N-terminal glycine Christiane. EMBO J. 2003, 22, 826–832. [Google Scholar] [CrossRef] [PubMed]
  7. Farazi, T.A.; Waksman, G.; Gordon, J.I. The Biology and Enzymology of Protein N-Myristoylation. J. Biol. Chem. 2001, 276, 39501–39504. [Google Scholar] [CrossRef] [PubMed]
  8. Kosloff, M.; Elia, N.; Selinger, Z. Structural homology discloses a bifunctional structural motif at the N-termini of Gα proteins. Biochemistry 2002, 41, 14518–14523. [Google Scholar] [CrossRef]
  9. Crouthamel, M.; Abankwa, D.; Zhang, L.; DiLizio, C.; Manning, D.R.; Hancock, J.F.; Wedegaertner, P.B. An N-Terminal Polybasic Motif of G q Is Required for Signaling and Influences Membrane Nanodomain Distribution. Mol. Pharmacol. 2010, 78, 767–777. [Google Scholar] [CrossRef]
  10. Pedone, K.H.; Hepler, J.R. The Importance of N-terminal polycysteine and polybasic sequences for G14αand G16α palmitoylation, plasma membrane localization, and signaling function. J. Biol. Chem. 2007, 282, 25199–25212. [Google Scholar] [CrossRef]
  11. Crouthamela, M.; Thiyagarajan, M.M.; Evanko, D.S.; Wedegaertner, P.B. N-terminal polybasic motifs are required for plasma membrane localization of Gαs AND Gαq. Cell Signal. 2008, 20, 1900–1910. [Google Scholar] [CrossRef] [PubMed]
  12. Sondek, J.; Bohm, A.; Lambright, D.G.; Hamm, H.E.; Sigler, P.B. Crystal structure of a GA protein βγdimer at 2.1 Å resolution. Nature 1996, 379, 369–374. [Google Scholar] [CrossRef] [PubMed]
  13. Higgins, J.B.; Casey, P.J. The role of prenylation in G-protein assembly and function. Cell. Signal. 1996, 8, 433–437. [Google Scholar] [CrossRef]
  14. Dunphy, J.T.; Linder, M.E. Signalling functions of protein palmitoylation. Biochim. Biophys. Acta Mol. Cell Biol. Lipids 1998, 1436, 245–261. [Google Scholar] [CrossRef]
  15. McLaughlin, S.; Aderem, A. The myristoyl-electrostatic switch: A modulator of reversible protein-membrane interactions. Trends Biochem. Sci. 1995, 20, 272–276. [Google Scholar] [CrossRef]
  16. Resh, M.D. Fatty acylation of proteins: New insights into membrane targeting of myristylated and palmitoylated proteins. Biochim. Biophys. Acta Mol. Cell Res. 1999, 1451, 1–16. [Google Scholar] [CrossRef]
  17. Hancock, J.F.; Paterson, H.; Marshall, C.J. A polybasic domain or palmitoylation is required in addition to the CAAX motif to localize p21ras to the plasma membrane. Cell 1990, 63, 133–139. [Google Scholar] [CrossRef]
  18. Morales, J.; Fishburn, C.S.; Wilson, P.T.; Bourne, H.R. Plasma Membrane Localization of Galpha z Requires Two Signals. Mol. Biol. Cell 1998, 9, 1–14. [Google Scholar] [CrossRef]
  19. Karunarathne, W.K.A.; O’Neill, P.R.; Martinez-Espinosa, P.L.; Kalyanaraman, V.; Gautam, N. All G protein βγ complexes are capable of translocation on receptor activation. Biochem. Biophys Res. Commun. 2012, 421, 605–611. [Google Scholar] [CrossRef]
  20. O’Neill, P.R.; Karunarathne, W.K.A.; Kalyanaraman, V.; Silvius, J.R.; Gautam, N. G-protein signaling leverages subunit-dependent membrane affinity to differentially control translocation to intracellular membranes. Proc. Natl. Acad. Sci. USA 2012, 109, E3568–E3577. [Google Scholar]
  21. Chisari, M.; Saini, D.K.; Kalyanaraman, V.; Gautam, N. Shuttling of G protein subunits between the plasma membrane and intracellular membranes. J. Biol. Chem. 2007, 282, 24092–24098. [Google Scholar] [CrossRef] [PubMed]
  22. Mystek, P.; Tworzydło, M.; Dziedzicka-Wasylewska, M.; Polit, A. New insights into the model of dopamine D1 receptor and G-proteins interactions. Biochim. Biophys. Acta Mol. Cell Res. 2015, 1853, 594–603. [Google Scholar] [CrossRef] [PubMed] [Green Version]
  23. Evanko, D.S.; Thiyagarajan, M.M.; Wedegaertner, P.B. Interaction with Gbetagamma is required for membrane targeting and palmitoylation of Galpha(s) and Galpha(q). J. Biol. Chem. 2000, 275, 1327–1336. [Google Scholar] [CrossRef] [PubMed]
  24. Bond, S.R.; Naus, C.C. RF-Cloning.org: An online tool for the design of restriction-free cloning projects. Nucleic Acids Res. 2012, 40, 209–213. [Google Scholar] [CrossRef] [PubMed]
  25. Mystek, P.; Dutka, P.; Tworzydło, M.; Dziedzicka-Wasylewska, M.; Polit, A. The role of cholesterol and sphingolipids in the dopamine D1 receptor and G protein distribution in the plasma membrane. Biochim. Biophys. Acta Mol. Cell Biol. Lipids 2016, 1861, 1775–1786. [Google Scholar] [CrossRef] [PubMed]
  26. Lakowicz, J.R. Principles of Fluorescent Spectroscopy, 3rd ed.; Springer: New York, NY, USA, 2006. [Google Scholar]
  27. Gibson, S.K.; Gilman, A.G. Gialpha and Gbeta subunits both define selectivity of G protein activation by alpha2-adrenergic receptors. Proc. Natl. Acad. Sci. USA 2006, 103, 212–217. [Google Scholar] [CrossRef] [PubMed]
  28. Hillenbrand, M.; Schori, C.; Schöppe, J.; Plückthun, A. Comprehensive analysis of heterotrimeric G-protein complex diversity and their interactions with GPCRs in solution. Proc. Natl. Acad. Sci. USA 2015, 112, E1181–E1190. [Google Scholar] [CrossRef] [PubMed]
  29. García-Nafría, J.; Lee, Y.; Bai, X.; Carpenter, B.; Tate, C.G. Cryo-EM structure of the adenosine A 2A receptor coupled to an engineered heterotrimeric G protein. eLife 2018, 7, 267674. [Google Scholar] [CrossRef]
  30. Glukhova, A.; Draper-Joyce, C.J.; Sunahara, R.K.; Christopoulos, A.; Wootten, D.; Sexton, P.M. Rules of Engagement: GPCRs and G Proteins. ACS Pharmacol. Transl. Sci. 2018, 1, 73–83. [Google Scholar] [CrossRef]
  31. Koehl, A.; Hu, H.; Maeda, S.; Zhang, Y.; Qu, Q.; Paggi, J.M.; Latorraca, N.R.; Hilger, D.; Dawson, R.; Matile, H.; et al. Structure of the μ-opioid receptor-G i protein complex. Nature 2018, 558, 547–552. [Google Scholar] [CrossRef]
  32. Hou, Y.; Azpiazu, I.; Smrcka, A.; Gautam, N. Selective role of G protein γ subunits in receptor interaction. J. Biol. Chem. 2000, 275, 38961–38964. [Google Scholar] [CrossRef] [PubMed]
  33. Myung, C.S.; Lim, W.K.; DeFilippo, J.M.; Yasuda, H.; Neubig, R.R.; Garrison, J.C. Regions in the G Protein Subunit Important for Interaction with Receptors and Effectors. Mol. Pharmacol. 2005, 69, 877–887. [Google Scholar] [CrossRef] [PubMed]
  34. Hess, S.T.; Sheets, E.D.; Wagenknecht-Wiesner, A.; Heikal, A.A. Quantitative analysis of the fluorescence properties of intrinsically fluorescent proteins in living cells. Biophys. J. 2003, 85, 2566–2580. [Google Scholar] [CrossRef]
  35. Ghosh, A.; Isbaner, S.; Veiga-Gutiérrez, M.; Gregor, I.; Enderlein, J.; Karedla, N. Quantifying Microsecond Transition Times Using Fluorescence Lifetime Correlation Spectroscopy. J. Phys. Chem. Lett. 2017, 8, 6022–6028. [Google Scholar] [CrossRef]
  36. Heikal, A.A.; Hess, S.T.; Baird, G.S.; Tsien, R.Y.; Webb, W.W. Molecular spectroscopy and dynamics of intrinsically fluorescent proteins: Coral red (dsRed) and yellow (Citrine). Proc. Natl. Acad. Sci. USA 2000, 97, 11996–12001. [Google Scholar] [CrossRef] [PubMed] [Green Version]
  37. Pettersen, E.F.; Goddard, T.D.; Huang, C.C.; Couch, G.S.; Greenblatt, D.M.; Meng, E.C.; Ferrin, T.E. UCSF Chimera—A visualization system for exploratory research and analysis. J. Comput. Chem. 2004, 25, 1605–1612. [Google Scholar] [CrossRef] [PubMed]
  38. Akrap, N.; Seidel, T.; Barisas, G.B. Förster distances for FRET between mCherry and other Visible Fluorescent Proteins. Anal. Biochem. 2010, 402, 105–106. [Google Scholar] [CrossRef]
  39. Vogel, S.S.; van der Meer, B.W.; Blank, P.S. Estimating the distance separating fluorescent protein FRET pairs. Methods 2014, 66, 131–138. [Google Scholar] [CrossRef] [PubMed]
  40. Lambright, D.G.; Sondek, J.; Bohm, A.; Skiba, N.P.; Hamm, H.E.; Sigler, P.B. The 2.0 Å crystal structure of a heterotrimeric G protein. Nature 1996, 379, 311–319. [Google Scholar] [CrossRef]
  41. Lim, W.K.; Myung, C.; Garrison, J.C.; Neubig, R.R. Receptor-G Protein γ Specificity: γ11 Shows Unique Potency for A1 Adenosine and 5-HT1A Receptors. Biochemistry 2001, 40, 10532–10541. [Google Scholar] [CrossRef]
  42. Senarath, K.; Payton, J.L.; Kankanamge, D.; Siripurapu, P.; Tennakoon, M.; Karunarathne, A. Gγ identity dictates efficacy of Gβγ signaling and macrophage migration. J. Biol. Chem. 2018, 293, 2974–2989. [Google Scholar] [CrossRef] [PubMed]
  43. Kisselev, O.; Pronin, A.; Ermolaeva, M.; Gautam, N. Receptor-G protein coupling is established by a potential conformational switch in the beta gamma complex. Proc. Natl. Acad. Sci. USA 2006, 92, 9102–9106. [Google Scholar] [CrossRef] [PubMed]
  44. Khan, S.M.; Sleno, R.; Gora, S.; Zylbergold, P.; Laverdure, J.-P.; Labbe, J.-C.; Miller, G.J.; Hebert, T.E. The Expanding Roles of G Subunits in G Protein-Coupled Receptor Signaling and Drug Action. Pharmacol. Rev. 2013, 65, 545–577. [Google Scholar] [CrossRef] [PubMed]
  45. Ford, C.E.; Skiba, N.P.; Bae, H.; Daaka, Y.; Reuveny, E.; Shekter, L.R.; Rosal, R.; Weng, G.; Yang, C.S.; Iyengar, R.; et al. Molecular basis for interactions of G protein βΓ subunits with effectors. Science 1998, 280, 1271–1274. [Google Scholar] [CrossRef]
  46. Cook, L.A.; Schey, K.L.; Cleator, J.H.; Wilcox, M.D.; Dingus, J.; Hildebrandt, J.D. Identification of a region in G protein γ subunits conserved across species but hypervariable among subunit isoforms. Protein Sci. 2009, 10, 2548–2555. [Google Scholar] [CrossRef]
  47. McCormick, P.; Dumaresq-Doiron, K.; Pluviose, A.-S.; Pichette, V.; Tosato, G.; Lefrancois, S. Palmitoylation Controls Recycling in Lysosomal Sorting and Trafficking. Traffic 2008, 9, 1984–1997. [Google Scholar] [CrossRef] [PubMed] [Green Version]
  48. Resh, M.D. Trafficking and signaling by fatty-acylated and prenylated proteins. Nat. Chem. Biol. 2006, 2, 584–590. [Google Scholar] [CrossRef]
  49. Chen, C.A.; Manning, D.R. Regulation of g proteins by covalent modification. Oncogene 2001, 20, 1643–1652. [Google Scholar] [CrossRef]
  50. Zhang, Z.; Melia, T.J.; He, F.; Yuan, C.; McGough, A.; Schmid, M.F.; Wensel, T.G. How a G protein binds a membrane. J. Biol. Chem. 2004, 279, 33937–33945. [Google Scholar] [CrossRef]
  51. Vogler, O.; Casas, J.; Capo, D.; Nagy, T.; Borchert, G.; Martorell, G.; Escriba, P.V. The G Dimer Drives the Interaction of Heterotrimeric Gi Proteins with Nonlamellar Membrane Structures. J. Biol. Chem. 2004, 279, 36540–36545. [Google Scholar] [CrossRef]
  52. Abankwa, D.; Vogel, H. A FRET map of membrane anchors suggests distinct microdomains of heterotrimeric G proteins. J. Cell Sci. 2007, 120, 2953–2962. [Google Scholar] [CrossRef] [PubMed] [Green Version]
  53. Johannes, L.; Pezeshkian, W.; Ipsen, J.H.; Shillcock, J.C. Clustering on Membranes: Fluctuations and More. Trends Cell Biol. 2018, 28, 405–415. [Google Scholar] [CrossRef] [PubMed]
  54. Garcia-Parajo, M.F.; Cambi, A.; Torreno-Pina, J.A.; Thompson, N.; Jacobson, K. Nanoclustering as a dominant feature of plasma membrane organization. J. Cell Sci. 2014, 127, 4995–5005. [Google Scholar] [CrossRef] [PubMed] [Green Version]
Figure 1. Cellular localization of Gαsβ1γ2, Gαsβ1γ9, Gαi3β1γ2, and Gαi3β1γ9 heterotrimers. Representative confocal images of fluorescent protein (FP)-tagged Citrine–Gα subunits and mCherry–Gβ1γ dimers in transiently co-transfected HEK 293 cells. Localization of heterotrimers: (A) Gαsβ1γ2, (B) Gαsβ1γ9, (C) Gαsiekβ1γ2, (D) Gαsiekβ1γ9, (E) Gαi3β1γ2, (F) Gαi3β1γ9. Scale bar, 10 μm.
Cells 08 01246 g001
Figure 2. FLIM–FRET of Gαsβ1γ2, Gαsβ1γ9, Gαi3β1γ2, and Gαi3β1γ9 heterotrimers. (A) HEK 293 cells were transiently transfected with Citrine–Gα alone or both mCherry–Gβγ and Citrine–Gα. Fluorescence lifetimes are presented in a continuous pseudo-color scale representing time values ranging from 2.7 (blue) to 3.6 (red) or 3.7 ns (red). (B) Box-and-whisker plots of the fluorescence lifetime τ1 of energy donor (Citrine–Gα) and donor in the presence of acceptor (mCherry–Gβγ). The median is shown as a line in the box, while the bottom and top boundaries represent the lower and upper quartile, respectively. Statistical significance of the difference in the donor fluorescence lifetimes τ1 detected in the absence and presence of energy acceptor using Mann–Whitney U test (* p < 0.02, ** p < 0.002, *** p < 0.0002). Gαs n = 42; Gαs and Gβ1γ2 n = 71; Gαs Gβ1γ9 n = 46; Gαi3, and Gβ1γ2 n = 64; Gαi3 and Gβ1γ9 n = 72; GαsIEK and Gβ1γ2 n = 42; GαsIEK and Gβ1γ9 n = 38. (C) Plot of calculated fluorescence resonance energy transfer (FRET) efficiency percentage E derived from τ1, error bars represent standard errors.
Cells 08 01246 g002
Figure 3. Localization of FP in the structures of Gαs and Gαi3. The molecular models of Citrine (green)–Gαs (blue), Citrine (yellow)–Gαi3 (concealed), and mCherry (red)–Gβ1 (orange) were generated with Chimera 1.13.1 [37] based on the structures of FP, Gαs, Gαi3, and Gβ1 (PDB id.: 1xa9, 6crk, 2ode, 6b3j, respectively). The models generated for fusion proteins were visually inspected, and the best-scored structures with suitable loops were chosen. The structure of a heterotrimeric complex of the investigated fusion proteins was recreated with the Discovery Studio software, version 4.0 (BIOvIA, D. S., San Diego, CA, USA, 2015).
Cells 08 01246 g003
Figure 4. Effect of different Gγ subunits on the production of cAMP. HEK 293 cells were transiently transfected with Citrine–Gαi3, dopamine receptor D2R, mCherry–Gβ1γ29, or Citrine–Gαs/sIEK, adenosine receptor A2AR and mCherry–Gβ1γ29. The activity of the investigated proteins after stimulation of the D2 receptor with sumanirole maleate or the A2A receptor with 2-phenylaminoadenosine was determined by measurements of cAMP levels. Data are presented as percentage of mean cAMP level in control (non-transfected cells) which are considered as intrinsic cAMP levels after stimulation of the D2 or A2A receptor. Differences in cAMP levels between samples were evaluated by the unpaired t-test. (A) Citrine–Gαi3: comparison with the control: **-p < 0.01 ***-p < 0.001, Citrine–Gαi3 mCherry–Gβ1γ2 vs. Citrine–Gαi3 mCherry–Gβ1γ2 &&&-p < 0.001 and mGFP–Gαi3 mCherry–Gβ1γ2 vs. mGFP–Gαi3 mCherry–Gβ1γ9 ###-p < 0.001 (n = 8). (B) Citrine–Gαs/sIEK: comparison with the control: **-p < 0.01 ***-p < 0.005, Citrine–Gαs mCherry–Gβ1γ2 vs. Citrine–GαsIEK mCherry–Gβ1γ2 &&&-p < 0.01, and Citrine–Gαs mCherry–Gβ1γ9 vs. Citrine–GαsIEK mCherry–Gβ1γ9 ###-p < 0.005 (n = 8). (C) In a pull-down assay, GαsIEK was found to interact with Gβ1γ2. Recombinant His-tagged mCherry–Gβ1 bound to NiNTA beads were incubated with Citrine–Gαs or Citrine–GαsIEK cell lysates. Beads were precipitated, and the amount of Gα was detected by Western blotting, using an antibody specific to Gαs. The anti-His-tag antibody was used for visualization of His-tagged mCherry–Gβ1. The figure is representative of three independent experiments.
Cells 08 01246 g004
Table 1. Lateral diffusion coefficients of investigated Gα subunits fusion protein constructs in the presence of Gβ1γ2 or Gβ1γ9 dimers.
Dapp (µm2/s)Mf (%)n
Gαs 0.130 ± 0.00484.5 ± 1.549
Gαs Gβ1γ2 0.246 ± 0.00992.4 ± 0.8143
Gαs Gβ1γ9 0.202 ± 0.00789.5 ± 1.192
Gαi3 0.338 ± 0.02294.2 ± 1.734
Gαi31γ2 0.424 ± 0.01493.5 ± 0.966
Gαi31γ9 0.475 ± 0.02192.8 ± 1.260
GαsIEK1γ2 0.214 ± 0.01087.8 ± 1.561
GαsIEK1γ9 0.214 ± 0.00589.7 ± 0.9108
In the experiments where the co-expression took place, the diffusion of Gα subunits was measured. Values represent the mean ± S.E.M., Dapp—apparent diffusion coefficient, Mf—mobile fraction, —data from Reference [22].

