Article

Red-Shifted Epac-Based FRET cAMP Sensors for All-Optical cAMP Control and Multiparameter Imaging

by
Tabea Kressmann
1,
Christian Hermann
2,
Aaron Treder
1,
Thomas Gudermann
1,
Ursula Storch
2,* and
Michael Mederos y Schnitzler
1,3,*
1
Walther Straub Institute of Pharmacology and Toxicology, Ludwig Maximilian University of Munich, 80336 Munich, Germany
2
Institute of Pharmacy, Clinical Pharmacy, University of Regensburg, 93053 Regensburg, Germany
3
DZHK (German Centre for Cardiovascular Research), Munich Heart Alliance, 80336 Munich, Germany
*
Authors to whom correspondence should be addressed.
Cells 2026, 15(13), 1223; https://doi.org/10.3390/cells15131223
Submission received: 22 April 2026 / Revised: 30 June 2026 / Accepted: 2 July 2026 / Published: 6 July 2026
(This article belongs to the Special Issue pH Sensing, Signalling, and Regulation in Cellular Processes )

Highlights

What are the main findings?
  • We developed and systematically evaluated four red-shifted Epac-based single-chain FRET biosensors for live-cell cAMP imaging.
  • We identified Epacred4 as the most sensitive variant with strong responses to cAMP changes.
What are the implications of the main findings?
  • Epacred4 enables multiplex, all-optical signaling studies.
  • Epacred4 is compatible with blue-light–driven adenylyl cyclase activation and simultaneous readout of cAMP dynamics alongside Ca2+ imaging in living cells.

Abstract

Cyclic adenosine monophosphate (cAMP) is a ubiquitous second messenger downstream of G protein-coupled receptors (GPCRs) and a central regulator of cellular signaling. Genetically encoded exchange proteins directly activated by cAMP (Epac)-based Förster resonance energy transfer (FRET) biosensors enable real-time monitoring of cAMP dynamics in living cells, but commonly used cyan/yellow FRET pairs require short-wavelength excitation, limiting compatibility with multiplex imaging and blue-light optogenetic tools such as bacterial photoactivated adenylyl cyclases (bPACs). Here, we engineered and systematically characterized four red-shifted Epac-based single-chain FRET cAMP sensors combining yellow or orange FRET donors with red fluorescent FRET acceptors. Using ratiometric live-cell imaging, we quantified stimulus-evoked FRET responses and identified Epacred4 as the best-performing variant, showing an approximately 55% decrease in normalized FRET after forskolin stimulation. Epacred4 also reliably detected Gi/o-mediated decreases in cAMP following μ-opioid receptor activation. Brief 405 nm light pulses induced graded and reversible cAMP elevations using the low dark-activity variant bPAC-F198Y. Furthermore, Epacred4 enabled analysis of cAMP recovery kinetics during phosphodiesterase inhibition and multiplex imaging of cAMP and intracellular Ca2+ using Fura-2 with minimal spectral and pH-related interference under physiological imaging conditions. Together, Epacred4 represents a robust red-shifted cAMP sensor for optogenetic and multiplex signaling studies.

1. Introduction

G protein-coupled receptors (GPCRs) constitute the largest family of membrane proteins, transducing a vast array of extracellular signals into specific cellular responses by activating intracellular signal transduction pathways [1,2]. Given their involvement in nearly all physiological and pathophysiological processes and their status as molecular targets for 36% of all approved drugs [3], a high-resolution analysis of GPCR signaling is of utmost importance. A primary effector system regulated by GPCRs is the adenylyl cyclase (AC) family, where intracellular adenosine 3′,5′-cyclic monophosphate (cAMP) levels are tightly regulated by the opposing actions of Gs proteins leading to cAMP level increases and Gi/o proteins resulting in cAMP level decreases [4]. This regulatory equilibrium is further refined by the enzymatic activity of phosphodiesterases (PDEs), which catalyze the degradation of cAMP into 5′-AMP. By balancing G protein-mediated synthesis with PDE-mediated hydrolysis, the cell achieves precise spatiotemporal control over intracellular cAMP concentrations. This control is fundamentally rooted in the organization of cAMP signaling into highly localized nanodomains, which prevent the uniform diffusion of this second messenger and ensure that specific GPCR inputs trigger distinct cellular responses [5].
To monitor these cAMP fluctuations in living cells, Förster resonance energy transfer (FRET)-based sensors have emerged as a powerful alternative to traditional biochemical or radioactive approaches. These optical sensors typically exploit the conformational changes in the exchange protein directly activated by cAMP (Epac), a family of nucleotide exchange factors discovered in 1998 that revealed a signaling mechanism independent of protein kinase A (PKA) [6,7]. Structurally, Epac-based sensors consist of a regulatory cAMP-binding domain (CNBD) sandwiched between a donor and an acceptor fluorophore. To prevent interference with endogenous signaling and ensure cytosolic diffusion, the membrane-targeting disheveled-EGL-10-pleckstrin (DEP) domain is removed, and the catalytic guanine nucleotide exchange factor (GEF) domain is often inactivated via point mutations.
The evolution of these sensors [8,9,10] has led to highly optimized FRET constructs such as EpacH187 [11], which utilizes a monomeric Turquoise2 [12] (mTurquoise2, mTq2) as a FRET donor and the tandem dimer of circularly permuted and monomeric Venus (tdVenus) as a FRET acceptor. Featuring an additional amino acid exchange from glutamine to glutamate at position 270 (Q270E) to increase cAMP affinity, EpacH187 currently represents the most responsive blue-shifted FRET-based cAMP sensor and serves as the benchmark for highest sensitivity and dynamic range [10].
Besides FRET-based approaches, several genetically encoded single-fluorescent-protein cAMP sensors have recently expanded the available toolbox for live-cell cAMP imaging. These include yellow/green sensors such as Flamindo2 [13] and G-Flamp1 [14], red-shifted sensors such as Pink Flamindo [15] and R-FlincA [16], and highly sensitive sensors such as cAMPinG1 [17]. In addition, alternative ratiometric cAMP sensors have been developed, including gCarvi [18], which is based on the cAMP-binding domain of the bacterial cAMP receptor protein, and optimized Epac-derived FRET/FLIM sensors such as cAMPFIRE [19]. These sensors differ substantially in their apparent cAMP affinity, dynamic range, spectral properties, and readout principles. Nevertheless, they offer simplified imaging configurations and facilitate multiplex imaging, as cAMP-dependent fluorescence changes can be monitored within a single detection channel. However, unlike FRET-based biosensors, single-fluorophore sensors generally lack an intrinsically ratiometric readout. Consequently, their signals may be more susceptible to variations in sensor expression levels and more strongly affected by photobleaching than those obtained with ratiometric FRET biosensors. In contrast, the intrinsically ratiometric readout of FRET sensors provides an internal normalization that reduces the impact of these experimental factors, thereby facilitating more valid quantitative analysis of intracellular cAMP dynamics [11]. Altogether, single-fluorophore and FRET-based cAMP biosensors represent complementary approaches with distinct advantages depending on the experimental application.
However, the reliance of the established Epac-based FRET cAMP sensor, such as EpacH187 [11], on short-wavelength excitation, particularly around 405 nm for mTurquoise2, poses a significant limitation for advanced experimental settings. Shifting the cAMP sensing technology into the red-shifted spectrum is essential for two primary reasons. First, it ensures compatibility with optogenetics, as the activation spectrum of the bacterial photoactivated adenylyl cyclase (bPAC) overlaps significantly with the excitation wavelengths of blue-shifted donors [20]. This spectral interference leads to unintended “leak” activation of bPAC during the FRET readout, compromising the independent control of cAMP levels [20,21]. Second, it enables simultaneous multi-parameter imaging. For complex signaling assays, it is often necessary to monitor cAMP alongside other messengers, such as calcium (Ca2+), to understand their intricate cross-talk [22]. For example, the gold-standard ratiometric calcium indicator Fura-2 requires excitation in the UV/violet range (340/380 nm) [23]. Simultaneous monitoring of Ca2+ and cAMP using Fura-2 and Cyan/Yellow FRET sensors (e.g., mTurquoise2/Venus) is hampered by dual spectral crosstalk. Not only the UV excitation used for Fura-2 (340/380 nm) partially excites CFP-like donors due to their broad excitation tails, but, even more critically, the broad emission of Fura-2 (~510 nm) significantly overlaps with both the donor (~480 nm) and acceptor (~530 nm) channels, leading to substantial bleed-through. Utilizing a red-shifted cAMP sensor resolves this by shifting the FRET signals into a transparent spectral “window”, enabling crosstalk-free ratiometric imaging of Ca2+ and cAMP dynamics within the same single cell.
In this study, we developed and systematically characterized four novel red-shifted Epac-based FRET sensors, Epacred1, Epacred2, Epacred3 and Epacred4, that exhibit various combinations of yellow, orange, and red fluorescent proteins. These include a tandem dimer form of LanYFP [24] as well as monomeric variants of Orange2 [25] and Scarlet3 [26]. Our goal was to identify a variant that matches the robustness of the EpacH187 benchmark while offering the spectral flexibility required for multi-modal imaging and optogenetic manipulation. We identified Epacred4 as a red-shifted lead candidate through pharmacological stimulation and a finely tuned optogenetic approach using a bPAC mutant to demonstrate precise, all-optical control of intracellular cAMP dynamics. Furthermore, we demonstrate that Epacred4 is well suited for multiplexed imaging, enabling simultaneous and ratiometric monitoring of intracellular Ca2+ and cAMP dynamics.

2. Materials and Methods

2.1. Chemicals

Poly-L-lysine (Cat. No. P-1524), bovine serum albumin (BSA; Cat. No. A7030), 3-isobutyl-1-methylxanthine (IBMX, Cat. No. I5879) and isoproterenol hydrochloride (Isoprenaline, Cat. No. I6504) were purchased from Sigma-Aldrich (Taufkirchen, Germany). Forskolin (FSK, Cat. No. HY-15371) was obtained from Hölzel Diagnostika Handels GmbH (Köln, Germany). DAMGO (Cat. No. HB2409) was purchased from hellobio (Dunshaughlin, Ireland), and vasoactive intestinal peptide (VIP; Cat. No. 1911) from Bio-Techne GmbH (Wiesbaden-Nordenstadt, Germany). All stock solutions were prepared according to the manufacturers’ instructions, aliquoted, and stored at −20 °C unless stated otherwise. Forskolin was freshly prepared in HEPES-buffered DMEM without phenol red. The end concentration of forskolin is 1 mM for experimental use. For forskolin pre-stimulation with a 1 µM end concentration, a 1 mM stock solution with anhydrous DMSO was prepared, aliquoted, and stored for up to three months. DAMGO was dissolved in double-distilled water to a 200 mM stock solution and used at a final concentration of 200 µM. Isoprenaline was dissolved to a 100 mM stock solution in double-distilled water supplemented with 0.05% sodium metabisulfite (Cat. No. 1.06357, Sigma-Aldrich) to prevent degradation and used at a final concentration of 100 µM. VIP was prepared in double-distilled water to a 10 mM stock solution and used at a final concentration of 10 µM. IBMX was dissolved in anhydrous DMSO to obtain 100 mM and 500 mM stock solutions and used at final concentrations of 100 µM and 500 µM. The final DMSO concentration in all experiments was kept at <2‰. Unless stated otherwise, compounds were applied via bath application at a volume dilution ratio of 1:3, and 10× higher concentrations of maximal effect concentration of receptors, agonists, activators and inhibitors were used to minimize delayed wash-in effects.

2.2. Cell Lines and Culture Conditions

Human embryonic kidney (HEK293T) cells (Leibniz-Institute DSMZ, Braunschweig, Germany; ACC 635) were employed for all experiments. HEK293T cells were maintained in Earl’s Minimal Essential Medium (MEM; Sigma-Aldrich, Taufkirchen, Germany) supplemented with 10% (v/v) fetal calf serum (FCS; Gibco, Life Technologies, Carlsbad, CA, USA), 100 U/mL penicillin, and 100 μg/mL streptomycin. HEK29T cells were maintained at 37 °C in a humidified atmosphere containing 5% CO2.

2.3. FRET-Based cAMP Sensor Architecture

The cytosolic cAMP FRET sensor mTurquoise2-EpacQ270E-cp173mVenus-cp173mVenus [11] served as the parental construct. To maintain consistency with existing literature while defining a clear nomenclature for this study, this sensor—frequently cited as H187—is referred to as EpacH187 throughout this work. The EpacH187 backbone features a deleted membrane-targeting DEP domain (ΔDEP) and is catalytically inactive due to two point mutations (T781A and F782A) [27] within the guanine nucleotide exchange factor (GEF) domain, preventing unintended Ras-related protein (Rap) activation. Additionally, a high-affinity amino acid substitution (Q270E) in the cyclic nucleotide-binding domain (CNBD) was utilized to enhance sensitivity toward cAMP. Note that amino acid numbering for all Epac mutations follows the nomenclature of the original Epac-based sensor characterization [11], independent of the N-terminal fluorophore tags.

2.4. Design and Generation of Red-Shifted Sensor Variants

Four novel red-shifted sensor variants, designated Epacred1 through Epacred4, were developed through systematic fluorophore replacement. Primers for site-directed mutagenesis and Gibson assembly were designed using NEBaseChanger and NEBuilder Assembly Tool (New England Biolabs, Ipswich, MA, USA), respectively, and synthesized by Sigma-Aldrich (desalted, 100 μM). Detailed primer sequences and corresponding annealing temperatures are summarized in Table 1. The first red-shifted variant, Epacred1 (tdV-Epac-cpmCh2), was generated by replacing the N-terminal mTurquoise2 with circularly permuted, monomeric Cherry2 (cpmCherry2; #52100, Addgene, Watertown, MA, USA) via PCR-based deletion and subsequent ligation, yielding the configuration cp173mVenus-cp173mVenus-EpacQ270E-cpmCherry2. To create the Epacred2 (mOrange2-Epac-cpmCh2) variant, both cp173mVenus units were excised and replaced by incorporating monomeric Orange2 (mOrange2; Addgene #54568) at the N-terminus. For the Epacred3 (tdOrange2-Epac-tdSc3) construct, tandem dimer Scarlet3 (tdScarlet3) was fused to the C-terminus. The mScarlet3 sequence (Addgene #189767) was modified by removing the LifeAct tag and introducing N-terminal NheI and C-terminal EcoRI restriction sites. Following PCR amplification and ligation of two mScarlet3 units, the resulting tdScarlet3 was inserted into the backbone. The N-terminal tandem dimer Orange2 (tdOrange2) was generated by codon-optimizing mOrange2, adding a flexible linker, and fusing it to a second mOrange2 unit before insertion into the EcoRV-digested backbone. Finally, the Epacred4 (tdLanYFP-Epac-tdSc3) sensor was produced using tandem dimer LanYFP (tdLanYFP) synthesized by GenScript (Piscataway, NJ, USA). The fragment was cloned into the pcDNA3.1(+) vector and subsequently fused to the N-terminus of the Epac backbone via EcoRV digestion.

2.5. Co-Expression Strategies and Optimization

To enable optogenetic control, the red-shifted sensors were co-expressed with the bacterial photoactivated adenylyl cyclase (bPAC). Initially, an internal ribosome entry site (IRES) sequence was utilized downstream of the sensor coding sequence. For the lead candidate Epacred4 (tdLanYFP-Epac-tdSc3), bPAC was further optimized by introducing the F198Y point mutation. To ensure precise 1:1 stoichiometry and robust expression levels, the IRES sequence was ultimately replaced with a P2A self-cleaving peptide [28] via PCR-based cloning.

2.6. Imaging Preparation and Transfection

For FRET experiments, cells were seeded onto glass-bottom dishes (FluoroDish, 35 mm diameter, 23 mm glass bottom; WPI, Friedberg, Germany). Prior to seeding, dishes were coated at room temperature with 0.5 mL poly-L-lysine (0.1 mg/mL; Sigma-Aldrich) for 30 min. After removal of the coating solution, dishes were washed once with 2 mL sterile DPBS (Sigma-Aldrich), and cells were seeded in their respective maintenance media. HEK293T cells were transfected with 0.5 μg of the indicated Epac sensor construct, with or without IRES- or -P2A-mediated co-expression of bPAC, using the non-lipid-based reagent GeneJuice® (Merck Millipore, Schwalbach, Germany) according to the manufacturer’s instructions. Where indicated, 1 μg of the human μ-opioid receptor (µOR, pcDNA 3.1+, cDNA Resource Center, #OPRM100000), the human adrenergic β2 receptor (β2R, pcDNA 3.1+, cDNA Resource Center, #AR0B200000), or the vasoactive intestinal peptide receptor 1 (VPAC1R, cDNA Resource Center, #VIPR100000) was co-transfected. All measurements were performed approximately 48 h post-transfection.

2.7. Live-Cell FRET Imaging

Dynamic changes in intracellular cAMP concentrations were quantified in single living cells using the developed red-shifted Epac-based sensors. Imaging was performed at room temperature (22 ± 2 °C) using a laser-coupled, camera-based microscopy system (iMIC2.0, TILL Photonics/FEI, Gräfelfing, Germany) equipped with a Sole-6 Laser Line Combiner (Omicron Laserage Laserprodukte GmbH, Rodgau-Dudenhofen, Germany). This system featured five integrated laser lines: two diode lasers (405 nm/120 mW and 488 nm/100 mW) and three Diode-Pumped Solid-State (DPSS) lasers (515 nm/100 mW, 561 nm/100 mW, and 594 nm/100 mW). The laser lines were coupled into the iMIC2 microscope without the use of an automated fiber switcher to ensure maximum power stability. To virtually eliminate thermal noise and ensure a stable baseline independent of ambient temperature fluctuations, the internal multi-stage Peltier cooling of the back-illuminated EMCCD camera (iXon3 897, model DU-897U-CS0; Andor Technology, Belfast, UK; 512 × 512-pixel sensor with a pixel size of 16 μm) was supplemented with an external water-circulating heat exchanger (LAUDA, Lauda-Königshofen, Germany). The cooling water was maintained at a constant temperature of +14.0 ± 0.1 °C, enabling the EMCCD chip to operate at a highly stable temperature of −95 °C To prevent moisture condensation and ensure stable optical performance at these cryogenic temperatures, the camera port was specifically modified with a custom-built, perforated dehumidification chamber containing a mixture of molecular sieve (5 Å, Carl Roth, Karlsruhe, Germany) and indicator silica gel (red/yellow, grain size 1–3 mm, Carl Roth). Additionally, the interior of the microscope body was dehumidified using permeable pouches filled with the same compounds as those used in the chamber, strategically placed to ensure an unobstructed optical path and unimpeded mechanical movement.

2.8. Image Acquisition, Region of Interest (ROI) Analysis and FRET Quantification

Images were acquired using Live Acquisition software (version 2.5.0.15, TILL Photonics/FEI) at a frequency of 1 Hz with an exposure time of 10 ms per channel. To accommodate filter changes, appropriate switching times were included between channel acquisitions. Camera settings consisted of an EM gain of 20 and 2 × 2-pixel binning to enhance the signal-to-noise ratio. Cells were imaged using a 40× oil-immersion objective (UApo N340, N.A. 1.35, W.D. 0.10 mm; Olympus, Tokyo, Japan). To minimize photobleaching prior to measurements, cell identification and morphology-based selection were performed using low-intensity 594 nm excitation (10%). Fluorophores were excited sequentially using specific laser lines with intensities adjusted for each sensor: mTurquoise2 was excited at 405 nm (100% intensity), while tdVenus, mOrange2, tdOrange2, and tdLanYFP were excited at 515 nm (10–20% intensity). For the red-shifted acceptors, cpmCherry2 was excited at 594 nm (10%), whereas tdScarlet3 was excited at either 561 nm (10%) when paired with tdLanYFP or at 594 nm (60%) when paired with tdOrange2. Emission signals were separated using a 585 nm dichroic beamsplitter.
For data quantification, a single region of interest (ROI) was manually defined for each fusiform cell. These ROIs were strictly confined to the cytoplasmic compartment, carefully excluding the nucleus to ensure a purely cytosolic FRET readout. Depending on individual cell morphology, ROI dimensions typically ranged from 8 to 20 binned pixels (using the 40× objective). Only cells displaying fluorescence intensities 3- to 10-fold above the background (determined in a cell-free area of the imaging field) were included in the analysis.
To account for non-specific signals, mean background intensities measured in the donor (FDonor), acceptor (FAcceptor), and FRET (FFRET) channels were subtracted from the corresponding raw fluorescence intensities. To correct for optical cross-talk, including spectral bleed-through and cross-excitation, normalized FRET (NFRET) was calculated using a custom-written script in R (version 4.2.3) based on the method described by Xia and Liu (2001) [29]. Bleed-through coefficients (a and b) were determined using HEK293T cells expressing either the donor or acceptor alone. NFRET was calculated by subtracting donor and acceptor contributions from the FRET channel and normalizing to the geometric mean of donor and acceptor fluorescence intensities.
N F R E T = F F R E T a F D o n o r b F A c c e p t o r F D o n o r × F A c c e p t o r
Subsequently, NFRET signals were normalized to baseline by dividing each value by the geometric mean of NFRET (NFRETgeom) values recorded between 10 s and 50 s.
N F R E T g e o m = i = 10   s 50   s N F R E T ( t i ) n
N F R E T n o r m t = N F R E T ( t ) N F R E T g e o m
Epacred sensor signals can also be expressed as the simple ratio FFRET/FDonor; however, this representation is used exclusively for real-time visualization in the LA software, (version 2.5.0.15) enabling qualitative monitoring and comparison of responses during acquisition. All quantitative analyses in this study are based on NFRET values corrected according to Xia and Liu (2001) [29]. A decrease in normalized NFRET corresponds to an increase in intracellular cAMP levels, reflecting the conformational change in the Epac sensor upon ligand binding. Further data processing, including baseline normalization and statistical analysis, was performed using OriginPro 2026 (OriginLab, Northampton, MA, USA).

2.9. Simultaneous Dual-Parameter Imaging of cAMP and Ca2+

To investigate the spatio-temporal relationship between cAMP and Ca2+ signaling, simultaneous imaging experiments were performed. Intracellular Ca2+ levels were monitored using the ratiometric indicator Fura-2. Cells were loaded with 5 µM Fura-2-acetoxymethyl ester (Fura-2 AM, Invitrogen/Thermo Fisher Scientific, Waltham, MA, USA) in HEPES-buffered Hanks’ Balanced Salt Solution (HBSS) containing 0.1% BSA and 0.04% Pluronic® F-127 for 30 min at 37 °C in a humidified atmosphere containing 5% CO2, followed by three wash steps with 2 mL HBSS each to allow for complete de-esterification of the dye.
Dual-parameter imaging was achieved by synchronizing the laser-based iMIC2.0 FRET setup with a Polychrome V illumination system (TILL Photonics/FEI, Munich, Germany) equipped with a 150 W xenon arc lamp. Cells were imaged using a 20× UV-transmissive oil-immersion objective (UPlanSApo 20× Oil, N.A. 0.85, W.D. 0.20 mm; Olympus, Tokyo, Japan; system FN 26.5) mounted on the iMIC system, which enabled both Fura-2 and FRET measurements. Fura-2 fluorescence was excited alternately at 340 nm and 380 nm, and emission was collected at 510 nm. To prevent spectral overlap between the Fura-2 emission and the FRET donor signal, a specialized multiband dichroic beamsplitter and high-performance emission bandpass filters (510/20 nm for Fura-2 and 470/24 nm for mTurquoise2) were utilized.
Acquisition was strictly interleaved, ensuring that the UV excitation for Fura-2 (340/380 nm) and laser excitation for FRET were performed in rapid succession to avoid simultaneous fluorescence emission and minimize crosstalk. To further evaluate potential spectral crosstalk, the excitation spectra of the employed fluorophores were considered during experimental design. While tdLanYFP exhibits an excitation maximum in the green spectral range at 513 nm, excitation at 340 nm was not detectable under our imaging conditions, and excitation at 380 nm was negligible. Conversely, Fura-2 fluorescence was exclusively recorded during UV excitation periods and detected through dedicated emission filters centered at 510 nm. Together with the sequential acquisition protocol, this ensured effective optical and temporal separation of the cAMP and Ca2+ signals.
Crucially, identical ROIs were used for FRET and Fura-2 analysis to ensure precise spatial co-registration of both second messengers. A single cytoplasmic ROI per cell was selected, excluding the nucleus, and typically comprised 5–12 binned pixels depending on cell morphology (using the 20× objective). Acquisition was interleaved with the FRET protocol, ensuring near-simultaneous recording of both second messengers. According to the Grynkiewicz method (1985) [23], intracellular Ca2+ concentrations were expressed as the ratio of fluorescence intensities (R = F340/F380). Background subtraction was performed for both wavelengths (340 nm and 380 nm) prior to ratio calculation. This combined optical and temporal separation ensured a crosstalk-free, near-simultaneous recording of both second messengers under stable physiological conditions. Measurements were performed in HEPES-buffered saline (HBS) solution containing 140 mM NaCl, 5.4 mM KCl, 1 mM MgCl2, 2 mM CaCl2, 10 mM glucose, and 10 mM HEPES (pH 7.4 adjusted with NaOH; osmolarity 295–302 mOsm kg−1).

2.10. Quantification and Statistical Analysis

Statistical analyses were performed in Origin 2026 (OriginLab Corporation, Northampton, MA, USA) using an unpaired Mann–Whitney U test, Kruskal–Wallis test, paired Wilcoxon matched-pairs signed-rank test followed by post hoc Dunn’s test, or Friedman test followed by post hoc Dunn’s test where appropriate. A p value < 0.05 was considered statistically significant. Significance levels were defined as * p < 0.05, ** p < 0.01, and *** p < 0.001. Box plots represent the median and interquartile range. The specific statistical tests used are indicated in the respective figure legends.

3. Results

3.1. Structural Design and Spectral Characterization of Red-Shifted Epac-Based FRET Sensors

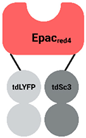
To expand the toolkit for multicolor imaging, we developed four red-shifted cAMP FRET sensors (summarized in Table 2) by fusing various donor and acceptor fluorophores to the N- and C-termini of the Epac sensory domain. As a reference, we utilized the established blue-shifted sensor EpacH187, which features an N-terminal monomeric Turquoise2 (mTq2) as the FRET donor and a C-terminal tandem dimer of circularly permuted monomeric Venus (tdV) as the FRET acceptor [11]. The red-shifted variants were designed with increasing theoretical FRET efficiencies. In the first two constructs, Epacred1 and Epacred2, circularly permuted and monomeric Cherry2 (cpmCherry2) was fused to the C-terminus to serve as the FRET acceptor, and either tandem dimer Venus or monomeric Orange2 (mOr2) was fused to the N-terminus to serve as the FRET donor. For the third variant, Epacred3, we employed tandem dimer Orange2 (tdOr2) as the FRET donor at the N-terminus and tandem dimer Scarlet3 (tdSc3) as the FRET acceptor at the C-terminus. Excitation for the three sensors, Epacred1, Epacred2 and Epacred3, was performed by applying Laser light of the wavelengths 515 nm for donor excitation and 594 nm for acceptor excitation. Finally, we generated Epacred4, incorporating tandem dimer LanYFP (tdLanYFP) as an N-terminal FRET donor and tandem dimer Scarlet3 as a C-terminal FRET acceptor, which were excited using light of the wavelengths 515 nm and 561 nm, respectively. Notably, the sensors utilizing tandem dimer Scarlet3 as the C-terminal FRET acceptor (Epacred3 and Epacred4) exhibited the highest calculated FRET efficiencies (R0 × QYA) of 47 and 50, respectively (calculated using https://www.fpbase.org/fret/ (accessed on 15 January 2026)).

3.2. Functional Validation of Red-Shifted cAMP Sensors

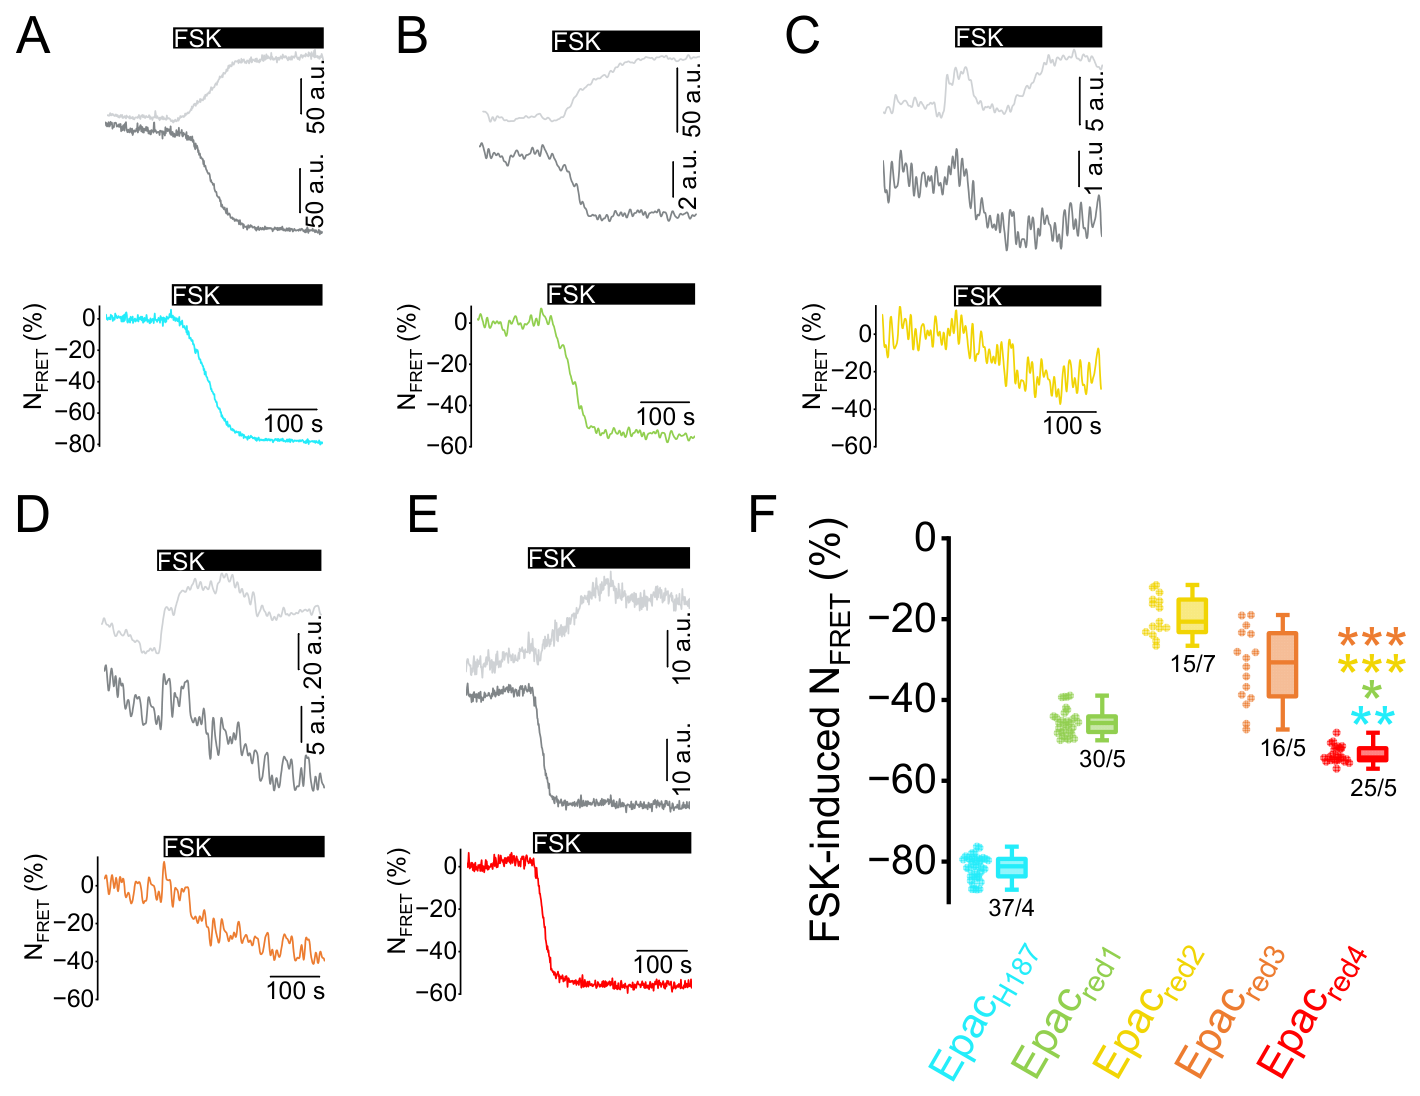
To evaluate the functionality and dynamic range of the newly developed red-shifted cAMP sensors, we performed live-cell dynamic FRET imaging in HEK293T cells overexpressing the cAMP FRET sensors. Intracellular cAMP levels were maximally elevated by pharmacological stimulation with the adenylyl cyclase activator forskolin (FSK, 1 mM). Representative single-cell recordings for each sensor are shown in Figure 1A–E (upper panels) as cross-talk-corrected, time-resolved fluorescence traces. Forskolin stimulation induced reciprocal changes in the individual fluorescence channels, characterized by an increase in donor fluorescence and a concomitant decrease in acceptor fluorescence. These opposing responses resulted in a robust decrease in the calculated FRET signal. FRET changes were quantified as normalized FRET (NFRET) to account for spectral bleed-through and variations in fluorophore expression levels. All cAMP sensors were functional, showing FRET signal decreases induced by the application of forskolin (Figure 1A–E, lower panels). Notably, Epacred4 provided a slightly higher signal-to-noise ratio and more consistent kinetics than Epacred1, as seen in the individual cell NFRET traces (Figure 1B,E, lower panels). However, the summary of the forskolin-induced FRET signal changes revealed pronounced differences in the response of the various cAMP sensors to this pharmacological intervention (Figure 1F). The well-established blue-shifted sensor EpacH187 (mTq2-Epac-tdV, ref. [11]) served as a benchmark, exhibiting the most robust response with a mean decrease in NFRET of approximately 80%, which confirms its high dynamic range and reliability.
Among the red-shifted candidates, Epacred4 (tdLanYFP-Epac-tdSc3) and Epacred1 (tdV-Epac-cpmCh2) emerged as the most effective variants under these pharmacological conditions, with Epacred4 showing a significantly larger NFRET decrease (approximately 55%) than Epacred1 (approximately 45%) and all other red sensors (Figure 1F, color-coded asterisks). While this demonstrates superior dynamic range within the red-shifted group, the response of Epacred4 was significantly lower compared to the maximal ΔNFRET amplitude of the blue-shifted benchmark EpacH187 (Figure 1F, cyan asterisks).
To characterize the spectral properties of the fluorescent proteins incorporated into the Epac-based cAMP FRET sensors, we performed live-cell fluorescence spectroscopy in transiently transfected HEK293T cells (see Supplementary Methods). Excitation and emission spectra were recorded as background-corrected difference spectra by subtracting the autofluorescence signals of untransfected cells (Supplementary Figure S1). Quantitative analysis demonstrated that the experimentally determined excitation and emission maxima were in good overall agreement with published reference values obtained from FPbase (https://www.fpbase.org/ (accessed on 1 February 2026); Supplementary Table S2). For most fluorophores, deviations between the measured and reference peak wavelengths were ≤2 nm, confirming that the fluorescent proteins retained their expected spectral properties under live-cell conditions. Larger deviations were observed for tdVenus emission and cpmCherry2 excitation. As all measurements were performed in living HEK293T cells expressing intact fusion constructs rather than purified proteins, these differences most likely reflect the influence of the intracellular environment, such as the cytoplasmatic pH. Detailed spectral acquisition settings are summarized in Supplementary Table S1.
Because the quantitative analyses of the Epac sensors throughout this study are based on normalized FRET (NFRET), which corrects for spectral bleed-through and cross-excitation, we additionally analyzed the uncorrected (“raw”) FRET ratios (acceptor emission intensity divided by donor emission intensity) derived directly from the background-subtracted emission spectra (Supplementary Figure S2). Although these raw spectral ratios differ numerically from NFRET values because no correction of bleed-through and cross-excitation was applied, they reflect the same ranking of sensor performance observed in the live-cell NFRET measurements (see Figure 1F). In particular, Epacred4 exhibited the largest spectral FRET change following stimulation with forskolin and IBMX, independently confirming its superior dynamic range and validating the conclusions drawn from the NFRET analysis.

3.3. Optogenetic Validation and Selection of the Lead Red-Shifted cAMP FRET Sensor

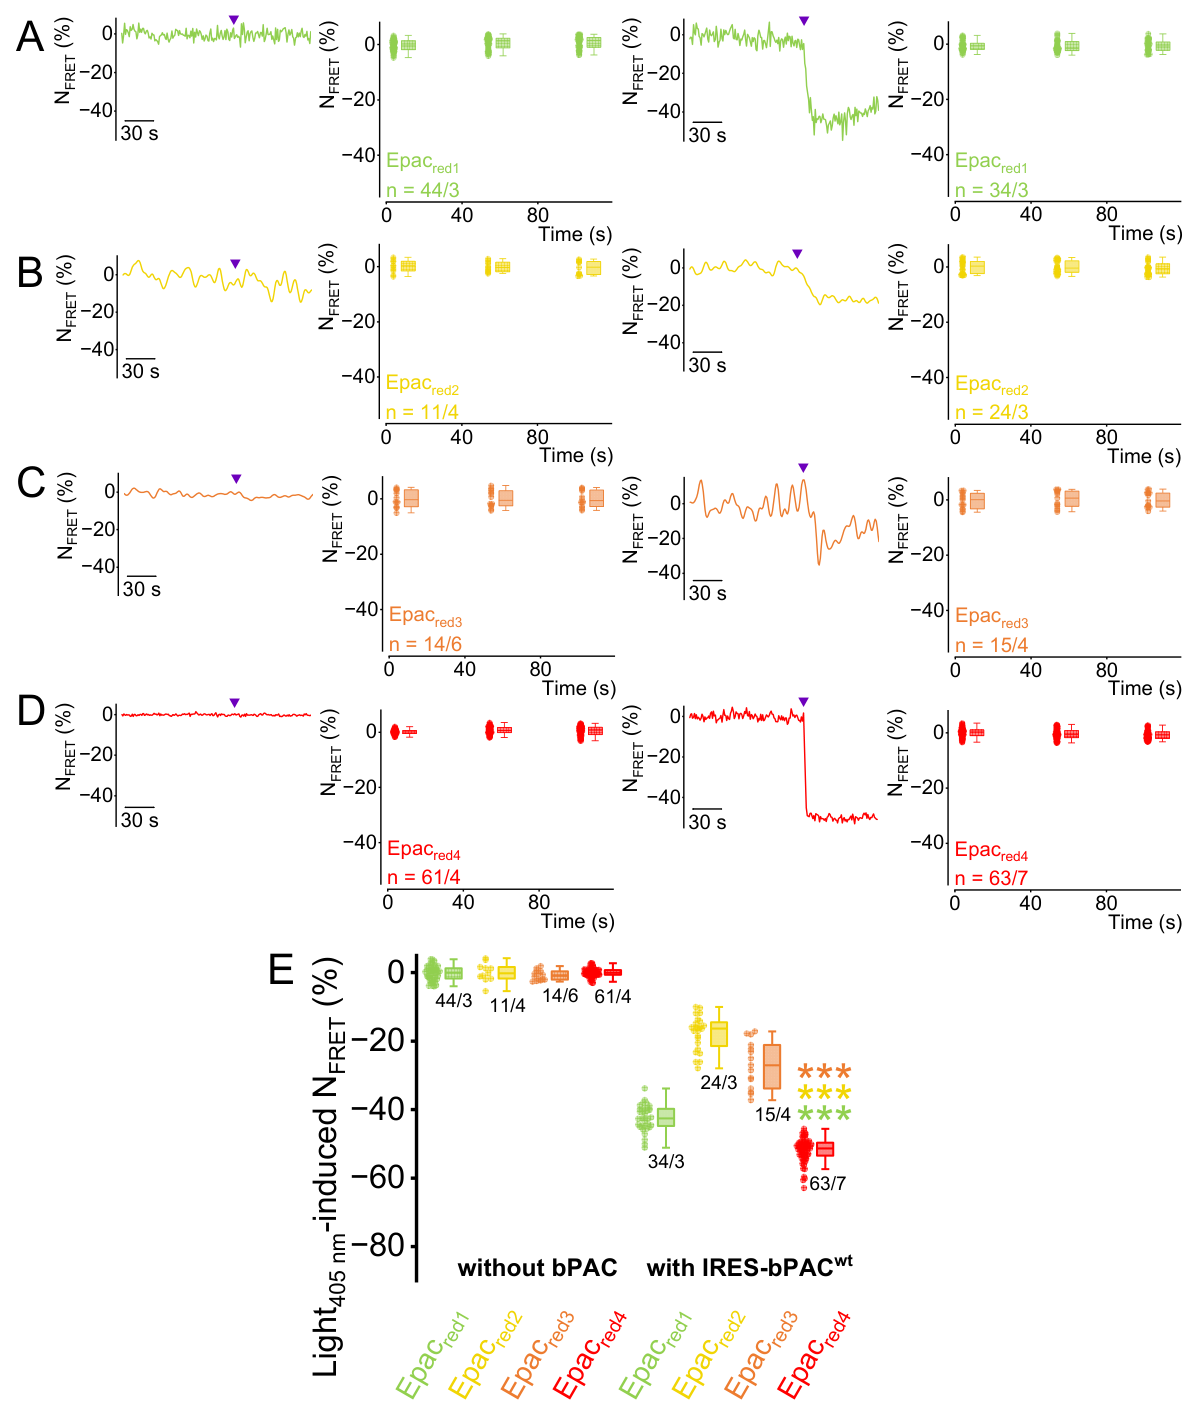
To complement the pharmacological intervention, we employed an optogenetic approach to evaluate the FRET sensor performance under rapid, light-triggered cAMP dynamics. For this, we utilized the bacterial photoactivated adenylyl cyclase (bPAC), which was co-expressed with the red-shifted cAMP FRET sensors via a bicistronic internal ribosome entry site (IRES)-based plasmid to ensure constant stoichiometric expression. This setup enabled precise, transient elevation of intracellular cAMP levels via a 405 nm laser pulse that was applied for 100 ms to stimulate cAMP production via bPAC. Notably, the blue-shifted reference cAMP FRET sensor EpacH187 was excluded from this series, as its excitation spectrum significantly overlaps with the activation range of bPAC, a spectral interference that would compromise the independence of sensor readout and optogenetic control. As shown in Figure 2, laser pulses with 405 nm did not induce non-specific FRET signal changes in control cells lacking bPAC, confirming that the cAMP FRET sensors are photostable and unresponsive to the light trigger itself (Figure 2A–D, first and second panels). However, upon co-expression with bPAC, the same laser pulses with 405 nm triggered a rapid and robust decrease in NFRET across all variants of red-light-shifted cAMP FRET sensors (Figure 2A–D, third panels). The basal NFRET values remained remarkably stable even when bPAC was co-expressed via the IRES-based expression vector system, in which the downstream bPAC cistron is expected to be expressed at substantially lower levels than the upstream Epac sensor (Figure 2A–D, second and fourth panels).
The statistical analysis of these responses (Figure 2E) confirms that performance varied significantly among the red-light-shifted cAMP FRET constructs, mirroring the trends observed upon pharmacological stimulation with forskolin. Epacred4 (tdLanYFP-Epac-tdScarlet3) exhibited the most pronounced and consistent decrease in NFRET, significantly outperforming the other variants in both signal amplitude and signal-to-noise ratio (p < 0.001). Due to its superior dynamic range in both pharmacological and optogenetic assays, Epacred4 was selected as the primary red-shifted sensor for all subsequent applications.

3.4. bPACF198Y Is Best Suitable to Stimulate Graded Light-Induced cAMP Increases

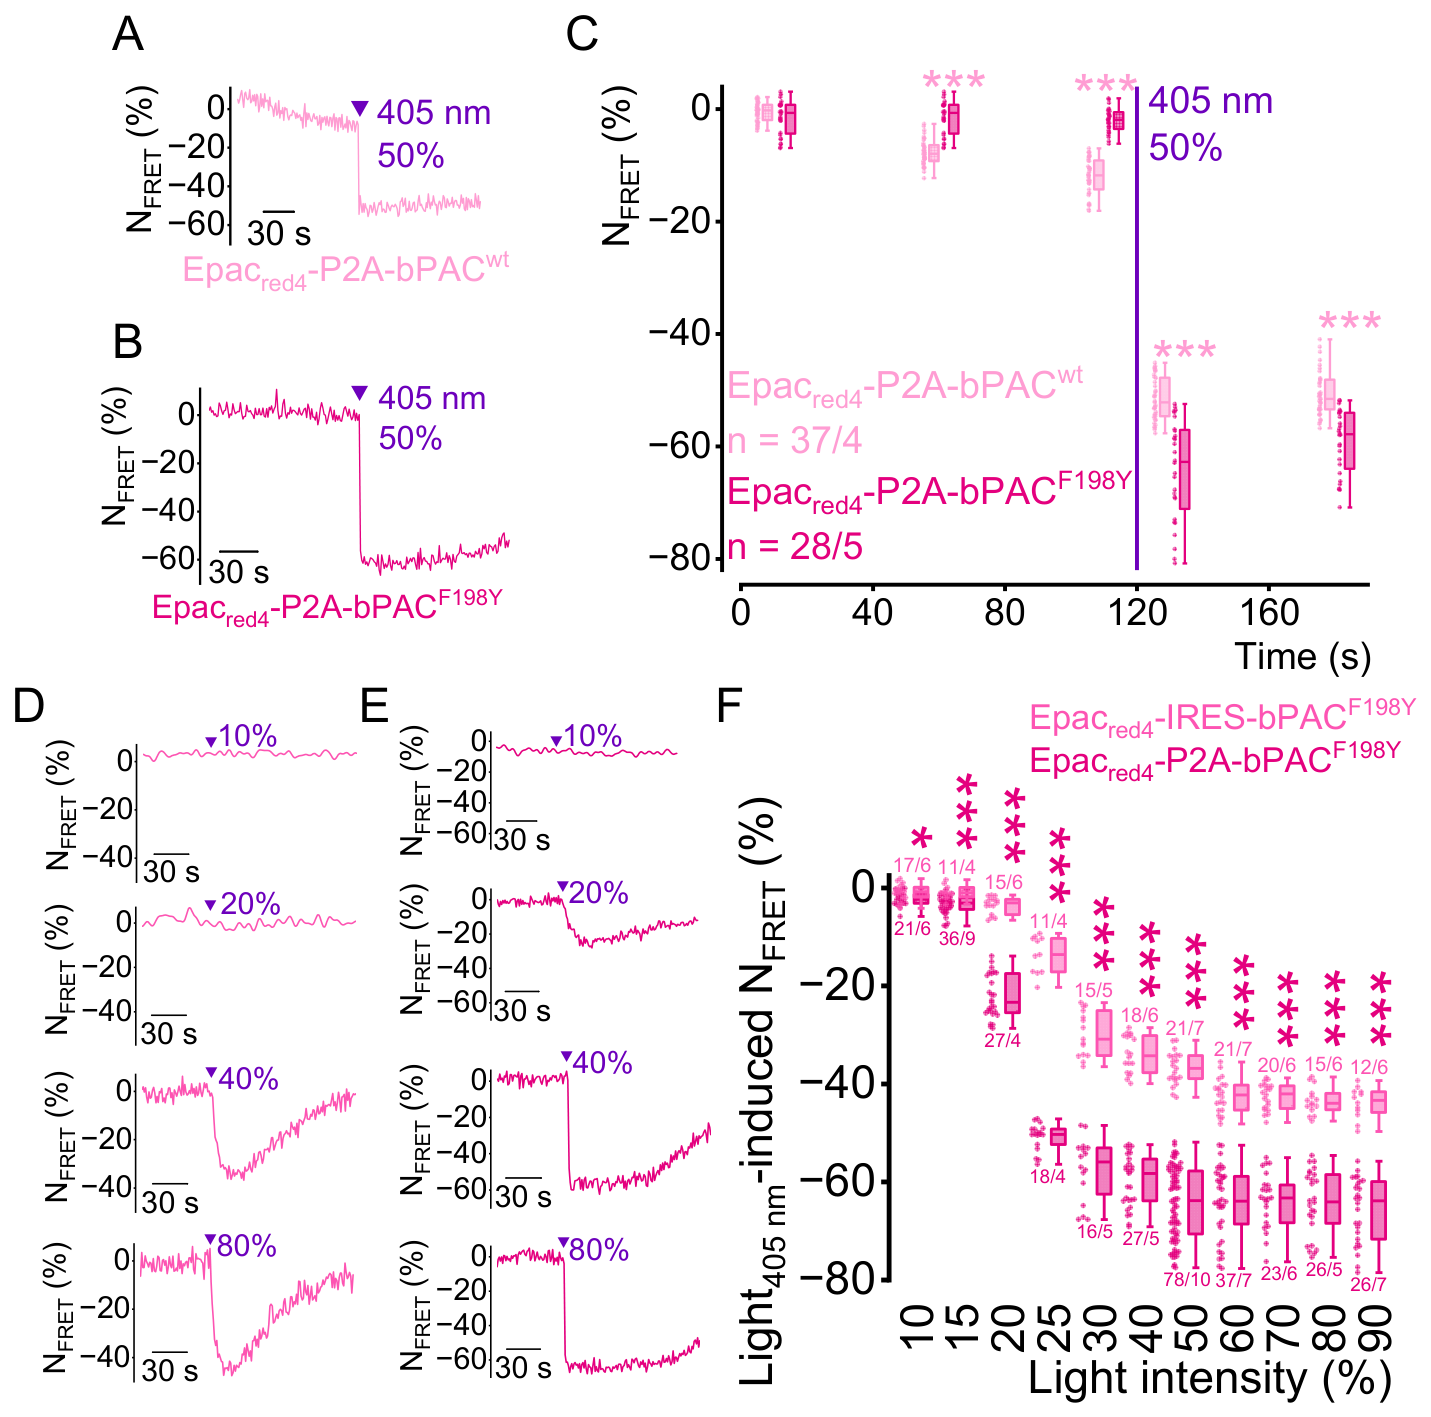
To refine our optogenetic toolkit, we directly compared the performance of wild-type bPAC (bPACwt) and the F198Y mutant (bPACF198Y) [30]. Both variants were now linked to the Epacred4 sensor via a P2A peptide to ensure equimolar expression levels. While the P2A-based constructs generally exhibited robust expression [28], we observed critical differences in their dark activity, which is the enzyme’s constitutive, light-independent activity.
Cells expressing bPACwt frequently exhibited a gradual, light-independent decline in NFRET prior to photostimulation, whereas cells expressing bPACF198Y maintained a stable baseline. This behavior is consistent with the reduced dark activity previously reported for the F198Y mutant (Figure 3A). Notably, a comparable baseline decline was not observed when bPACwt was co-expressed using the IRES-based vector system (Figure 2D,E). This difference is likely explained by the distinct expression strategies: whereas P2A-mediated co-expression is expected to result in near-equimolar expression of Epacred4 and bPAC, IRES-dependent expression typically results in substantially lower expression of the downstream cistron. Consequently, the dark activity of bPACwt became more apparent under the P2A-based expression conditions.
In contrast, the bPACF198Y variant exhibited markedly reduced constitutive activity, maintaining a stable baseline until triggered by a laser pulse (Figure 3B). This distinction is further highlighted by the temporal analysis at specific intervals (e.g., after 60 and 110 s) (Figure 3C), where the bPACwt variant leads to a significant pre-pulse decline in NFRET compared to the stable baseline of the F198Y variant. Upon stimulation with a 405 nm light pulse at 120 s, both variants showed a rapid increase in intracellular cAMP levels, reflected by a sharp decline in the NFRET signal (Figure 3A,B). Notably, this light-induced cAMP elevation was significantly more pronounced in cells expressing the bPACF198Y mutant at both 130 s and 180 s compared to bPACwt (Figure 3C), highlighting the mutant’s superior dynamic range and light-sensitivity.
We further investigated whether bPACF198Y activity could be modulated in a graded manner by varying the trigger light intensity. Using the Epacred4 sensor as a readout, individual cells were stimulated with a 100 ms pulse of 405 nm laser light at intensities ranging from 10% to 90% (Figure 3D,E). The summary of the light-induced FRET signal decreases suggests that the cAMP production is finely tunable, applying 405 nm with increasing light intensities (Figure 3F). At low laser intensities (10–20%), only a slight NFRET decrease was observed, whereas a half-maximal response was achieved at approximately 25% intensity. The FRET signal reached a plateau starting at 50% intensity, indicating a saturation point beyond which further increases in laser power yielded no additional cAMP production. Notably, the comparison between cDNA constructs using IRES or P2A as coupling strategies (Figure 3F) revealed that the P2A-linked bPACF198Y (magenta) provides a significantly higher dynamic range and more consistent dose–response curves compared to the IRES-coupled version (green). Consequently, the Epacred4-P2A-bPACF198Y construct represents the most effective tool for precise optogenetic cAMP manipulation, offering minimal background activity and superior sensitivity.

3.5. Reversibility and Robustness of bPACF198Y-Mediated cAMP Signaling

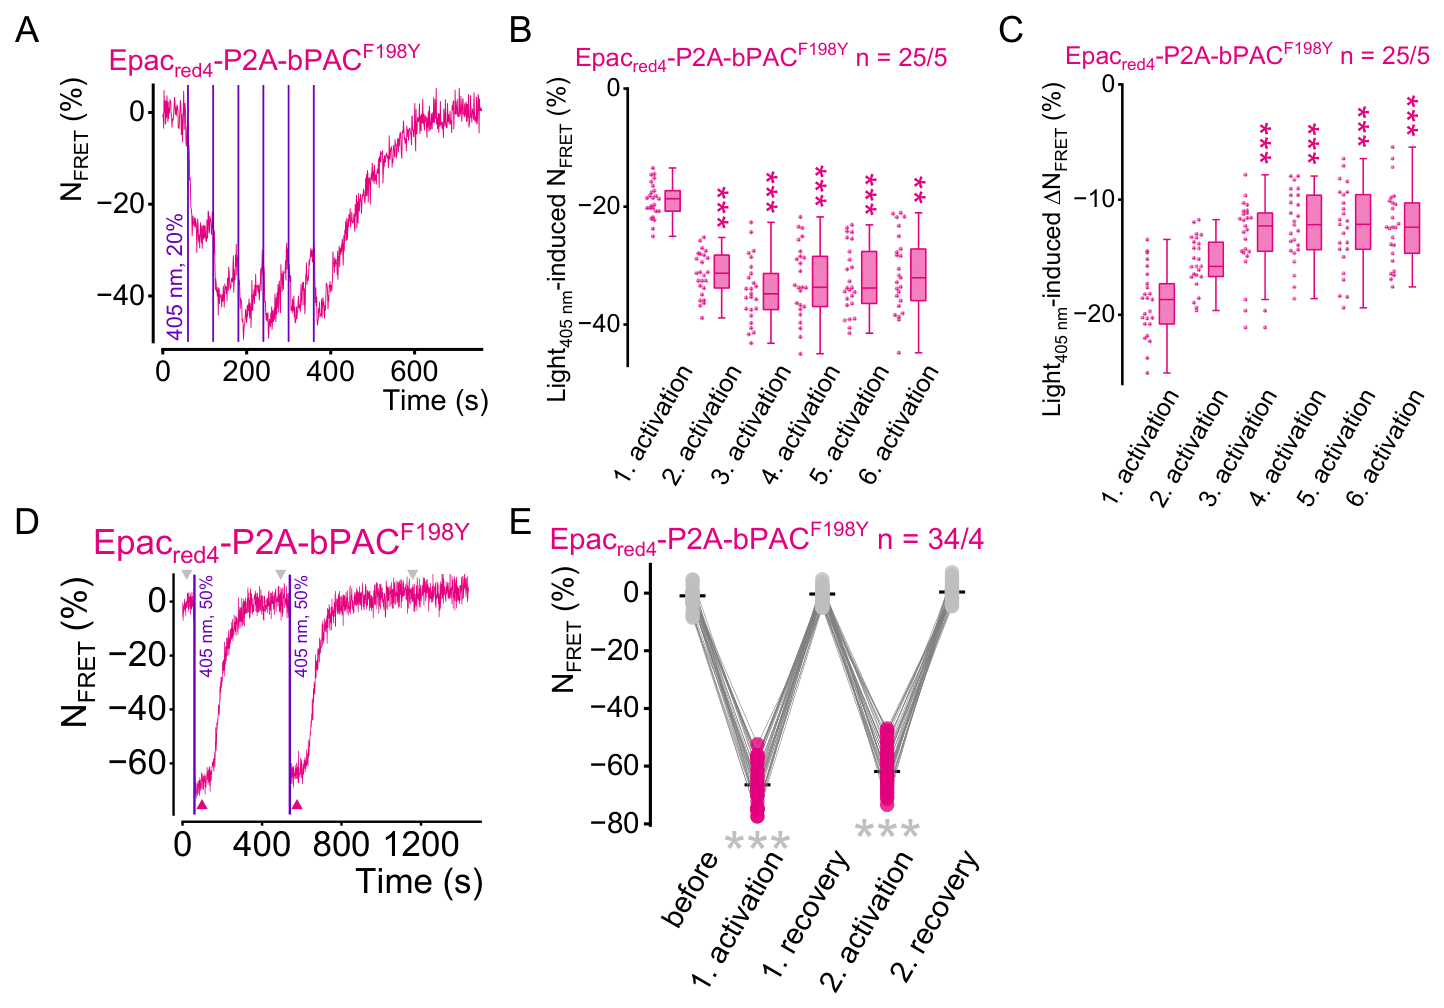
To assess the temporal resolution and reversibility of the selected Epacred4-P2A-bPACF198Y construct, we performed repetitive optogenetic stimulation assays. Cells were subjected to a series of six consecutive brief 405 nm laser pulses (100 ms duration, every 60 s) at a low, non-saturating intensity of 20% (Figure 4A). Each individual light pulse triggered a rapid decrease in NFRET, followed by partial recovery within the one-minute inter-pulse interval. Upon cessation of the stimulation protocol, the NFRET signal returned completely to the baseline. Within 60 s after light stimulation, the FRET signal rapidly decreased and only partially recovered (Figure 4A). Notably, the initial light stimulus induced a significantly smaller maximal NFRET decrease compared with the subsequent repetitive light pulses (Figure 4B). From the second pulse onward, however, the magnitude of the NFRET responses remained remarkably stable, indicating steady-state conditions (Figure 4B). Consistently, the individual ΔNFRET values evoked by repeated light stimulation also remained stable from the third activation onward (Figure 4C). This suggests a priming effect or a rapid reach of a steady state between cAMP production and degradation after the initial stimulus. To challenge the system under maximal load, we applied two successive saturating pulses with a 50% light intensity and observed an extended recovery period (Figure 4D). Under these conditions, the NFRET signal decreased by approximately 65%, reaching a distinct plateau before returning to the baseline within roughly 400 s (Figure 4D). Statistical analysis of these repetitive saturating stimuli (Figure 4E) confirms that both the magnitude of the cAMP response and the kinetics of its recovery are highly reproducible (p < 0.001). These data underscore that the Epacred4-P2A-bPACF198Y system enables not only the titratable control of intracellular cAMP levels but also allows for long-term, repetitive measurements of cAMP dynamics with high temporal precision and full reversibility.

3.6. Monitoring Gs- and Gi/o-Mediated cAMP Signaling Using the Red-Shifted Epacred4 Sensor

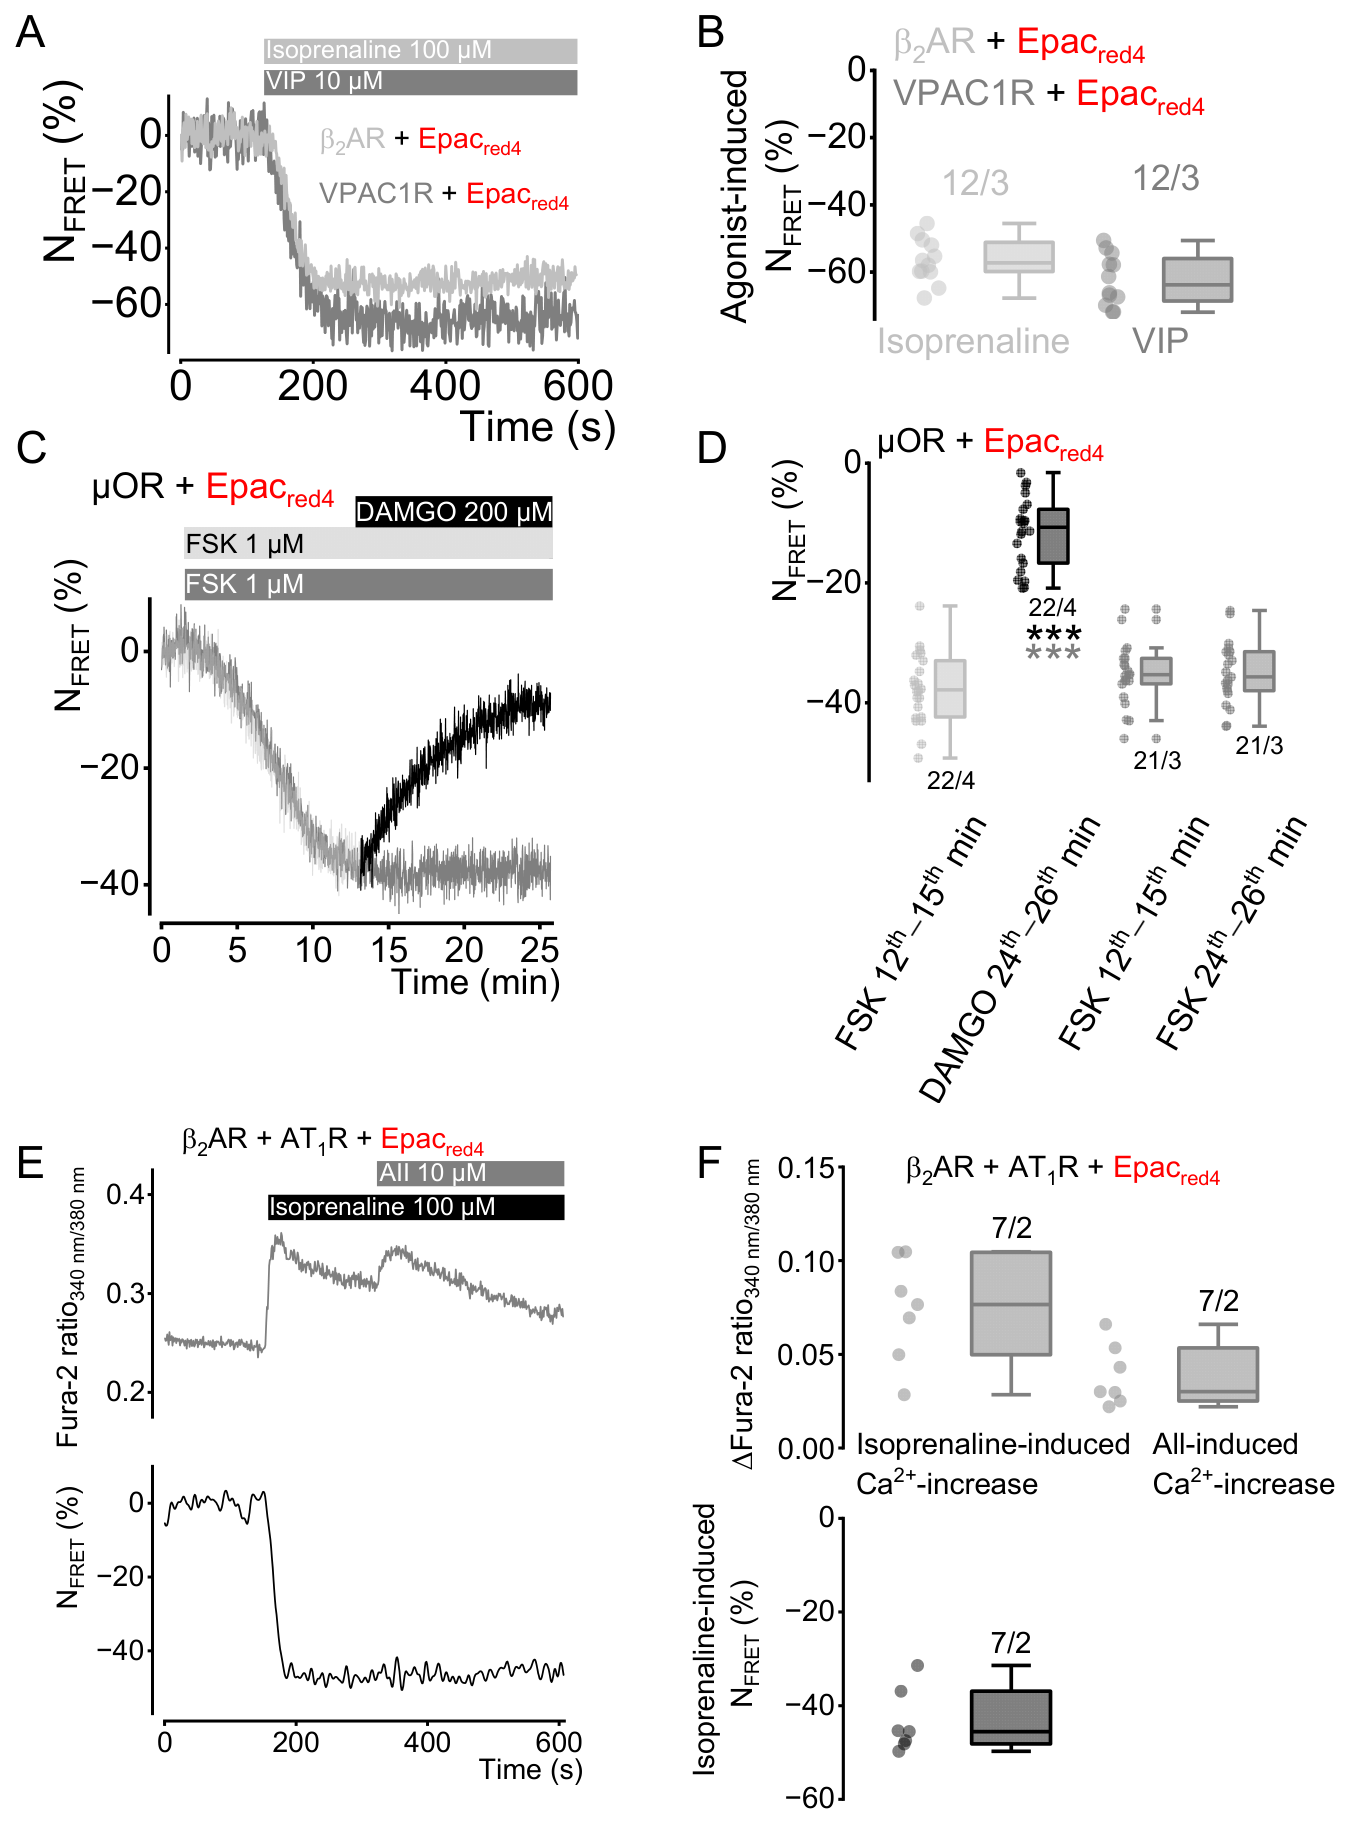
To evaluate the versatility and sensitivity of the lead red-shifted cAMP sensor, we performed live-cell imaging in HEK293T cells expressing various G protein-coupled receptors (GPCRs). First, we tested the sensor’s ability to detect Gs protein-mediated cAMP increases upon maximal stimulation of different receptor classes. Cells expressing either the Class A β2-adrenergic receptor (β2AR) or the Class B vasoactive intestinal peptide receptor 1 (VPAC1R) were stimulated with their respective agonists. As shown in the representative traces (Figure 5A), application of 100 µM isoprenaline (for β2AR) or 10 µM vasoactive intestinal peptide (VIP for VPAC1R) induced a rapid and robust decrease in NFRET, reflecting a pronounced rise in intracellular cAMP levels. The statistical analysis (Figure 5B) confirmed consistent maximal responses achieved with both receptors, with an agonist-induced NFRET change of approximately −46% to −72%. These data demonstrate that Epacred4 effectively monitors Gs protein activation across different GPCR families with a high dynamic range.
Next, we investigated whether the sensor could reliably detect Gi/o protein-coupled receptor-mediated decreases in cAMP levels—a significantly more challenging task than monitoring Gs protein activation. This difficulty arises from the stringent signal-to-noise requirements necessary to resolve inhibitory responses against a pre-established cAMP plateau. To evaluate if our lead red-shifted sensor matches the performance of the established blue-light-shifted benchmark EpacH187 in this demanding context [10], we performed live-cell imaging in HEK293T cells co-expressing the μ-opioid receptor (μOR) and Epacred4 sensor.
To establish the necessary high cAMP baseline, cells were first stimulated with 1 µM forskolin in the absence of PDE inhibitors [10,31]. As shown in the representative traces (Figure 5C), forskolin application induced a robust decrease in NFRET, reaching a stable plateau at approximately −40% suggesting steady-state conditions. Once this plateau was established (Figure 5C, represented by the light pink segment of the trace), application of the selective μOR agonist DAMGO (200 µM) after 12 min triggered a rapid and significant increase in NFRET, effectively reversing the forskolin-induced signal change toward the initial pre-stimulus baseline (Figure 5C, indicated by the transition to the dark pink segment). This upward shift reflects the Gi/o protein-mediated inhibition of adenylyl cyclase and the subsequent decline in intracellular cAMP levels. In contrast, control cells treated with forskolin alone (Figure 5C, grey trace) remained at the sustained FRET plateau throughout the recording, confirming that the observed signal reversal was specifically driven by μOR activation. Statistical quantification (Figure 5D) further underlines the sensor’s capability to resolve these inhibitory nuances. Following the forskolin-induced plateau (median ± SD: −38 ± 6%), the subsequent application of DAMGO triggered a significant NFRET increase of +29 ± 7% (median ± SD), effectively shifting the signal to a final state of −11 ± 6% (median ± SD). This Gi/o protein-mediated recovery was highly significant compared to both the preceding forskolin plateau (Wilcoxon signed-rank test, p < 0.001; black asterisks) and the time-matched forskolin control group at 24–26 min (Mann–Whitney U test, p < 0.001; grey asterisks). These results demonstrate that Epacred4 possesses the high sensitivity and baseline stability required to monitor even subtle Gi/o protein-mediated inhibitory signals, successfully overcoming the inherent technical challenges of inhibitory cAMP imaging against a high-stimulus background. Altogether, these findings elevate Epacred4 beyond a simple detection tool, establishing it as a high-precision red-shifted benchmark capable of resolving the full complexity of bidirectional cAMP signaling from potent Gs protein-driven stimulation to the nuanced and precise detection of Gi/o protein-mediated inhibition in real-time.

3.7. Simultaneous Multiplexed Imaging of cAMP and Ca2+ Dynamics

To further demonstrate the versatility of Epacred4 for multi-parameter imaging, we performed simultaneous recording of intracellular cAMP and Ca2+ dynamics. HEK293T cells were co-expressing the β2-adrenoceptor (β2AR), the angiotensin II type 1 receptor (AT1R), and the Epacred4 sensor. By utilizing the ratiometric Ca2+ indicator Fura-2, we could monitor both second messengers in real-time with minimal spectral overlap (Figure 5E).
Upon stimulation with 100 µM isoprenaline, we observed an immediate increase in the Fura-2 ratio alongside the expected decrease in NFRET, indicating a rapid increase in intracellular Ca2+ concentration. While the β2AR primarily couples to the Gs protein, the observed Ca2+ mobilization eventually results from agonist-dependent Gq protein coupling of the overexpressed receptor, a mechanism recently highlighted by De Pascali et al. (2024) [31]. Subsequent application of 10 µM angiotensin II (AII) triggered a second Ca2+ transient via the Gq/11 protein-coupled AT1R without further altering the established cAMP plateau (Figure 5E). Statistical analysis (Figure 5F) shows that using Epacred4 a median isoprenaline-induced NFRET decrease of approximately 45% was achieved. Furthermore, sequential stimulation with isoprenaline and AII gave rise to two transient calcium increases that were not significantly different. These findings highlight that Epacred4 is an ideal tool for multiplexed signaling assays, allowing for the precise, real-time dissection of the interplay of cAMP and Ca2+ and the identification of complex GPCR signaling signatures, such as the dual Gs/Gq protein coupling of the β2AR.

3.8. Characterization of PDE-Mediated cAMP Degradation Kinetics and Homeostatic Robustness

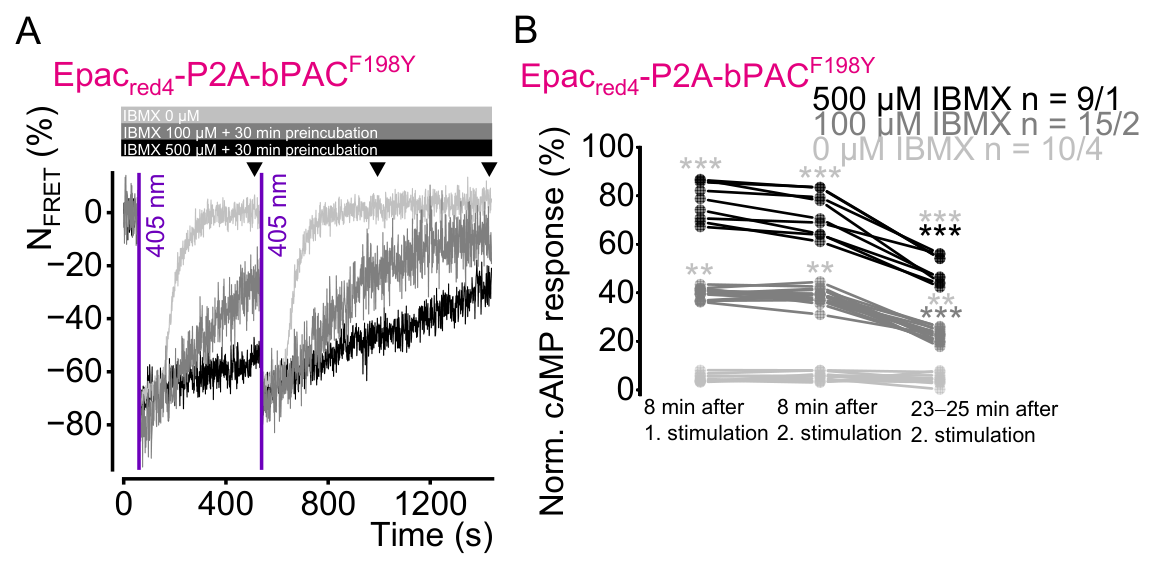
To investigate the role of endogenous PDEs and the stability of cAMP homeostasis, we utilized a construct expressing the Epacred4 sensor and the blue-light-activated adenylyl cyclase bPACF198Y linked by a P2A self-cleaving peptide (Figure 6). This approach allows for precise, repeated, non-invasive elevations of cAMP via 405 nm laser light pulses while simultaneously monitoring the decay kinetics driven by PDE activity to probe the ability of the cell to restore cAMP equilibrium.
In control cells in the absence of the broad-spectrum PDE inhibitor 3-isobutyl-1-methylxanthin (IBMX) (0 µM IBMX, gray trace), a brief 405 nm light pulse induced a rapid decrease in NFRET, followed by a rapid recovery to the pre-stimulus baseline within approximately 400 s (Figure 6A). This recovery phase reflects the kinetics of high basal PDE activity, which serves as the primary engine of the cellular homeostatic machinery. Crucially, this restoration of cAMP homeostasis was highly repeatable. The second light stimulus exhibited nearly identical NFRET amplitudes and kinetics with a full recovery to the pre-stimulus baseline. This demonstrates that under physiological conditions, the cell possesses a robust capacity to “reset” its cAMP levels, ensuring that subsequent signaling events are not masked or distorted by previous activity. To quantify how impaired PDE activity affects these dynamics, cells were preincubated for 30 min with either 100 µM or 500 µM IBMX. As shown in Figure 6A, while the initial activation kinetics (the rapid FRET drop) remained intact upon each light pulse, the recovery NFRET kinetics were significantly slowed or abolished. 100 µM IBMX significantly slowed the cAMP degradation kinetics, leading to a delayed return to baseline (Figure 6A, cyan trace). A concentration of 500 µM almost entirely abolished the restoration of the cAMP homeostasis (Figure 6A, teal trace). This illustrates that while the sensor remains fully responsive to repeated stimuli, the loss of homeostatic control transforms transient, pulsatile signals into a sustained and cumulative cAMP elevation.
Statistical quantification of the normalized intracellular cAMP levels (Figure 6B) confirms these observations. While control cells effectively restored the homeostatic setpoint after each stimulation, maintaining the capacity for repeatable kinetic cycles, cells treated with 500 µM IBMX exhibited a complete failure to reset. In these cells, cAMP levels remained in a state of chronic elevation after 8 min of the second stimulation (median ± SD: 71 ± 9%) and even 25 min after the final stimulation with 47 ± 6% (median ± SD). Ultimately, these findings are pointing to the view that the Epacred4 sensor, in combination with the P2A-linked bPAC, can serve as a sensitive cAMP detection platform and provides insights into the cellular cAMP homeostasis. Furthermore, precise dissection of the fragile kinetic equilibrium between second messenger synthesis and phosphodiesterase-mediated degradation can be monitored in real-time.

4. Discussion

Cellular signaling relies on the intricate interplay between second messengers, with Ca2+ and cAMP acting as ubiquitous and central regulators [32], embedded within a broader network of key mediators including IP3, DAG, and cGMP that collectively orchestrate cellular viability. Rather than acting in isolation, these messengers form a tightly coupled, interdependent signaling network. As is well established, Ca2+ levels shape cAMP dynamics via Ca2+-regulated adenylyl cyclases and phosphodiesterases, while cAMP-dependent protein kinase A reciprocally modulates Ca2+ influx and release. This bidirectional cross-talk is essential for generating complex signaling regimes such as the synchronized oscillations in pancreatic β-cells [33,34] or synaptic plasticity in neurons [35]. Measuring only one parameter provides a fragmentary view that can lead to a fundamental misinterpretation of the cellular state. The ability to monitor Ca2+ and cAMP simultaneously in the same cell is therefore essential for uncovering the causal relationships and phase shifts that define physiological homeostasis. For example, in pancreatic β-cells, the precise timing between Ca2+ oscillations and cAMP transients determines insulin secretion [36], while in neurons, coordinated Ca2+/cAMP dynamics underlie the induction of long-term potentiation and synaptic plasticity [37,38].
Despite the scientific demand, multiparametric imaging of cAMP alongside Ca2+ has been hindered by significant physical and optical constraints. Traditional CFP/YFP-based FRET sensors occupy the most vital part of the visible spectrum and create massive spectral overlap with established green Ca2+ indicators like the GCaMP family, making simultaneous imaging challenging. Likewise, the combination of CFP/YFP-based FRET sensors with the synthetic dye Fura-2 is problematic due to overlapping fluorescence emissions [39]. While the mOrange2-mCherry FRET pair has been successfully implemented to enable dual-FRET imaging in complex live-cell contexts, for example, concurrent Src and MT1-MMP activity mapping in single cells [40], significant spectral crosstalk between mOrange2 and mCherry remains, often narrowing the effective dynamic range of the sensors [41]. Red-shifted fluorescent proteins have historically lagged behind their green counterparts in quantum yield and brightness, which can limit sensor sensitivity and necessitate higher excitation intensities that increase phototoxicity and bleaching [42]. Engineering strategies aimed at enhancing dynamic range and photostability of red FRET pairs, including self-associating domain designs, illustrate one solution to these limitations but often still fall short of the performance needed for robust multiparametric imaging [43]. Although extending the sensing range further into the near-infrared would mitigate spectral overlap with visible Ca2+ indicators [44], this typically entails substantial technical effort to adapt excitation sources and detection hardware, which is not commonly implemented in standard imaging setups.
Our findings suggest that Epacred4 showed the most robust performance among the red-shifted variants. Notably, the utilization of mOrange2 as a FRET donor in Epacred2 and Epacred3 proved less effective than the use of tdLanYFP in Epacred4. One reason for this might be its high pKa of 6.5 compared to the significantly more acid-stable 3.9 of tdLanYFP. This pH sensitivity is particularly pronounced in the tandem variant Epacred3, which exhibited twice the variance in NFRET decreases under both maximally endogenous and light-induced bPAC activation. This might reflect a compounded pH dependency inherent to the doubled pKa in the tandem construct. Beyond its suboptimal acid stability, mOrange2 is further constrained by a lower quantum yield of 0.6 and a brightness of 34.8. These values fail to match the superior performance of tdLanYFP, which offers a quantum yield of 0.92 and a brightness of 122.4. While the mOrange2-mCherry pair was successfully implemented in complex imaging scenarios, significant crosstalk remains a major drawback that narrows the dynamic range of the sensor.
In contrast, tdScarlet3 represents a substantial technological advancement with an exceptional quantum yield of 0.70 and a brightness nearly three times that of mCherry2. This significantly enhances the signal-to-noise ratio in the FRET channel. The excitation maximum of mScarlet3 at 569 nm provides a superior spectral overlap with the mOrange2 emission compared to mCherry2. This results in a larger Förster radius and increased energy transfer efficiency. Coupled with its superior acid stability, tdScarlet3 is far superior as an acceptor for robust biosensor design. Provided that the quantum yield and pKa of mOrange2 could be further optimized in a next-generation “mOrange3”, a sophisticated dual-FRET architecture would become possible. Pairing an optimized mOrange3 with tdScarlet3 would establish a system that exhibits minimal spectral excitation overlap with established mTq2-tdVenus FRET pairs.
This streamlined approach facilitates the simultaneous recording of cAMP dynamics in distinct subcellular nanodomains via targeted Epac sensors. Furthermore, this strategy allows for the integration of modern mTurquoise2-cpmVenus Cameleon sensors for ratiometric calcium imaging alongside mOrange3-based cAMP sensors, which offers a powerful and purely genetically encoded alternative to traditional Fura-2-based multiplexing. The addition of the blue-light-activated adenylyl cyclase bPACF198Y transforms this observational setup into a causal platform. Beyond demonstrating spectral compatibility, this all-optical configuration enables temporally precise perturbation of cAMP levels. Furthermore, we could show that Epacred4 can be particularly useful for analyzing recovery kinetics and phosphodiesterase-dependent signal shaping (Figure 6). However, future studies with targeted bPAC pulses combined with subtype-specific PDE inhibitors might enable a deeper understanding of how specific enzyme isoforms guard individual nanodomains.
The practical utility of Epacred4 is most notably demonstrated by its seamless integration into multiplexed imaging protocols. While traditional blue-shifted sensors often restrict the available spectral space, the red-shifted profile of Epacred4 enables the use of the ratiometric Ca2+ indicator Fura-2 with minimal spectral interference. This is a critical advantage, as Fura-2 remains a gold standard for quantitative Ca2+ imaging due to its ratiometric nature, yet it was previously difficult to combine with CFP/YFP-based cAMP sensors. Our simultaneous recordings of cAMP and Ca2+ (Figure 5E,F) reveal the power of this combination in dissecting complex GPCR signaling signatures. The observation of a rapid Ca2+ transient following β2AR activation—typically regarded as a Gs protein-coupled event—highlights the ability of this GPCR to capture nuanced signaling crosstalk. As recently elucidated by De Pascali et al. (2024) [31], the β2AR can promote agonist-dependent Gq protein coupling, particularly in overexpression systems. By resolving both the Gs protein-driven cAMP rise and the Gq protein-mediated Ca2+ mobilization in the same cell, Epacred4 provides a comprehensive readout of receptor pleiotropy. The fact that subsequent AT1R activation triggered a further Ca2+ peak without perturbing the established cAMP plateau further underlines the independence and robustness of our dual-parameter setup. This capability is essential for studying “signal-tuning”, where multiple G protein pathways converge to shape the final cellular response. Future experiments investigating endogenously expressed receptors in native cells using multiplexing approaches might help unravel the complex interplay between cAMP and Ca2+ signaling.
Besides spectral properties and dynamic range, the cAMP affinity is an important criterion when selecting a genetically encoded cAMP biosensor. Epacred4, which is based on EpacH187, retains the Epac sensing domain, including the Q270E mutation, previously reported to decrease the Kd from approximately 9.5 µM to 4.0 µM, thereby increasing cAMP affinity by about 2.5-fold [11]. Since the cAMP-binding domain of Epacred4 was not modified, its cAMP-binding affinity is expected to remain comparable to that of EpacH187, with an apparent Kd in the single-digit micromolar range. However, because the fluorescent protein pair was redesigned, the exact Kd of Epacred4 cannot be inferred directly and must be determined experimentally. Indeed, changes in the fluorescent proteins may alter the conformational coupling within the biosensor and thereby affect its apparent affinity and overall sensor properties.
Recently developed genetically encoded cAMP biosensors exhibit a broad range of apparent cAMP affinities and employ different optical readout principles. Among currently available sensors, apparent Kd values range from the hundreds of nanomolar range to the single-digit micromolar range. cAMPinG1 [17] and R-FlincA [16] exhibit apparent Kd values in the hundreds of nanomolar range, whereas G-Flamp1 [14], Flamindo2 [13], Pink Flamindo [15], gCarvi [18], and Epac-based FRET sensors [11] including cAMPFIRE [19] operate in the single-digit micromolar range. Sensors in the hundreds of nanomolar range are particularly well suited for detecting small or basal changes in cAMP but may approach saturation during strong receptor stimulation or pharmacological elevation of cAMP. In contrast, sensors operating in the single-digit micromolar range provide a broader working range for monitoring large cAMP elevations and their subsequent recovery. Thus, the optimal biosensor depends on the expected intracellular cAMP concentrations and the biological question being addressed.
In addition to affinity, the optical design of a biosensor is an important consideration. Single-fluorescent-protein sensors, including cAMPinG1 [17], G-Flamp1 [14], Flamindo2 [13], Pink Flamindo [15], and R-FlincA [16], require relatively simple imaging setups, whereas EpacH187, cAMPFIRE, and Epacred4 are FRET-based biosensors that provide internally normalized ratiometric readouts [11,19]. gCarvi represents an alternative ratiometric design based on the bacterial cAMP receptor protein [18]. However, currently optimized Epac-derived FRET sensors largely rely on cyan/yellow fluorescent protein pairs, limiting their compatibility with blue-light optogenetic actuators such as bPAC and UV-excited indicators such as Fura-2. Epacred4 addresses this limitation by replacing the conventional cyan/yellow FRET pair with a yellow/red FRET pair while preserving ratiometric detection, thereby enabling quantitative multiparameter imaging with substantially reduced spectral overlap.
To summarize, our findings solidify Epacred4 as a premier high-fidelity benchmark that transcends simple detection and provides a high-resolution window into the fundamental robustness of cellular homeostasis. Furthermore, our findings identify Epacred4 as a robust red-shifted cAMP sensor that combines quantitative FRET readout with spectral compatibility for optogenetic stimulation and simultaneous multiparameter imaging. Future studies should determine how well Epacred4 performs in more physiologically relevant systems and whether it can be adapted to resolve highly localized cAMP nanodomains in subcellular compartments.

Supplementary Materials

The following supporting information can be downloaded at: https://www.mdpi.com/article/10.3390/cells15131223/s1, Material and Methods; Figure S1: Spectral characterization of the fluorescent proteins used in this study; Figure S2: Spectral analysis and functional characterization of the cAMP FRET sensors. Table S1: Spectral acquisition settings for live-cell fluorescence measurements; Table S2: Spectral characteristics of the fluorescent proteins utilized in this study.

Author Contributions

M.M.y.S. and U.S. designed experiments and supervised the study. T.K. performed FRET experiments. T.K., C.H. and M.M.y.S. analyzed the FRET data. A.T., C.H. and T.K. generated red-shifted cAMP sensors and bPAC constructs. M.M.y.S. and U.S. wrote the manuscript, and T.G. revised it. C.H. and T.K. wrote an R script for FRET analysis. M.M.y.S. and T.K. prepared all figures. All authors reviewed the manuscript. All authors have read and agreed to the published version of the manuscript.

Funding

This research was funded by the German Research Foundation (Deutsche Forschungsgemeinschaft) project no. ME 2456/4-1, TRR-152 project no. P26 and TRR-205 project no B14.

Data Availability Statement

All data reported in the paper will be shared by the corresponding authors upon request.

Acknowledgments

We thank Jürgen Aust and Michael Etterer for manufacturing of dehumidification chamber. We also thank Norbert Ertl for repairing the camera and the iMIC system, as well as for installing the camera cooling system. We also thank Lara Sauermann for support with CLARIOstar multimode plate reader from BMG LABTECH (Ortenberg, Germany).

Conflicts of Interest

The authors declare no competing interests.

Abbreviations

The following abbreviations are used in this manuscript:
EpacExchange proteins directly activated by cAMP
FRETFörster resonance energy transfer
bPACbacterial photoactivated adenylyl cyclase
cAMPCyclic adenosine monophosphate

References

  1. Lagerstrom, M.C.; Schioth, H.B. Structural diversity of G protein-coupled receptors and significance for drug discovery. Nat. Rev. Drug Discov. 2008, 7, 339–357. [Google Scholar] [CrossRef] [PubMed]
  2. Pierce, K.L.; Premont, R.T.; Lefkowitz, R.J. Seven-transmembrane receptors. Nat. Rev. Mol. Cell Biol. 2002, 3, 639–650. [Google Scholar] [CrossRef] [PubMed]
  3. Lorente, J.S.; Sokolov, A.V.; Ferguson, G.; Schioth, H.B.; Hauser, A.S.; Gloriam, D.E. GPCR drug discovery: New agents, targets and indications. Nat. Rev. Drug Discov. 2025, 24, 458–479. [Google Scholar] [CrossRef] [PubMed]
  4. Sassone-Corsi, P. The cyclic AMP pathway. Cold Spring Harb. Perspect. Biol. 2012, 4, a011148. [Google Scholar] [CrossRef] [PubMed]
  5. Yadav, R.; Zaccolo, M. GPCR signaling via cAMP nanodomains. Biochem. J. 2025, 482, 519–533. [Google Scholar] [CrossRef] [PubMed]
  6. de Rooij, J.; Zwartkruis, F.J.; Verheijen, M.H.; Cool, R.H.; Nijman, S.M.; Wittinghofer, A.; Bos, J.L. Epac is a Rap1 guanine-nucleotide-exchange factor directly activated by cyclic AMP. Nature 1998, 396, 474–477. [Google Scholar] [CrossRef] [PubMed]
  7. Kawasaki, H.; Springett, G.M.; Mochizuki, N.; Toki, S.; Nakaya, M.; Matsuda, M.; Housman, D.E.; Graybiel, A.M. A family of cAMP-binding proteins that directly activate Rap1. Science 1998, 282, 2275–2279. [Google Scholar] [CrossRef] [PubMed]
  8. Nikolaev, V.O.; Bunemann, M.; Hein, L.; Hannawacker, A.; Lohse, M.J. Novel single chain cAMP sensors for receptor-induced signal propagation. J. Biol. Chem. 2004, 279, 37215–37218. [Google Scholar] [CrossRef] [PubMed]
  9. Klarenbeek, J.B.; Goedhart, J.; Hink, M.A.; Gadella, T.W.; Jalink, K. A mTurquoise-based cAMP sensor for both FLIM and ratiometric read-out has improved dynamic range. PLoS ONE 2011, 6, e19170. [Google Scholar] [CrossRef] [PubMed]
  10. Storch, U.; Straub, J.; Erdogmus, S.; Gudermann, T.; Mederos y Schnitzler, M. Dynamic monitoring of Gi/o-protein-mediated decreases of intracellular cAMP by FRET-based Epac sensors. Pflüg. Arch.-Eur. J. Physiol. 2017, 469, 725–737, Erratum in Pflüg. Arch.-Eur. J. Physiol. 2017, 469, 1231–1232. https://doi.org/10.1007/s00424-017-1985-z. [Google Scholar] [CrossRef] [PubMed]
  11. Klarenbeek, J.; Goedhart, J.; van Batenburg, A.; Groenewald, D.; Jalink, K. Fourth-generation epac-based FRET sensors for cAMP feature exceptional brightness, photostability and dynamic range: Characterization of dedicated sensors for FLIM, for ratiometry and with high affinity. PLoS ONE 2015, 10, e0122513. [Google Scholar] [CrossRef] [PubMed]
  12. Goedhart, J.; von Stetten, D.; Noirclerc-Savoye, M.; Lelimousin, M.; Joosen, L.; Hink, M.A.; van Weeren, L.; Gadella, T.W., Jr.; Royant, A. Structure-guided evolution of cyan fluorescent proteins towards a quantum yield of 93%. Nat. Commun. 2012, 3, 751. [Google Scholar] [CrossRef] [PubMed]
  13. Odaka, H.; Arai, S.; Inoue, T.; Kitaguchi, T. Genetically-encoded yellow fluorescent cAMP indicator with an expanded dynamic range for dual-color imaging. PLoS ONE 2014, 9, e100252. [Google Scholar] [CrossRef] [PubMed]
  14. Wang, L.; Wu, C.; Peng, W.; Zhou, Z.; Zeng, J.; Li, X.; Yang, Y.; Yu, S.; Zou, Y.; Huang, M.; et al. A high-performance genetically encoded fluorescent indicator for in vivo cAMP imaging. Nat. Commun. 2022, 13, 5363. [Google Scholar] [CrossRef] [PubMed]
  15. Harada, K.; Ito, M.; Wang, X.; Tanaka, M.; Wongso, D.; Konno, A.; Hirai, H.; Hirase, H.; Tsuboi, T.; Kitaguchi, T. Red fluorescent protein-based cAMP indicator applicable to optogenetics and in vivo imaging. Sci. Rep. 2017, 7, 7351. [Google Scholar] [CrossRef] [PubMed]
  16. Ohta, Y.; Furuta, T.; Nagai, T.; Horikawa, K. Red fluorescent cAMP indicator with increased affinity and expanded dynamic range. Sci. Rep. 2018, 8, 1866. [Google Scholar] [CrossRef] [PubMed]
  17. Yokoyama, T.; Manita, S.; Uwamori, H.; Tajiri, M.; Imayoshi, I.; Yagishita, S.; Murayama, M.; Kitamura, K.; Sakamoto, M. A multicolor suite for deciphering population coding of calcium and cAMP in vivo. Nat. Methods 2024, 21, 897–907. [Google Scholar] [CrossRef] [PubMed]
  18. Kawata, S.; Mukai, Y.; Nishimura, Y.; Takahashi, T.; Saitoh, N. Green fluorescent cAMP indicator of high speed and specificity suitable for neuronal live-cell imaging. Proc. Natl. Acad. Sci. USA 2022, 119, e2122618119. [Google Scholar] [CrossRef] [PubMed]
  19. Massengill, C.I.; Bayless-Edwards, L.; Ceballos, C.C.; Cebul, E.R.; Cahill, J.; Bharadwaj, A.; Wilson, E.; Qin, M.; Whorton, M.R.; Baconguis, I.; et al. Sensitive genetically encoded sensors for population and subcellular imaging of cAMP in vivo. Nat. Methods 2022, 19, 1461–1471. [Google Scholar] [CrossRef] [PubMed]
  20. Stierl, M.; Stumpf, P.; Udwari, D.; Gueta, R.; Hagedorn, R.; Losi, A.; Gartner, W.; Petereit, L.; Efetova, M.; Schwarzel, M.; et al. Light modulation of cellular cAMP by a small bacterial photoactivated adenylyl cyclase, bPAC, of the soil bacterium Beggiatoa. J. Biol. Chem. 2011, 286, 1181–1188. [Google Scholar] [CrossRef] [PubMed]
  21. Ryu, M.H.; Moskvin, O.V.; Siltberg-Liberles, J.; Gomelsky, M. Natural and engineered photoactivated nucleotidyl cyclases for optogenetic applications. J. Biol. Chem. 2010, 285, 41501–41508. [Google Scholar] [CrossRef] [PubMed]
  22. Bruce, J.I.; Straub, S.V.; Yule, D.I. Crosstalk between cAMP and Ca2+ signaling in non-excitable cells. Cell Calcium 2003, 34, 431–444. [Google Scholar] [CrossRef] [PubMed]
  23. Grynkiewicz, G.; Poenie, M.; Tsien, R.Y. A new generation of Ca2+ indicators with greatly improved fluorescence properties. J. Biol. Chem. 1985, 260, 3440–3450. [Google Scholar] [CrossRef] [PubMed]
  24. Bousmah, Y.; Valenta, H.; Bertolin, G.; Singh, U.; Nicolas, V.; Pasquier, H.; Tramier, M.; Merola, F.; Erard, M. tdLanYFP, a Yellow, Bright, Photostable, and pH-Insensitive Fluorescent Protein for Live-Cell Imaging and Forster Resonance Energy Transfer-Based Sensing Strategies. ACS Sens. 2021, 6, 3940–3947. [Google Scholar] [CrossRef] [PubMed]
  25. Shaner, N.C.; Lin, M.Z.; McKeown, M.R.; Steinbach, P.A.; Hazelwood, K.L.; Davidson, M.W.; Tsien, R.Y. Improving the photostability of bright monomeric orange and red fluorescent proteins. Nat. Methods 2008, 5, 545–551. [Google Scholar] [CrossRef] [PubMed]
  26. Gadella, T.W.J., Jr.; van Weeren, L.; Stouthamer, J.; Hink, M.A.; Wolters, A.H.G.; Giepmans, B.N.G.; Aumonier, S.; Dupuy, J.; Royant, A. mScarlet3: A brilliant and fast-maturing red fluorescent protein. Nat. Methods 2023, 20, 541–545. [Google Scholar] [CrossRef] [PubMed]
  27. Ponsioen, B.; Zhao, J.; Riedl, J.; Zwartkruis, F.; van der Krogt, G.; Zaccolo, M.; Moolenaar, W.H.; Bos, J.L.; Jalink, K. Detecting cAMP-induced Epac activation by fluorescence resonance energy transfer: Epac as a novel cAMP indicator. EMBO Rep. 2004, 5, 1176–1180. [Google Scholar] [CrossRef] [PubMed]
  28. Kim, J.H.; Lee, S.R.; Li, L.H.; Park, H.J.; Park, J.H.; Lee, K.Y.; Kim, M.K.; Shin, B.A.; Choi, S.Y. High cleavage efficiency of a 2A peptide derived from porcine teschovirus-1 in human cell lines, zebrafish and mice. PLoS ONE 2011, 6, e18556. [Google Scholar] [CrossRef] [PubMed]
  29. Xia, Z.; Liu, Y. Reliable and global measurement of fluorescence resonance energy transfer using fluorescence microscopes. Biophys. J. 2001, 81, 2395–2402. [Google Scholar] [CrossRef] [PubMed]
  30. Yang, S.; Constantin, O.M.; Sachidanandan, D.; Hofmann, H.; Kunz, T.C.; Kozjak-Pavlovic, V.; Oertner, T.G.; Nagel, G.; Kittel, R.J.; Gee, C.E.; et al. PACmn for improved optogenetic control of intracellular cAMP. BMC Biol. 2021, 19, 227. [Google Scholar] [CrossRef] [PubMed]
  31. De Pascali, F.; Inoue, A.; Benovic, J.L. Diverse pathways in GPCR-mediated activation of Ca2+ mobilization in HEK293 cells. J. Biol. Chem. 2024, 300, 107882. [Google Scholar] [CrossRef] [PubMed]
  32. Arige, V.; Yule, D.I. Spatial and temporal crosstalk between the cAMP and Ca2+ signaling systems. Biochim. Biophys. Acta (BBA)-Mol. Cell Res. 2022, 1869, 119293. [Google Scholar] [CrossRef] [PubMed]
  33. Landa, L.R., Jr.; Harbeck, M.; Kaihara, K.; Chepurny, O.; Kitiphongspattana, K.; Graf, O.; Nikolaev, V.O.; Lohse, M.J.; Holz, G.G.; Roe, M.W. Interplay of Ca2+ and cAMP signaling in the insulin-secreting MIN6 beta-cell line. J. Biol. Chem. 2005, 280, 31294–31302. [Google Scholar] [CrossRef] [PubMed]
  34. Ni, Q.; Ganesan, A.; Aye-Han, N.N.; Gao, X.; Allen, M.D.; Levchenko, A.; Zhang, J. Signaling diversity of PKA achieved via a Ca2+-cAMP-PKA oscillatory circuit. Nat. Chem. Biol. 2011, 7, 34–40. [Google Scholar] [CrossRef] [PubMed]
  35. Zhang, M.; Storm, D.R.; Wang, H. Bidirectional synaptic plasticity and spatial memory flexibility require Ca2+-stimulated adenylyl cyclases. J. Neurosci. 2011, 31, 10174–10183. [Google Scholar] [CrossRef] [PubMed]
  36. Qiao, L.; Getz, M.; Gross, B.; Tenner, B.; Zhang, J.; Rangamani, P. Spatiotemporal orchestration of calcium-cAMP oscillations on AKAP/AC nanodomains is governed by an incoherent feedforward loop. PLoS Comput. Biol. 2024, 20, e1012564. [Google Scholar] [CrossRef] [PubMed]
  37. Shahoha, M.; Cohen, R.; Ben-Simon, Y.; Ashery, U. cAMP-Dependent Synaptic Plasticity at the Hippocampal Mossy Fiber Terminal. Front. Synaptic Neurosci. 2022, 14, 861215. [Google Scholar] [CrossRef] [PubMed]
  38. Kim, O.; Okamoto, Y.; Kaufmann, W.A.; Brose, N.; Shigemoto, R.; Jonas, P. Presynaptic cAMP-PKA-mediated potentiation induces reconfiguration of synaptic vesicle pools and channel-vesicle coupling at hippocampal mossy fiber boutons. PLoS Biol. 2024, 22, e3002879. [Google Scholar] [CrossRef] [PubMed]
  39. Harbeck, M.C.; Chepurny, O.; Nikolaev, V.O.; Lohse, M.J.; Holz, G.G.; Roe, M.W. Simultaneous optical measurements of cytosolic Ca2+ and cAMP in single cells. Sci. STKE 2006, 2006, pl6. [Google Scholar] [CrossRef] [PubMed]
  40. Ouyang, M.; Huang, H.; Shaner, N.C.; Remacle, A.G.; Shiryaev, S.A.; Strongin, A.Y.; Tsien, R.Y.; Wang, Y. Simultaneous visualization of protumorigenic Src and MT1-MMP activities with fluorescence resonance energy transfer. Cancer Res. 2010, 70, 2204–2212. [Google Scholar] [CrossRef] [PubMed]
  41. Bajar, B.T.; Wang, E.S.; Zhang, S.; Lin, M.Z.; Chu, J. A Guide to Fluorescent Protein FRET Pairs. Sensors 2016, 16, 1488. [Google Scholar] [CrossRef] [PubMed]
  42. Bajar, B.T.; Wang, E.S.; Lam, A.J.; Kim, B.B.; Jacobs, C.L.; Howe, E.S.; Davidson, M.W.; Lin, M.Z.; Chu, J. Improving brightness and photostability of green and red fluorescent proteins for live cell imaging and FRET reporting. Sci. Rep. 2016, 6, 20889. [Google Scholar] [CrossRef] [PubMed]
  43. Lindenburg, L.H.; Hessels, A.M.; Ebberink, E.H.; Arts, R.; Merkx, M. Robust red FRET sensors using self-associating fluorescent domains. ACS Chem. Biol. 2013, 8, 2133–2139. [Google Scholar] [CrossRef] [PubMed]
  44. Qian, Y.; Piatkevich, K.D.; Mc Larney, B.; Abdelfattah, A.S.; Mehta, S.; Murdock, M.H.; Gottschalk, S.; Molina, R.S.; Zhang, W.; Chen, Y.; et al. A genetically encoded near-infrared fluorescent calcium ion indicator. Nat. Methods 2019, 16, 171–174. [Google Scholar] [CrossRef] [PubMed]
Figure 1. Functional validation and dynamic range of red-shifted cAMP FRET sensors. (AE) Representative single-cell recordings of HEK293T cells expressing the established blue-shifted FRET-based cAMP sensor EpacH187 (A) or the red-shifted variants Epacred1 (B), Epacred2 (C), Epacred3 (D), and Epacred4 (E). Upper panels: Cross-talk-corrected fluorescence intensity traces of the respective donor and acceptor fluorophores. Lower panels: Calculated normalized FRET (NFRET) traces. Gray bars indicate pharmacological stimulation with the adenylyl cyclase activator forskolin (FSK, 1 mM). (F) Summary of FSK-induced maximal NFRET signals. Data are presented as box-and-whisker plots (median, interquartile range, and min/max whiskers) with individual data points (color-coded dots) plotted to the left of each box. The numbers below each box indicate the total number of analyzed cells and the number of independent transfections. Color-coded asterisks indicate significance levels (* p < 0.05, ** p < 0.01, *** p < 0.001, Mann–Whitney U-test) for the comparison of Epacred4 against the other cAMP sensors.
Cells 15 01223 g001
Figure 2. Optogenetic validation of the red-shifted cAMP FRET sensors. (AD) Representative NFRET traces of HEK293T cells expressing the red-shifted sensor variants Epacred1 (A), Epacred2 (B), Epacred3 (C), or Epacred4 (D). (AD) First and third panels show NFRET time courses in the absence (first) or presence (third) of co-expressed bacterial photoactivated adenylyl cyclase (bPAC). The second and fourth panels show analysis of NFRET values at three different time points prior to application of a single 405 nm laser light pulse (100 ms). bPAC that was co-expressed using a bicistronic pIRES2 expression vector. Purple arrows indicate a single 405 nm laser light pulse (100 ms) to trigger cAMP production by stimulation of bPAC. (E) Summary of the NFRET changes induced by light stimulation. Data are shown as box-and-whisker plots (median, interquartile range, and min/max whiskers) with individual data points plotted to the left of each box. Responses are shown for sensors expressing the red-shifted Epac sensors alone (without bPAC) or co-expressing bPAC (with IRES-bPACwt). The numbers below each box represent the total number of analyzed cells and the number of independent transfections. Color-coded asterisks indicate significance levels (*** p < 0.001, Mann–Whitney U-test) for the comparison of Epacred4 against the other red-shifted variants.
Cells 15 01223 g002
Figure 3. bPACF198Y enables precise, graded control of cAMP levels with minimal dark activity. (A,B) Representative NFRET traces of HEK293T cells expressing Epacred4 together with bPACwt (A) or bPACF198Y (B). Stoichiometric expression was enabled via a P2A peptide. Purple arrowheads indicate a 405 nm laser light pulse (100 ms, 50% intensity). The continuous baseline decline in (A) indicates high dark activity of bPACwt. (C) Statistical comparison of NFRET levels at different time points before and after light stimulation in the presence of bPACwt or bPACF198Y. Significant differences between bPACwt and bPACF198Y at each time point were calculated using Mann–Whitney U-test (pink asterisks; *** p < 0.001). (D,E) Representative NFRET traces showing the graded response of Epacred4 to 405 nm light pulses with increasing light intensities from 10% to 80% using cDNA expression vectors that contain either an IRES (D) or P2A sequence (E) for co-expression of Epacred4 and bPACF198Y. (F) Summary of the maximal NFRET signals induced by application of increasing light intensities (10–90%). Data are presented as box-and-whisker plots (median, interquartile range, and min/max whiskers) with individual data points plotted to the left of each box. The numbers below each box represent the total number of analyzed cells and number of independent transfections. Asterisks (* p < 0.05, *** p < 0.001, Mann–Whitney U-test) indicate significant differences between the NFRET signals at the indicated light intensities obtained by using the P2A (magenta) or the IRES (green) construct.
Cells 15 01223 g003
Figure 4. Temporal resolution, reproducibility, and reversibility of bPACF198Y-mediated cAMP signaling. (A) Representative NFRET trace of a HEK293T cell expressing the Epacred4-P2A-bPACF198Y construct. The cell was subjected to six consecutive 405 nm laser light pulses (100 ms duration, 20% intensity) at 60 s intervals (indicated by purple vertical lines). (B,C) Summary of the NFRET responses obtained by the repetitive stimulation protocol shown in (A). (B) Maximal NFRET decreases achieved after each individual light pulse. (C) Individual ΔNFRET decreases induced after each individual light pulse. Asterisks indicate significant differences compared to the first pulse (1. activation; *** p < 0.001, Mann–Whitney U-test). (D) Representative NFRET trace showing the response to two successive saturating 405 nm laser pulses (100 ms, 50% intensity), demonstrating full reversibility and return to baseline over an extended recovery period. (E) Summary of the NFRET signals before, during and after the repetitive saturating stimuli. Individual data points (gray dots and pink dots) represent NFRET signals of individual cells, with gray lines connecting the measurements of each cell across the different states (baseline, activation, recovery). Asterisks indicate significant NFRET changes compared to the respective preceding baseline (** p < 0.01, *** p < 0.001, Mann–Whitney U-test). The numbers indicate the total number of measured cells and the number of independent transfections.
Cells 15 01223 g004
Figure 5. Validation of Epacred4 for monitoring Gs and Gi/o protein-coupled receptor signaling and multiplexing with Ca2+. (A) Representative NFRET traces of HEK293T cells co-expressing Epacred4 and either the Gs protein-coupled β2-adrenergic receptor (β2AR, light gray) or the vasoactive intestinal peptide receptor 1 (VPAC1R, dark grey). Maximal stimulation was induced by bath application of isoprenaline (100 µM) or VIP (10 µM), respectively. (B) Summary of the maximal agonist-induced NFRET decreases. Data are shown as box-and-whisker plots (median, interquartile range, and min/max whiskers) with individual data points. The numbers above each box represent the total number of measured cells and the number of independent transfections. (C) Representative NFRET traces showing Gi/o protein-mediated signaling. Intracellular cAMP was first elevated by the application of 1 µM forskolin (FSK). The light grey segment of the trace represents the FSK-induced NFRET decrease to the stable plateau at approximately −40%. The subsequent activation of the µ-opioid receptor (µOR) with 200 µM DAMGO (indicated by the transition to the black segment of this trace) resulted in a robust recovery of the FRET signal toward the baseline, while the application of FSK alone (grey trace) resulted in stable NFRET values. (D) Summary of the NFRET signals in response to Gi/o protein-coupled receptor activation selected during the forskolin-induced plateau (light grey box, 12–15 min), the subsequent DAMGO-induced recovery phase (dark grey box, 24–26 min) and during the forskolin-induced plateau without receptor stimulation (grey boxes, 12–15 min and 24–26 min). Data are presented as box-and-whisker plots (median, interquartile range, and min/max whiskers) with individual data points plotted to the left of each box. Black asterisks indicate a significant NFRET increase within the same cells compared to the FSK plateau (paired Wilcoxon signed-rank test, *** p < 0.001). Grey asterisks indicate a significant difference between the DAMGO-stimulated group and the time-matched control group of cells stimulated with FSK alone (Mann–Whitney U-test, *** p < 0.001). The numbers below each box represent the total number of measured cells and number of independent transfections. (E) Representative traces of simultaneous cAMP and Ca2+ measurements in HEK293T cells co-expressing the β2-adrenoceptor (β2AR), the angiotensin II type 1 receptor (AT1R), and Epacred4. Intracellular Ca2+ dynamics were monitored using the ratiometric indicator Fura-2 (upper panel), while cAMP levels were recorded using Epacred4 (lower panel). Sequential stimulation with 100 µM isoprenaline and 10 µM angiotensin II (AII) highlights the dual Gs/Gq protein signaling signature of the β2AR and the Gq protein-specific response of the AT1R without spectral interference. (F) Summary of the Ca2+ and cAMP responses. The upper panel shows the maximal increase in the Fura-2 ratio induced by isoprenaline and after subsequent AII application (“All-induced”). The increase was calculated as Δ (peak minus the pre-peak baseline of the Fura-2 ratio). The lower panel shows the maximal isoprenaline-induced NFRET decrease. Data are presented as box-and-whisker plots (median, interquartile range, and min/max whiskers) with individual data points plotted to the left of each box. The numbers above each box represent the total number of measured cells and number of independent transfections.
Cells 15 01223 g005
Figure 6. Impact of PDE inhibition on optogenetically triggered cAMP dynamics. (A) Representative NFRET traces showing repetitive cAMP induction in HEK293T cells expressing Epacred4-P2A-bPACF198Y. Two 405 nm laser pulses with 50% light intensity (vertical purple lines) were applied to demonstrate repeatability of the response and cumulative signaling. Cells were either untreated (0 µM IBMX, gray) or preincubated with 100 µM (gray) or 500 µM IBMX (black). (B) Summary of normalized cAMP responses subsequent to laser light-induced cAMP production (100%). Individual data points with color-coded lines represent normalized cAMP responses of individual cells at the indicated time points. Sample sizes, such as the total number of analyzed cells and number of independent transfections, are indicated in the panel. Light gray asterisks indicate significant differences in the IBMX-treated groups compared to the time-matched control group in the absence of IBMX (** p < 0.01; *** p < 0.001; Kruskal–Wallis test followed by post hoc Dunn’s test). Gray and black asterisks indicate significant differences within the respective treatment group between the final time point (23–25 min) and the initial stimulation (8 min after 1st stimulation) (** p < 0.01; *** p < 0.001; Friedman test followed by post hoc Dunn’s test).
Cells 15 01223 g006
Table 1. PCR primers utilized for site-directed mutagenesis and molecular cloning. The table summarizes the primers employed for fluorophore extractions, deletions, and the introduction of specific point mutations (e.g., bPACF198Y). For each modification, the primer designation, nucleotide sequence in 5′ to 3′ orientation, and the optimized annealing temperature (Ta) are provided. Lowercase letters within the sequences indicate introduced modifications, such as restriction sites or linker sequences.
Modification/TargetPrimer DesignationSequence (5′–3′)Ta (°C)
H187 with deletion of mTq2H187_Del mTq2_fagcccgtgcagctgcccggcGATATCAGCCCGTGGGAACTCATG70.5
H187_Del mTq2_rGGTGGCGGCAAGCTTGGG
Extraction of cpmCherry2ExcpmCh2_fgacccaagcttgccgccaccATGGCCTACAACGTCGACATCAAGTTGGACATC72
ExcpmCh2_rGCCGGGCAGCTGCACGGG
tdV-Epac-cpmCh2 with deletion of tdVDel tdV_ftggacgagctgtacaagtaaAATTCCCTCGAGGTTAACGC65.7
Del tdV_rGCTAGCTGGCTCCAGCTC
Extraction of mOrange2ExmOr2_fgagagctggagccagctagcATGGTGAGCAAGGGCGAG65.1
ExmOr2_rTTACTTGTACAGCTCGTCCATG
Deletion of cpmCherry2cpmCherry2Del_fCGATATCAGCCCGTGGGAAC69
cpmCherry2Del_rGGTGGCGGCAAGCTTTCC
Deletion of tdVenustdVenDel_fTCTAGAGGGCCCTATTCTATAGTG67
tdVenDel_rGCTAGCTGGCTCCAGCTC
Insertion of EcoRI in EpacEPAC-insEcoRI_fgaattcGCCCTATTCTATAGTGTCACC63
EPAC-insEcoRI_rCCTCTAGAGCTAGCTGGC
Deletion of LiefAct tag and Insertion of NheI in mScarlet3mSc3_insNheI_fagcGCCACCATGGATAGCACC64
mSc3_insNheI_ragcGGTGGAATTCGAAGCTTGAG
Insertion of linker in Nhe1-mScarlet3mSc3_inlinker_fgggctcctcaggagaggaggataacTAACTGTACAAGTAAAGCGGCCGCGAC73
mSc3_inslinker_rgagcccgtagaaccagtgccagtcgaGGAGCCACCGGAGCCG
Opening of Nhe1-mScarlet3-linkermSc3-linker_Split_fTAACTGTACAAGTAAAGCGGCCG68
mSc3-linker_Split_rgttatcctcctctcctgaggagc
Extraction of mScarlet3-EcoRImSc3-EcoRI_fgatagcaccgaggcagtgatcaa70
mSc3-EcoRI_rtaaggagccaccggagcc
Insertion of Codon optimized ends in mOrange2mOr2codop_fATGGTTTCAAAGggcgaggagaataacatggc67
mOr2codop_rTTTATAGAGTTCATCcatgccgccggtgga
Insertion of linker in mOrange2mOr2inslinker_fgggctcctcaggagaggaggataacTAAGCGGCCGCGACTCTA67
mOr2inslinker_rgagcccgtagaaccagtgccagtcgaCTTGTACAGCTCGTCCATGC
Opening of mOrange2-linkermOr2 linker Split_fGCGGCCGCGACTCTAgat69
mOr2 linker Split_rgagcccgtagaaccagtgccagtcgaGGAGCCACCGGAGCCG
Extraction of mOrange2 (cod opt ends)Ex mOr2codoptends_fATGGTTTCAAAGggcgaggagaataacatggc67
Ex mOr2codoptends_rTTTATAGAGTTCATCcatgccgccggtgga
Extraction tdOrange2Ex tdOr2_ftcgccaccatggtgagcaa69
Ex tdOr2_rTTTTATAGAGTTCATCcatgccgccg
Extraction tdLanYFPEx tdLanYFP_ftagccaccATGGTCTCCAAAGGAGAGG64
Ex tdLanYFP_rtCTTGTACAGCTCGTCCATG
Exchange of F198Y in bPAC bPAC F198Y_fAGTGACCAAGtatATCGGCGACTGCG70
bPAC F198Y_rTCGCCGCCGTAGGCG
Deletion of IRES IRES del_fAtgatgaagcggctggtgtac60
IRES del_rcgtGAATTCggcggagccaccg
Table 2. Molecular architecture and photophysical properties of the Epac-based cAMP FRET sensors used in this study. The table summarizes the molecular composition of the established blue-shifted reference sensor (EpacH187) and the four newly developed red-shifted variants (Epacred1–Epacred4). Excitation wavelengths (nm) indicate the specific laser lines utilized for FRET donor and FRET acceptor excitation, respectively. Theoretical FRET efficiencies were calculated as the product of the Förster radius (R0) and the quantum yield of the acceptor (QYA) using the FPbase FRET calculator (https://www.fpbase.org/fret/ (accessed on 15 January 2026)). Epac: Exchange protein directly activated by cAMP, mTq2: monomeric Turquoise2, tdV: tandem dimer of circularly permuted monomeric Venus, cpmCh2: circularly permuted monomeric Cherry2, mOr2: monomeric Orange2, tdOr2: tandem dimer Orange2, tdSc3: tandem dimer Scarlet3, tdLanYFP: tandem dimer LanYFP. The colors denote the individual cAMP sensor constructs and are used as a sensor-specific color code in Figure 1 and Figure 2.
ConstructDesignationExcitation (nm)FRET Efficiency (R0 × QYA)
Cells 15 01223 i001mTq2-
Epac-
tdV
EpacH187405/51537
Cells 15 01223 i002tdV-
Epac-cpmCh2
Epacred1515/59413
Cells 15 01223 i003mOr2-
Epac-cpmCh2
Epacred2515/59414
Cells 15 01223 i004tdOr2-
Epac-
tdSc3
Epacred3515/59447
Cells 15 01223 i005tdLanYFP-Epac-
tdSc3
Epacred4515/56150
Disclaimer/Publisher’s Note: The statements, opinions and data contained in all publications are solely those of the individual author(s) and contributor(s) and not of MDPI and/or the editor(s). MDPI and/or the editor(s) disclaim responsibility for any injury to people or property resulting from any ideas, methods, instructions or products referred to in the content.