Article

Molecular Iodine/PPARγ Interaction in the Invasion and Angiogenesis of Neuroblastoma Xenografts

by
Edgar R. Juvera-Avalos
1,
Gustavo Orizaga-Osti
1,
Evangelina Delgado-Gonzalez
1,
Hilda Lomeli
2,
Brenda Anguiano
1 and
Carmen Aceves
1,*
1
Instituto de Neurobiología, Universidad Nacional Autónoma de Mexico, Juriquilla 76230, Queretaro, Mexico
2
Instituto de Biotecnología, Universidad Nacional Autónoma de Mexico, Cuernavaca 62210, Morelos, Mexico
*
Author to whom correspondence should be addressed.
Cells 2026, 15(13), 1189; https://doi.org/10.3390/cells15131189
Submission received: 24 March 2026 / Revised: 24 June 2026 / Accepted: 27 June 2026 / Published: 30 June 2026
(This article belongs to the Special Issue The Role of PPARs in Disease - Volume IV)

Highlights

What are the main findings?
  • Molecular iodine (I2) diminishes the viability of SK-N-AS (non-MYCN-amplified) and SK-N-BE(2) (MYCN-amplified) neuroblastoma cells.
  • The actions involve epigenetic (antioxidant) and genetic (activation of peroxisome proliferator-activated receptor gamma; PPARγ) mechanisms.
What is the implication of the main findings?
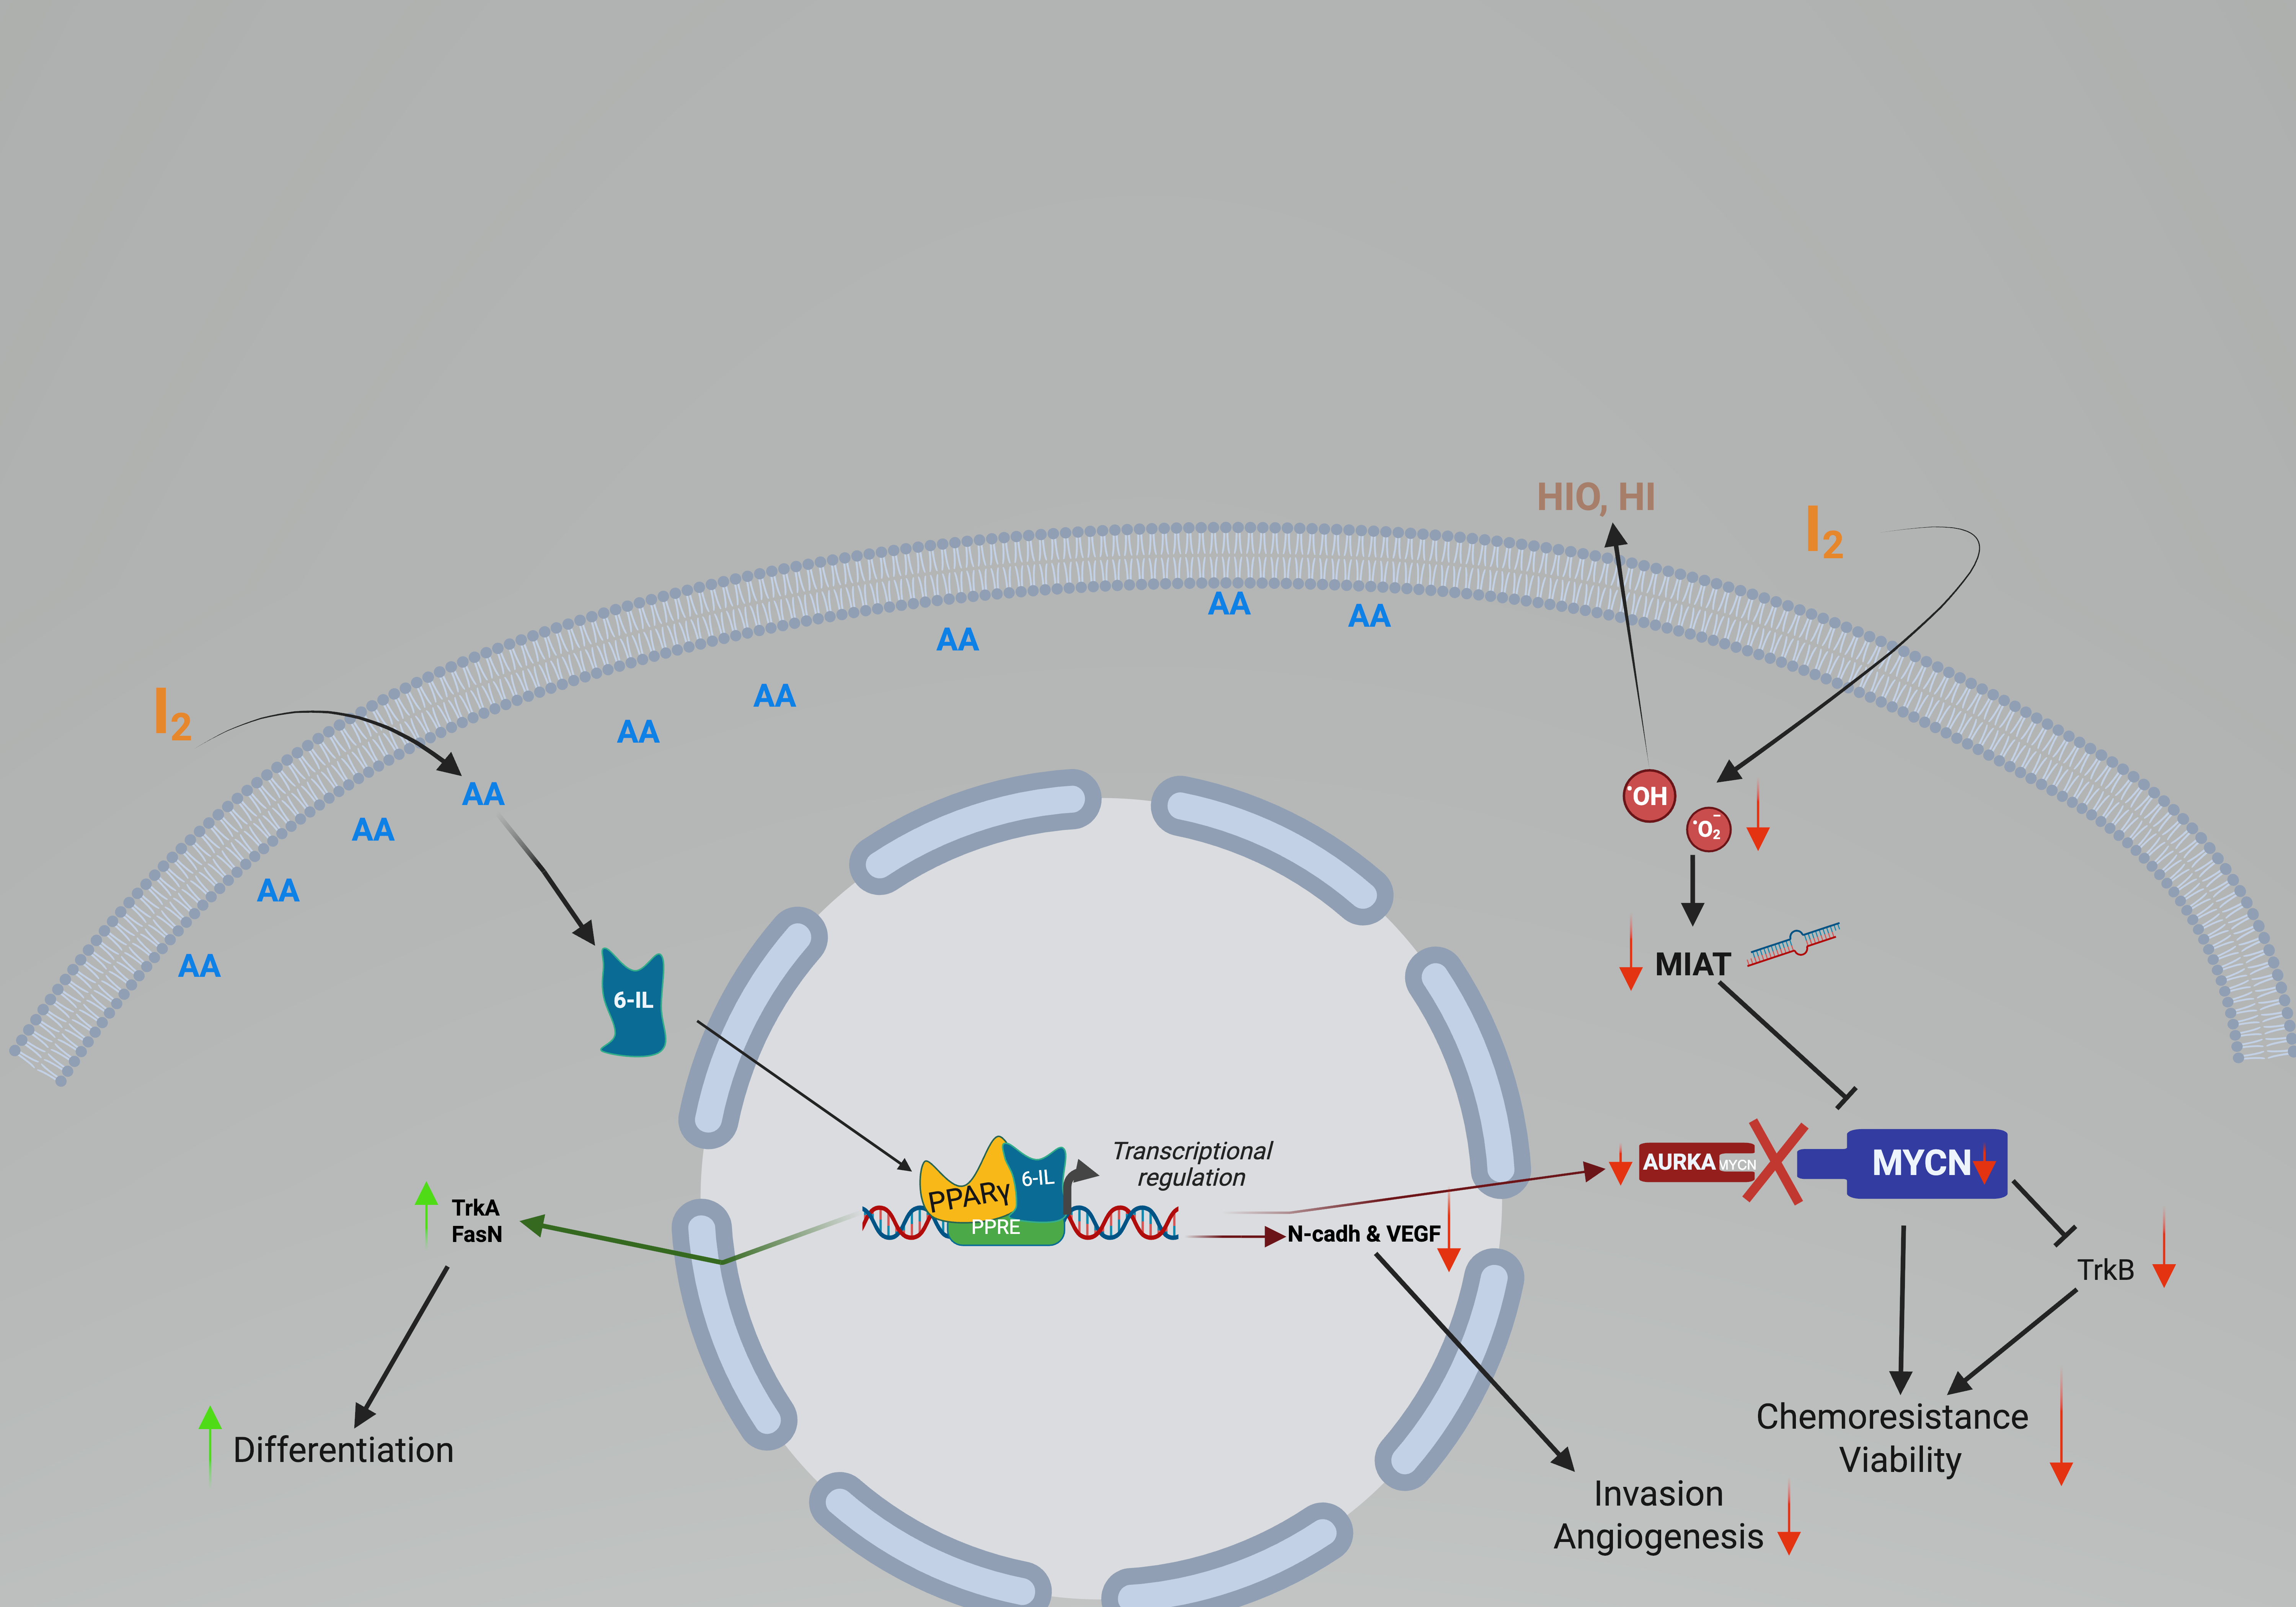
  • The antioxidant actions impair the sustained stem state (MYCN and TrkA), whereas PPARγ activation induces gene differentiation (FasN, TrkB), thereby impairing angiogenesis and invasion capacity in vitro (wound assay) and in zebrafish xenografts.

Abstract
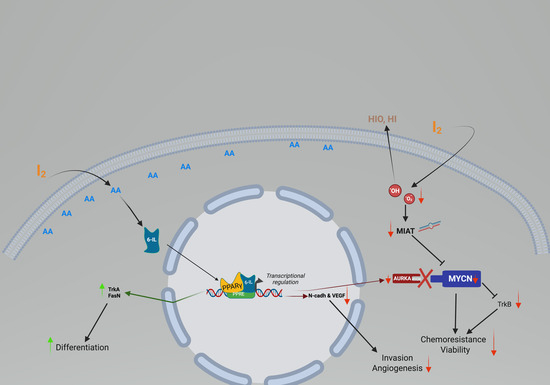
The study investigates the impact of molecular iodine (I2) supplementation on the viability, invasiveness, and angiogenic potential of high-risk neuroblastoma (NB). In vitro assays were performed using NB cell lines SK-N-AS (non-MYCN-amplified) and SK-N-BE(2) (MYCN-amplified). The role of peroxisome proliferator-activated receptor gamma (PPARγ) was evaluated using the antagonist GW9662, gene expression (RT-qPCR), and protein levels (Western blot). In vivo, zebrafish xenografts were used to evaluate tumor size, angiogenesis, and caudal cell dissemination. I2 supplementation significantly decreased cell viability in both cell lines, independent of PPARγ activation. In SK-N-BE(2), I2 impaired cell migration, as measured by a wound-healing assay, in apparent independence of PPARγ activation. However, gene expression indicates that I2 acts in complex ways, including direct antioxidant effects and PPARγ-mediated effects. The significant decrease in reactive oxygen species levels (DCFDA staining) and the silencing of the long noncoding RNA myocardial infarction-associated transcript (MIAT) by I2 were directly associated with decreased MYCN and TrkB expression. In contrast, PPARγ activation was accompanied by overexpression of FasN and TrkA and a significant decrease in Aurka, a MYCN-stabilizing protein. In zebrafish, I2-pretreated SK-N-BE(2) xenografts exhibited a clear reduction in angiogenesis (vascular density) and a decrease in invasive capacity. In conclusion, I2 supplementation decreases cell viability and attenuates invasion and angiogenesis in NB cells, highlighting its potential as an adjuvant to conventional therapy for high-risk NB.

Graphical Abstract

1. Introduction

Neuroblastoma (NB) is one of the most common extracranial solid tumors in children under five years of age. It is highly heterogeneous, with variable biological and clinical characteristics, ranging from low-risk tumors to highly invasive and chemoresistant tumors [1]. MYCN proto-oncogene (MYCN) belongs to the MYC gene family, which includes cellular MYC (C-MYC) and lung MYC. MYCN plays a key role in the development of neural-derived malignancies, including NB and medulloblastoma [2,3]. This gene is predominantly expressed in the peripheral neural crest during development and is vital for the proliferation, migration, and homeostasis of stem cells [4]. Low levels are associated with terminal neuronal differentiation, whereas persistent overexpression is linked to chemoresistance and invasion [5,6]. Approximately 50% of MYCN-amplified-NB patients have metastatic disease at the time of diagnosis, translating into poor prognosis and reduced survival [7,8,9]. MYCN regulates the expression of stemness-associated genes, such as octamer-binding transcription factor 4 and neurotrophic receptor tyrosine kinase 2 (NTRK2, TrkB). It also regulates angiogenesis by inducing vascular endothelial growth factor-A (VEGFA) [10,11]. Furthermore, researchers have proposed an association between the long noncoding RNA (lncRNA) myocardial infarction-associated transcript (MIAT) and MYCN amplification in NB [12]. MIAT silencing induces cell death only in cells with MYCN amplification, and aggressive NB exhibits MIAT overexpression [13]. The main trigger for MIAT expression is oxidative stress in the microenvironment [14]. In contrast, NB with a good prognosis is associated with the overexpression of differentiation factors, such as the neurotrophic receptor tyrosine kinase 1 (NTRK1, TrkA) and peroxisome proliferator-activated receptor gamma (PPARγ) [15,16]. Although PPARγ agonists have been shown to have clear inhibitory effects on virtually all NB cell types [17], their clinical use has been limited due to numerous adverse effects, such as hemodilution, peripheral edema, and a possible increased risk of congestive heart failure. These effects have been attributed to the ubiquitous presence of these receptors, so the search for adjuvant and organ-specific natural compounds remains of interest [18]. In this regard, molecular iodine (I2) is known to exert antiproliferative effects in cancer cells and synergize with the differentiating effect of all-trans retinoic acid in moderate-risk NB cell lines (SK-N-AS) and the apoptotic action of cyclophosphamide in high-risk NB cell lines (SK-N-BE(2)) [19,20]. I2 may exert its effects through multiple and complex mechanisms [21]. Antioxidant actions have been described, including the direct neutralization of reactive oxygen species (ROS) [22] and the release/activation of nuclear erythroid factor 2 (Nrf2), a master regulator of antioxidant genes [23]. I2 can also exert epigenetic effects by modulating methylases [24] and, ultimately, by regulating gene expression via activation of PPARγ [21]. In the latter, I2 reacts with arachidonic acid to form the lipid 6-iodolactone, a specific ligand for PPARγ receptors [25]. Arachidonic acid concentrations in cancer cells are approximately ten times higher than in non-cancer cells, making I2 a suitable candidate for therapeutic application in specific organs [26]. This work analyzes the effects of I2 supplementation on the viability, angiogenesis, and invasiveness of high-risk NB using in vitro and zebrafish xenograft models [27] and focuses on the role of PPARγ in these effects.

2. Materials and Methods

2.1. Reagents

Sublimated iodine was purchased from Macron-Avantor (Center Valley, PA, USA), and its concentration was verified by titration with sodium thiosulfate. GW9662 (GW), a PPARγ-specific antagonist, was purchased from Sigma-Aldrich (St. Louis, MO, USA), and Rosiglitazone (RGZ), an agonist, from Cayman Chemicals (Los Angeles, CA, USA). Fast DiI™ oil red dye (DiI) (Cat. No. D3899) was obtained from Thermo-Fisher Scientific (Waltman, MA, USA). N-phenylthiourea (PTU) (Cat. No. P7629-10G) and ethyl 3-aminobenzoate methanesulfonate salt (Cat. No. A5040-25G) were obtained from Sigma-Aldrich (St. Louis, MO, USA). H2DCFDA (HY-D0940) was obtained from MedChemExpress (Monmouth Junction, NJ, USA). Hydrogen peroxide (Cat. No 56001) was obtained from Fermont (Monterrey, NL, Mexico).

2.2. Cell Culture

Human NB cell lines SK-N-AS (CRL-2137) and SK-N-BE(2) (CRL-2271) were purchased from the American Type Culture Collection (Manassas, VA, USA). The media were supplemented with fetal bovine serum (FBS, 10%) and penicillin–streptomycin (2%) from Invitrogen (Carlsbad, CA, USA) in a humidified chamber with a 5% CO2 atmosphere and 95% air at 37 °C. For zebrafish experiments, the SK-N-BE(2) cells were labeled with 4 µg/mL DiI one day before the experiments were performed, following the manufacturer’s instructions.

2.3. Cell Viability

A total of 50,000 cells/well were seeded on 24-well plates. After 24 h, 400 µM I2 was added for 96 h. In the GW/I2 (0.5 µM) and GW/RGZ (0.1 µM) groups, GW was administered 2 h before I2 or RGZ treatment. After treatment, viability was measured using a trypan blue exclusion test on a hemocytometer and light microscopy; results were reported as a fold change relative to the control. All experiments were carried out in triplicate.

2.4. Gene Expression

PPARγ, MYCN, MIAT, VEGFA, TrkA, TrkB, N-cadherin, Vimentin, Aurora kinase A (Aurka), fatty acid synthase (FasN), and β-actin were analyzed by RT-qPCR in SK-N-BE(2) cells. Briefly, total RNA was isolated using Trizol reagent (Life Technologies, Inc., Carlsbad, CA, USA). RNA (2 µg) was reverse transcribed (RT) using oligo-deoxythymidine (Invitrogen, Waltham, MA, USA). Real-time PCR was performed on the Rotor-Gene 3000 sequence detector system (Corbett Research, Mortlake, NSW, Australia) using SYBR Green as a DNA amplification marker (gene-specific primers are listed in Table 1). Relative mRNA levels were normalized to the mRNA level of β-actin.

2.5. Antioxidant Assay

A total of 5000 cells per well were seeded into 96-well plates. GW was administered 2 h before supplementation with 400 µM I2 in the respective groups, and cells were cultured for 96 h. ROS levels were quantified using H2DCFDA (DCFDA) staining according to the manufacturer’s protocol. DCFDA (5 µM) was added to the culture plate and incubated for 30 min at 37 °C in the dark. Hydrogen peroxide (100 µM) was used as a positive control. Fluorescence intensity was measured using a Varioskan LUX Multimode Microplate Reader (Thermo-Fisher Scientific, Waltman, MA, USA). Data were expressed as maximum DCFDA fluorescence levels relative to control cells.

2.6. Wound Healing Assay

A total of 100,000 cells were seeded into 12-well plates and cultured under standard conditions until they reached 80% confluence. A wound was then created in each well via a 200 µL pipette tip, and the wells were washed with phosphate-buffered saline to remove any detached cells. The medium was replaced with fresh medium supplemented with 5% FBS, and the corresponding treatment was added to each well. Photographs were taken at 0 and 24 h post-wounding. The open wound area was analyzed using ImageJ 1.54 (NIH, Bethesda, MD, USA).

2.7. Western Blot

Western blot analysis of MYCN and PPARγ proteins in NB cell lines was performed using chemiluminescence. Briefly, 25 μg of protein per lane were separated by electrophoresis in 12% acrylamide gel, and proteins were later transferred to a nitrocellulose membrane (Bio-Rad, Hercules, CA, USA). The unspecified reaction was blocked for 2 h with Tris-buffered saline with Tween-20 containing 5% skimmed milk powder. The membranes were treated with polyclonal antibodies against MYCN (B8.4.B) (sc-53993, Santa Cruz Biotechnology, Los Angeles, CA, USA) and PPARγ (SAB5700625; Sigma-Aldrich, St. Louis, MO, USA). As a secondary antibody, goat anti-mouse-HRP (62-6520) and goat anti-rabbit-HRP (65-6120) (Invitrogen, Waltham, MA, USA) were used. Proteins were visualized using chemiluminescent detection with the Clarity Western ECL substrate (Bio-Rad). The blots were visualized and imaged using Image LabTM (Bio-Rad).

2.8. Zebrafish Xenograft Model

Wild-type (WT) zebrafish embryos were maintained at 28 °C in E3 embryo medium containing, per liter: 0.286 g NaCl, 0.0126 g KCl, 0.048 g CaCl2·2H2O, and 0.081 g MgSO4·7H2O (pH 7.2), supplemented with 0.2 mM PTU. Cells were labeled as previously described [28]. DiI-labeled SK-N-BE(2) cells were injected into the perivitelline space of two-day-old zebrafish larvae. Larvae were incubated at 28 °C in E3/PTU medium, and cancer cell dissemination to the caudal vein plexus was analyzed after three days. Larvae were photographed under a Nikon (Tokyo, Japan) light/fluorescence microscope (10×/0.30 magnification). For the tumor angiogenesis experiment, DiI-labeled cells were injected into the perivitelline space of two-day-old transgenic Tg(Fli1:EFGP)y1 zebrafish larvae expressing the green EGFP protein in vascular endothelial cells with 80% ECM gel as previously described [28]. Larvae were incubated at 28 °C in E3/PTU medium for 72 h, fixed overnight in 4% paraformaldehyde, and mounted with an antifade reagent containing DAPI. All experiments were performed using larvae obtained from at least three independent zebrafish clutches. Z-stack images of primary tumors and intratumoral vessels were acquired using an upright confocal microscope from THOR LABS (Newton, NJ, USA). The percentage of intratumoral angiogenesis was quantified using ImageJ 1.54 (NIH, Bethesda, MD, USA).

3. Results

3.1. Participation of PPARγ in Cell Viability

Figure 1 summarizes the viability of NB cells at several concentrations of I2 supplementation and the involvement of PPARγ. Both cell lines are sensitive to I2, and although the IC50 values are similar (380 and 368 µM), the SK-N-BE(2) cell line is more sensitive, showing inhibition within 48 h. PPARγ participation was analyzed using the agonist RGZ and the antagonist GW. Both cell lines exhibited decreased viability upon PPARγ activation with RGZ, and the presence of GW reversed this effect. Conversely, although I2 supplementation exerted a similar decrease, GW did not cancel or reverse it, suggesting that this inhibition is independent of PPARγ.

3.2. Antioxidant Effect and Molecular Response

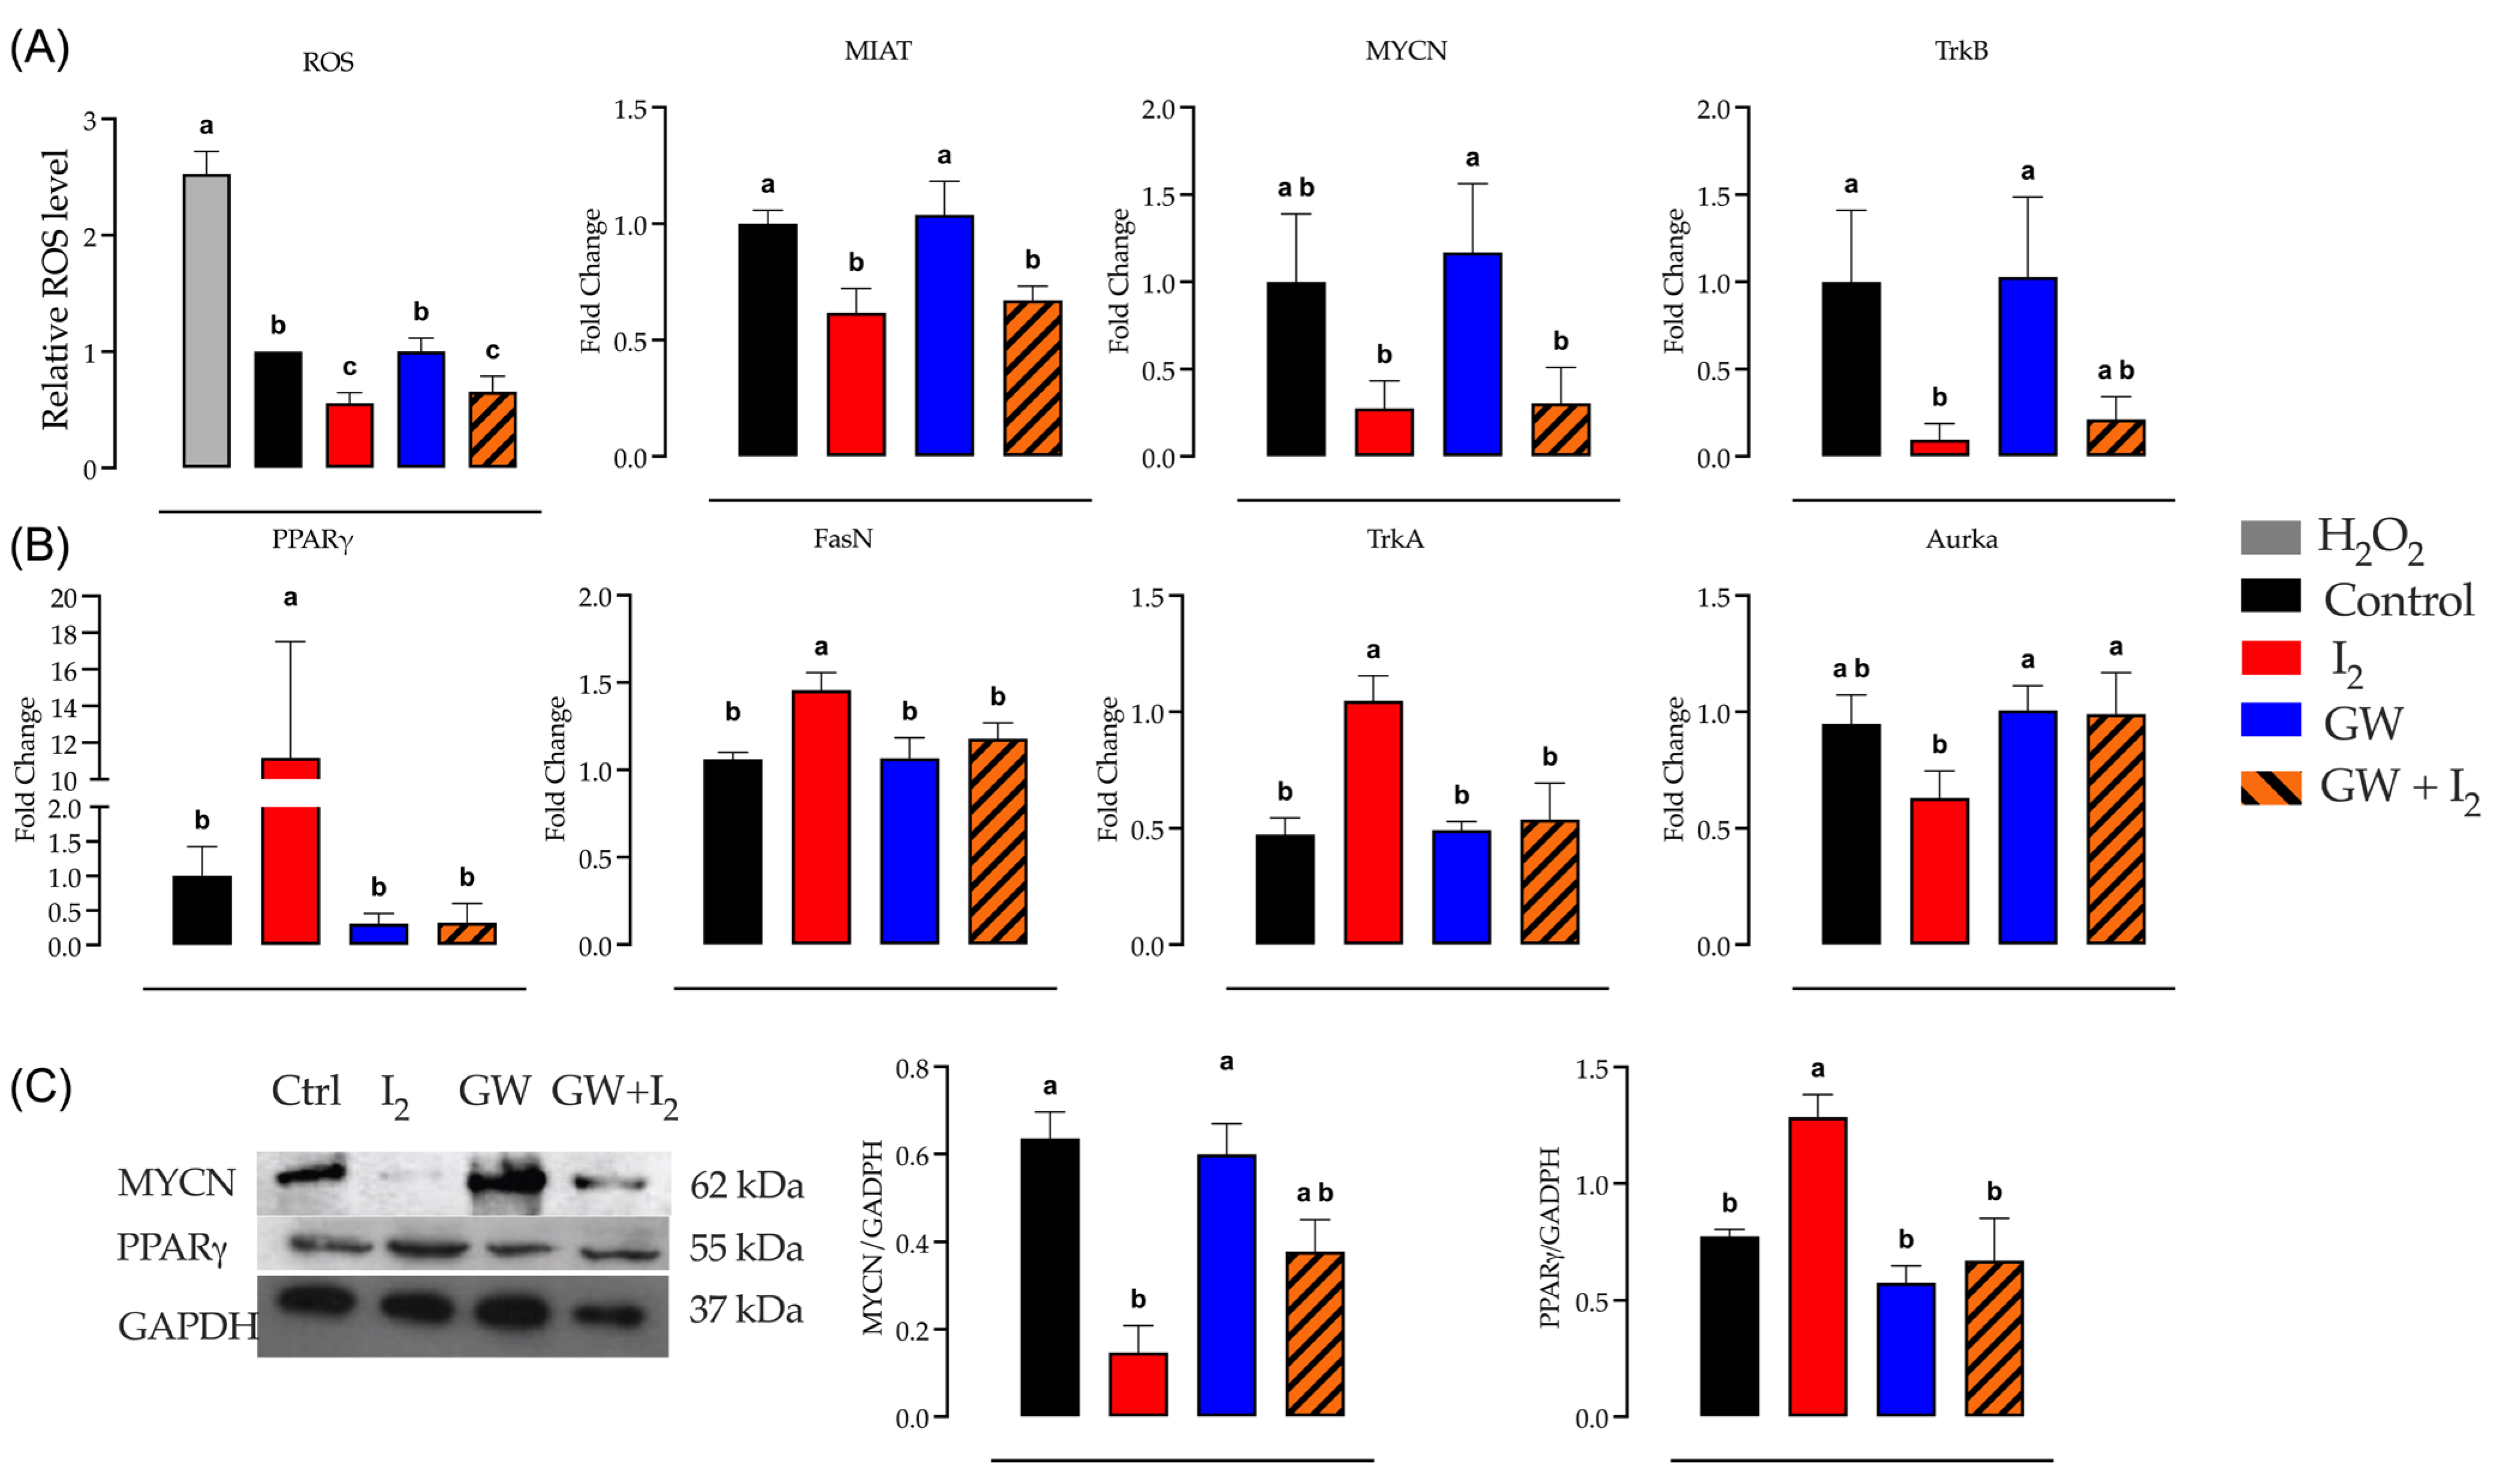
To analyze PPARγ’s role in molecular responses to I2, genes associated with oxidative status or directly regulated by PPARγ were examined. Figure 2 summarizes the antioxidant effect and the expression of different messengers in response to the I2 supplementation alone or in the presence of the PPARγ antagonist GW. Panel A shows lower ROS levels and inhibition of gene expression associated with oxidative stress (MIAT), proliferation, and chemoresistance (MYCN and TrkB) in the I2-supplemented groups (I2 and GW + I2). GW did not counteract these responses. Panel B shows overexpression of genes related to differentiation, such as PPARγ, FasN, and TrkA, and decreased expression of Aurka, which encodes Aurora kinase A and is involved in MYCN stabilization. The presence of GW abolished all these responses. Panel C corroborates that I2 increases PPARγ protein levels and diminishes MYCN (Western blot).

3.3. Invasion Responses

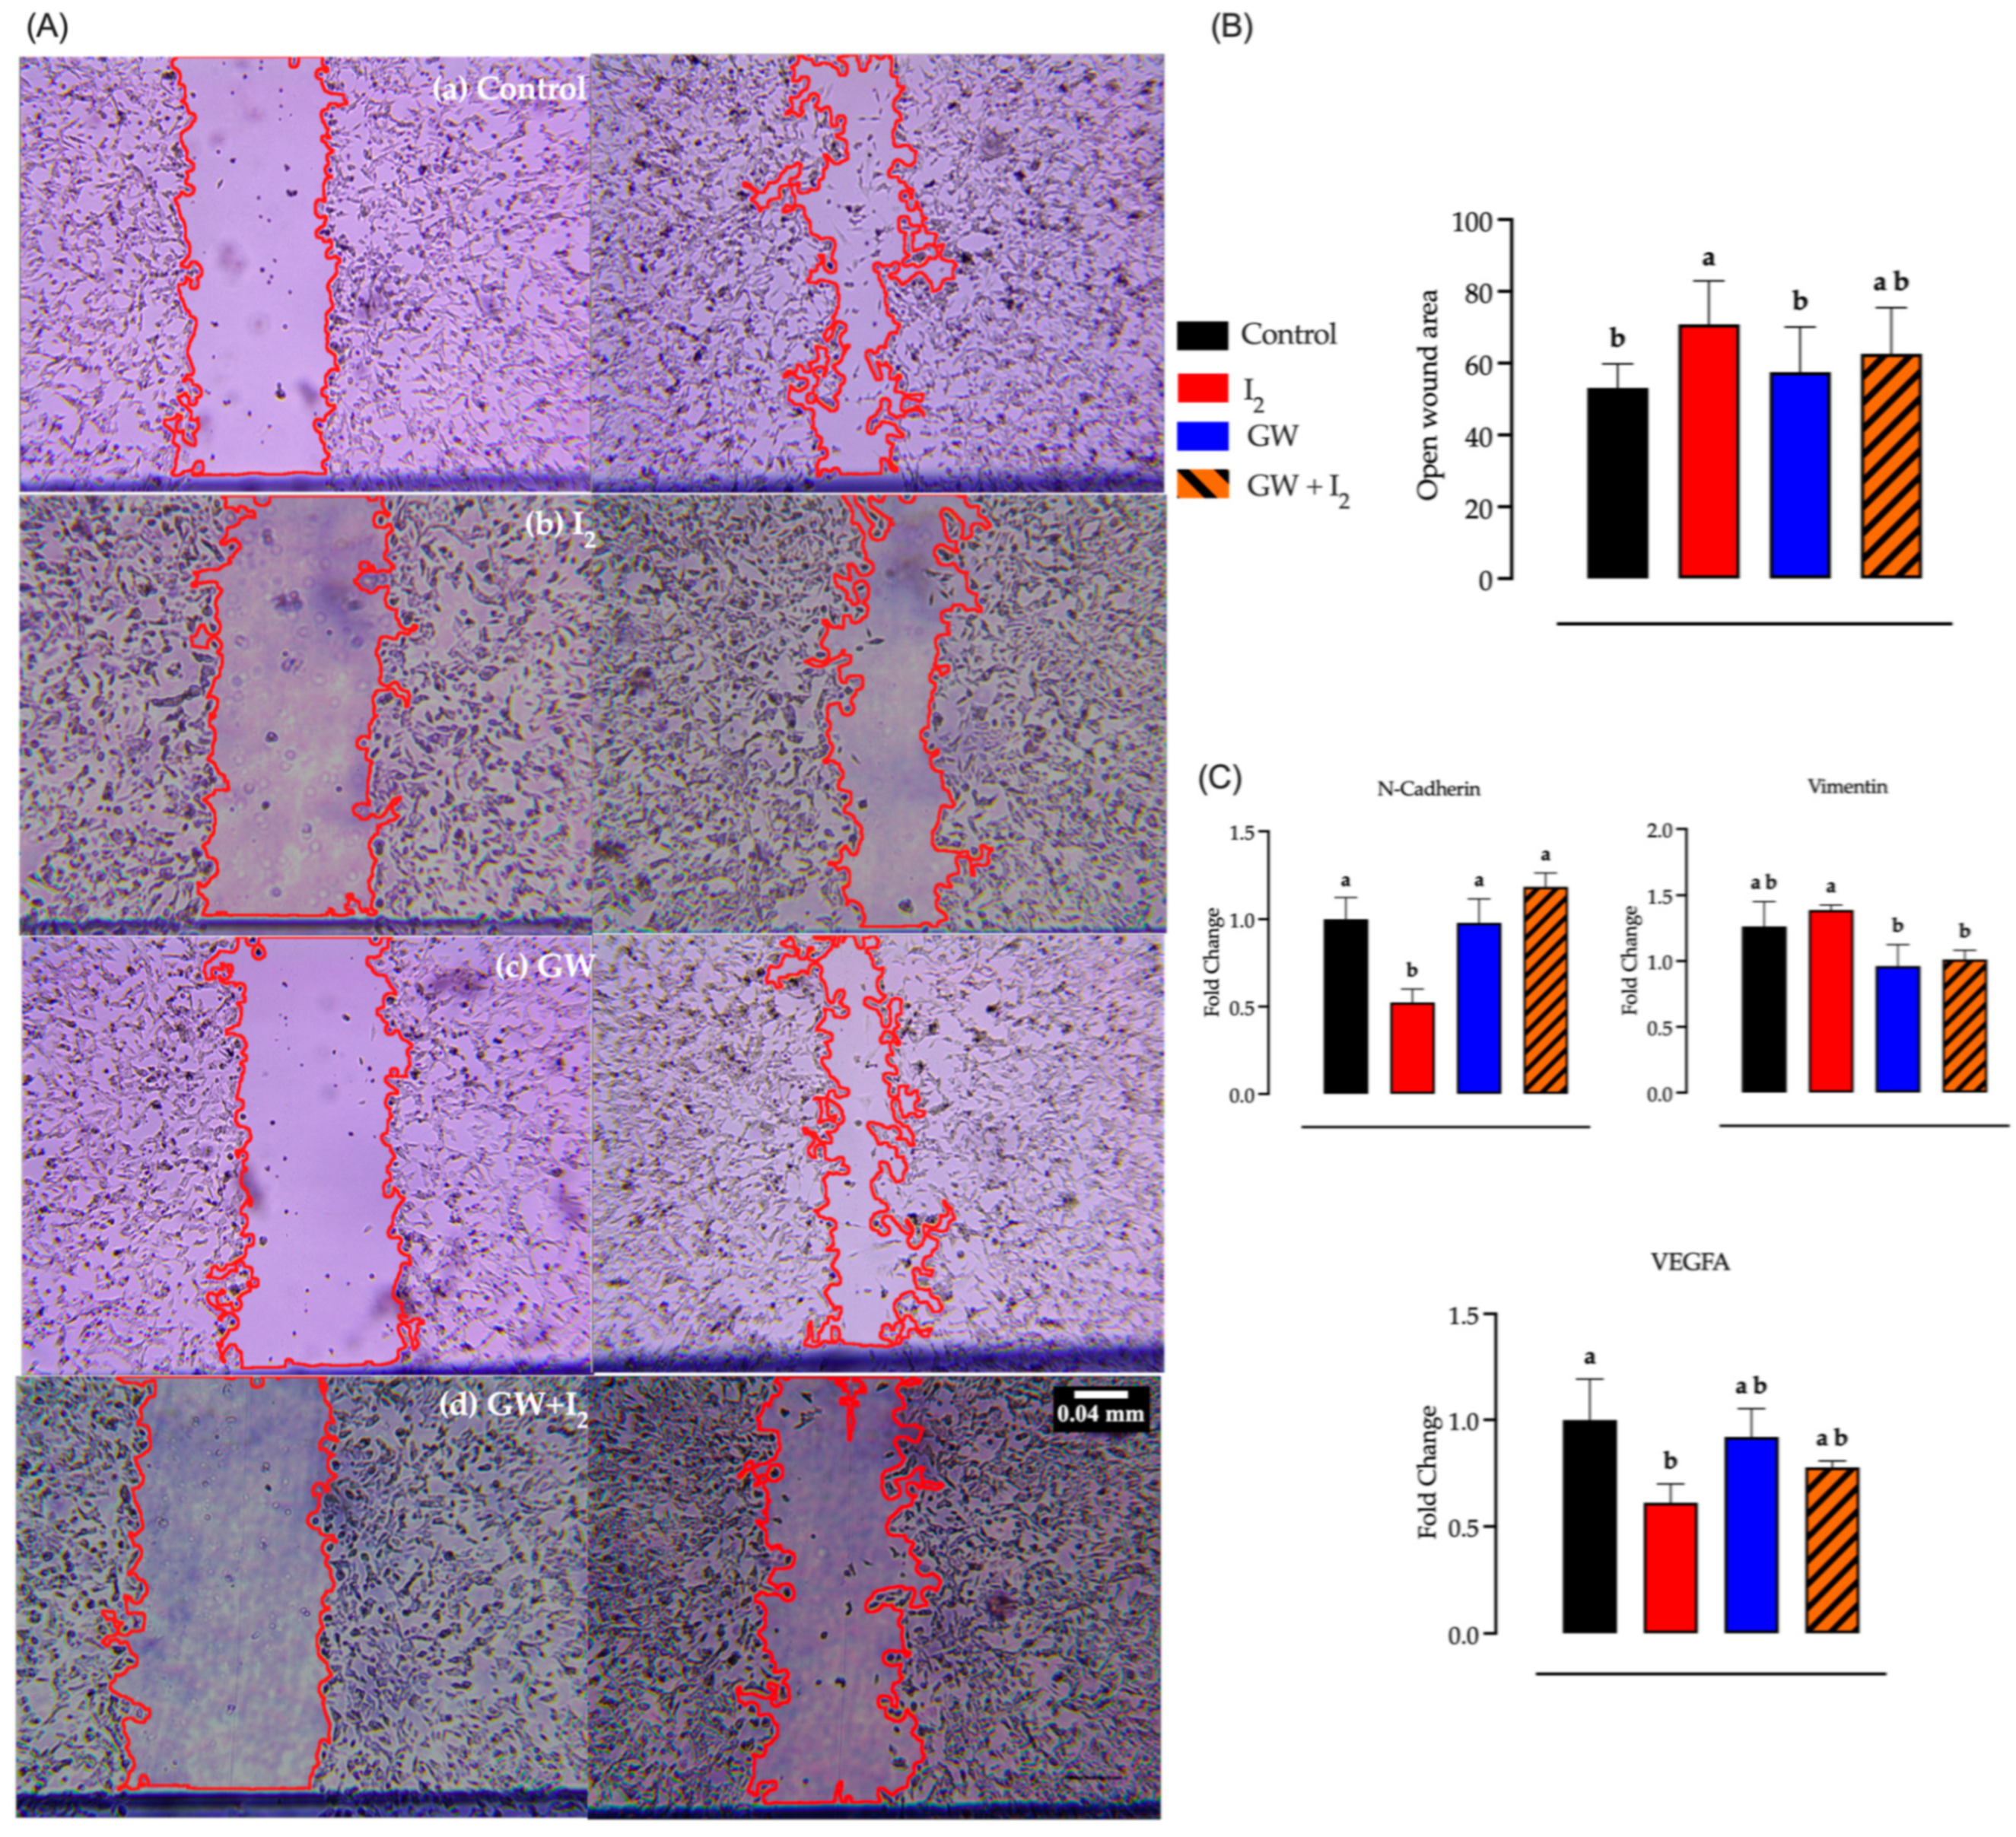
To assess the effect of I2 on migration in vitro, we performed a wound healing assay. Wound healing was measured at 24 h post-treatment (Figure 3B), revealing that I2 reduces cell migration. This effect appears to be partially mediated by PPARγ, since the presence of GW + I2 does not completely inhibit wound closure. Figure 3B shows the inhibitory effect of I2 on genes associated with invasion, such as N-cadherin and VEGFA.

3.4. In Vivo Responses

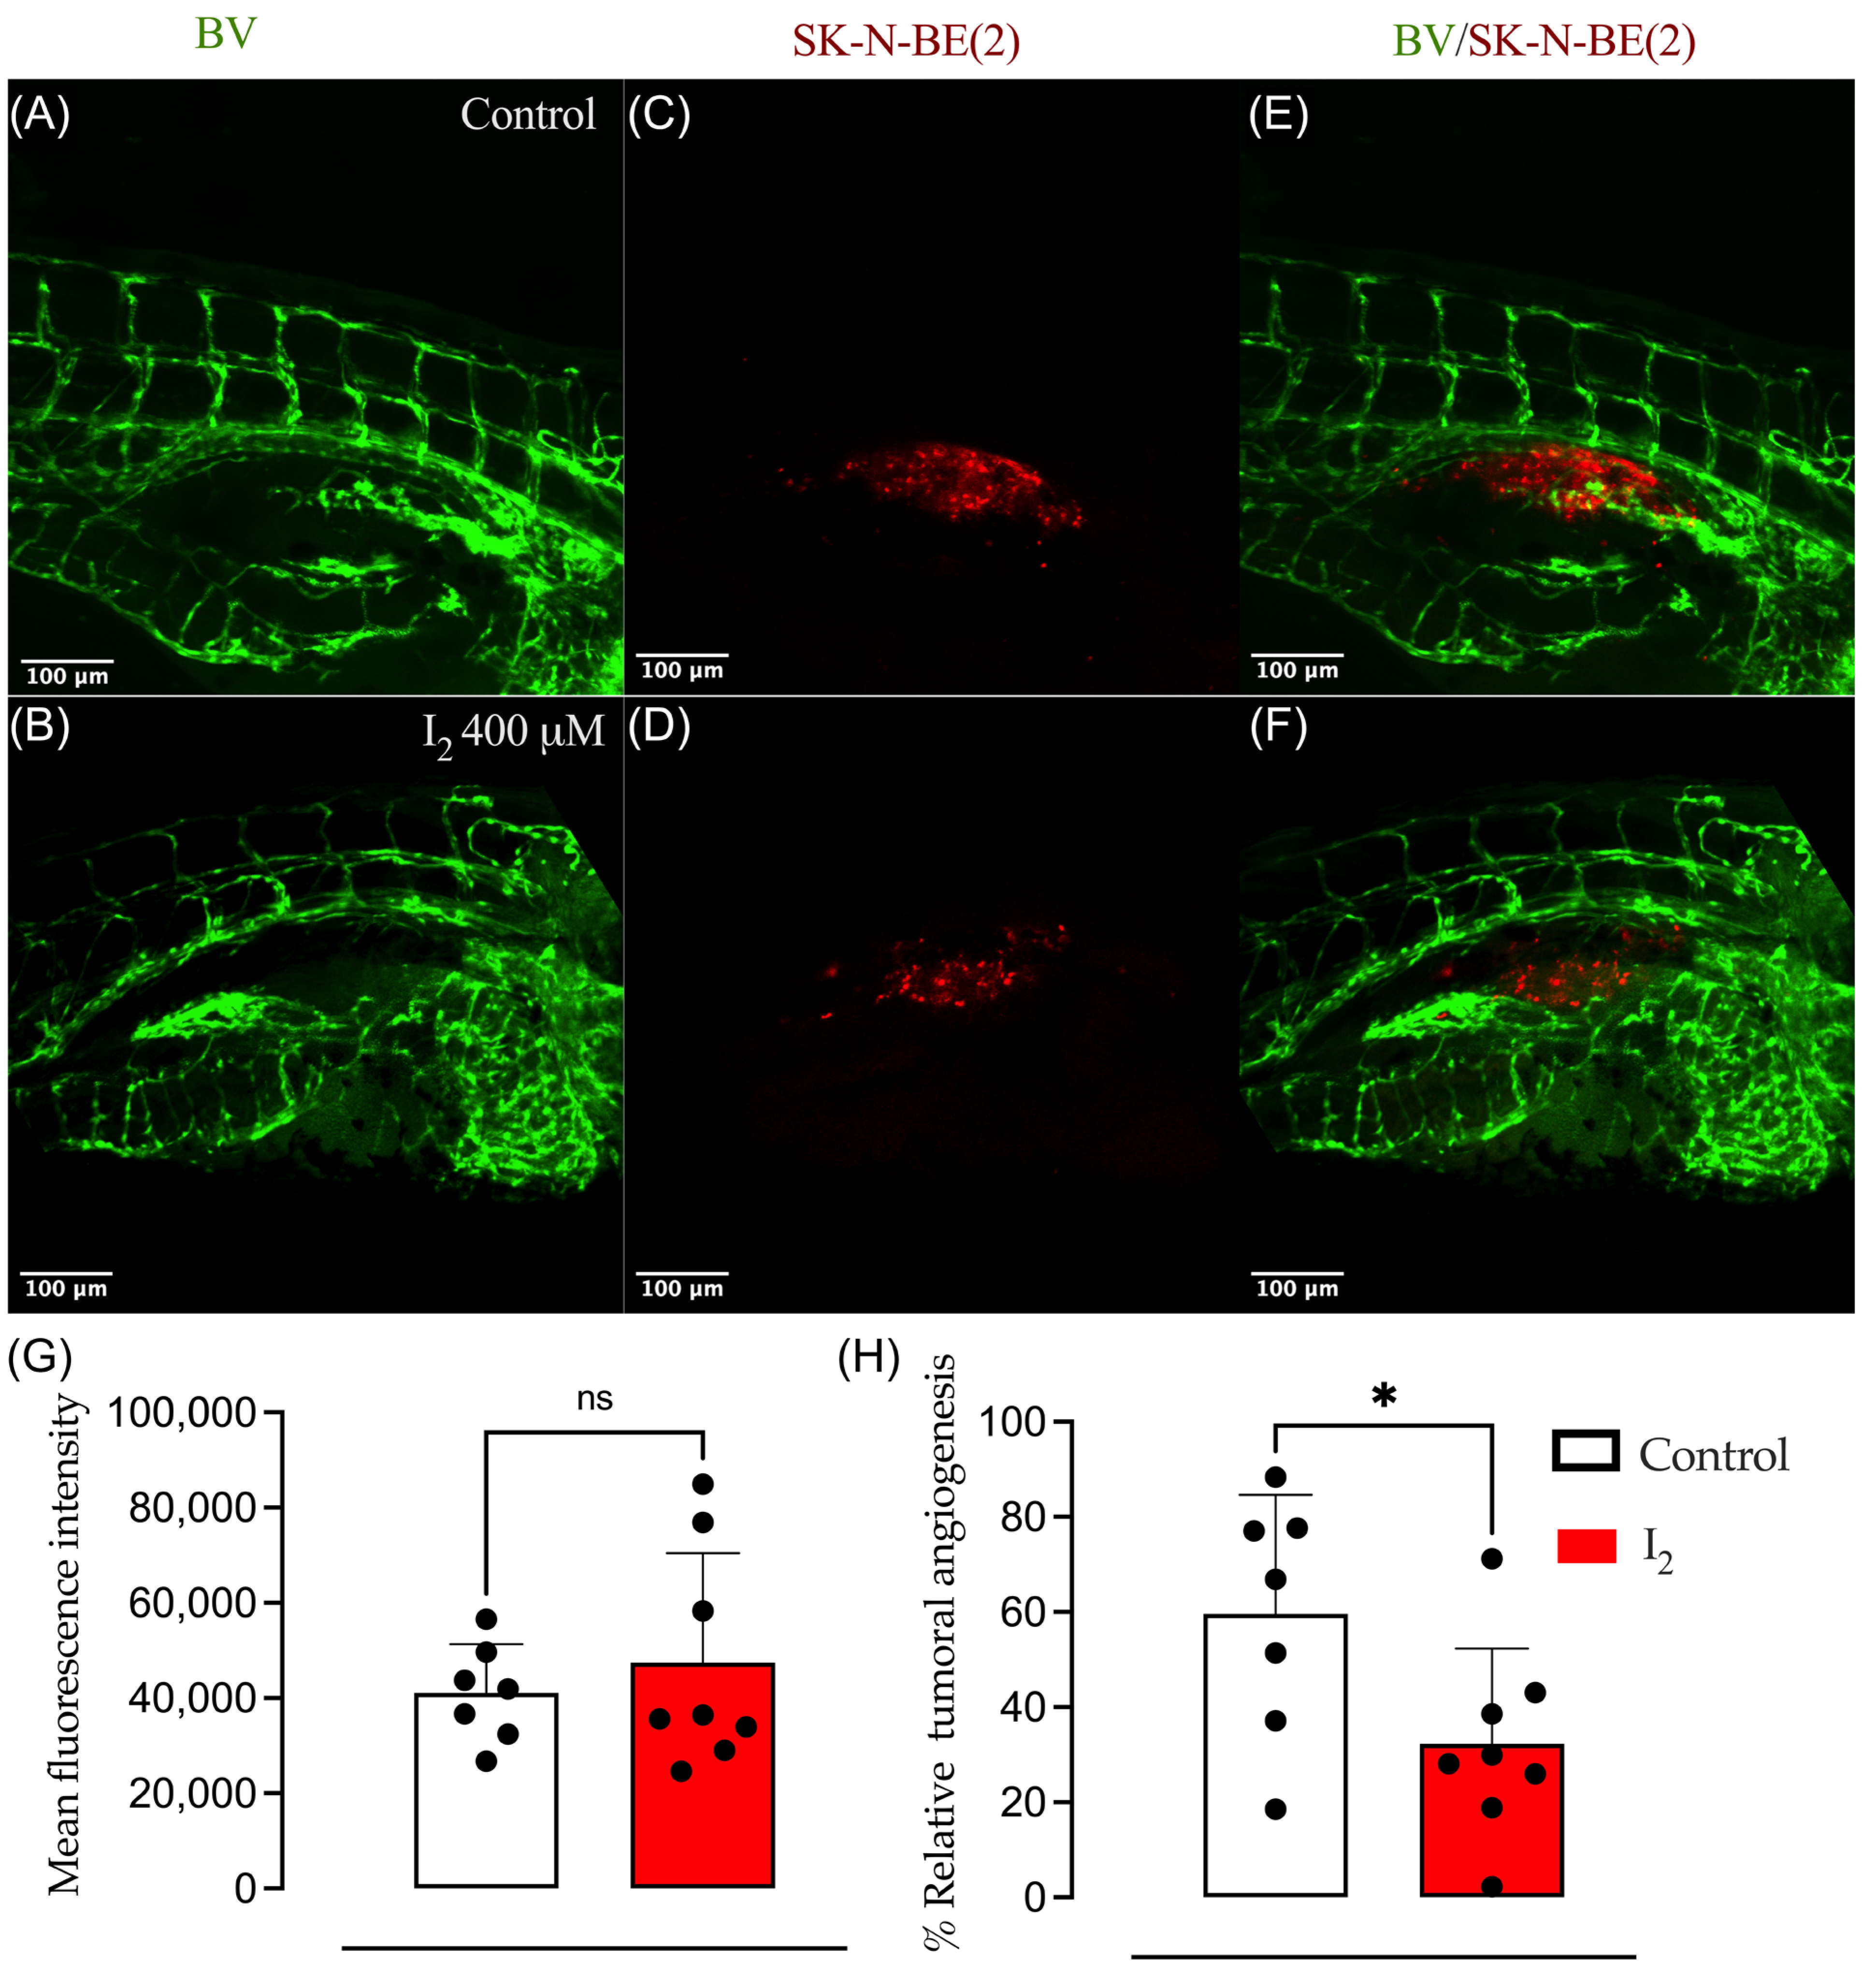
To assess the tumor implantation and angiogenic capacity of normal or I2-pretreated SK-N-BE(2) cells, xenografts were generated in Tg (Fli1:EFGP)y1 zebrafish larvae at 48 h postfertilization. The larvae exhibited green, fluorescent blood vessels. Cells were grown under standard conditions or supplemented with 400 µM I2 for 96 h. Between four hundred and six hundred DiI-label cells (red) were injected into each larva. The results showed that both populations formed xenografts with similar growth (as measured by densitometry), but the I2-pretreated cells exhibited a significant decrease in tumoral angiogenesis (Figure 4).
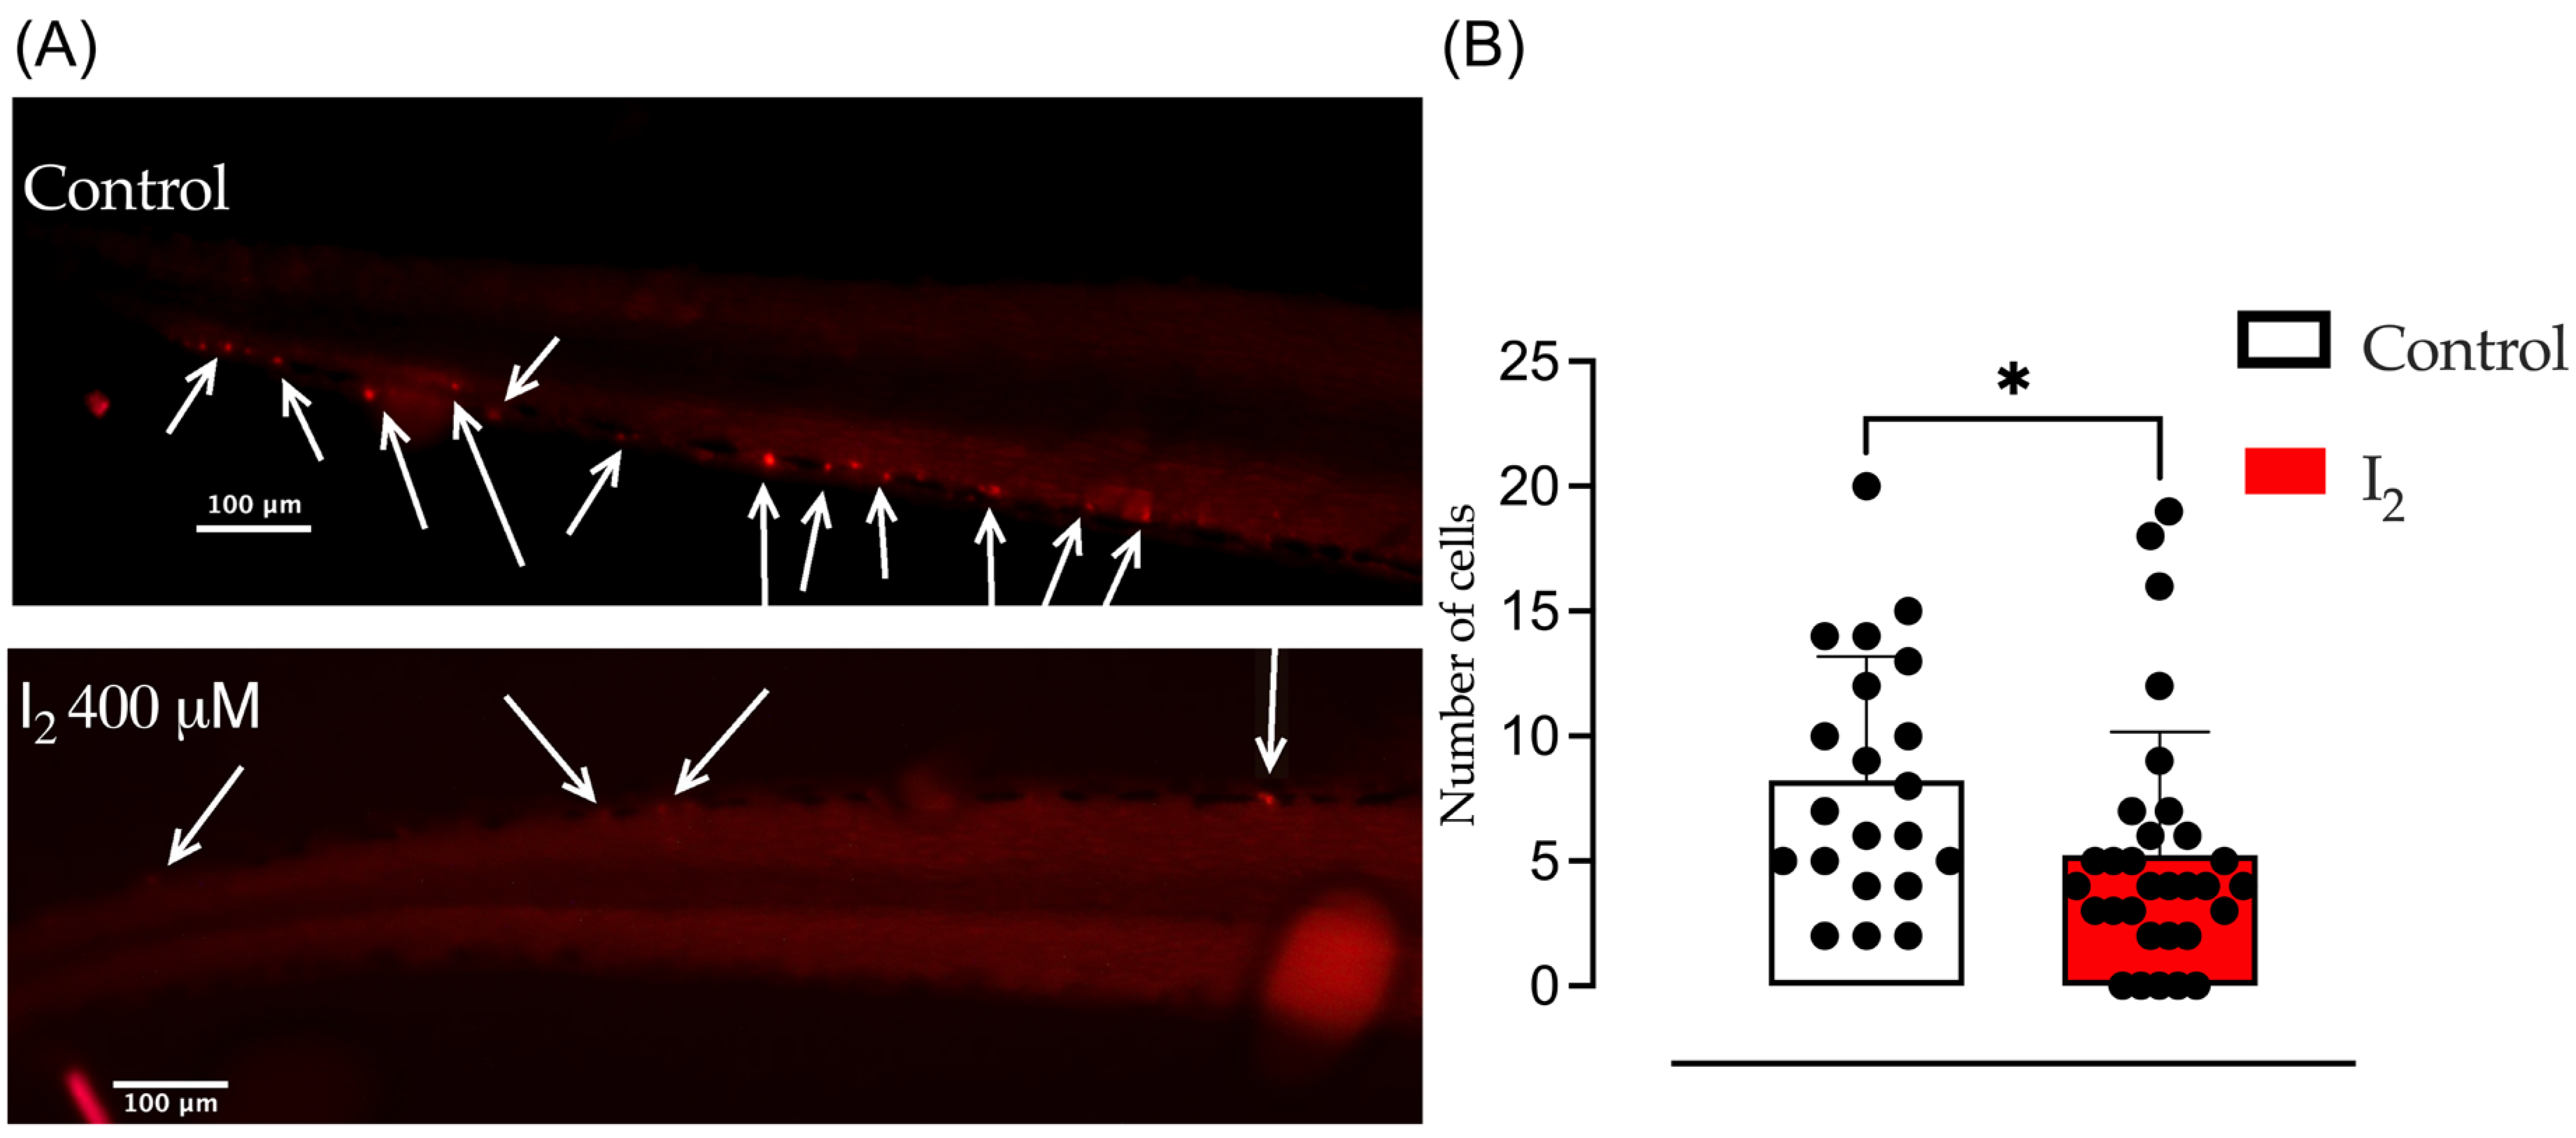
To analyze invasion capacity in vivo, standard and I2-pretreated SK-N-BE(2) cells were subcutaneously implanted into two-day-old wild-type zebrafish embryos. In Figure 5, a distinct presence of red DiI-labeled cells is evident in the caudal region in both groups (fluorescence microscopy). The results corroborated the invasive capacity of these NB cells, and the quantification shows a significant decrease in cell number in the I2-pretreated group.

4. Discussion

Studies suggest that PPARγ agonists can promote differentiation and inhibit NB cell growth, highlighting their therapeutic potential [16]. All NB cell lines express PPARγ, with higher expression levels observed in differentiated cells, suggesting an active role for PPARγ in NB cell differentiation [17]. In a 2004 study, Servidei and colleagues evaluated two PPARγ agonists (15-deoxy-PGJ2 and RGZ) in eight NB cell lines with different phenotypes, including N-type (neuroblastic) and S-type (stromal) cells. Both ligands inhibited cell growth across all lines, with N-type cells exhibiting greater susceptibility, likely due to increased sensitivity to apoptosis [29]. Our results revealed that I2 reduced the viability of both SK-N-AS (stromal) and SK-N-BE(2) (neuroblastic) cells, confirming the high sensitivity of N-type cells.
MYCN overexpression has been linked to a more aggressive NB and poor prognosis [2,30]. Previous work from our group demonstrated that I2 reduces MYCN expression and increases PPARγ expression in NB xenografts in mice [20]. These findings align with our in vitro results, where I2 downregulated MYCN and upregulated PPARγ. To explore the roles of PPARγ in the effects of I2, we used the PPARγ antagonist GW. Interestingly, I2 consistently downregulated MYCN and TrkB, genes associated with aggressive NB, even after PPARγ inhibition with GW, suggesting that I2 partially acts through a PPARγ-independent pathway.
To elucidate the possible mechanism by which I2 negatively regulates MYCN, we evaluated its antioxidant effect. DCFDA analyses show that I2-supplemented groups exhibit lower ROS levels, and GW does not modify this effect. These results agree with previous reports showing that with micromolar iodine concentrations, there is a decrease in ROS-induced damage in rabbits and humans [31,32] and a prevention of lipid peroxidation in various normal and cancerous vertebrate tissues [21,33]. Physiological levels of ROS regulate signal transduction, gene expression, and proliferation. However, shifts from physiological to pathophysiological levels are known as oxidative stress. Oxidative stress damages lipids, proteins, and nuclear and mitochondrial DNA and is involved in epigenetic modifications that contribute to carcinogenesis. Epigenetic modifications include methylases, demethylases, and non-coding RNAs [34]. MIAT is an lncRNA originally identified in patients with myocardial infarction and is overexpressed in response to oxidative stress across various normal and cancerous tissues, including NB [14]. Aggressive NB exhibits MIAT overexpression, and its silencing induces cell death only in cells with MYCN amplification [13]. In this work, we demonstrate that I2 supplementation significantly reduced both ROS levels and MIAT expression, which are associated with the decreases in MYCN and TrkB expression. As we mentioned before, MYCN is a master gene vital for stem cell proliferation, migration, and homeostasis that, under normal conditions, decreases during terminal neuronal differentiation, but its persistent overexpression is linked to chemoresistance and invasion [6]. Moreover, MYCN directly regulates TrkB overexpression, which is associated with a poor prognosis and chemoresistance [3].
Regarding genes associated with PPARγ, our results show that I2 supplementation significantly increased PPARγ RNA and protein levels, as well as FasN and TrkA expression, indicating that I2 promotes cell differentiation [15]. Fatty acid synthase is an enzyme encoded by the FasN gene. Its main function is to catalyze fatty acid synthesis, and although it can act as a protumoral agent in some contexts, it can also participate in the differentiation process [35]. Since PPARγ directly regulates FasN expression, this corroborates the idea that I2 activates these receptors [36].
With respect to Trks, both TrkA and TrkB are part of the receptor tyrosine kinase family and are critically involved in the regulation of neuronal development [3]. TrkA expression is significantly lower in aggressive NB, and it is inversely associated with MYCN amplification [37]. Elevated TrkA expression has been reported in patients with spontaneously regressed stage IV-S NB and in those with well-differentiated NB [38,39]. Furthermore, TrkA interacted with PPARγ during PC12 cell differentiation, leading to mutual activation [40].
Another gene of interest was Aurka. Aurka encodes Aurora serine-threonine kinase A, which is vital in centrosome maturation and segregation, spindle assembly, and cell cycle regulation [41]. The importance of Aurka as a therapeutic target in NB stems from its dual functions: catalytic activities during mitosis and kinase-independent functions, particularly MYCN protein stabilization [42]. Elevated Aurka expression has been associated with poor overall survival, and Aurka-targeted therapy inhibited cell growth, reduced MYC protein levels, and inhibited tumor growth in a murine xenograft model [43]. Moreover, Aurka expression is dependent on PPARγ activation [44]. Our results show that I2 supplementation decreases its expression and corroborate the dependence on PPARγ (canceled by GW). In addition, the very low MYCN protein content (Western blot) observed in our I2 samples was consistent with Aurka’s crucial function in MYCN protein stability [42].
Analysis of the invasive capacity of SK-N-BE(2) cells in vitro using the wound healing assay revealed that I2-pretreated cells exhibit reduced motility. This effect appears to be partially mediated by PPARγ activation. Interestingly, this partial regulation is corroborated by the complete involvement of PPARγ in N-Cadherin expression, whereas VEGFA expression appears to be only partially dependent on this pathway. Cadherins constitute a large superfamily of adhesion molecules comprising more than 80 members, among which epithelial (E) and neuronal (N) cadherins are the most extensively studied. E-Cadherin is predominantly expressed in epithelial cells, promoting cell–cell adhesion, whereas N-Cadherin is mainly expressed in neuronal tissues and fibroblasts. N-Cadherin plays a critical role in neural crest cell migration during early embryonic development. In neural malignancies, metastasis progression is often associated with the loss of E-Cadherin and the de novo expression of N-Cadherin, a phenomenon known as the “cadherin switch,” which contributes to the establishment of epithelial–mesenchymal transition (EMT) [45]. Although the role of PPARγ in N-Cadherin expression in NB remains largely unexplored, PPARγ-mediated inhibition of TGF-β1-induced EMT has been reported in several cancer types [46]. Regarding VEGFA, our findings are consistent with the well-established direct involvement of MYCN in VEGFA overexpression in both normal and tumor tissues [47].
Finally, using the zebrafish xenograft model, we evaluated the angiogenic and invasive potential (caudal migration) of the I2-preselected cells in vivo relative to control cells. Both groups displayed comparable implantation rates; however, I2-pretreated cells exhibited a reduced capacity to induce intratumoral angiogenesis (50%) and decreased caudal migration (38%), indicative of lower invasive potential. We are aware that a potential temperature-related limitation of the zebrafish xenograft model is the temperature mismatch between the fish host and mammalian tumor cells, as human cells are maintained at 28 °C rather than their physiological temperature. Nevertheless, the zebrafish model is widely accepted and validated for studies of metastasis and cancer pharmacology [48]. Mammalian cancer cells typically display optimal proliferative activity at 37 °C, and at lower temperatures (e.g., 28 °C), they decrease their proliferative capacity, although their angiogenic and metastatic/invasive potential does not appear to be significantly altered [49,50]. On the other hand, the optimum temperature for fish development is around 26–28 °C. Increasing the temperature above 30 °C causes stress in the organisms, accompanied by metabolic dysfunctions and significant malformations [51]. To address this limitation, many studies prioritize maintaining physiological conditions for the host organism while assessing tumor-cell behaviors, such as angiogenesis and short-term invasion (48–72 h) [52]. In our study, we used a temperature of 28 °C to prioritize fish welfare. Therefore, the reduced angiogenic and invasion capacities observed in I2-pretreated cells are more likely attributable to the treatment itself than to differences in the host microenvironment. Furthermore, the concordant inhibitory effects observed in both the in vitro wound assay (37 °C) and the caudal migration (28 °C) support the notion that the anti-invasive effects of I2 are maintained across these temperature conditions.

5. Conclusions

Molecular iodine induces gene remodeling that decreases the proliferative and invasive potential of moderate- and high-risk NB cells through direct antioxidant effects and PPARγ-dependent pathways. This consistent beneficial effect supports the use of I2 supplementation as an adjuvant to conventional NB therapies.

Supplementary Materials

The following supporting information can be downloaded at: https://www.mdpi.com/article/10.3390/cells15131189/s1.

Author Contributions

E.R.J.-A. and C.A.: study conceptualization and design. E.R.J.-A., G.O.-O. and H.L.: Maintenance and management of zebrafish and data analysis. C.A. and B.A.: Statistical analysis. E.R.J.-A. and E.D.-G.: data generation, data analysis, supervision, and correction. C.A. and B.A.: funding acquisition. All authors have read and agreed to the published version of the manuscript.

Funding

This research was partially funded by PAPIIT-UNAM 202322, 21727223, and 203425. Edgar R. Juvera-Avalos is a doctoral student in the Programa de Doctorado en Ciencias Biomédicas, Universidad Nacional Autónoma de Mexico (UNAM), and has received a fellowship 862245 from Secretaria de Ciencias, Humanidades, Tecnología e Innovación (SECIHTI, formerly CONAHCYT).

Institutional Review Board Statement

The protocol was evaluated and approved by the INB Research Ethics Committee under number 124.A on 12 October 2020 and complied with the Official Mexican Standard of the Ministry of Agriculture, Livestock, Rural Development, Fisheries and Food (SAGARPA), code NOM-062-ZOO-1999, and with the Animal Care and Use Program (National Institutes of Health, USA).

Informed Consent Statement

Not applicable.

Data Availability Statement

The data presented in this study are available at Supplementary Materials and upon specific request from the corresponding author.

Acknowledgments

The authors acknowledge Laura Inés García for technical assistance; Luis Roberto Rodríguez for technical support in the zebrafish laboratory at the INB-UNAM Vivarium; Elsa Nydia Hernández and Ericka de los Rios for microscopic assistance; Ramón Martínez Olvera, María Eugenia Rosas Alatorre, Omar González, and Moisés Mendoza Baltazar for technology information and computational support; Javier Valles and Rafael Silva for bibliographic service; Nuri Aranda and Adriana García for academic support; and Jessica González Norris for proofreading.

Conflicts of Interest

The authors declare no conflicts of interest.

Abbreviations

NBNeuroblastoma
MYCNMYCN proto-oncogene, bHLH transcription factor
PPARγPeroxisome proliferator-activated receptor gamma
VEGFAVascular endothelial growth factor A
TrkANeurotrophic receptor tyrosine kinase 1
TrkBNeurotrophic receptor tyrosine kinase 2
N-cadherinNeural cadherin (CDH2)
AurkaAurora kinase A
MIATMyocardial infarction-associated transcript
FasNFatty acid synthase
DCFDA2′,7′-Dichlorofluorescein
PTUN-phenylthiourea
WTWild Type
GWGW9662
RGZRosiglitazone
DiIFast DiI™ oil red dye

References

  1. Qiu, B.; Matthay, K.K. Advancing Therapy for Neuroblastoma. Nat. Rev. Clin. Oncol. 2022, 19, 515–533. [Google Scholar] [CrossRef] [PubMed]
  2. Otte, J.; Dyberg, C.; Pepich, A.; Johnsen, J.I. MYCN Function in Neuroblastoma Development. Front. Oncol. 2021, 10, 624079. [Google Scholar] [CrossRef] [PubMed]
  3. Higashi, M.; Sakai, K.; Fumino, S.; Aoi, S.; Furukawa, T.; Tajiri, T. The Roles Played by the MYCN, Trk, and ALK Genes in Neuroblastoma and Neural Development. Surg. Today 2019, 49, 721–727. [Google Scholar] [CrossRef] [PubMed]
  4. Rickman, D.S.; Schulte, J.H.; Eilers, M. The Expanding World of N-MYC–Driven Tumors. Cancer Discov. 2018, 8, 150–163. [Google Scholar] [CrossRef] [PubMed]
  5. Kohl, N.E.; Kanda, N.; Schreck, R.R.; Bruns, G.; Latt, S.A.; Gilbert, F.; Alt, F.W. Transposition and Amplification of Oncogene-Related Sequences in Human Neuroblastomas. Cell 1983, 35, 359–367. [Google Scholar] [CrossRef] [PubMed]
  6. Knoepfler, P.S.; Cheng, P.F.; Eisenman, R.N. N-Myc Is Essential during Neurogenesis for the Rapid Expansion of Progenitor Cell Populations and the Inhibition of Neuronal Differentiation. Genes Dev. 2002, 16, 2699–2712. [Google Scholar] [CrossRef] [PubMed]
  7. Bhavsar, S.P. Metastasis in Neuroblastoma: The MYCN Question. Front Oncol. 2023, 13, 1196861. [Google Scholar] [CrossRef] [PubMed]
  8. Huang, M.; Weiss, W.A. Neuroblastoma and MYCN. Cold Spring Harb. Perspect. Med. 2013, 3, a014415. [Google Scholar] [CrossRef] [PubMed]
  9. Maris, J.M.; Hogarty, M.D.; Bagatell, R.; Cohn, S.L. Neuroblastoma. Lancet 2007, 369, 2106–2120. [Google Scholar] [CrossRef] [PubMed]
  10. Nakagawara, A.; Arima-Nakagawara, M.; Scavarda, N.J.; Azar, C.G.; Cantor, A.B.; Brodeur, G.M. Association between High Levels of Expression of the TRK Gene and Favorable Outcome in Human Neuroblastoma. N. Engl. J. Med. 1993, 328, 847–854. [Google Scholar] [CrossRef] [PubMed]
  11. Nakatani, K.; Kogashi, H.; Miyamoto, T.; Setoguchi, T.; Sakuma, T.; Kugou, K.; Hasegawa, Y.; Yamamoto, T.; Hippo, Y.; Suenaga, Y. Inhibition of OCT4 Binding at the MYCN Locus Induces Neuroblastoma Cell Death Accompanied by Downregulation of Transcripts with High-Open Reading Frame Dominance. Front Oncol. 2024, 14, 1237378. [Google Scholar] [CrossRef] [PubMed]
  12. Bountali, A.; Tonge, D.P.; Mourtada-Maarabouni, M. RNA Sequencing Reveals a Key Role for the Long Non-Coding RNA MIAT in Regulating Neuroblastoma and Glioblastoma Cell Fate. Int. J. Biol. Macromol. 2019, 130, 878–891. [Google Scholar] [CrossRef] [PubMed]
  13. Feriancikova, B.; Feglarova, T.; Krskova, L.; Eckschlager, T.; Vicha, A.; Hrabeta, J. MIAT Is an Upstream Regulator of NMYC and the Disruption of the MIAT/NMYC Axis Induces Cell Death in NMYC Amplified Neuroblastoma Cell Lines. Int. J. Mol. Sci. 2021, 22, 3393. [Google Scholar] [CrossRef] [PubMed]
  14. Zohar, K.; Giladi, E.; Eliyahu, T.; Linial, M. Oxidative Stress and Its Modulation by Ladostigil Alter the Expression of Abundant Long Non-Coding RNAs in SH-SY5Y Cells. Non-Coding RNA 2022, 8, 72. [Google Scholar] [CrossRef] [PubMed]
  15. Brodeur, G.M.; Minturn, J.E.; Ho, R.; Simpson, A.M.; Iyer, R.; Varela, C.R.; Light, J.E.; Kolla, V.; Evans, A.E. Trk Receptor Expression and Inhibition in Neuroblastomas. Clin. Cancer Res. 2009, 15, 3244–3250. [Google Scholar] [CrossRef] [PubMed]
  16. Vella, S.; Conaldi, P.G.; Florio, T.; Pagano, A. PPAR Gamma in Neuroblastoma: The Translational Perspectives of Hypoglycemic Drugs. PPAR Res. 2016, 2016, e3038164. [Google Scholar] [CrossRef] [PubMed]
  17. Han, S.W.; Greene, M.E.; Pitts, J.; Wada, R.K.; Sidell, N. Novel Expression and Function of Peroxisome Proliferator-Activated Receptor Gamma (PPARγ) in Human Neuroblastoma Cells1. Clin. Cancer Res. 2001, 7, 98–104. [Google Scholar] [PubMed]
  18. Gallo, M.; Muscogiuri, G.; Felicetti, F.; Faggiano, A.; Trimarchi, F.; Arvat, E.; Vigneri, R.; Colao, A. Adverse Glycaemic Effects of Cancer Therapy: Indications for a Rational Approach to Cancer Patients with Diabetes. Metabolism 2018, 78, 141–154. [Google Scholar] [CrossRef] [PubMed]
  19. Mendieta, I.; Rodríguez-Gómez, G.; Rueda-Zarazúa, B.; Castelán, J.; Álvarez-Leon, W.; Delgado-González, E.; Anguiano, B.; Vázquez Martínez, O.; Díaz-Muñoz, M.; Aceves, C. Molecular Iodine Synergized and Sensitized Neuroblastoma Cells to the Antineoplastic Effect of ATRA. Endocr.-Relat. Cancer 2020, 27, 699–710. [Google Scholar] [CrossRef] [PubMed]
  20. Álvarez-León, W.; Mendieta, I.; Delgado-González, E.; Anguiano, B.; Aceves, C. Molecular Iodine/Cyclophosphamide Synergism on Chemoresistant Neuroblastoma Models. Int. J. Mol. Sci. 2021, 22, 8936. [Google Scholar] [CrossRef] [PubMed]
  21. Aceves, C.; Mendieta, I.; Anguiano, B.; Delgado-González, E. Molecular Iodine Has Extrathyroidal Effects as an Antioxidant, Differentiator, and Immunomodulator. Int. J. Mol. Sci. 2021, 22, 1228. [Google Scholar] [CrossRef] [PubMed]
  22. Shrivastava, A.; Tiwari, M.; Sinha, R.A.; Kumar, A.; Balapure, A.K.; Bajpai, V.K.; Sharma, R.; Mitra, K.; Tandon, A.; Godbole, M.M. Molecular Iodine Induces Caspase-Independent Apoptosis in Human Breast Carcinoma Cells Involving the Mitochondria-Mediated Pathway. J. Biol. Chem. 2006, 281, 19762–19771. [Google Scholar] [CrossRef] [PubMed]
  23. Ben-Yehuda Greenwald, M.; Frušić-Zlotkin, M.; Soroka, Y.; Ben-Sasson, S.; Bianco-Peled, H.; Kohen, R. A Novel Role of Topical Iodine in Skin: Activation of the Nrf2 Pathway. Free Radic. Biol. Med. 2017, 104, 238–248. [Google Scholar] [CrossRef] [PubMed]
  24. Cuenca-Micó, O.; Delgado-González, E.; Anguiano, B.; Vaca-Paniagua, F.; Medina-Rivera, A.; Rodríguez-Dorantes, M.; Aceves, C. Effects of Molecular Iodine/Chemotherapy in the Immune Component of Breast Cancer Tumoral Microenvironment. Biomolecules 2021, 11, 1501. [Google Scholar] [CrossRef] [PubMed]
  25. Aceves, C.; García-Solís, P.; Arroyo-Helguera, O.; Vega-Riveroll, L.; Delgado, G.; Anguiano, B. Antineoplastic Effect of Iodine in Mammary Cancer: Participation of 6-Iodolactone (6-IL) and Peroxisome Proliferator-Activated Receptors (PPAR). Mol. Cancer 2009, 8, 33. [Google Scholar] [CrossRef] [PubMed]
  26. Rillema, J.A.; Mulder, J.A. Arachidonic Acid Distribution in Lipids of Mammary Glands and Dmba-Induced Tumors of Rats. Prostaglandins Med. 1978, 1, 31–38. [Google Scholar] [CrossRef] [PubMed]
  27. Dang, M.; Fogley, R.; Zon, L. Cancer and Zebrafish: Mechanisms, Techniques, and Models: Chemical Genetics. Adv. Exp. Med. Biol. 2016, 916, 103–124. [Google Scholar] [CrossRef] [PubMed]
  28. Vazquez-Rodriguez, G.; Juvera Avalos, E.R.; Gonzalez, C.; Barba de la Rosa, A.P.; De Leon-Rodriguez, A. Production and Optimization of a Vasostatin-30 and Vasoinhibin Fusion Protein That Inhibits Tumor Angiogenesis and Dissemination of Breast Cancer Cells in a Zebrafish Model. Process Biochem. 2022, 119, 1–12. [Google Scholar] [CrossRef]
  29. Servidei, T.; Morosetti, R.; Ferlini, C.; Cusano, G.; Scambia, G.; Mastrangelo, R.; Koeffler, H.P. The Cellular Response to PPARγ Ligands Is Related to the Phenotype of Neuroblastoma Cell Lines. Oncol. Res. Featur. Preclin. Clin. Cancer Ther. 2004, 14, 345–354. [Google Scholar] [CrossRef] [PubMed]
  30. Bagatell, R.; Beck-Popovic, M.; London, W.B.; Zhang, Y.; Pearson, A.D.J.; Matthay, K.K.; Monclair, T.; Ambros, P.F.; Cohn, S.L. Significance of MYCN Amplification in International Neuroblastoma Staging System Stage 1 and 2 Neuroblastoma: A Report from the International Neuroblastoma Risk Group Database. J. Clin. Oncol. 2009, 27, 365–370. [Google Scholar] [CrossRef] [PubMed]
  31. Elstner, E.F.; Adamczyk, R.; Kröner, R.; Furch, A. The uptake of potassium iodide and its effect as an antioxidant in isolated rabbit eyes. Ophthalmologica 1985, 191, 122–126. [Google Scholar] [CrossRef] [PubMed]
  32. Winkler, R.; Griebenow, S.; Wonisch, W. Effect of Iodide on Total Antioxidant Status of Human Serum. Cell Biochem Funct. 2000, 18, 143–146. [Google Scholar]
  33. Cocchi, M.; Venturi, S. Iodide, Antioxidant Function and Omega-6 and Omega-3 Fatty Acids. Prog. Nutr. 2000, 2, 15–19. [Google Scholar]
  34. Hayes, J.D.; Dinkova-Kostova, A.T.; Tew, K.D. Oxidative Stress in Cancer. Cancer Cell 2020, 38, 167–197. [Google Scholar] [CrossRef] [PubMed]
  35. Koundouros, N.; Poulogiannis, G. Reprogramming of Fatty Acid Metabolism in Cancer. Br. J. Cancer 2020, 122, 4–22. [Google Scholar] [CrossRef] [PubMed]
  36. Galbraith, L.; Leung, H.Y.; Ahmad, I. Lipid Pathway Deregulation in Advanced Prostate Cancer. Pharmacol. Res. 2018, 131, 177–184. [Google Scholar] [CrossRef] [PubMed]
  37. Yang, T.; Li, J.; Zhuo, Z.; Zeng, H.; Tan, T.; Miao, L.; Zheng, M.; Yang, J.; Pan, J.; Hu, C.; et al. TTF1 Suppresses Neuroblastoma Growth and Induces Neuroblastoma Differentiation by Targeting TrkA and the miR-204/TrkB Axis. iScience 2022, 25, 104655. [Google Scholar] [CrossRef] [PubMed]
  38. Thress, K.; MacIntyre, T.; Wang, H.; Whitston, D.; Liu, Z.-Y.; Hoffmann, E.; Wang, T.; Brown, J.L.; Webster, K.; Omer, C.; et al. Identification and Preclinical Characterization of AZ-23, a Novel, Selective, and Orally Bioavailable Inhibitor of the Trk Kinase Pathway. Mol. Cancer Ther. 2009, 8, 1818–1827. [Google Scholar] [CrossRef] [PubMed]
  39. Monclair, T.; Brodeur, G.M.; Ambros, P.F.; Brisse, H.J.; Cecchetto, G.; Holmes, K.; Kaneko, M.; London, W.B.; Matthay, K.K.; Nuchtern, J.G.; et al. The International Neuroblastoma Risk Group (INRG) Staging System: An INRG Task Force Report. J. Clin. Oncol. 2009, 27, 298–303. [Google Scholar] [CrossRef] [PubMed]
  40. Fuenzalida, K.M.; Aguilera, M.C.; Piderit, D.G.; Ramos, P.C.; Contador, D.; Quiñones, V.; Rigotti, A.; Bronfman, F.C.; Bronfman, M. Peroxisome Proliferator-Activated Receptor γ Is a Novel Target of the Nerve Growth Factor Signaling Pathway in PC12 Cells. J. Biol. Chem. 2005, 280, 9604–9609. [Google Scholar] [CrossRef] [PubMed][Green Version]
  41. Chu, J. Validation of the Biological Function and Prognostic Significance of AURKA in Neuroblastoma. PLoS ONE 2024, 19, e0313939. [Google Scholar] [CrossRef] [PubMed]
  42. Otto, T.; Horn, S.; Brockmann, M.; Eilers, U.; Schüttrumpf, L.; Popov, N.; Kenney, A.M.; Schulte, J.H.; Beijersbergen, R.; Christiansen, H.; et al. Stabilization of N-Myc Is a Critical Function of Aurora A in Human Neuroblastoma. Cancer Cell 2009, 15, 67–78. [Google Scholar] [CrossRef] [PubMed]
  43. Yang, G.; Lin, Y.; Sun, X.; Cheng, D.; Li, H.; Hu, S.; Chen, M.; Wang, Y.; Wang, Y. Preclinical Evaluation of JAB-2485, a Potent AURKA Inhibitor with High Selectivity and Favorable Pharmacokinetic Properties. ACS Omega 2024, 9, 21416–21425. [Google Scholar] [CrossRef] [PubMed]
  44. Han, S.; Wada, R.K.; Sidell, N. Differentiation of Human Neuroblastoma by Phenylacetate Is Mediated by Peroxisome Proliferator-Activated Receptor Gamma. Cancer Res. 2001, 61, 3998–4002. [Google Scholar] [PubMed]
  45. Loh, C.-Y.; Chai, J.Y.; Tang, T.F.; Wong, W.F.; Sethi, G.; Shanmugam, M.K.; Chong, P.P.; Looi, C.Y. The E-Cadherin and N-Cadherin Switch in Epithelial-to-Mesenchymal Transition: Signaling, Therapeutic Implications, and Challenges. Cells 2019, 8, 1118. [Google Scholar] [CrossRef] [PubMed]
  46. Ballav, S.; Ranjan, A.; Basu, S. Partial Activation of PPAR-γ by Synthesized Quercetin Derivatives Modulates TGF-Β1-Induced EMT in Lung Cancer Cells. Adv. Biol. 2023, 7, 2300037. [Google Scholar] [CrossRef] [PubMed]
  47. Eggert, A.; Ikegaki, N.; Kwiatkowski, J.; Zhao, H.; Brodeur, G.M.; Himelstein, B.P. High-Level Expression of Angiogenic Factors Is Associated with Advanced Tumor Stage in Human Neuroblastomas. Clin. Cancer Res. 2000, 6, 1900–1908. [Google Scholar] [PubMed]
  48. Cabezas-Sáinz, P.; Pensado-López, A.; Sáinz, B.; Sánchez, L. Modeling Cancer Using Zebrafish Xenografts: Drawbacks for Mimicking the Human Microenvironment. Cells 2020, 9, 1978. [Google Scholar] [CrossRef] [PubMed]
  49. Nicoli, S.; Ribatti, D.; Cotelli, F.; Presta, M. Mammalian Tumor Xenografts Induce Neovascularization in Zebrafish Embryos. Cancer Res. 2007, 67, 2927–2931. [Google Scholar] [CrossRef] [PubMed]
  50. Zhao, C.; Qiao, Y.; Jonsson, P.; Wang, J.; Xu, L.; Rouhi, P.; Sinha, I.; Cao, Y.; Williams, C.; Dahlman-Wright, K. Genome-Wide Profiling of AP-1–Regulated Transcription Provides Insights into the Invasiveness of Triple-Negative Breast Cancer. Cancer Res. 2014, 74, 3983–3994. [Google Scholar] [CrossRef] [PubMed]
  51. Miller, A.; Schröder, K.L.; Braun, K.E.; Steindorf, C.; Ottermanns, R.; Roß-Nickoll, M.; Hollert, H.; Backhaus, T. Temperature-Dependence of Early Development of Zebrafish and the Consequences for Laboratory Use and Animal Welfare. PLoS ONE 2025, 20, e0340193. [Google Scholar] [CrossRef] [PubMed]
  52. Nicoli, S.; Presta, M. The Zebrafish/Tumor Xenograft Angiogenesis Assay. Nat. Protoc. 2007, 2, 2918–2923. [Google Scholar] [CrossRef] [PubMed]
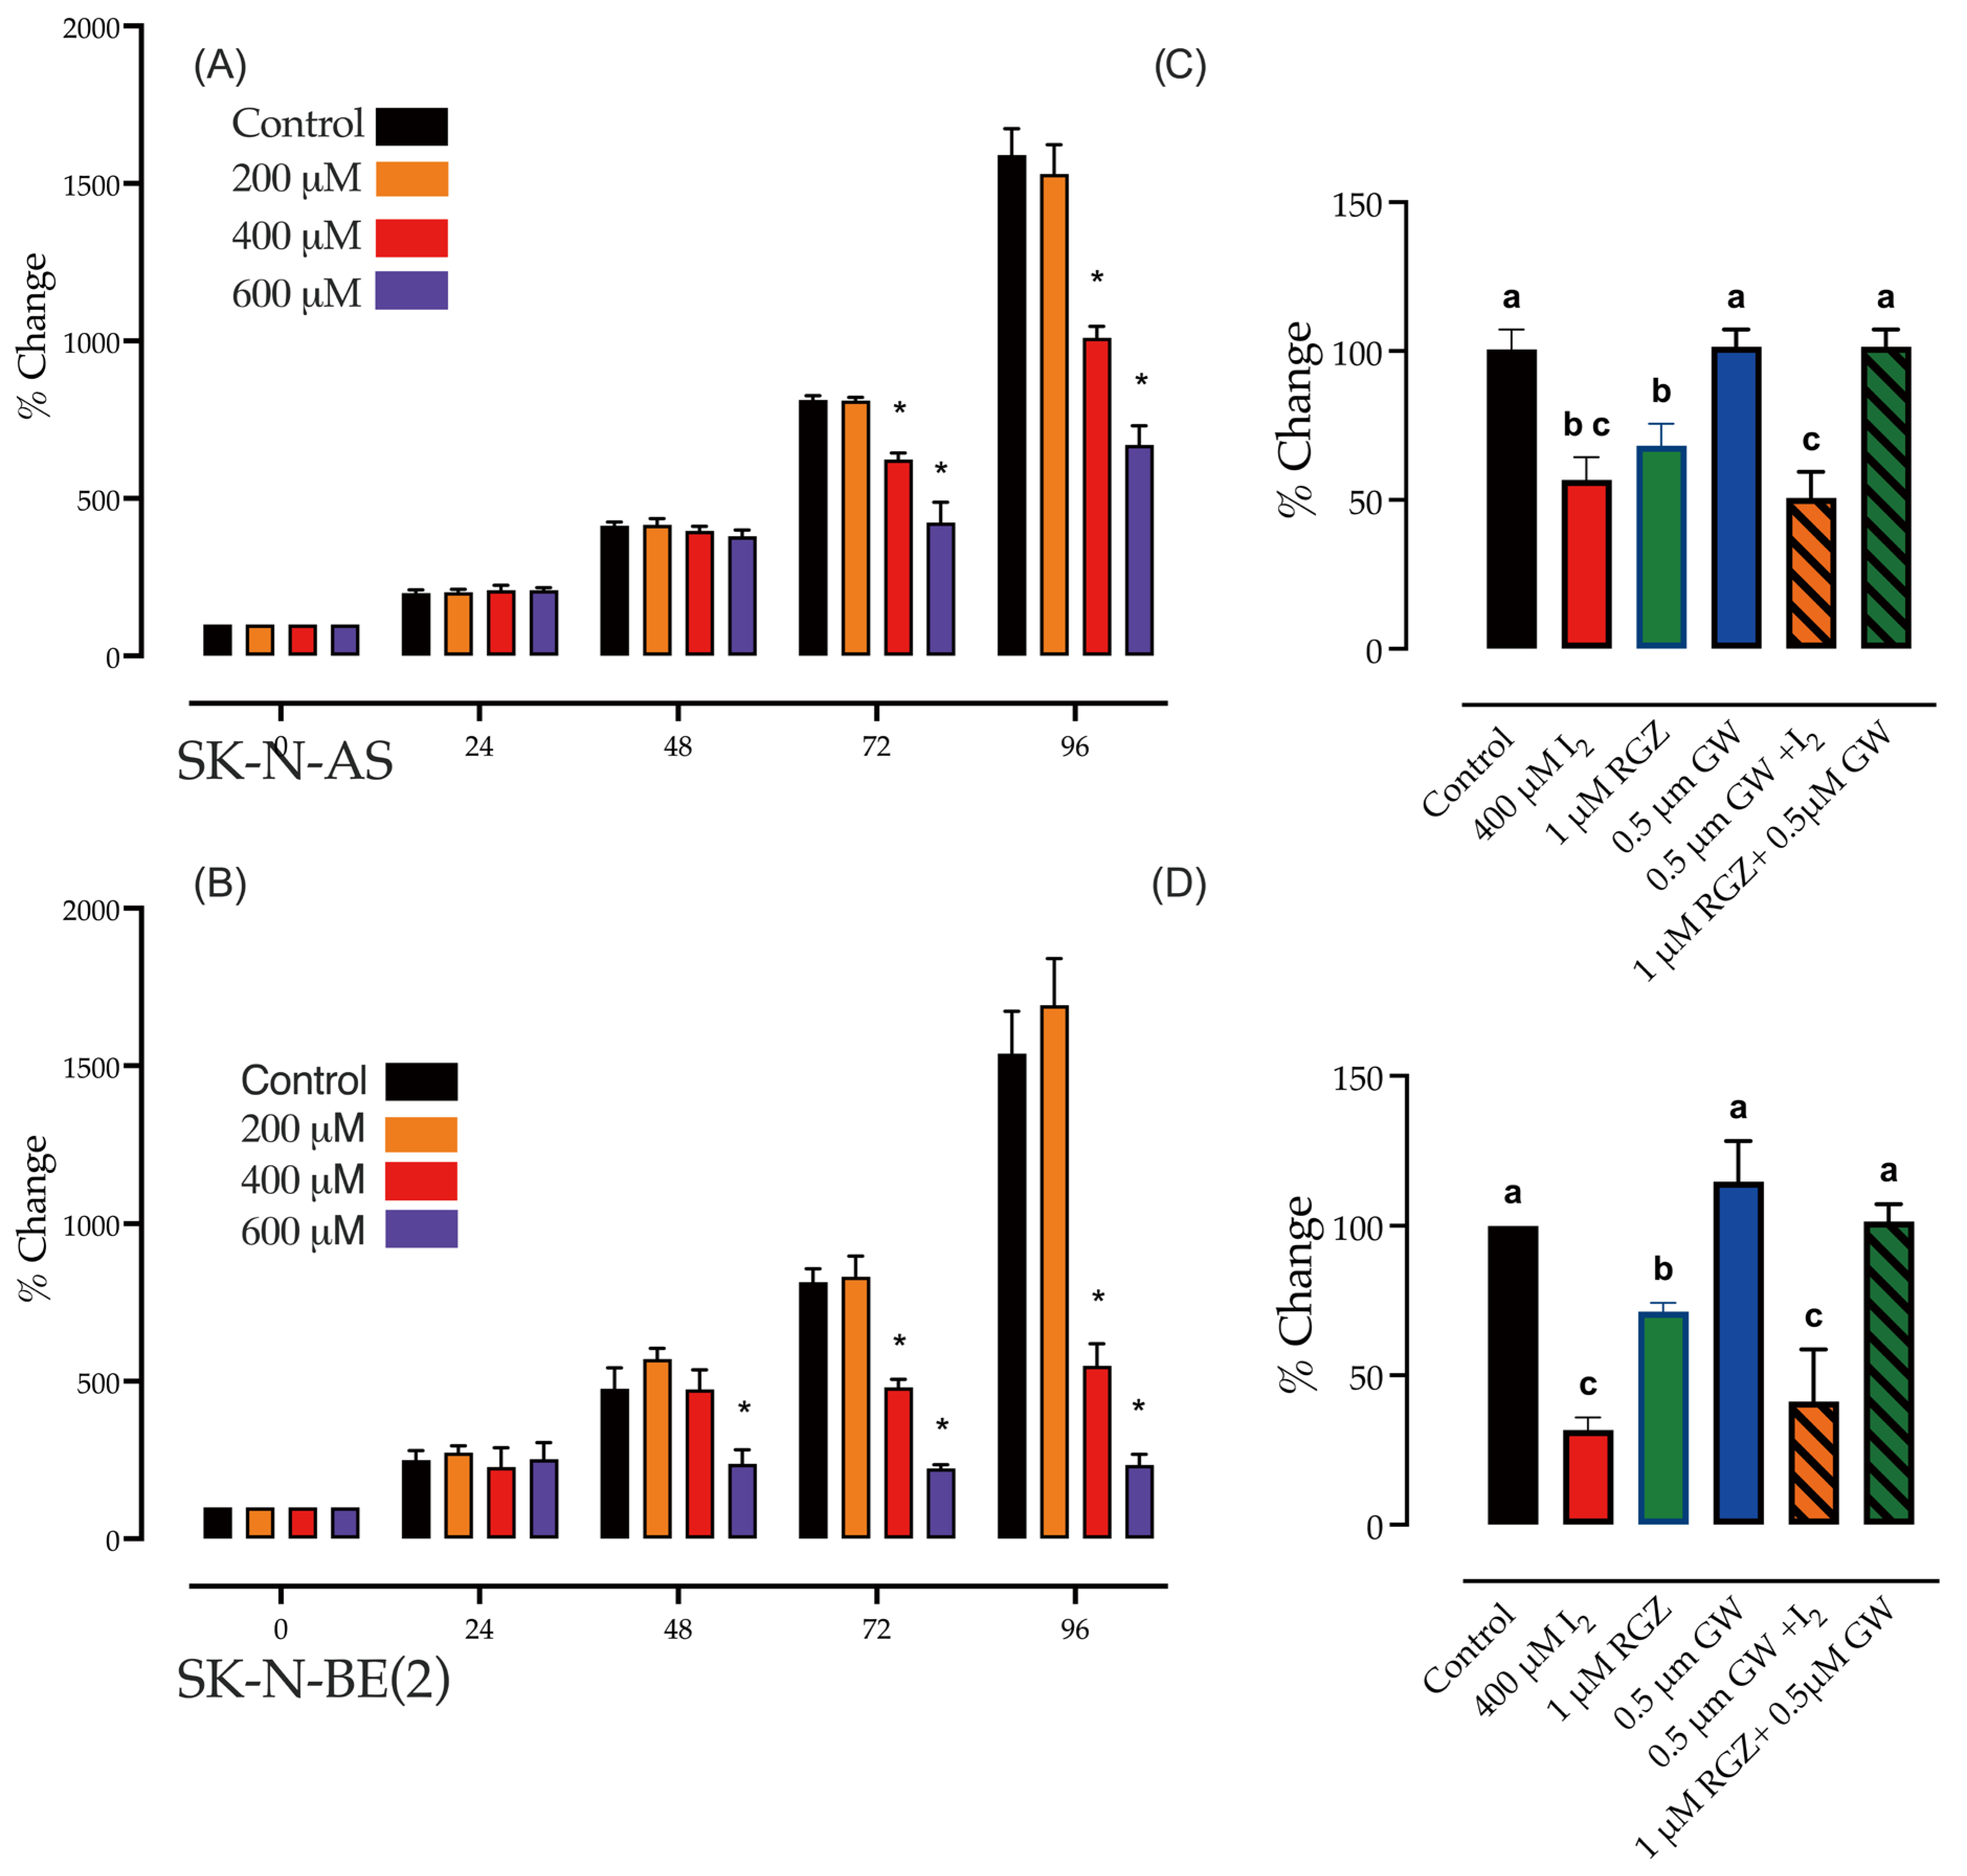
Figure 1. Response to I2 and the participation of PPARγ in cell viability. (A,B) The trypan blue exclusion test was used to assess the viability of SK-N-AS and SK-N-BE(2) cells at different I2 concentrations. (C,D), response of viability in the presence of I2 (400 µM) and PPARγ agonist (RGZ 1 µM) and antagonist (GW; 0.5 µM). All experiments were carried out for 96 h. Data are representative of at least three independent experiments per duplicate and expressed as the mean ± SD. The data were analyzed via one-way ANOVA. Asterisks and letters denote statistical differences (p < 0.05).
Cells 15 01189 g001
Figure 2. Antioxidant effect and molecular responses to I2 and GW in SK-N-BE(2) cells. (A) ROS levels were analyzed by the DCFDA assay using 100 μM hydrogen peroxide (H2O2) as a positive control, and the expression of genes responds independently of PPARγ activation. (B) Gene expression depends on PPARγ activation and was normalized to β-actin (qPCR). (C) Protein content (Western blot) of MYCN and PPARγ. Protein content was normalized by glyceraldehyde-3-phosphate dehydrogenase (GAPDH). All treatments included I2 (400 μM), PPARγ antagonist GW9662 (0.5 μM; GW), and the combination (GW + I2) for 96 h. Data are representative of at least three independent experiments per duplicate and are expressed as the mean ± SD. The data were analyzed via one-way ANOVA. Letters denote statistical differences (p < 0.05).
Cells 15 01189 g002
Figure 3. Invasive response of the SK-N-BE(2) cells to I2. (A) Wound healing assay; (ad) representative micrographs of each condition (10× magnification) of the open wound and quantification of open wound area after 24 h post-treatment. The wound area is highlighted in red along the borders. (B) Quantification of the open wound area after treatment. (C) Genes related to invasiveness. Expression was normalized to ß-actin (quantitative PCR). Data are representative of three independent experiments and expressed as the mean ± SD. The data were analyzed via one-way ANOVA and Tukey’s test. Letters denote statistical differences (p < 0.05).
Cells 15 01189 g003
Figure 4. Xenograft density and angiogenesis in zebrafish. Representative micrographs of xenograft size (red) and intratumoral blood vessels (green) (BVs) in zebrafish larvae. Standard (control) and 400 μM I2-pre-treated SK-N-BE(2) cells were incubated for 96 h. Between 400 and 600 DiI-labeled cells with extracellular matrix were subcutaneously implanted into two-day-old Tg (Fli1:EFGP)y1 zebrafish embryos. Xenograft density and intratumoral BVs were analyzed by confocal microscopy three days after injection. Each dot represents an independent larva. (A,B) BVs in zebrafish larvae. (C,D) Xenograft density (red). (E,F) Intratumoral BV densitometry (angiogenesis). Scale bar = 100 µm. (G) Mean fluorescence intensity among subjects. (H) Percentage of vascular area in the tumor (relative tumoral angiogenesis). Data are expressed as the mean ± SD and were analyzed using Student’s t-test; * p < 0.05.
Cells 15 01189 g004
Figure 5. Caudal migration of SK-N-BE(2) cells in zebrafish. Representative micrograph of the caudal region and quantification of control (n = 21) and I2-pretreated (400 μM) SK-N-BE(2) cells (n = 31). (A) Between 400 and 600 DiI-label cells were subcutaneously implanted into wild-type zebrafish embryos, white arrows indicate NB cells in zebrafish. (B) Quantification of caudal cells was analyzed after 96 h. Each dot represents an independent larva. Data are expressed as the mean ± SD and were analyzed using Student’s t-test; * p < 0.05.
Cells 15 01189 g005
Table 1. Oligonucleotide sequences.
TargetReferenceSenseAntisense
PPARγNM_001354666.3CGACATTCAATTGCCATGAGGACCACTCCCACTCCTTTGA
MYCNXM_054342160.1ACCCTGAGCGATTCAGATGATGTGGTGACAGCCTTGGTGTT
VEGFANM_001025366.3GACACACCCACCCACATACAACATCCTCCTCCCAACTCAA
TrkANM_001012331.2CATCGTGAAGAGTGGTCTCCGGAGAGAGACTCCAGAGCGTTGAA
TrkBXM_054363028.1TCGTGGCATTTCCGAGATTGGTCGTCAGTTTGTTTCGGGTAAA
N-cadherinNM_001317185.2CAGTGGCCACCTACAAAGAAATGAAACCGGGCTATC
VimentinNM_003380.5GAGAACTTTGCCGTTGAAGCGCTTCCTGTAGGTGGCAATC
AurkaNM_001323304.2ACCTGTTAAGGCTACAGCTCCAAAGGACACAAGACCCGCTGA
β-actinNM_001101.5CCATCATGAAGTGTGACGTTGACAGAGTACTTGCGCTCAGGA
MIATNR_185983.1GCTCACACCTCCTATTCCTCTTCACCAACTCTCCCACT
FasNNM_004104.5ATGCTGAACGACATCGCGGGAATCTCGGAAGCGGTCCAG
Disclaimer/Publisher’s Note: The statements, opinions and data contained in all publications are solely those of the individual author(s) and contributor(s) and not of MDPI and/or the editor(s). MDPI and/or the editor(s) disclaim responsibility for any injury to people or property resulting from any ideas, methods, instructions or products referred to in the content.