Article

Dexmedetomidine Preserves Hippocampal Neurogenesis During Recovery from Neonatal Hyperoxia in Rats


by
Stefanie Endesfelder
1,*,
Christoph Bührer
1 and
Thomas Schmitz
2
1
Department of Neonatology, Charité—University Medical Center Berlin, Augustenburger Platz 1, 13353 Berlin, Germany
2
Clinic for Pediatrics and Adolescent Medicine, University Hospital of the Brandenburg Medical School, Fehrbelliner Straße 38, 16816 Neuruppin, Germany
*
Author to whom correspondence should be addressed.
Cells 2026, 15(12), 1094; https://doi.org/10.3390/cells15121094
Submission received: 28 April 2026 / Revised: 9 June 2026 / Accepted: 11 June 2026 / Published: 16 June 2026
(This article belongs to the Special Issue Oxidative Stress in Neonatal Development and Diseases)

Abstract

Neonatal hyperoxia induces oxidative stress that disrupts neurodevelopmental processes. While dexmedetomidine (DEX) exhibits acute neuroprotective properties, its long-term impact on developmental trajectories during recovery remains incompletely understood. This study examined whether a single neonatal dose of DEX modulates hippocampal neurogenesis following hyperoxia across defined postnatal stages. Six-day-old Wistar rats were exposed to 80% oxygen for 24 h and evaluated at postnatal days (P) 9, 11, and 14 after recovery in room air. Mechanistically, hyperoxia permanently triggered apoptotic cascades, evidenced by sustained transcript upregulation and increased histological apoptosis and cell loss across the cortex and hippocampus, while disrupting the hippocampal progenitor niche, suppressing key differentiation factors (Sox2, Tbr2, Prox1, Calb1) and altering mature NeuN expression. Likewise, markers for autophagy (Atg5/12, Beclin1), neurotrophins (BDNF, NGF, NT3), and plasticity markers (Nrp1, Sem3a) showed reduced expression. Proactive treatment with DEX (5 µg/kg) significantly reversed these detrimental patterns. First, DEX elicited a robust antioxidant response (Nrf2, SOD1, SOD3 induction). Second, DEX effectively suppressed hyperoxia-induced programmed cell death and tissue degeneration up to P14. Crucially, this dual protection sustained the neurogenic niche, safeguarding autophagy processes as well as neurotrophic and neuronal plasticity mediators, while showing excellent safety under normoxia. In conclusion, a single dose of DEX mitigates acute oxygen injury and exhibits beneficial, stage-specific effects within hippocampal neurogenic niches during the postnatal phase, highlighting its potential to preserve neurodevelopmental trajectories.

1. Introduction

The transition from the hypoxic intrauterine environment to atmospheric hyperoxia represents a significant physiological challenge for preterm infants [1,2]. Due to immature antioxidant defense systems and underdeveloped endogenous radical scavenger mechanisms, even brief periods of high oxygen exposure can trigger prolonged oxidative stress [3,4]. This “oxygen paradox” is a primary driver of neonatal brain injury, as the developing central nervous system is exquisitely vulnerable to oxidative toxicity [5,6,7].
Hyperoxia induces the overproduction of reactive oxygen species (ROS), leading to cellular damage via lipid peroxidation as well as DNA and protein oxidation [8,9]. These molecular insults culminate in widespread programmed cell death, including the apoptosis of neurons and glial cells across both white and grey matter [10,11,12]. Beyond immediate cell loss, hyperoxia severely disrupts critical developmental programs. It impairs oligodendrocyte maturation, leading to myelination deficits and structural white matter anomalies, while simultaneously disturbing neural progenitor cell populations and cerebrovascular development [13,14,15]. Furthermore, the activation of pro-inflammatory cytokines exacerbates this damage, creating a neuroinflammatory milieu that compounds the initial injury [14,16]. Clinical evidence underscores this vulnerability, associating neonatal hyperoxia with long-term motor, cognitive, and behavioral deficits [14,17].
The neonatal period is defined by a rapid convergence of fundamental processes, including neurogenesis, synaptogenesis, and the proliferation of oligodendrocyte progenitor cells [18]. In the last third of pregnancy, the human brain undergoes a fourfold increase in volume, characterized by intense dendritic arborization and cortical folding [19]. In this context, injury does not merely cause a loss of function but triggers “dysmaturation”, a fundamental decoupling of the brain’s developmental trajectory. For instance, hyperoxia-induced oxidative stress causes a maturation arrest in pre-oligodendrocytes by disrupting essential transcription factors [17,20,21,22]. Furthermore, both hippocampal and cerebellar neurogenesis can be significantly impaired and delayed [17,23,24,25,26,27,28]. Since brain development is hierarchical, these early injuries can lead to maladaptive ontogenetic adjustments, i.e., short-term restructuring for survival, which can then result in long-term cognitive dysfunctions [22,29,30].
In the clinical setting, the management of preterm infants often requires sedation; however, traditional agents like opioids and benzodiazepines have been linked to poor neurological outcomes [31]. Midazolam, in particular, is associated with hippocampal dysmaturation and reduced hippocampal volume [32,33,34]. Consequently, there is an urgent need for sedative alternatives that offer neuroprotective properties. Dexmedetomidine, a highly selective alpha2-adrenoceptor agonist, has emerged as a promising candidate. Beyond its sedative effects, dexmedetomidine exerts multi-modal neuroprotection by inhibiting NADPH oxidase 2 (NOX2) to reduce ROS production, suppressing microglial activation, and promoting cell survival through the PI3K/Akt signaling pathway [35,36]. Furthermore, it has been shown to protect synaptic integrity and restore the expression of markers such as synaptophysin following hypoxic–ischemic insults [35]. Recent clinical data demonstrate that dexmedetomidine reduces cumulative opioid exposure, shortens the time to enteral feeding, and significantly lowers seizure risk (OR: 0.31) in neonates with hypoxic–ischemic encephalopathy [37,38]. Mechanistically, these benefits are driven by dexmedetomidine’s capacity to suppress oxidative stress and inflammation, while preserving mitochondrial function and preventing apoptosis [39].
Despite these promising findings, important gaps remain in our understanding of dexmedetomidine’s efficacy. While data in cerebellar Purkinje cells in neonatal mice indicated improved cell survival beyond the second postnatal week after a single dexmedetomidine administration [26], most preclinical studies have focused on acute molecular protection, representing snapshot analysis immediately after acute hyperoxic damage within the first week of life in rodents [40,41,42,43]. While insights from these studies confirm that a single dose of dexmedetomidine may reduce expression of markers for neurodegeneration and inflammation, they do not account for the developmental dynamic during brain growth spurt of the immature brain. It remains unclear whether dexmedetomidine administration causes a sustained preservation of the developmental trajectory or whether it only coincides with short-term modifications in the injured brain. Specifically, the long-term impact on progenitor pool dynamics, the essential transition from excitatory to inhibitory GABAergic signaling, and the modulation of autophagy and neurotrophic factors like BDNF across multiple postnatal stages have not been elucidated.
The aim of the present study is to shift the neuroprotective paradigm from acute damage modification to the long-term maintenance of neurodevelopmental programs. By utilizing a serial investigation approach across multiple postnatal time points (P9, P11, and P14), we aim to clarify whether dexmedetomidine maintains the coordinated maturation of the hippocampus under a short phase of hyperoxic conditions during the vulnerable phase of brain development. We hypothesize that dexmedetomidine treatment mitigates acute oxidative injury and sustains the integrity of neural progenitor niches and synaptic plasticity, thereby preserving functional and structural development of the neonatal brain.

2. Materials and Methods

2.1. Animal Welfare

Time-mated Wistar rats (Janvier Labs, Le Genest-Saint-Isle, France) were housed individually under standardized conditions, including a 12 h/12 h light–dark cycle, constant room temperature, and 60% relative humidity. The animals had ad libitum access to water and a standard diet (Altromin 1324, Lage, Germany; containing 24% protein, 11% fat, and 65% carboHYDEXrates). In all experiments, neonatal pups remained with a lactating dam throughout the study period. All animal procedures were reviewed and approved by the local regulatory authority (LAGeSo, approval number G-0145/13 on 1 July 2013, and G-0139/18 on 3 July 2018) and were conducted in accordance with institutional regulations and ARRIVE guidelines (Animal Research: Reporting of In Vivo Experiments), as detailed by Percie du Sert et al. [44].

2.2. Oxygen Exposure and Drug Administration

As described previously [26,27,40,41], pups were randomized by litter and sex at postnatal day (P) 4. Subsequently, dams with their litters were exposed to either hyperoxic conditions (80% O2; OxyCycler BioSpherix, Lacona, NY, USA) or normoxic conditions (21% O2) from P6 to P7. Dexmedetomidine (DEX; 5 µg/kg body weight; Dexdor®, Orion Pharma, Espoo, Finland), diluted in phosphate-buffered saline (PBS), was administered intraperitoneally (i.p.; 100 µL/10 g body weight). Treatment (DEX or vehicle [0.9% saline]) was given once, 15 min prior to oxygen exposure. Animals were allocated to one control group (NO: 21% O2) and three experimental groups (NOD: 21% O2 + 5 µg/kg DEX; HY: 80% O2 + 0.9% saline; HYDEX: 80% O2 + 5 µg/kg DEX), with six pups per group. The dose of 5 µg/kg dexmedetomidine (DEX) was chosen based on comprehensive prior dose–response studies in this specific neonatal hyperoxia [40,41]. Previous evaluations comparing 1, 5, and 10 µg/kg DEX established that 5 µg/kg represents the optimal neuroprotective concentration. Following oxygen exposure at P7, all animals were maintained under normoxic room air conditions and remained with a lactating dam until the respective analysis time points at P9, P11, and P14, when assessments were performed. All experimental procedures followed previously established protocols [26,27,40,41].

2.3. Tissue Preparation

At P9, P11, and P14, pups were anesthetized via intraperitoneal injection of ketamine (100 mg/kg), xylazine (20 mg/kg), and acepromazine (3 mg/kg), followed by transcardial perfusion as previously described [26,27]. After decapitation and cranial opening, the entire brain was rapidly excised. For gene expression analyses, tissues were perfused with PBS (pH 7.4), snap-frozen in liquid nitrogen, and stored at −80 °C. For immunohistochemical analyses, perfusion was performed with PBS (pH 7.4) followed by 4% paraformaldehyde (PFA, pH 7.4). Samples were post-fixed in PFA at 4 °C for 24 h, dehydrated through a graded ethanol series, and embedded in paraffin.
For subsequent histological analyses, the anatomical identification and quantitative analysis of the frontal cortex (FC), retrosplenial cortex (RSC), and other brain regions were performed in situ on intact coronal brain sections using a standardized neonatal rat brain atlas. Serial sections were consistently sampled at defined stereotaxic coordinates relative to Bregma. This atlas-guided approach enabled reliable delineation of the respective cortical regions and ensured that cellular quantification was confined to the anatomically defined areas of interest.

2.4. RNA Extraction and Quantitative Real−Time PCR

As described previously [26,27,40,41], total RNA was isolated from whole snap-frozen cerebral tissue using peqGOLD RNAPure™ (PEQLAB Biotechnologie, Erlangen, Germany) according to the manufacturer’s protocol. Following DNase treatment, 2 µg of RNA was reverse-transcribed into cDNA.
Quantitative real-time PCR was conducted using qPCR BIO Mix Hi-ROX (NIPPON Genetics Europe, Düren, Germany). Target gene expression (Supplementary Table S1) was measured with the QuantStudio™ 5 Real-Time PCR System (Applied Biosystems, Thermo Fisher Scientific Inc., Waltham, MA, USA). Fluorescent reporter and quencher-labeled probes were used for detection. All samples were analyzed in technical triplicates, and mean Ct values were used for calculation. Relative expression levels were calculated using the 2−ΔΔCt method [45]. Gene expression levels were normalized to hypoxanthine–guanine phosphoribosyltransferase (HPRT) as the internal reference. The underlying numerical 2−ΔΔCt datasets for the respective figures are provided in Supplementary Tables S2–S4.

2.5. Immunohistochemistry

Paraffin-embedded cerebral tissue was sectioned at 5 µm, mounted on SuperFrost Plus slides, deparaffinized in xylene substitute (ROTI®Histol, Carl Roth, Karlsruhe, Germany, Cat. 6640), and rehydrated through graded ethanol. Heat-induced antigen retrieval was performed in citrate buffer (pH 6.0) in a microwave oven for 10 min at 600 W; for cleaved caspase-3 (cCasp3), this was followed by additional pretreatment with 3% H2O2 and intermediate washes in PBS and distilled water. Non-specific binding was blocked for 1 h at room temperature using antibody-specific blocking solutions (for Pax6/PCNA and cCasp3: 2% (v/v) goat serum, 1% (w/v) BSA, 0.1% (v/v) Triton X-100, 0.05% (v/v) Tween-20, 0.1% (w/v) gelatin in PBS; for Calb1 and NeuN: 3% (w/v) BSA, 0.2% (v/v) Triton X-100 in PBS). Sections were then incubated overnight at 4 °C with the respective primary antibodies diluted in antibody diluent (Zymed Laboratories, San Francisco, CA, USA, Cat. ZUC103): rabbit anti-PAX6 (GeneTex Europe GmbH, Freising, Germany, Cat. GTX113241, 1:250) together with mouse anti-PCNA (Abcam, Cambridge, UK, Cat. ab29, 1:500), mouse anti-Calbindin (Abcam, Cat. ab75524, 1:500), mouse anti-NeuN (Merck Millipore, Darmstadt, Germany, MAB377, 1:200), or rabbit anti-cleaved caspase-3 (Cell Signal Technology, Danvers, MA, USA, Cat. 9661, 1:400). After PBS washing, appropriate fluorophore-conjugated secondary antibodies were applied for 1 h at room temperature (goat anti-mouse Alexa Fluor 488, Thermo Fisher Scientific, Schwerte, Germany, Cat. A11001, 1:200; goat anti-rabbit Alexa Fluor 594, Thermo Fisher Scientific, Cat. A11037, 1:200; or goat anti-rabbit Alexa Fluor 488, Thermo Fisher Scientific, Cat. A11034, 1:200), followed by nuclear counterstaining with DAPI (Sigma-Aldrich, Taufkirchen, Germany, Cat. D9542, 1:1000 in PBS for 10 min). Finally, sections were washed in PBS and coverslipped with Immu-Mount (Thermo Fisher Scientific, Cat. 9990412). For all staining, species- and isotype-matched IgG controls were processed in parallel under identical conditions to verify specificity of the immunolabeling.

2.6. TUNEL Staining

As described previously [41], paraffin-embedded sections were cut (5 μm), deparaffinized in ROTI®Histol twice for 10 min each, rehydrated in descending ethanol series, and rinsed in phosphate-buffered saline for 3 min each at room temperature. After deparaffinization of sections, an in situ detection of cells with DNA-strand breaks was performed by the TUNEL labeling method using a TdT-FragEL DNA fragmentation detection kit (Merck Millipore) according to the manufacturer’s instructions. Negative controls were performed by substituting Tris-buffered saline for the TdT enzyme.

2.7. Image Acquisition and Quantification

2.7.1. Fluorescence Imaging

For qualitative analyses and quantification of PAX6/PCNA co-labeling, single Calb1 and NeuN staining, and cleaved caspase-3 (cCasp3), sections were digitized using a Keyence fluorescence microscope (BX800) equipped with BZ-II Viewer (version 01.03.00.01) and BZ-II Analyzer (version 1.1.2.4) software. Images were acquired with a 10× objective, and individual RGB channels were automatically merged before analysis. All images for a given staining, time point, and brain region were captured in a single session using identical exposure times and contrast/brightness settings across all experimental groups. Quantitative analyses were performed blinded to group allocation.
For PAX6/PCNA/DAPI staining, the dentate gyrus (DG) was evaluated with three DG sections per animal. PAX6-positive and PCNA-positive cells were first counted separately, followed by quantification of double-labeled PAX6/PCNA-positive cells. For Calb1 staining, Calb1-positive cells were quantified in the DG with three sections per animal. For NeuN staining, NeuN-positive cells were likewise counted in the DG with three sections per animal. For cCasp3 staining, cCasp3-positive cells were assessed in the DG (four sections per animal), the frontal cortex (FC; six non-overlapping fields per animal), and the retrosplenial cortex (RSC; six non-overlapping fields per animal).
For quantification of PAX6+, Calb1+, NeuN+, cCasp3+, and PCNA+ cells, predefined regions of interest were analyzed in each section, and cells were counted manually using Adobe Photoshop 22.0.0 (Adobe Systems Software Ireland Limited, Dublin, Ireland), with only minimal adjustment of image contrast. For each animal, the mean cell count across all analyzed sections was calculated. These individual animal means were then normalized to the mean value of the normoxic control group (set to 100%), and group data were expressed as the mean of each experimental group relative to this control reference.

2.7.2. Apoptosis Imaging and Evaluation

TUNEL-positive cells were evaluated in the frontal cortex (FC), retrosplenial cortex (RSC), hypothalamus (HTh), thalamus (Th), and hippocampus. For each animal, six non-overlapping fields were selected and analyzed in FC and RSC, and four non-overlapping fields per animal were evaluated in thalamus, and hypothalamus. The dentate gyrus (DG), including the hilum, was evaluated for a total of four DGs. For quantification of apoptotic cells, TUNEL-labeled sections counterstained with Methyl Green were analyzed using ImageJ (version 1.53). Digital images were processed with the Color Deconvolution plugin (using the H DAB) to separate Methyl Green-stained nuclei from TUNEL-positive signals. After background subtraction and automated thresholding with the Otsu method, a watershed algorithm was applied to the nuclear masks to resolve overlapping cells prior to quantification. For each animal, the mean cell count across all analyzed sections was calculated. These individual animal means were then normalized to the mean value of the normoxic control group (set to 100%), and group data were expressed as the mean of each experimental group relative to this control reference.

2.8. Statistical Analyses

Before study initiation and ethics approval, the required sample size per experimental group was determined a priori using G*Power software (version 3.1.2), and the resulting group sizes were adhered to throughout the study. For graphical presentation and statistical evaluation, data were displayed as box-and-whisker plots, in which the box represents the interquartile range and the horizontal line within the box denotes the median, while the whiskers illustrate the data range beyond the first and third quartiles.
Group differences were initially assessed using one-way analysis of variance (ANOVA). When the assumption of normality was not met, the non-parametric Kruskal–Wallis test was applied instead. Subsequent multiple pairwise comparisons were chosen according to the outcome of the omnibus test and performed using Bonferroni or Dunn’s post hoc procedures as appropriate. A p-value below 0.05 was considered statistically significant. All statistical analyses and figure preparations were conducted with GraphPad Prism (version 8.0; GraphPad Software, La Jolla, CA, USA).

3. Results

3.1. Modulation of Oxidative Stress Markers by Dexmedetomidine

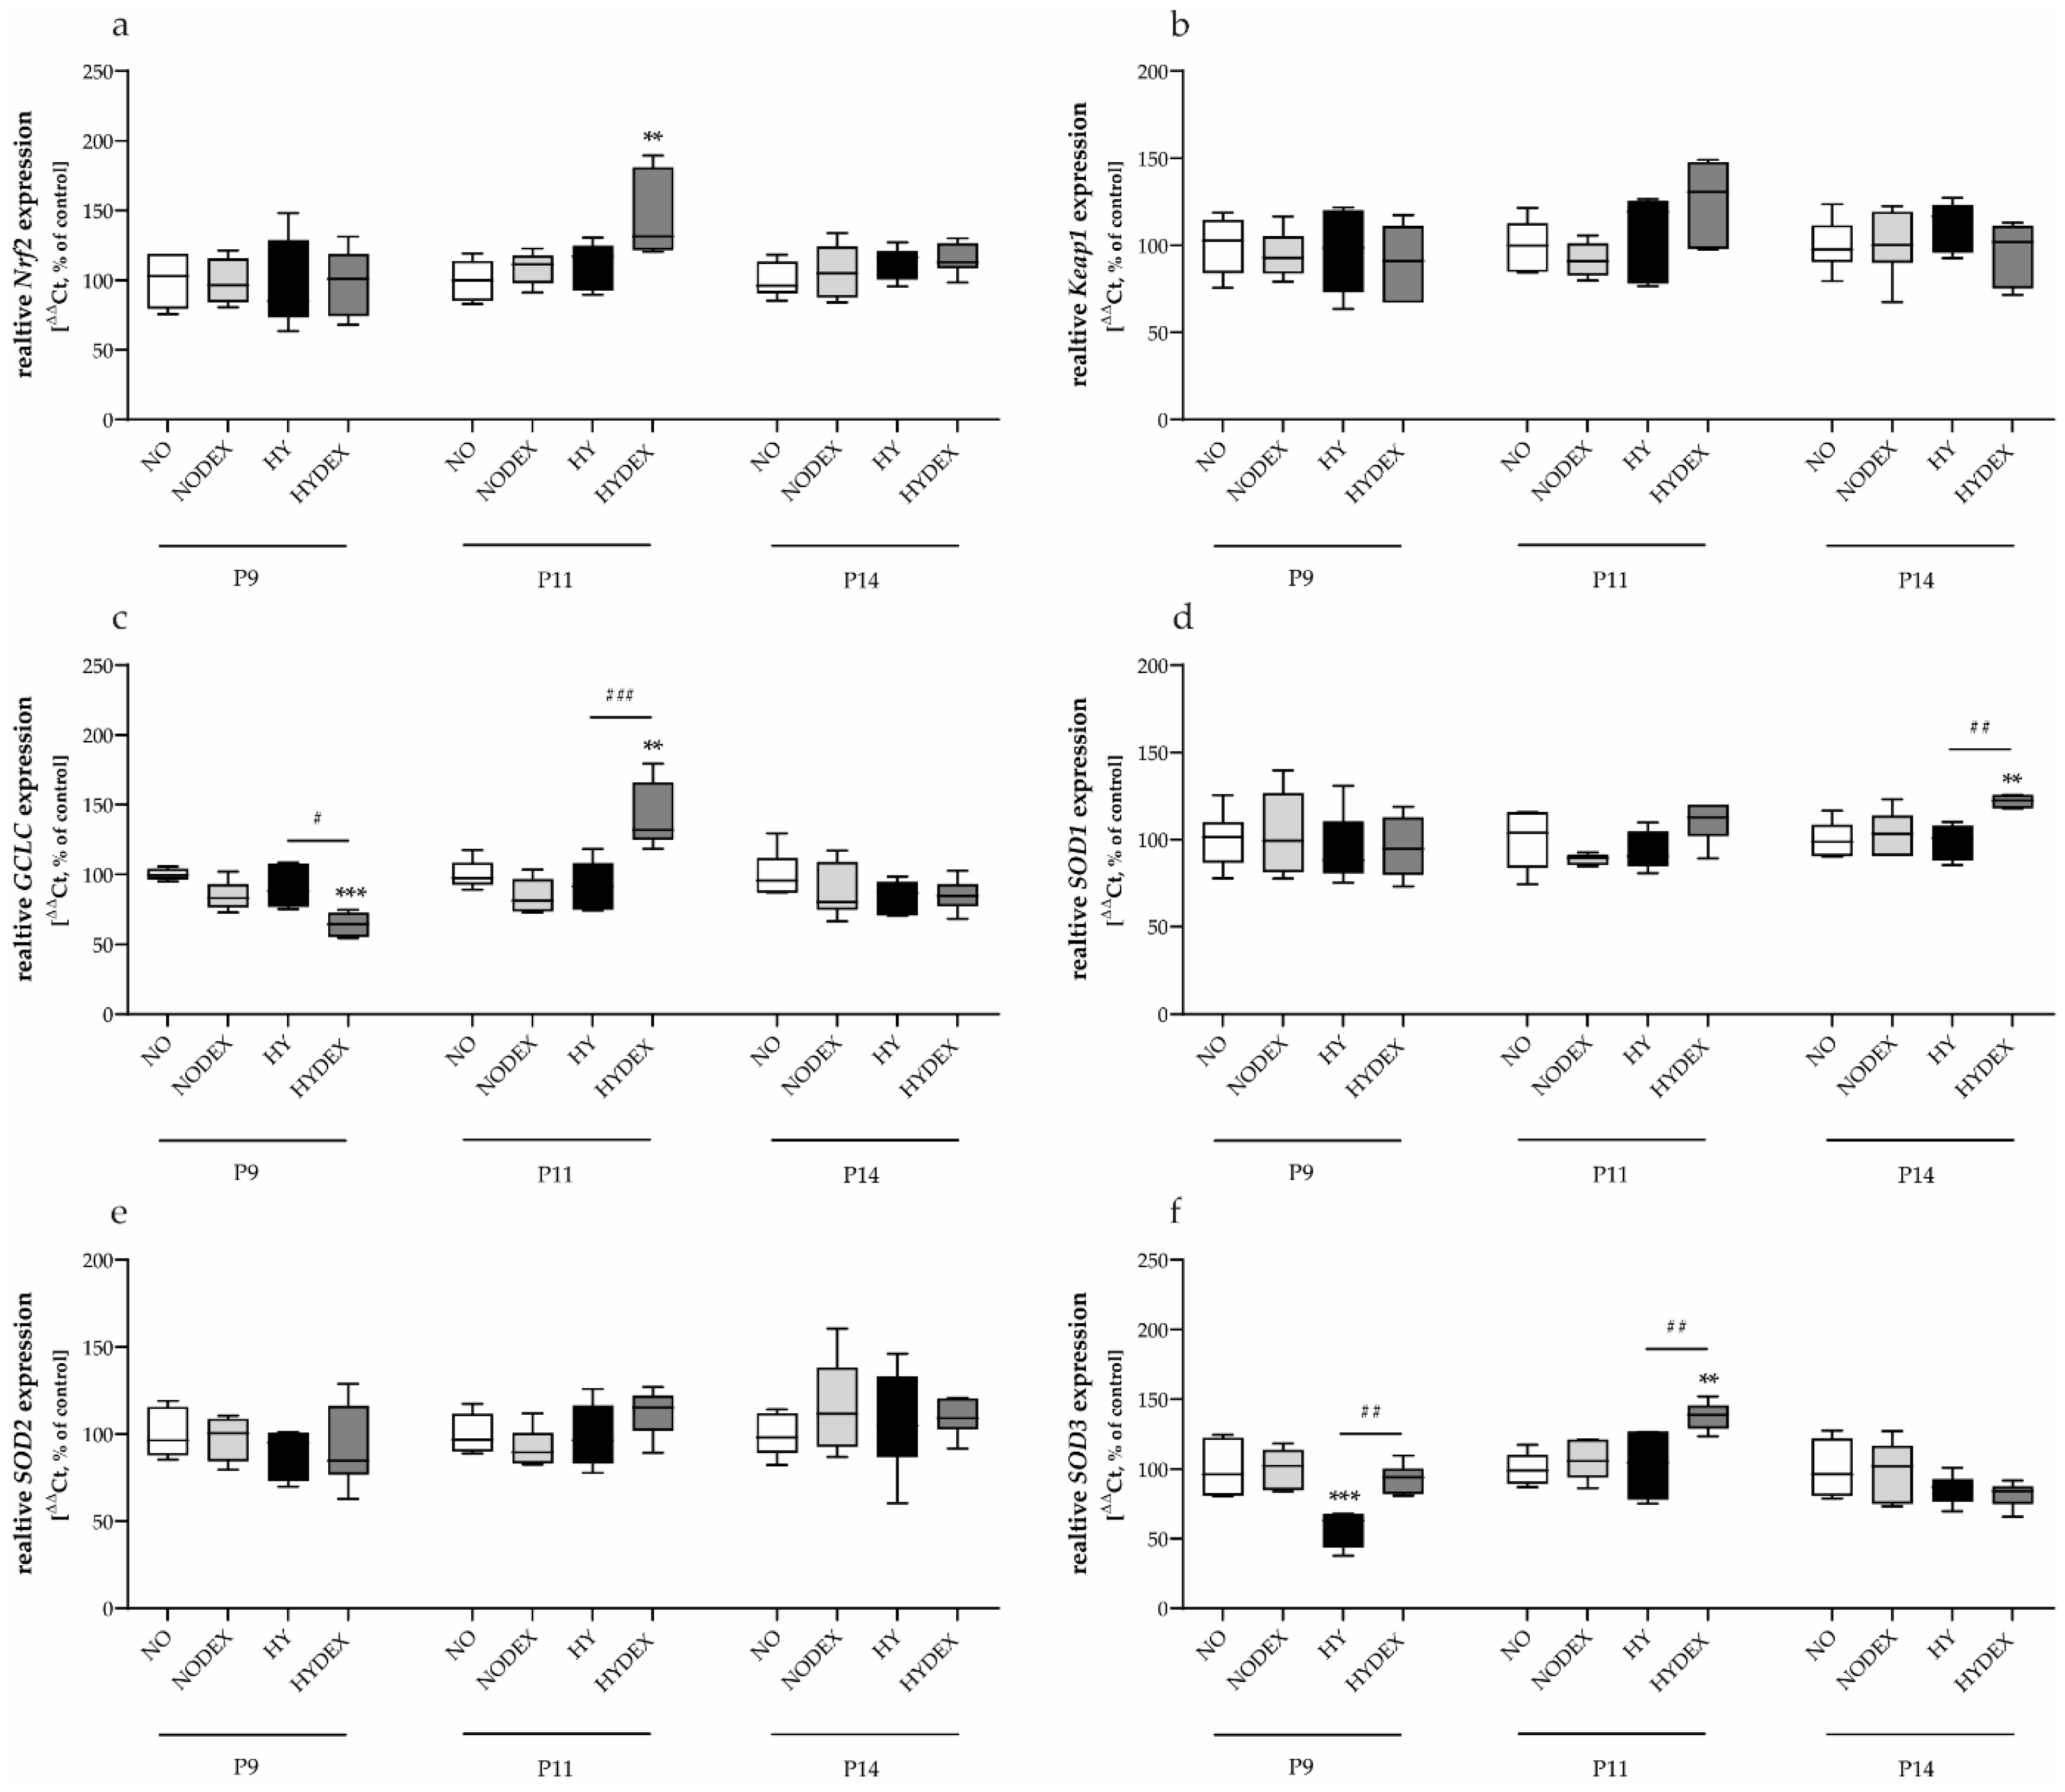
To evaluate the impact of hyperoxia and the potential protective role of dexmedetomidine (DEX) on the antioxidant defense system, we analyzed the expression of key oxidative stress markers across three postnatal time points (Figure 1). While the transcript levels of Nrf2, Keap1, GCLC, SOD1, and SOD2 (Figure 1a–e) remained largely stable across the observation period, exposure to hyperoxia (HY) triggered a restricted immediate response defined by the significant downregulation of SOD3 at P9 (Figure 1f).
In contrast, DEX administration under hyperoxic conditions (HYDEX) elicited a robust antioxidant signature. While GCLC transcription was initially suppressed at P9, it was significantly upregulated by P11 (Figure 1c). This mid-term response was accompanied by a marked increase in Nrf2 expression at P11 (Figure 1a). Furthermore, DEX treatment led to a sustained elevation of SOD3 levels at both P9 and P11 (Figure 1f), followed by a late-stage induction of SOD1 at P14 (Figure 1d). No significant alterations were observed for Keap1 or SOD2 in the HYDEX group (Figure 1b,e).

3.2. Attenuation of Hyperoxia-Induced Apoptosis and Autophagic Dysregulation

High oxygen tension significantly triggered programmed cell death pathways; a phenomenon effectively mitigated by DEX (Figure 2 and Figure 3).

3.2.1. Apoptosis

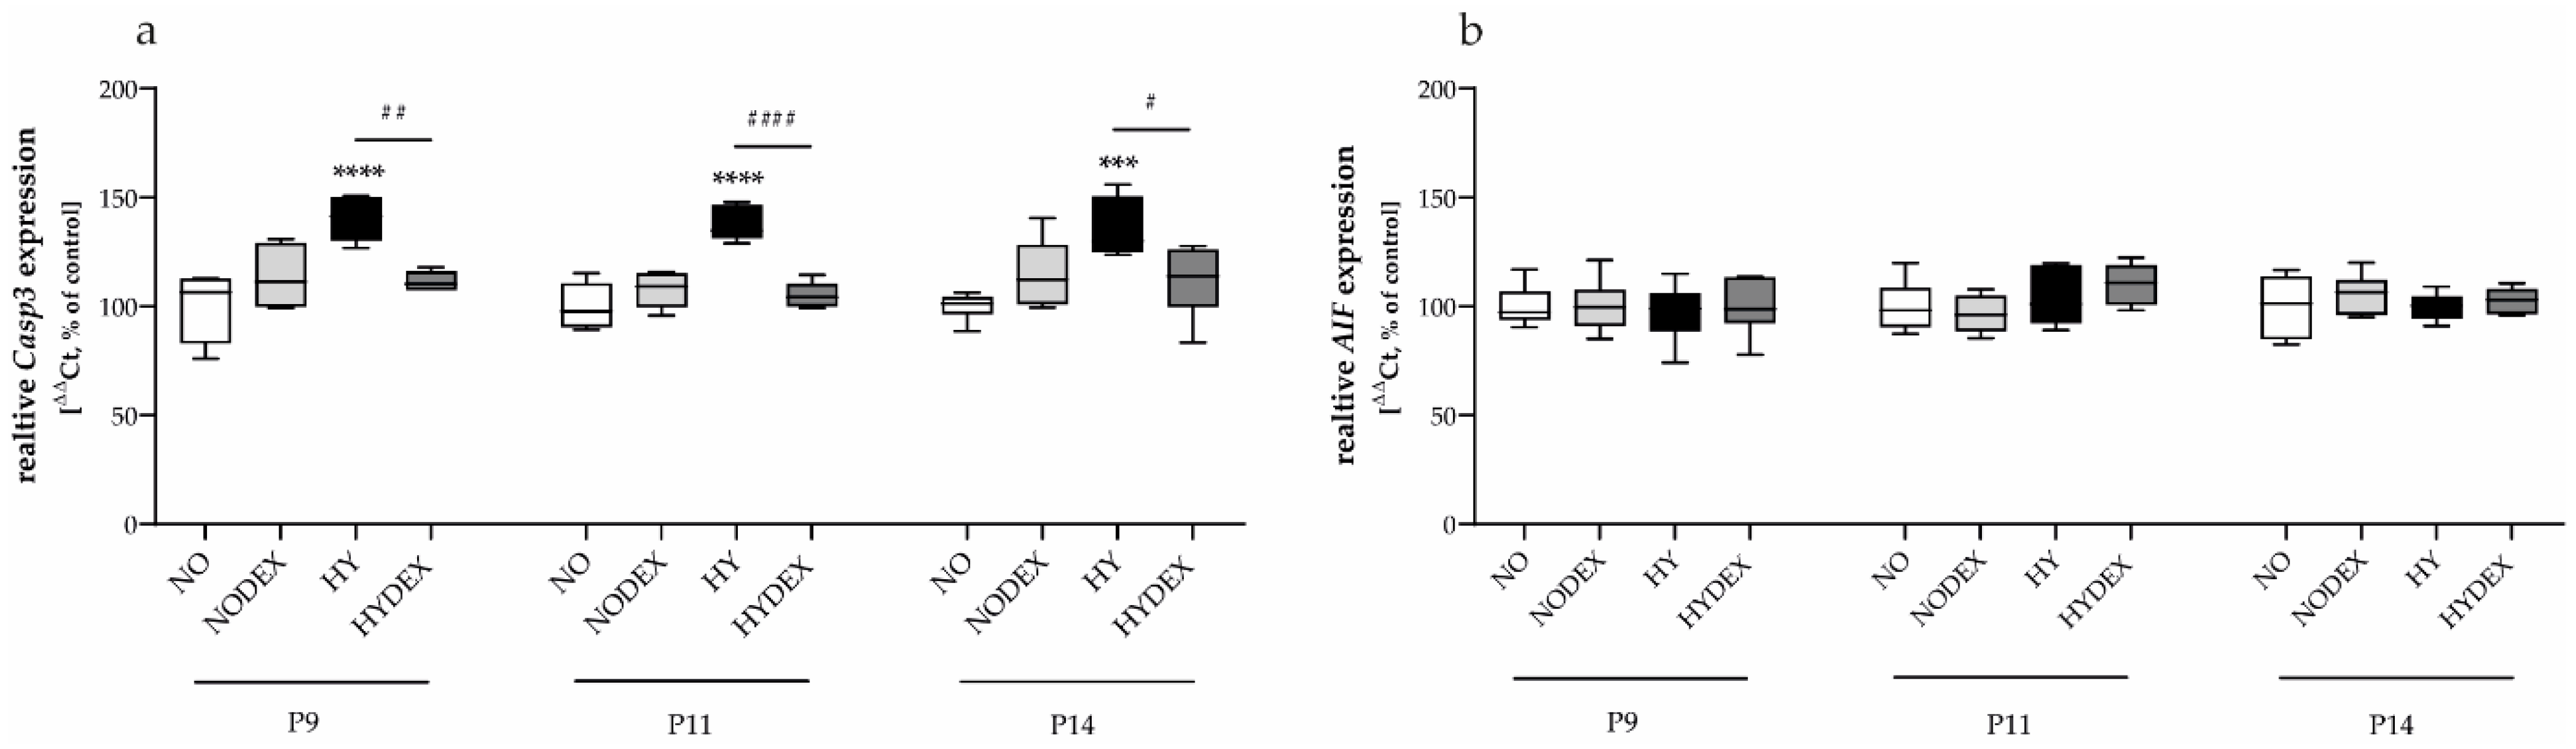
Hyperoxia exposure induced a persistent pro-apoptotic state, evidenced by the significant upregulation of Casp3 mRNA from P9 through P14 (Figure 2a). This was substantiated by immunohistochemical analyses showing a surge in TUNEL-positive cells within the frontal cortex (FC) and retrosplenial cortex (RSC) at all time points, and the hypothalamus (HTh) until P11 (Table 1). Similarly, cleaved caspase-3 (cCasp3) expression was markedly elevated in the FC, RSC, and hippocampus (HC) throughout the study (Table 2). Notably, AIF expression remained stable under HY conditions (Figure 2b).
Treatment with DEX (HYDEX) significantly reversed these trends. A consistent reduction in Casp3 transcripts was observed across all measurement time points. This molecular rescue was mirrored at the cellular level, with a decrease in TUNEL-positive cells (Table 1) in the FC and RSC (P9–P14) and the HC (P9). Furthermore, DEX treatment effectively reduced cCasp3-positive cell counts (Table 2) in all analyzed regions (FC, RSC, and HC) from P9 to P14, indicating a widespread anti-apoptotic effect.

3.2.2. Autophagy

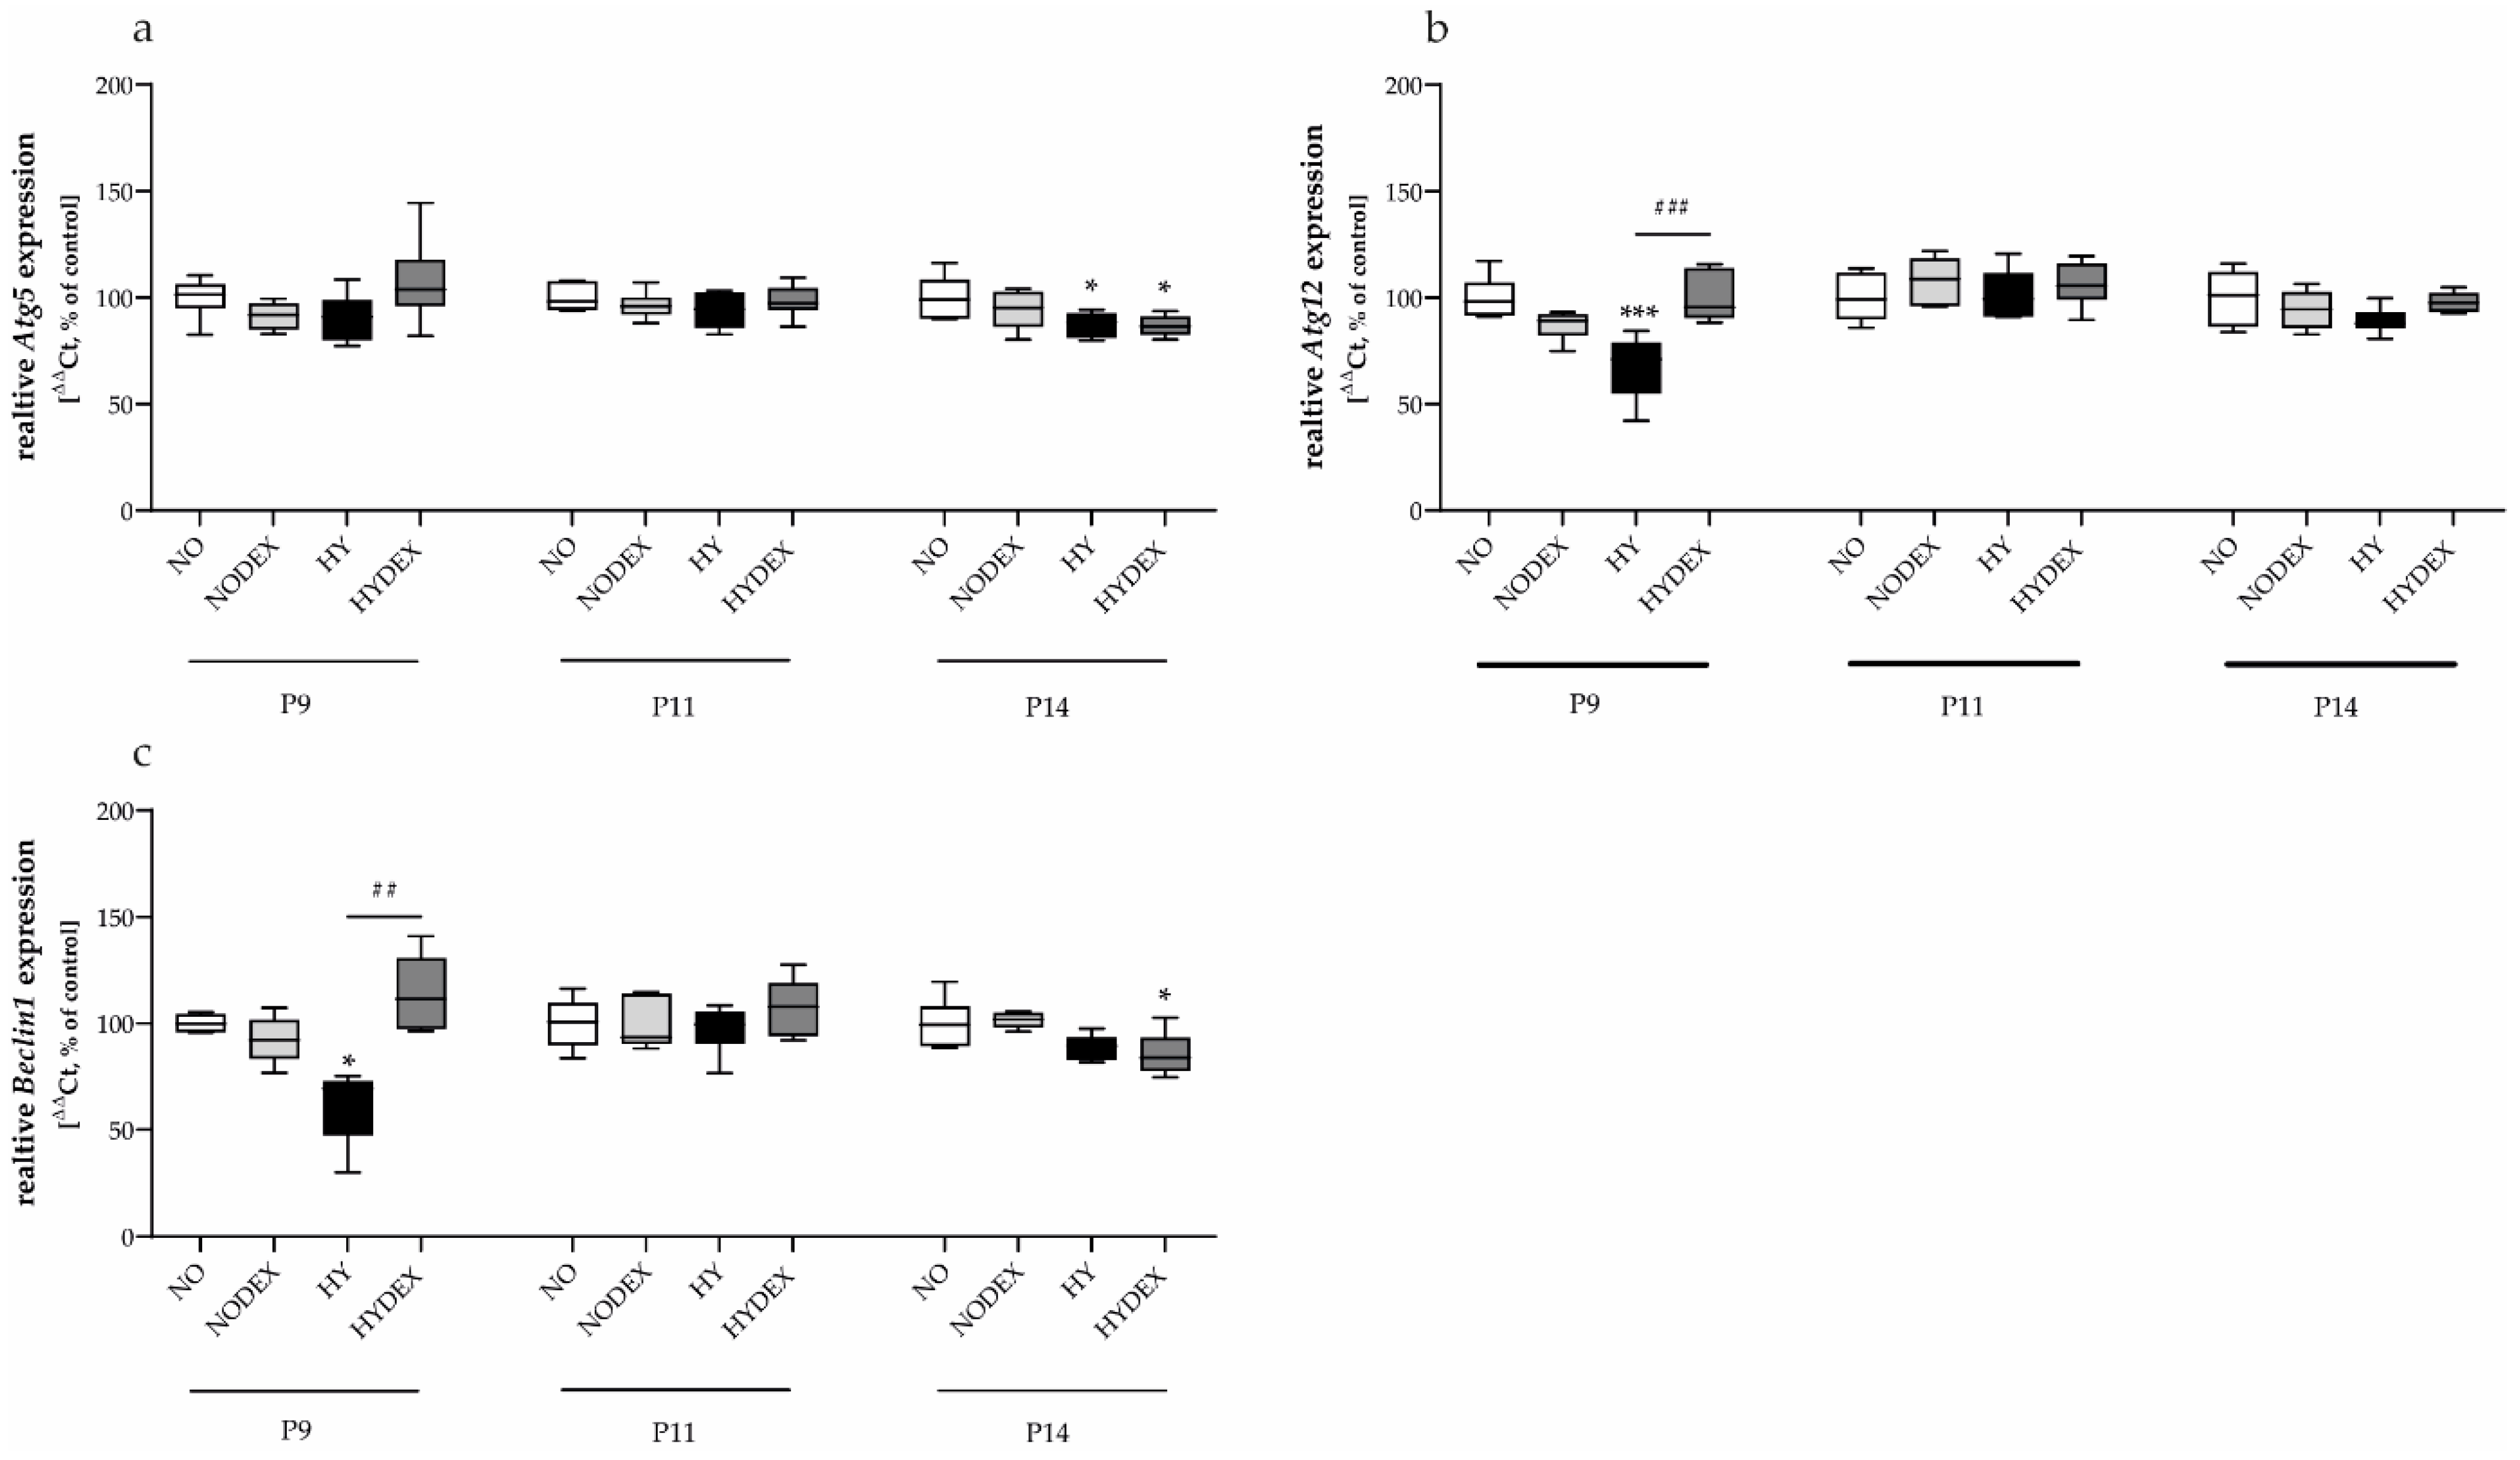
The autophagic machinery, also, was sensitive to oxygen fluctuations (Figure 3). Hyperoxia led to a transient downregulation of Atg12 (Figure 3b) and Beclin1 at P9 (Figure 3c), followed by a late-stage reduction in Atg5 at P14 (Figure 3a). DEX administration (HYDEX) appeared to prime the autophagic response, significantly increasing Atg12 and Beclin1 expression at P9 (Figure 3b,c), although Atg5 levels remained low at P14, similar to the HY group (Figure 3a).

3.3. Preservation of the Radial Glia Pool and Glial Identity

The impact of hyperoxia on early neural progenitor cells and subsequent glial development was profound, with DEX showing significant regenerative potential (Figure 4, Figure 5 and Figure 6).
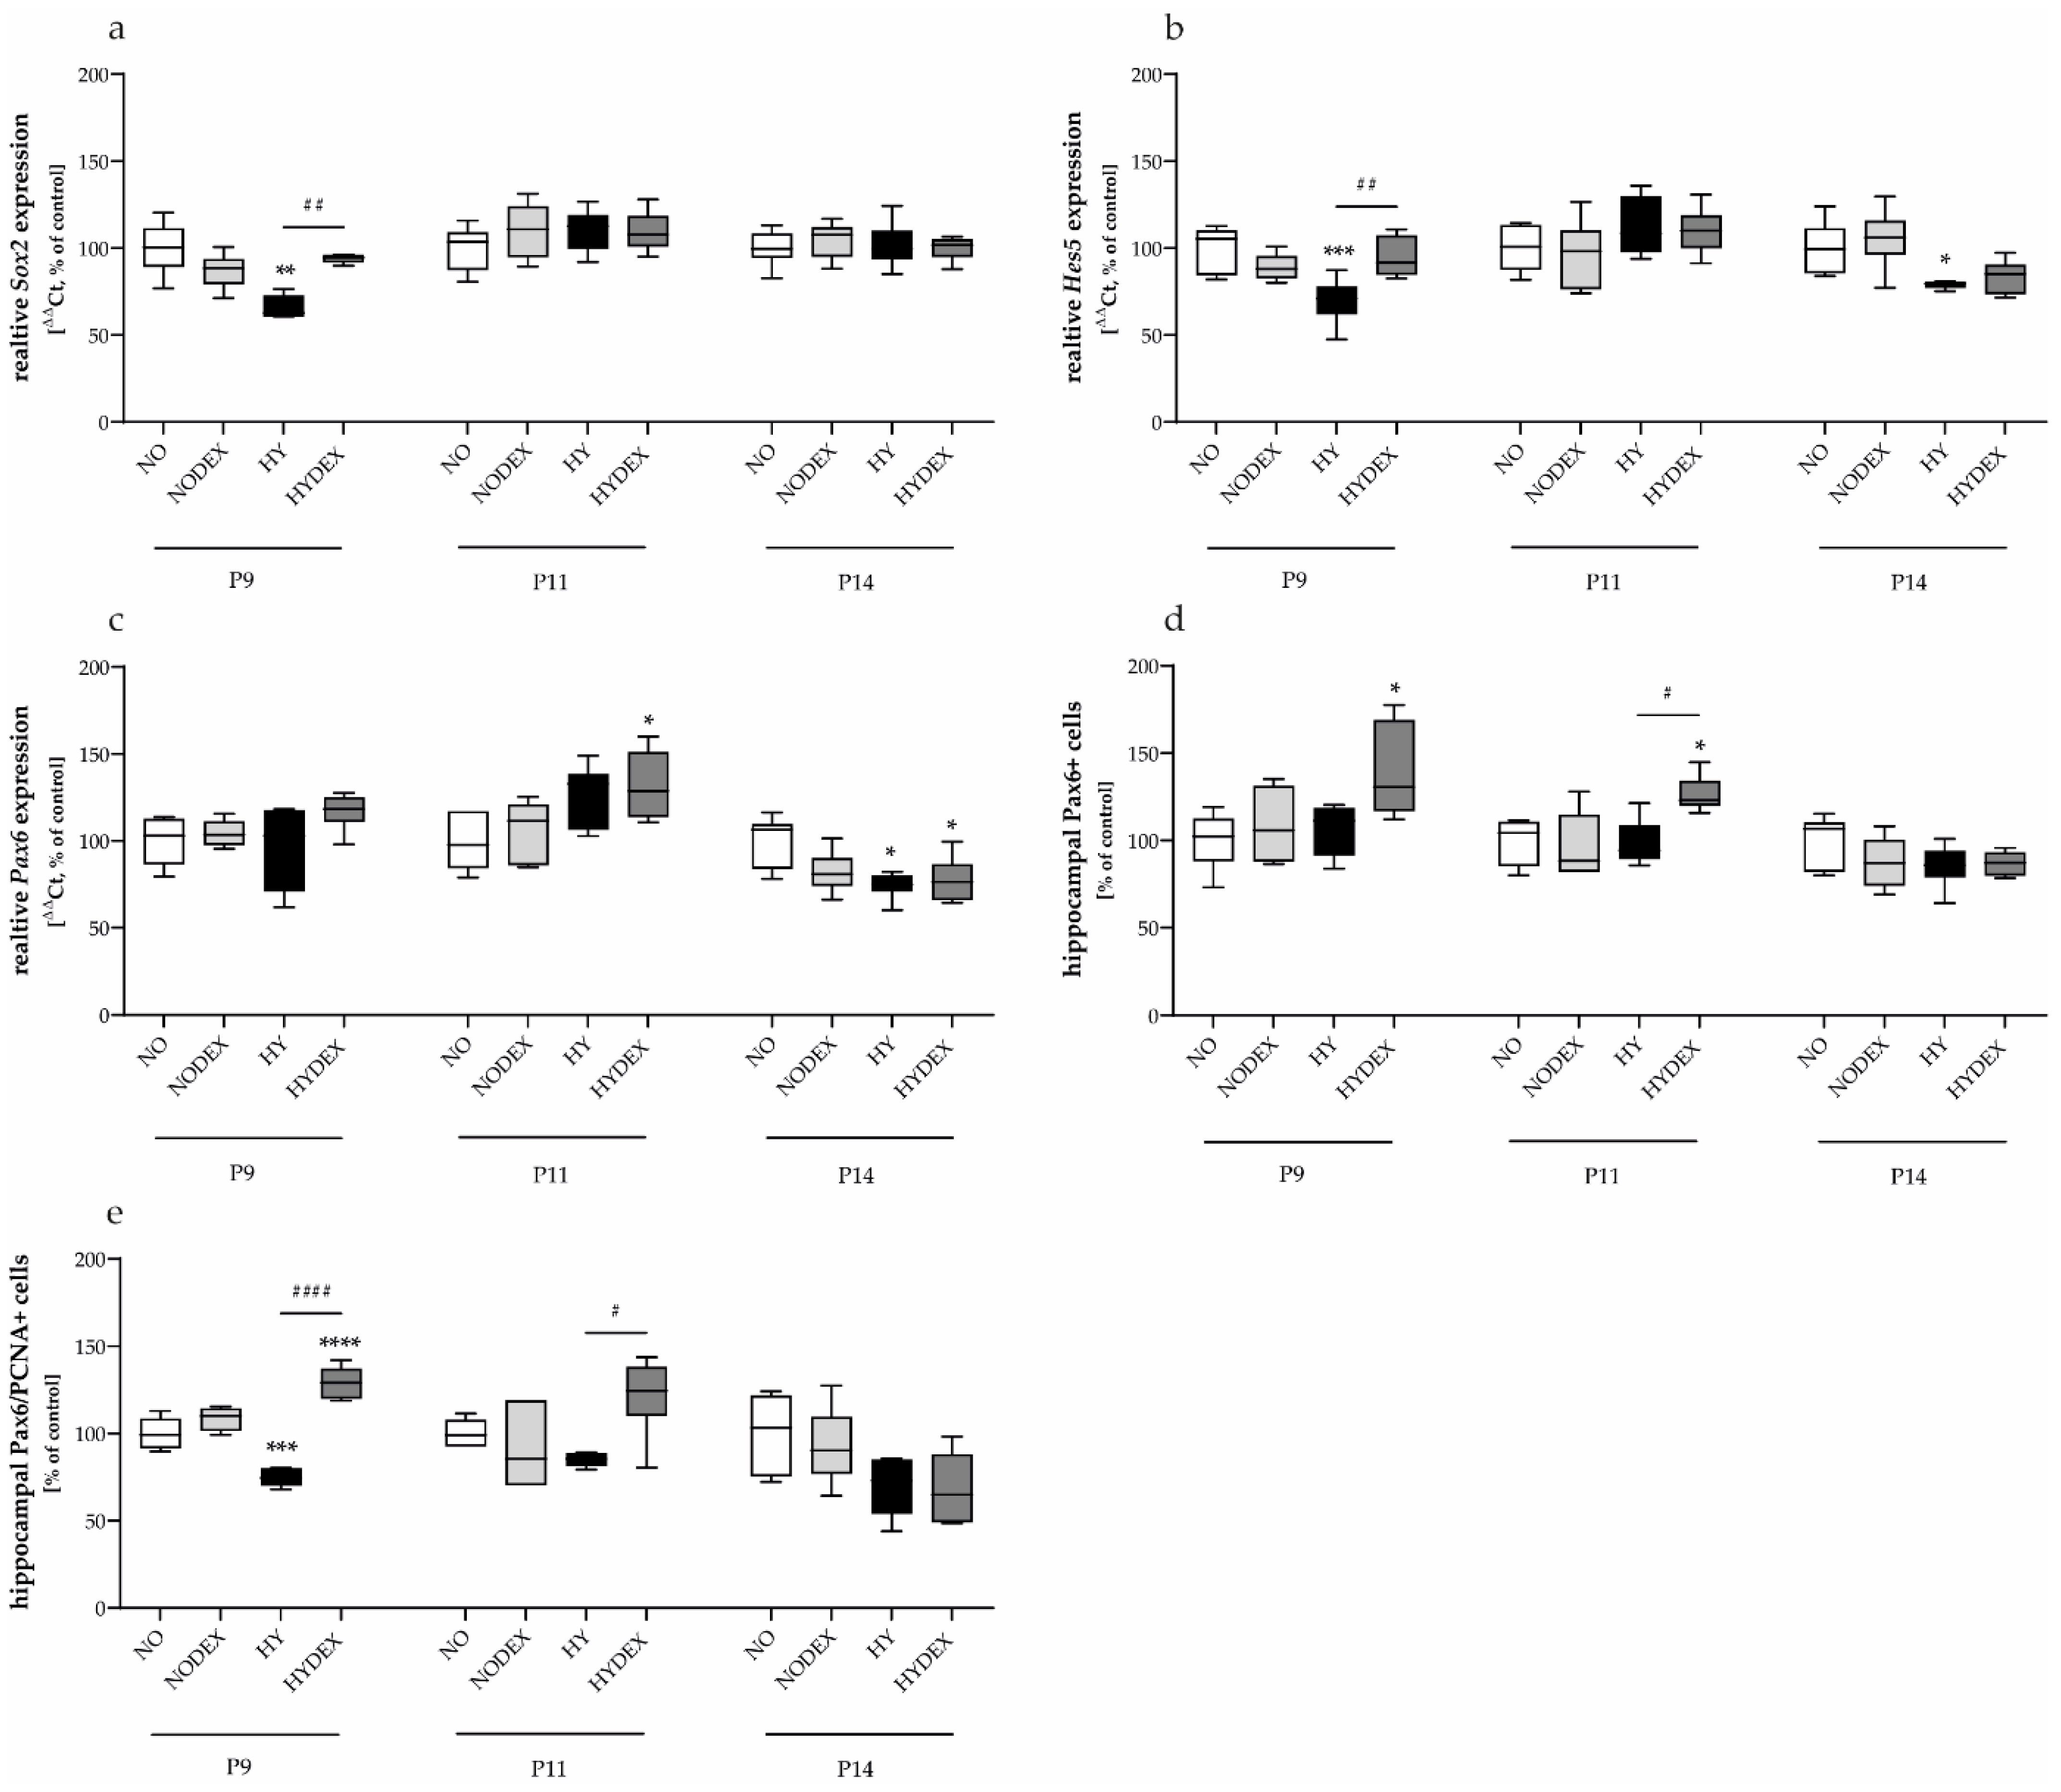
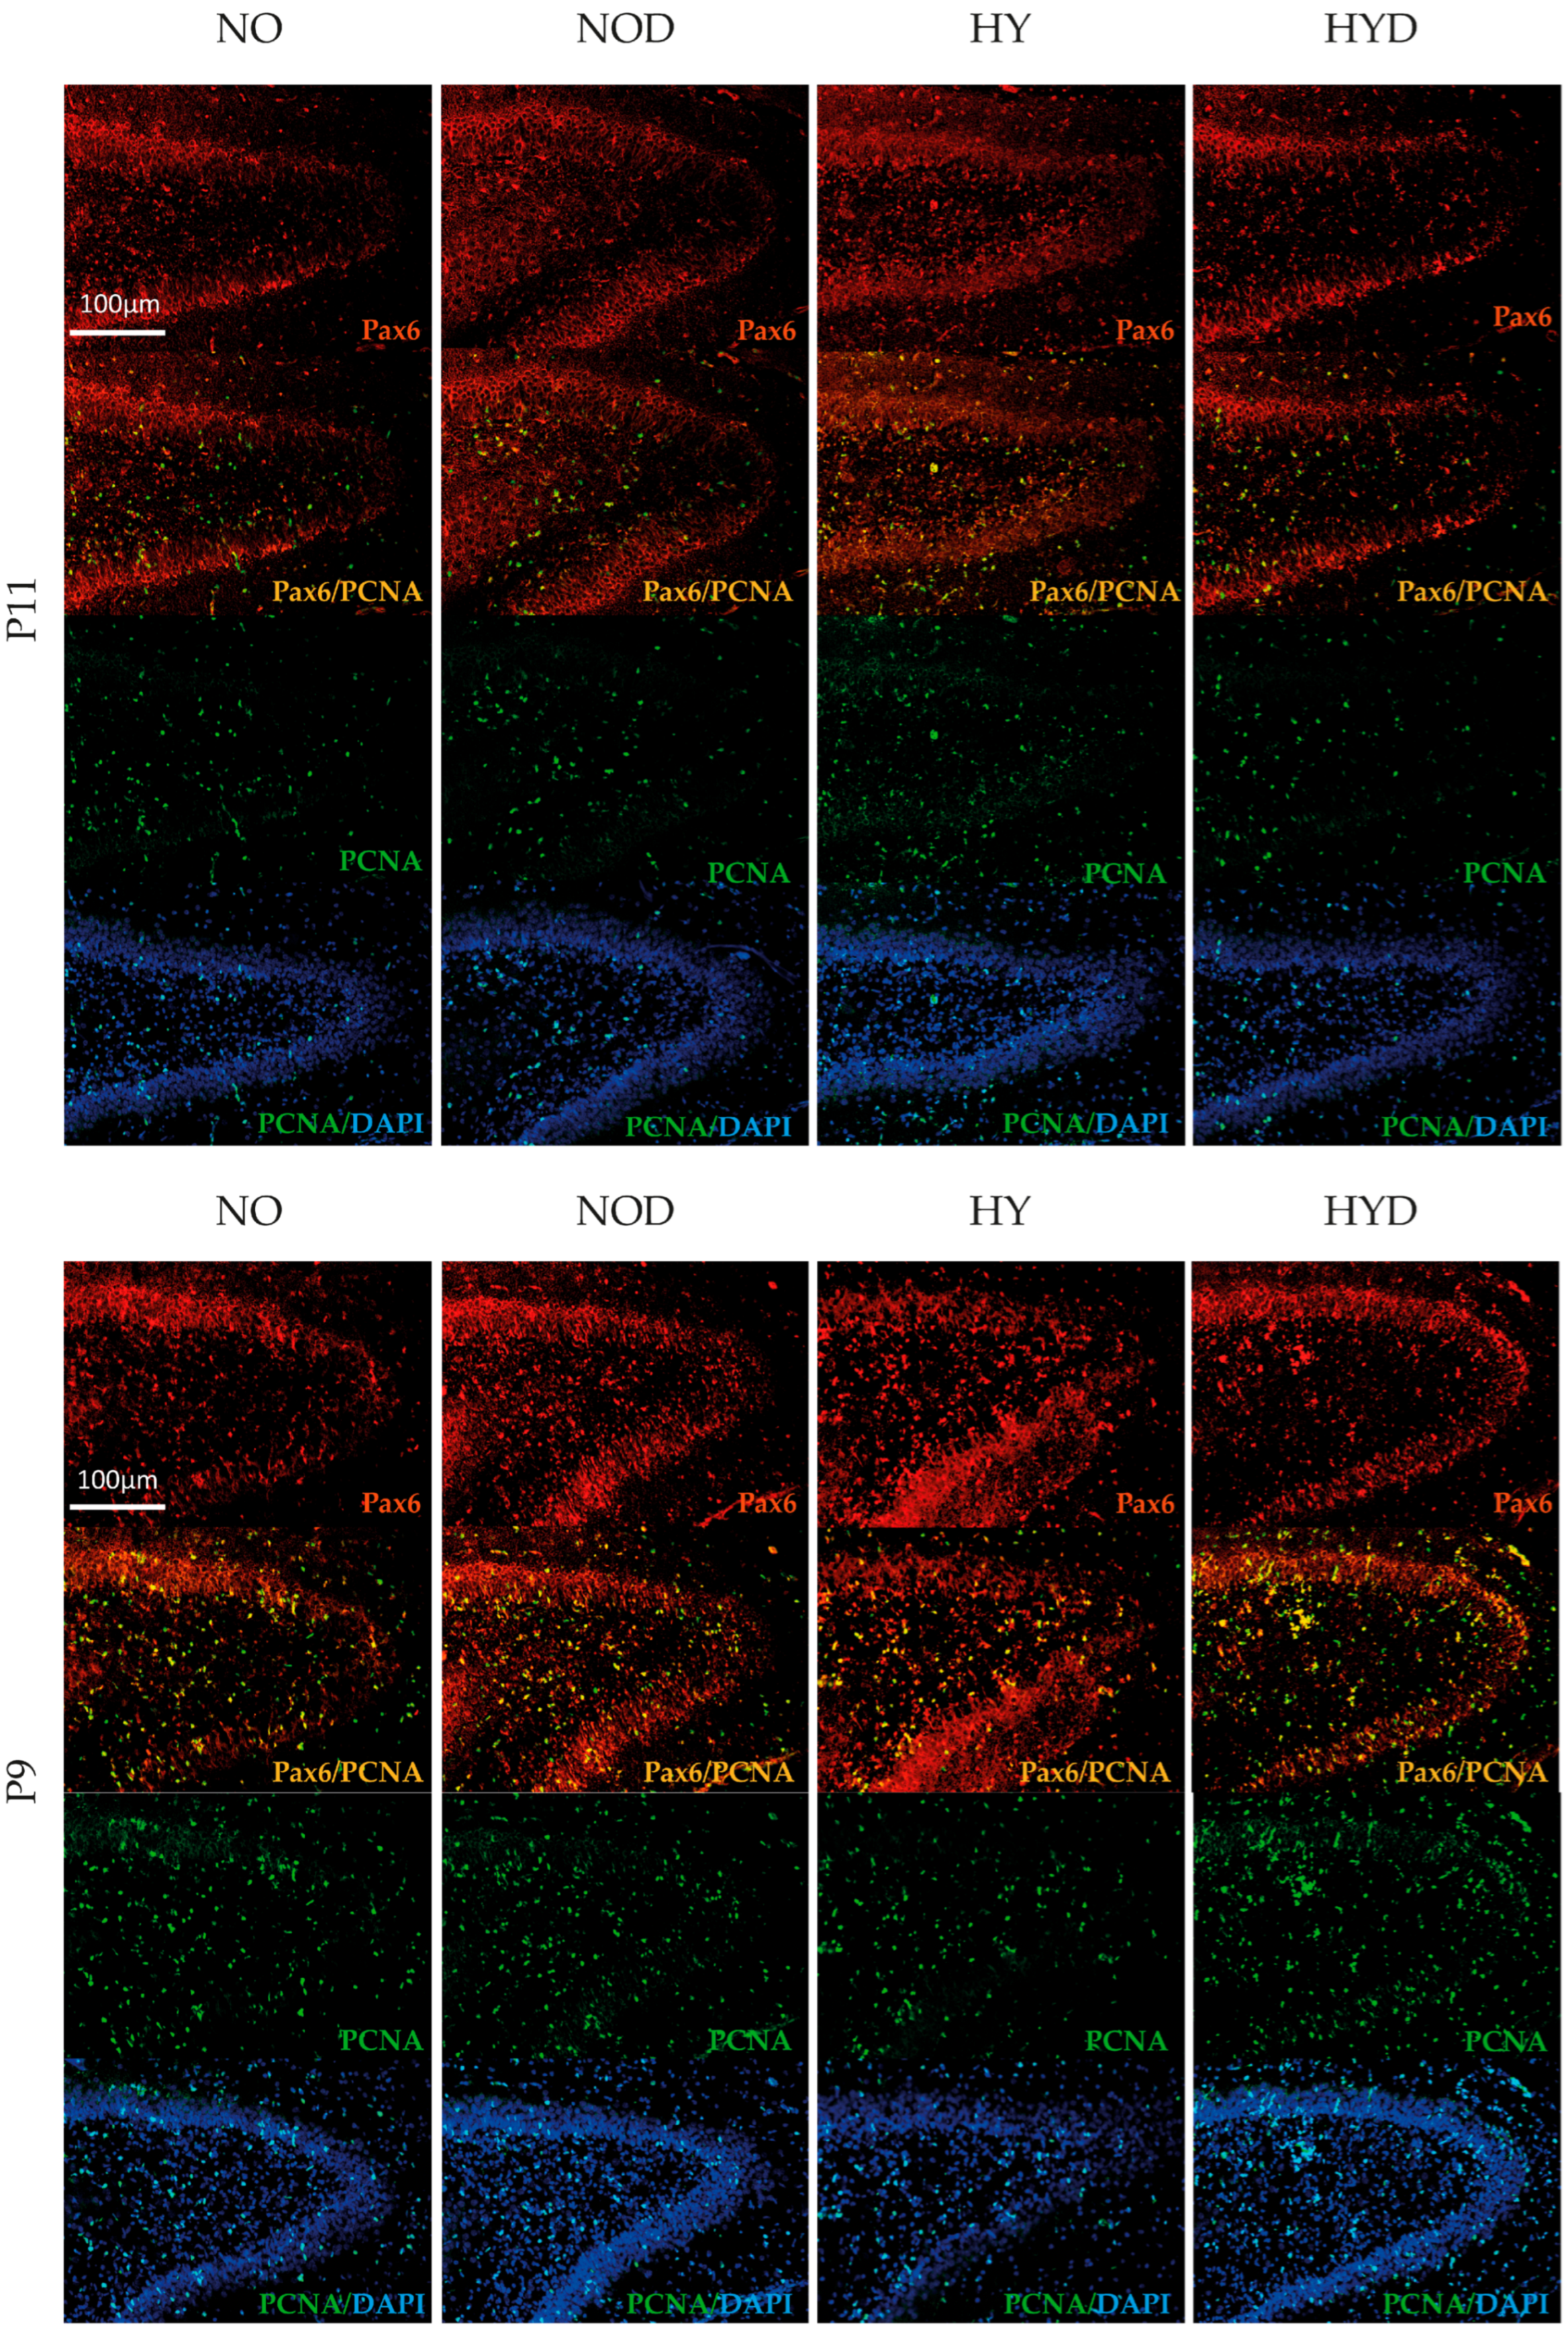
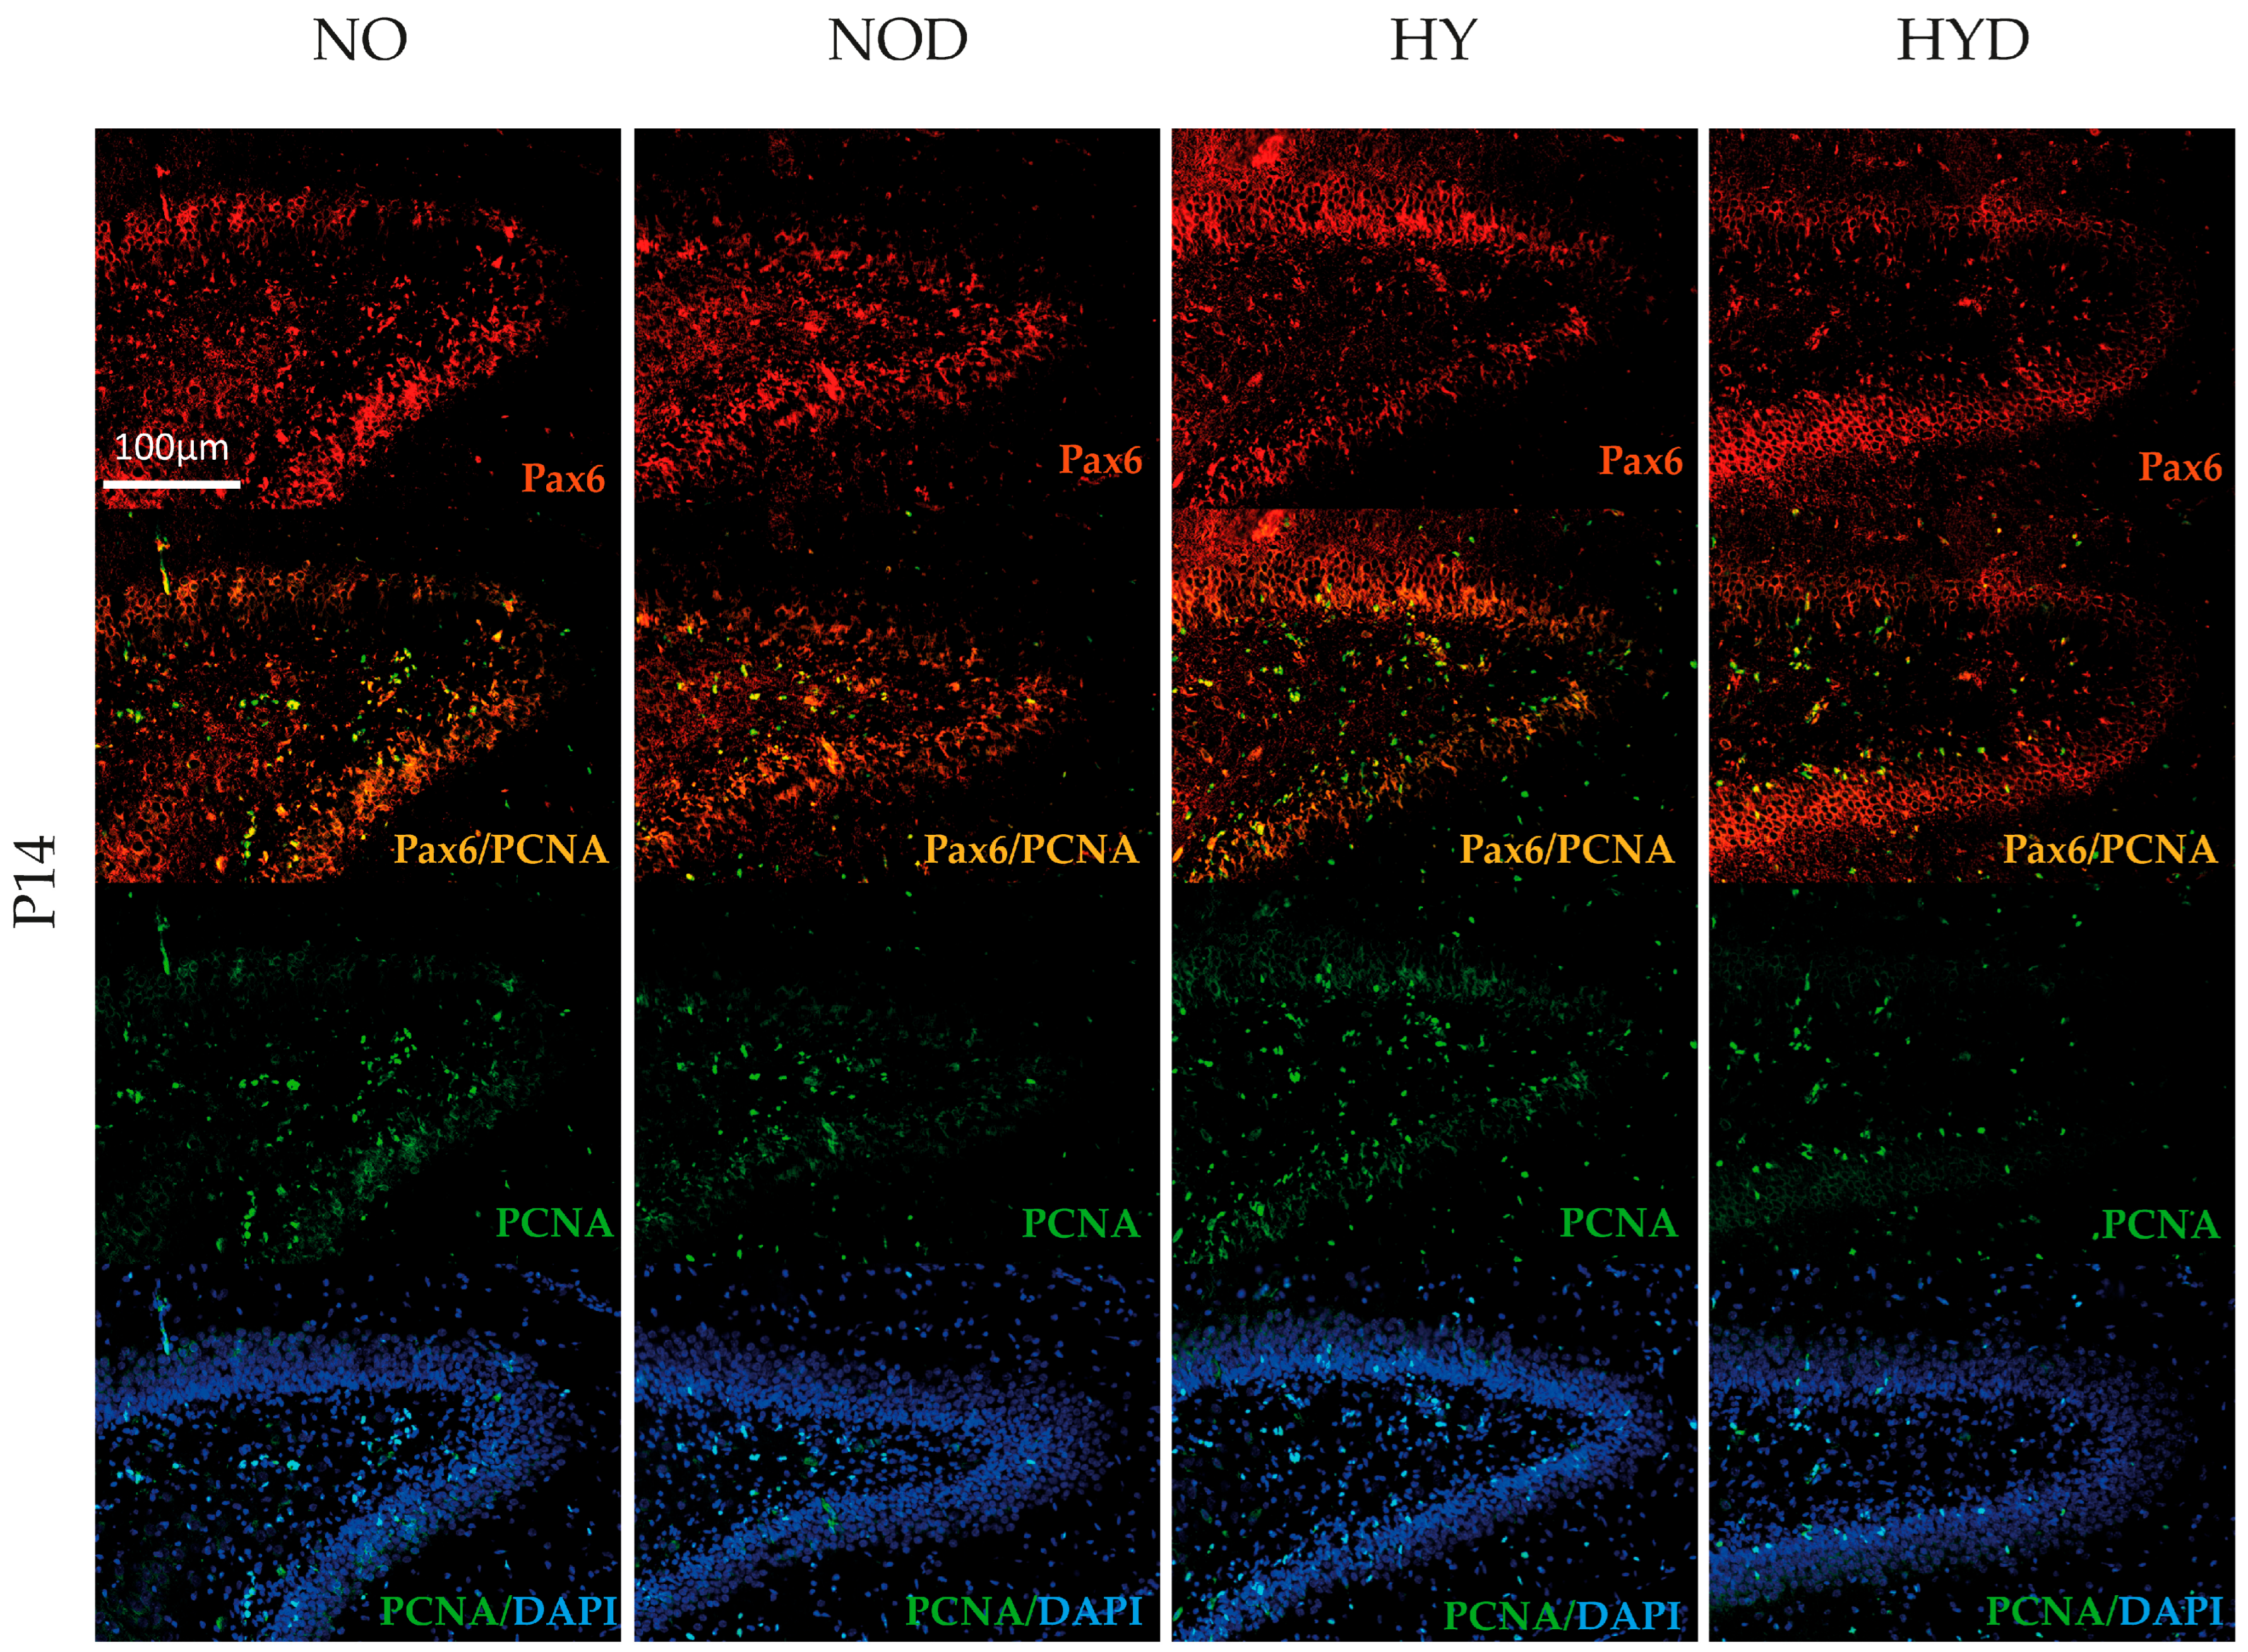
Hyperoxia significantly impaired the radial glia-like cell population, as shown by the downregulation of Sox2 and Hes5 at P9 (Figure 4a,b) and Pax6 at P14 (Figure 4c). Immunohistochemical evaluation of the dentate gyrus (DG) confirmed reduction in proliferating Pax6/PCNA-double-positive progenitors at P9 (Figure 4e), while single Pax6 labeled cells were not reduced (Figure 4d).
Representative immunohistochemical analysis corroborated the quantitative findings within the progenitor niche of the dentate gyrus (DG). At P9, while the overall intensity of the Pax6-labeled pool appeared stable, hyperoxia (HY) was associated with a selective reduction in actively dividing progenitors, as indicated by a significant decrease in Pax6/PCNA double-positive cells (Figure 5, upper panel). In the subsequent developmental stages, hyperoxia exposure showed no discernible influence on the Pax6+ lineage; both the total number of Pax6+ cells and their proliferating (Pax6/PCNA+) fractions remained comparable to control levels at P11 (Figure 5, middle panel) and P14 (Figure 5, lower panel).
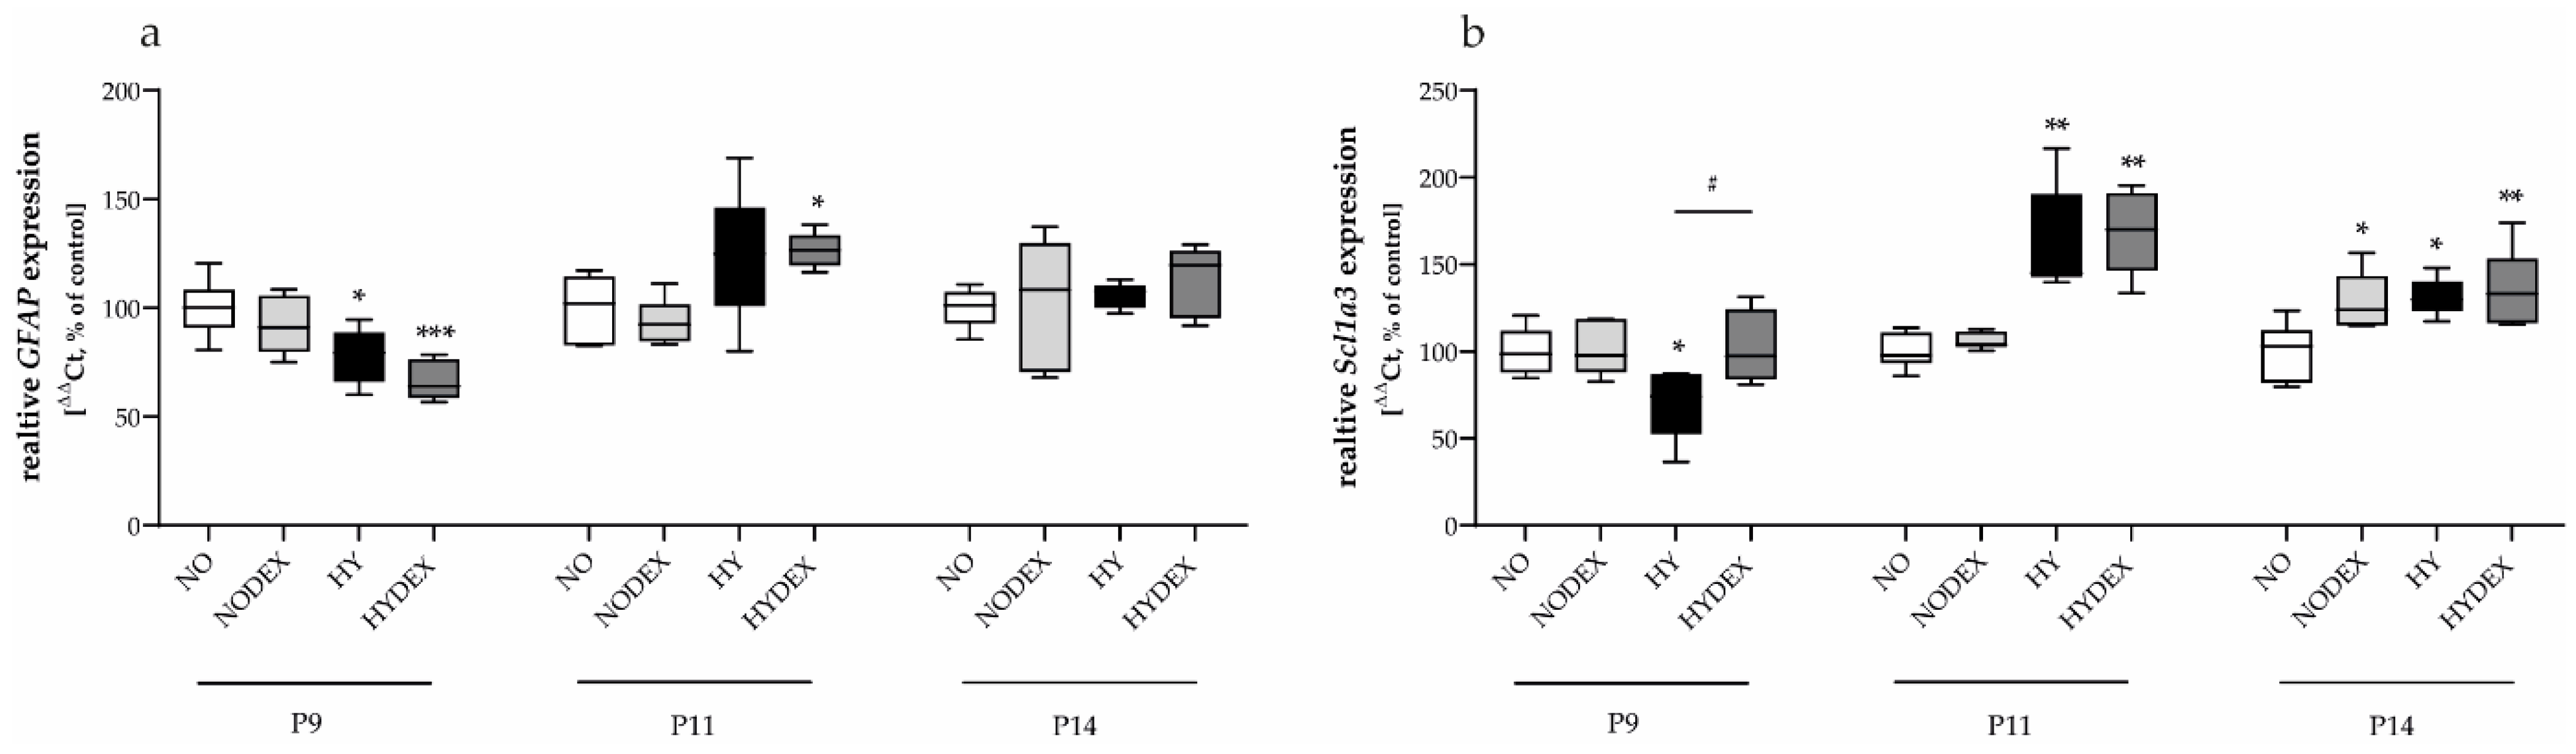
Furthermore, glial markers GFAP and Slc1a3 were downregulated at P9, though Slc1a3 showed a compensatory increase by P11–P14 (Figure 6a,b).
DEX treatment (HYDEX) successfully counteracted these deficits. An immediate upregulation of Sox2 and Hes5 was observed at P9 (Figure 4a,b). In the DG, DEX promoted the expansion of the progenitor pool, evidenced by an increase in Pax6-positive cells at P11 (Figure 4d) and a significant rise in Pax6/PCNA-positive proliferating cells at both P9 and P11 (Figure 4e).
DEX administration was associated with changes in the progenitor population under hyperoxic conditions. At P9, DEX treatment neutralized the hyperoxia-induced inhibitory effect, acting as a potent stimulus that substantially elevated the density of mitotic Pax6-positive cells (Figure 5, upper panel). This stimulatory influence persisted until P11 (Figure 5, middle panel); DEX significantly increased the counts of both the total Pax6+ population and the proliferating Pax6/PCNA+ progenitors. By P14 (Figure 5, lower panel), these lineage-specific effects reached a plateau, with no further significant differences observed in the mitotic or non-mitotic Pax6+ populations compared to the HY group.
Additionally, DEX restored GFAP levels to baseline (Figure 6a) and accelerated the normalization of Slc1a3 expression by P9 (Figure 6b).

3.4. Impact on Interneuron Lineages, Neurotrophins, and Neuronal Plasticity

We further examined the progression of interneuron development and the supportive neurotrophic environment required for neuronal maturation (Figure 7, Figure 8, Figure 9 and Figure 10).

3.4.1. Mitotic and Postmitotic Interneurons

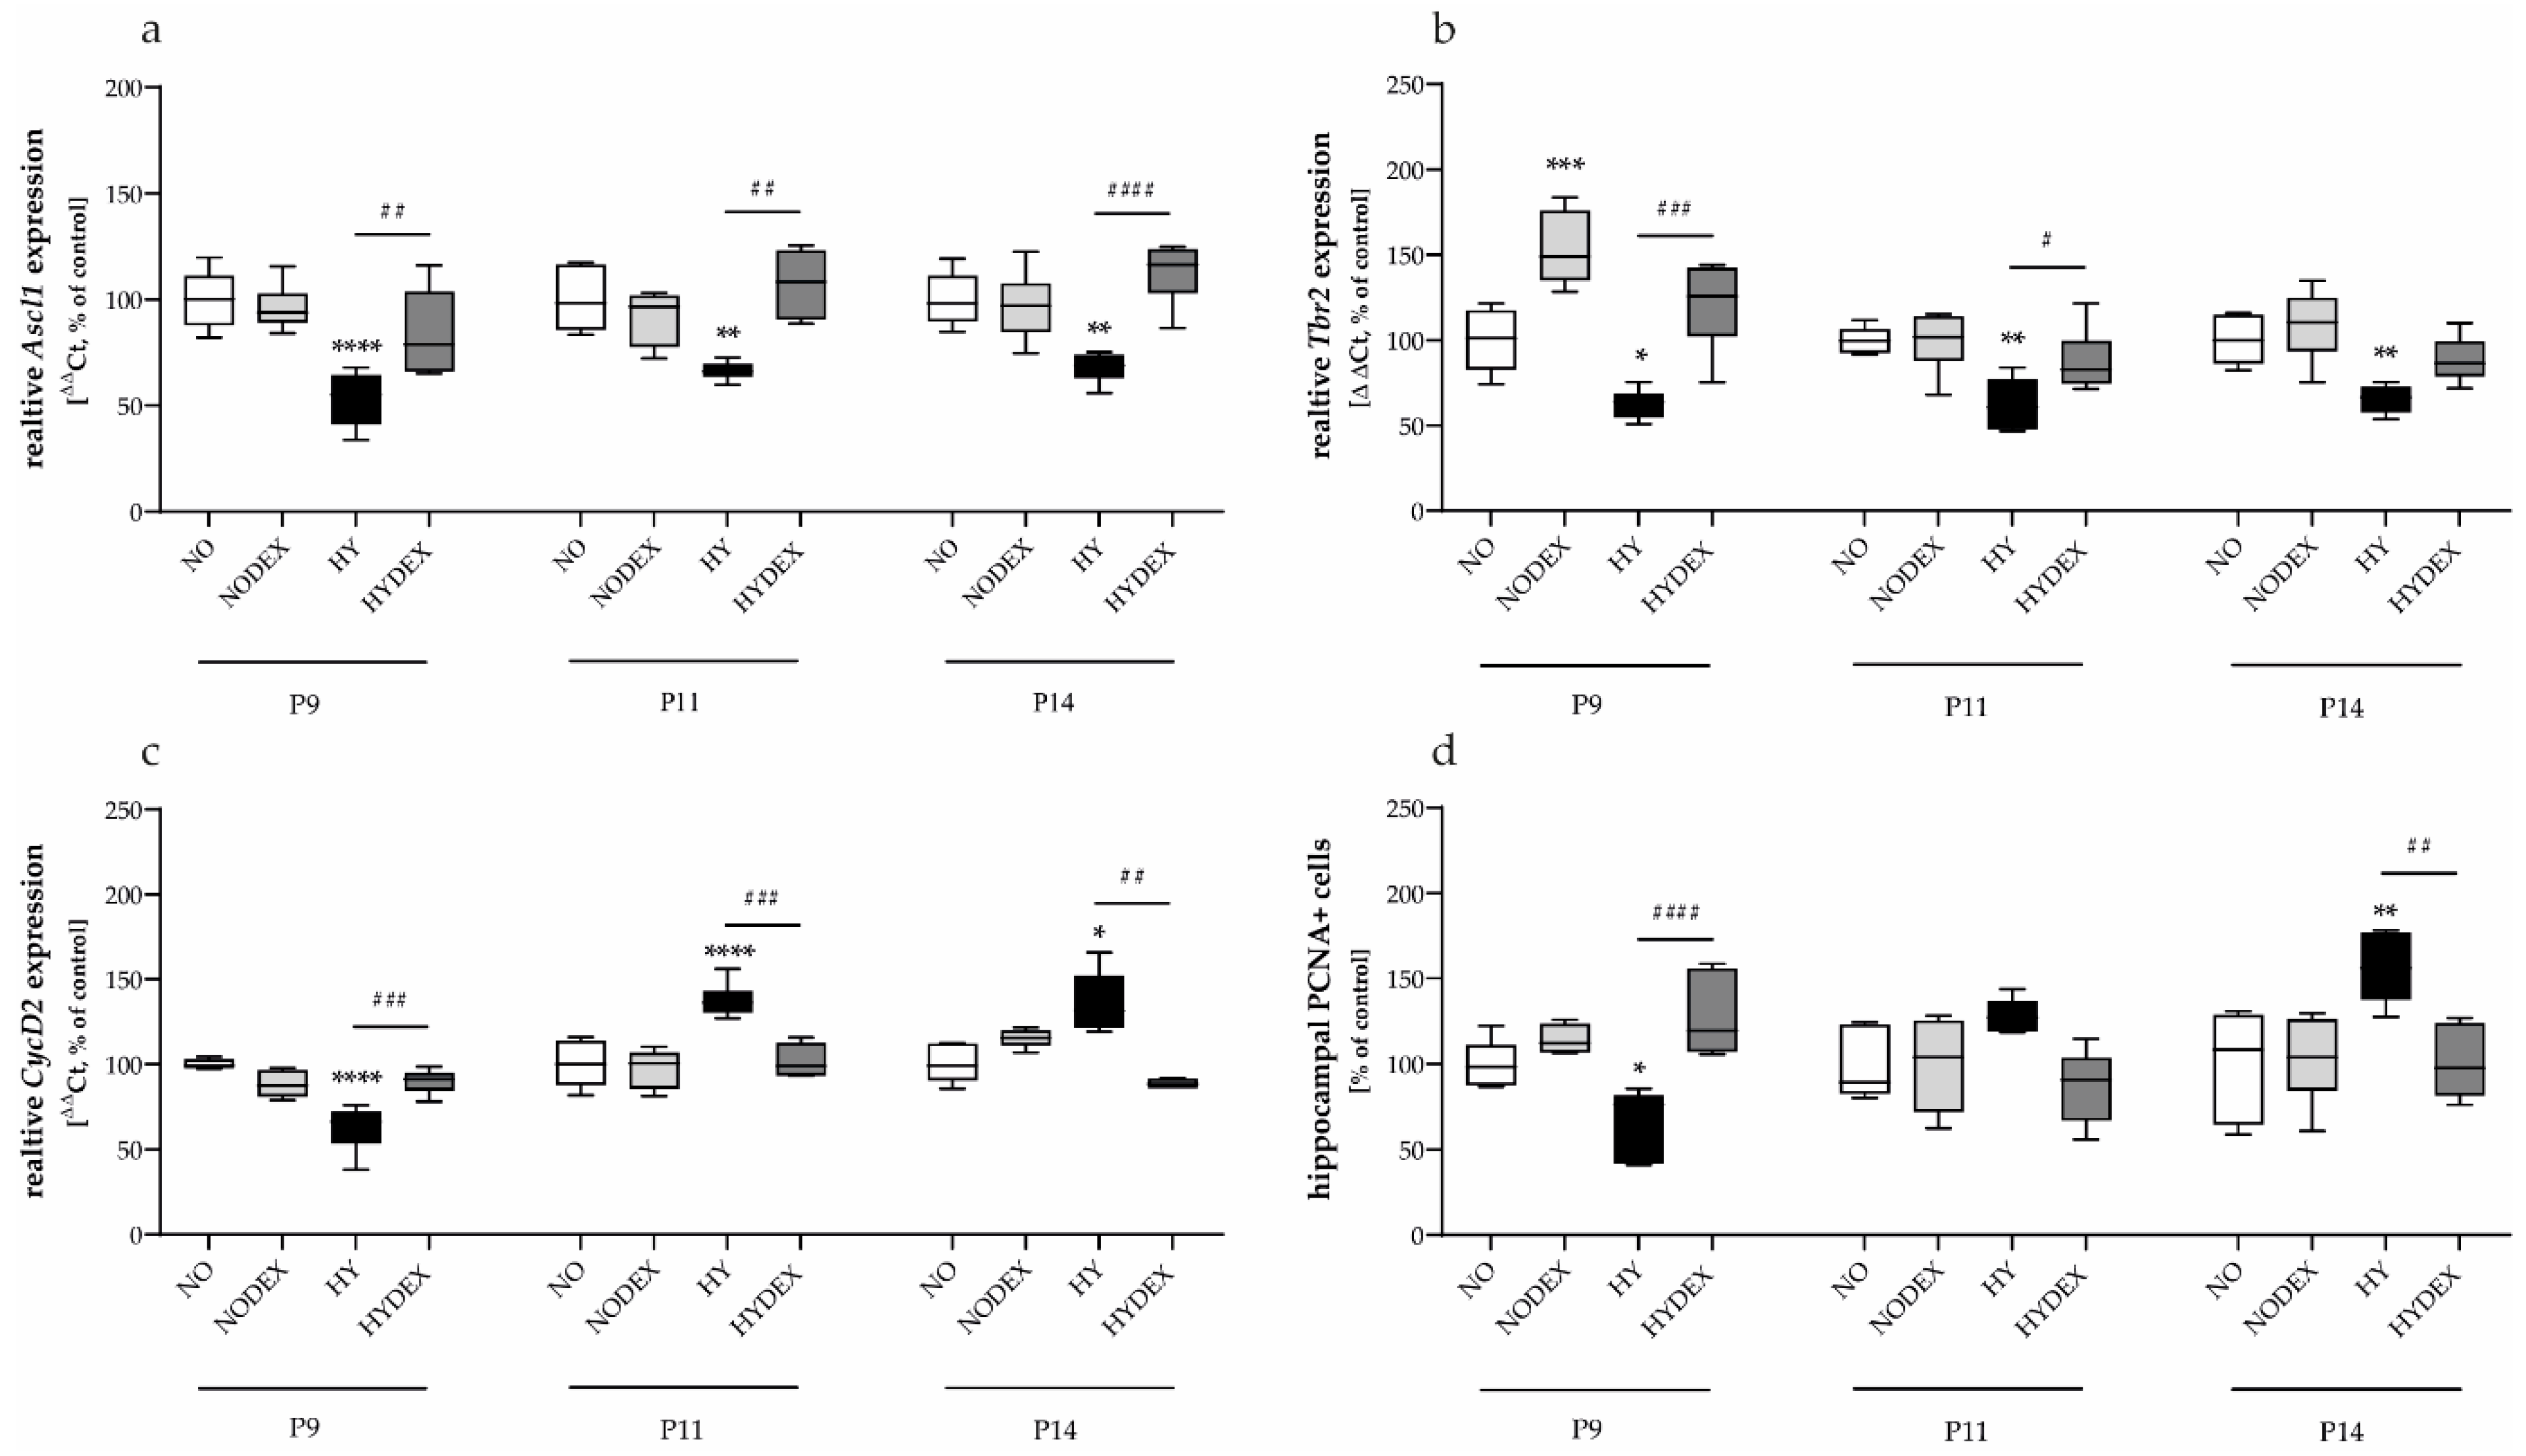
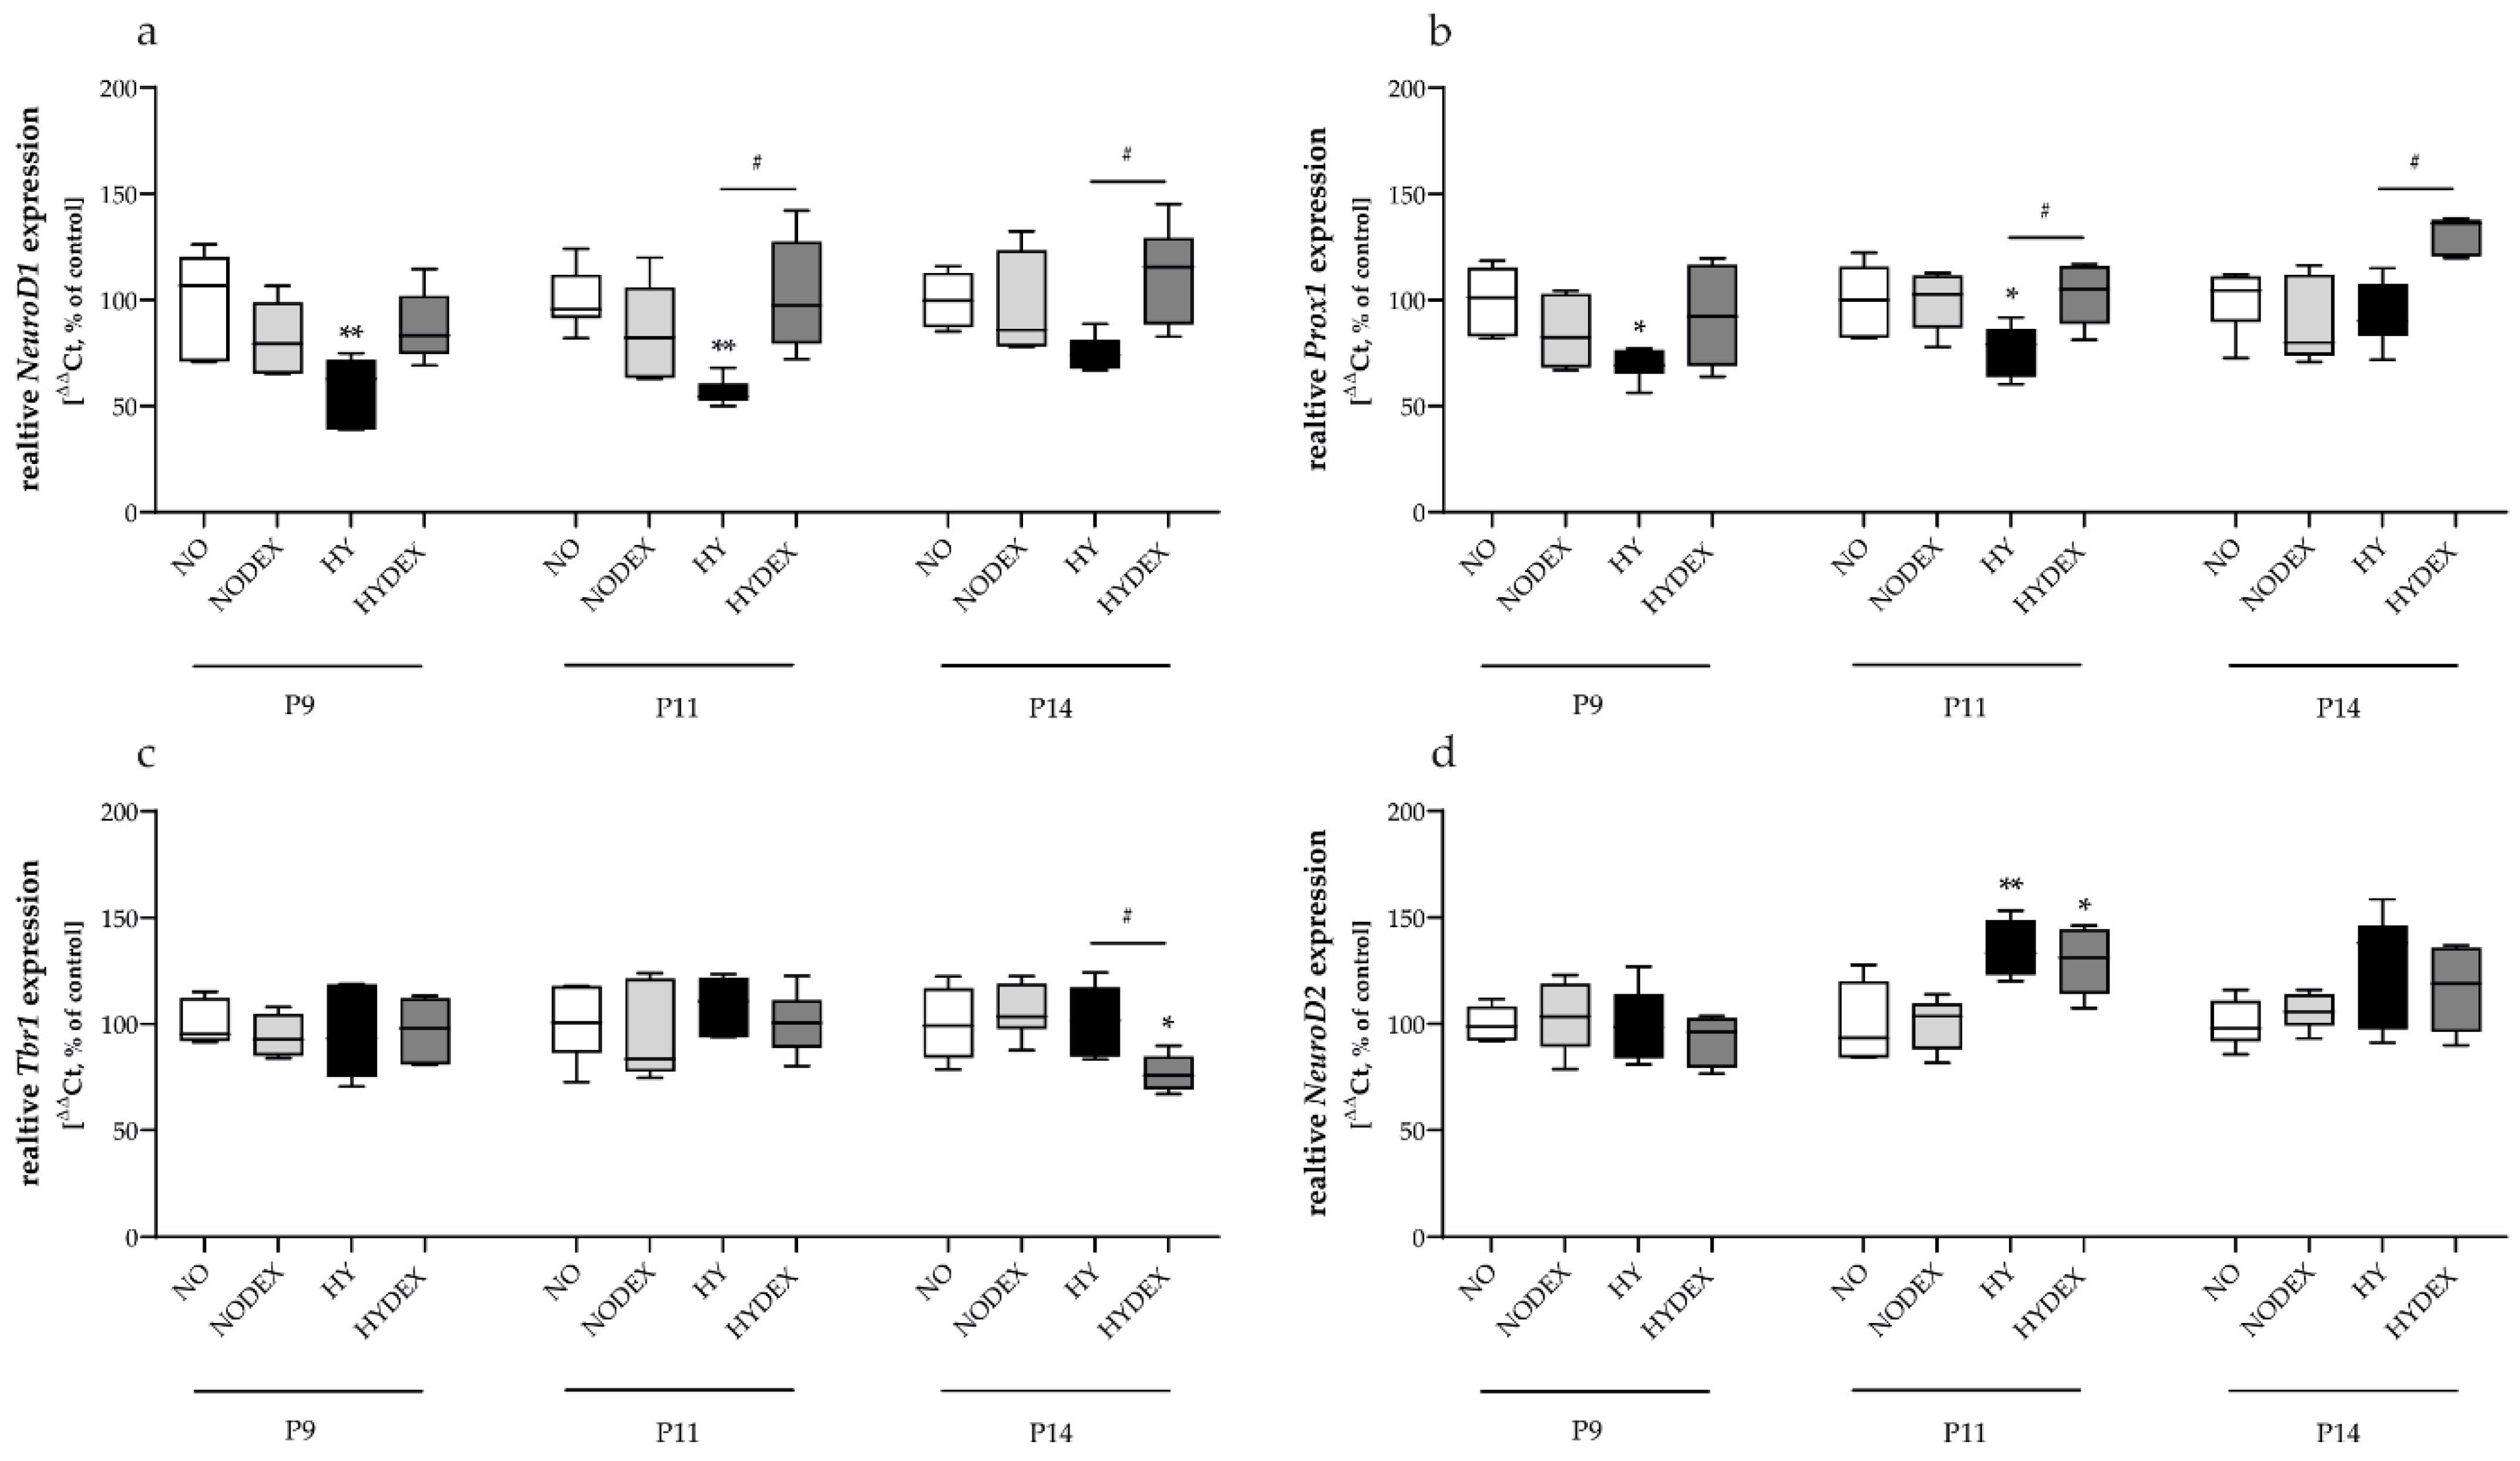
Hyperoxia strongly inhibited interneuron neurogenesis, suppressing mitotic markers Ascl1 and Tbr2 from P9 to P14 (Figure 7a,b) and reducing PCNA-positive cells in the DG at P9 (Figure 7d). Postmitotic markers NeuroD1 and Prox1 were likewise downregulated at P9 and P11 (Figure 8a,b). DEX treatment (HYDEX) effectively reversed these trends, stimulating a robust increase in Ascl1 (P9–P14, Figure 7a), Tbr2 (P9–P11, Figure 7b), and both NeuroD1 and Prox1 (P11–P14, Figure 8a,b).
Hyperoxia severely diminished interneuron neurogenesis, as indicated by suppression of mitotic markers Ascl1 and Tbr2 from P9 to P14 (Figure 7a,b). This early suppression was further reflected in the expression of the cell cycle regulator CycD2, which was significantly downregulated at P9, followed by a late-stage compensatory increase at P11 and P14 compared to normoxic controls (Figure 7c). Similarly, PCNA expression in the hippocampus (HC) showed a significant reduction at P9 before reaching higher levels than controls at P14, with no significant changes observed at P11 (Figure 7d). Assessment of general neuronal proliferation via PCNA immunohistochemistry revealed a distinct temporal response to oxygen stress. At P9, hyperoxia exposure (HY) led to a broad suppression of the total PCNA-positive proliferative population within the dentate gyrus (Figure 5, upper panel). While this proliferative activity seemed unaffected and remained within the range of control levels at P11 (Figure 5, middle panel), the P14 stage was characterized by a significant reactive surge in cellular turnover (Figure 5, lower panel). Specifically, hyperoxia-exposed subjects exhibited an increase in total PCNA-positive cell counts that exceeded baseline levels, suggesting a delayed or compensatory proliferative response to the preceding neonatal injury.
Postmitotic markers NeuroD1 and Prox1, likewise, were downregulated at P9 and P11 (Figure 8a,b). Interestingly, while the postmitotic marker Tbr1 remained unchanged by hyperoxia across all time points (P9–P14, Figure 8c), NeuroD2 expression showed a transient but significant upregulation at P11 in hyperoxic animals (Figure 8d).
DEX treatment (HYDEX) effectively modulated these trends. In the mitotic compartment, DEX stimulated a robust early increase in Ascl1 (P9–P14, Figure 7a), Tbr2 (P9–P11, Figure 7b), and both CycD2 and PCNA (HC) at P9, thereby reversing the initial hyperoxia-induced suppression (Figure 7c,d). However, this early stimulation was followed by a subsequent decline in CycD2 and PCNA (HC) levels at P14. DEX administration significantly modulated the proliferative landscape under hyperoxic conditions. At P9, DEX (HYDEX) acted as a potent mitogenic stimulus, not only effectively reversing the hyperoxia-induced deficit but also significantly enhancing overall proliferative activity beyond baseline levels (Figure 5, upper panel). This early intervention appeared to stabilize cellular turnover; while hyperoxia-treated animals showed a late-stage reactive surge at P14 (Figure 5, lower panel), DEX treatment prevented this overshooting response, maintaining proliferative counts closer to physiological levels, thereby facilitating a more balanced developmental trajectory.
Regarding postmitotic markers, DEX treatment not only increased NeuroD1 and Prox1 (P11–P14, Figure 8a,b) but also led to a specific downregulation of Tbr1 at P14. In contrast, NeuroD2 levels remained largely stable and showed no significant alterations following DEX treatment compared to the hyperoxia group (Figure 8c,d).

3.4.2. Mature Neuronal Markers

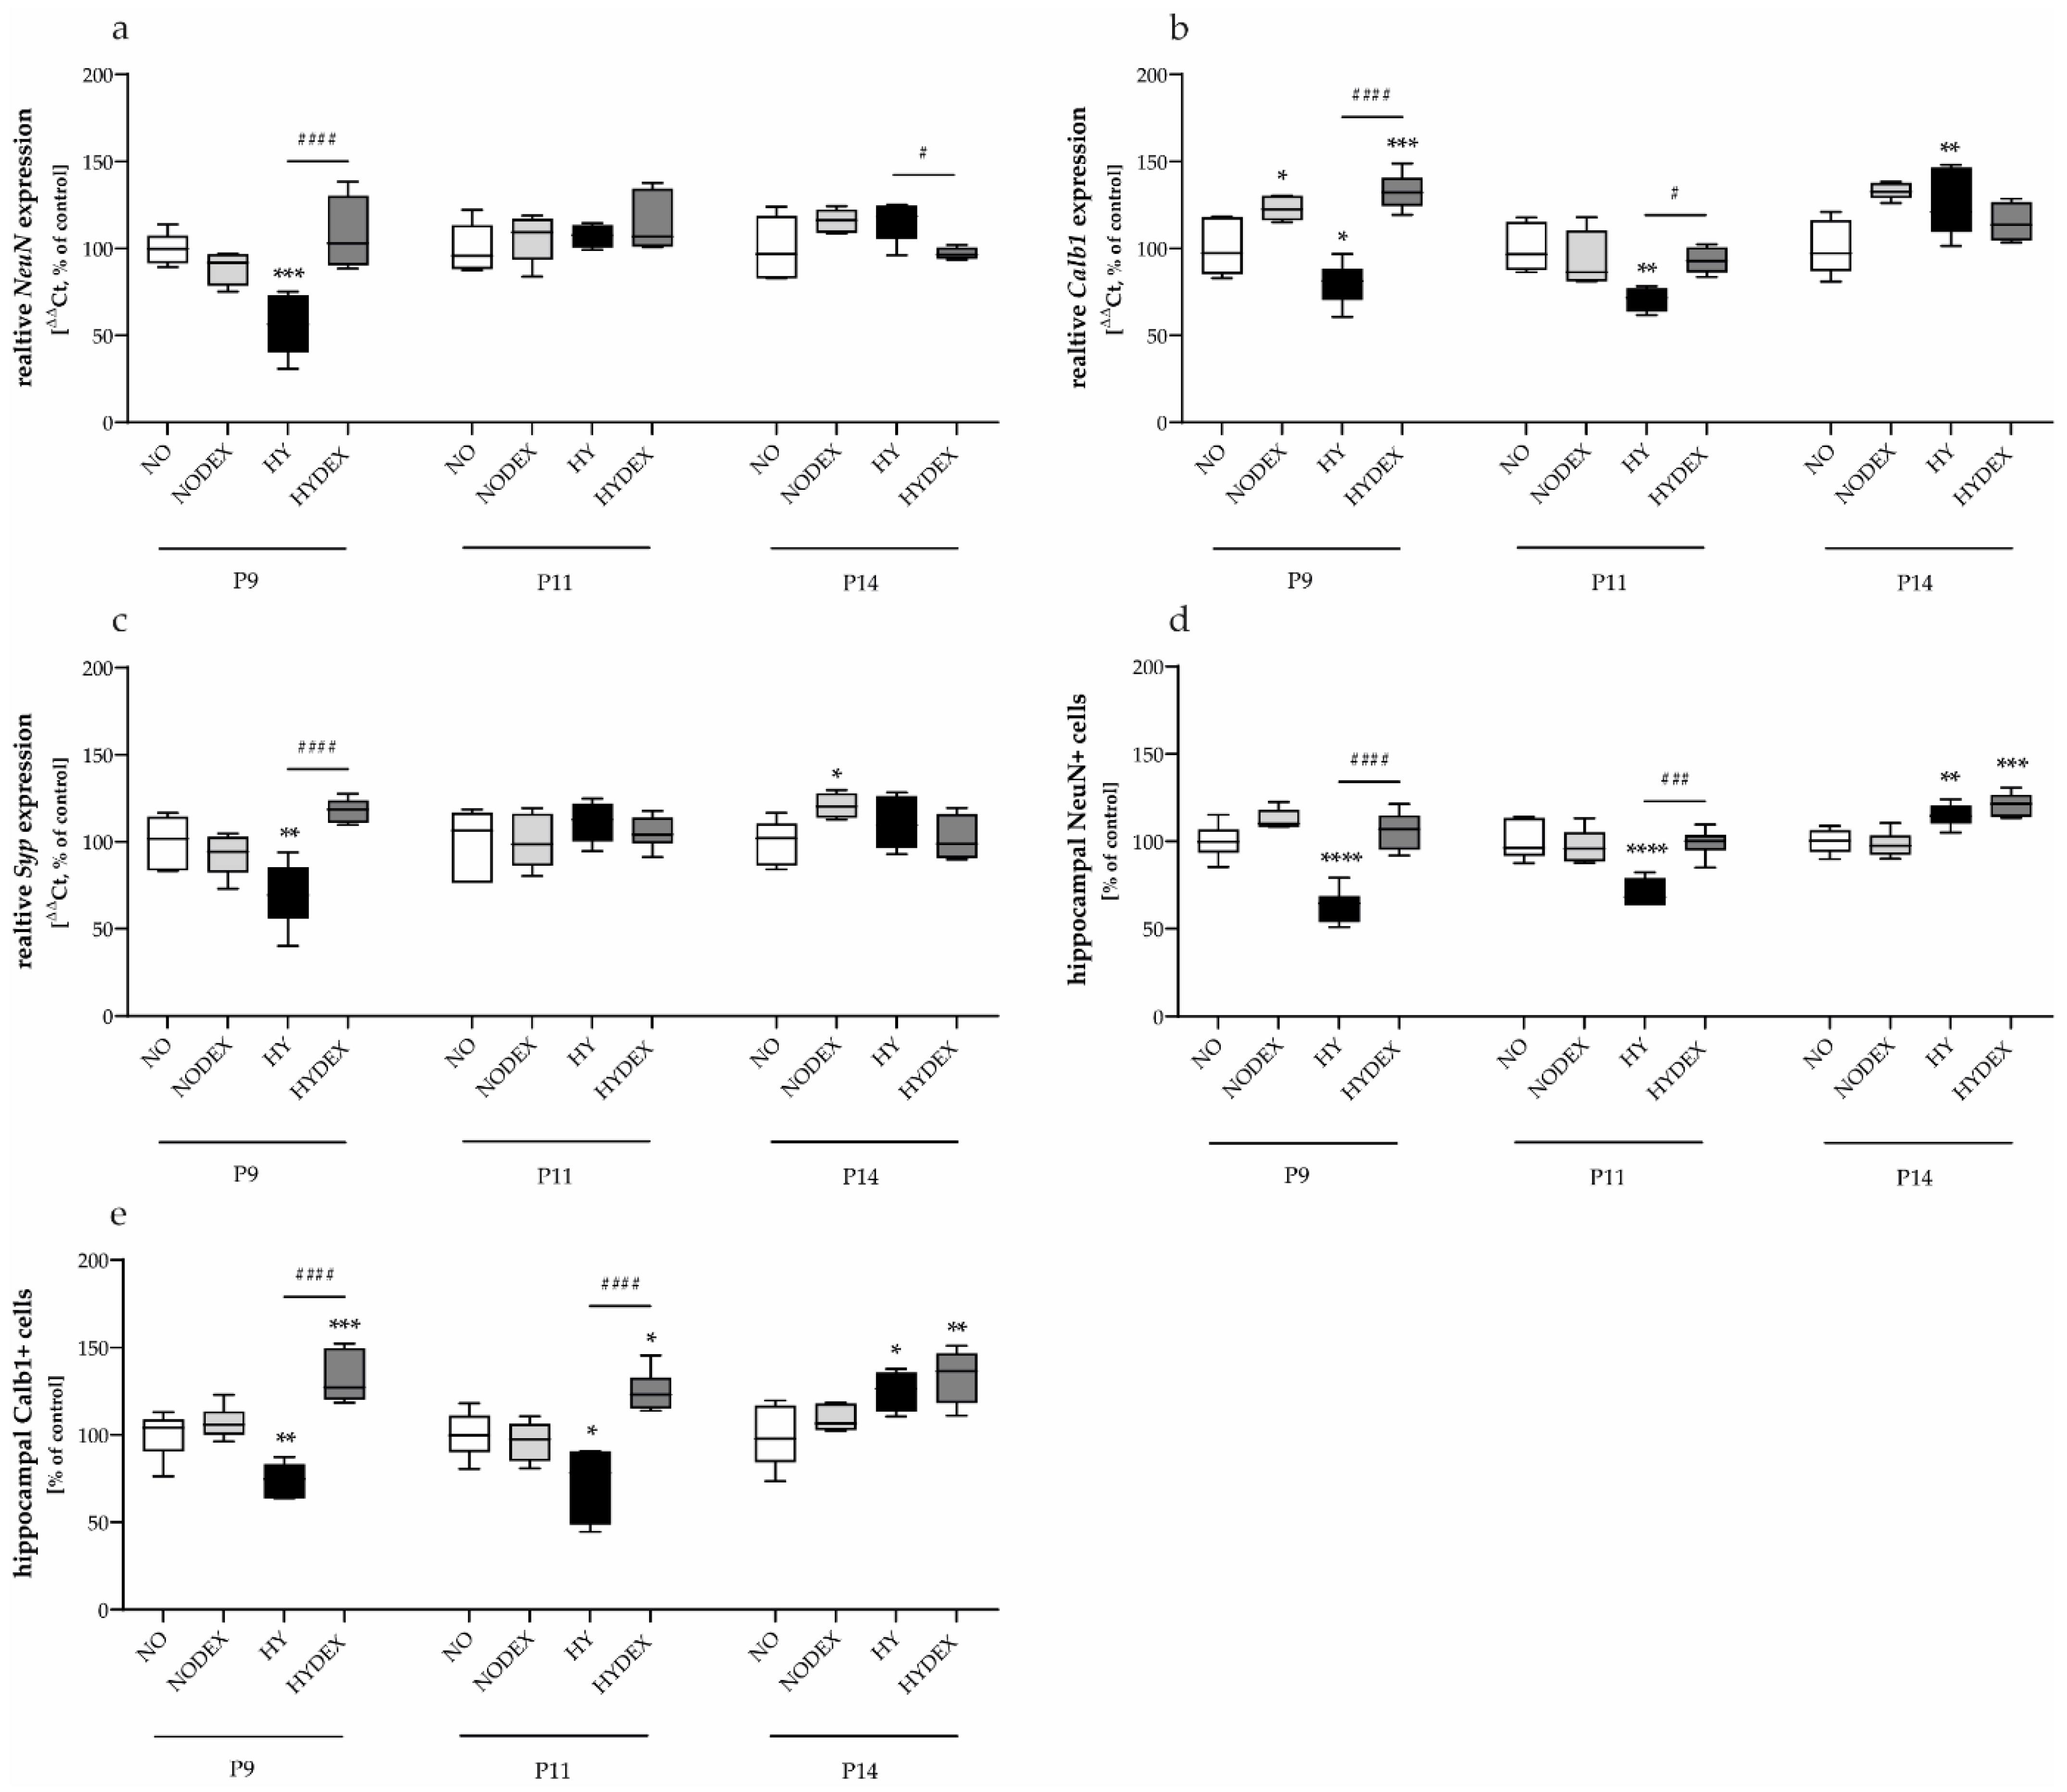
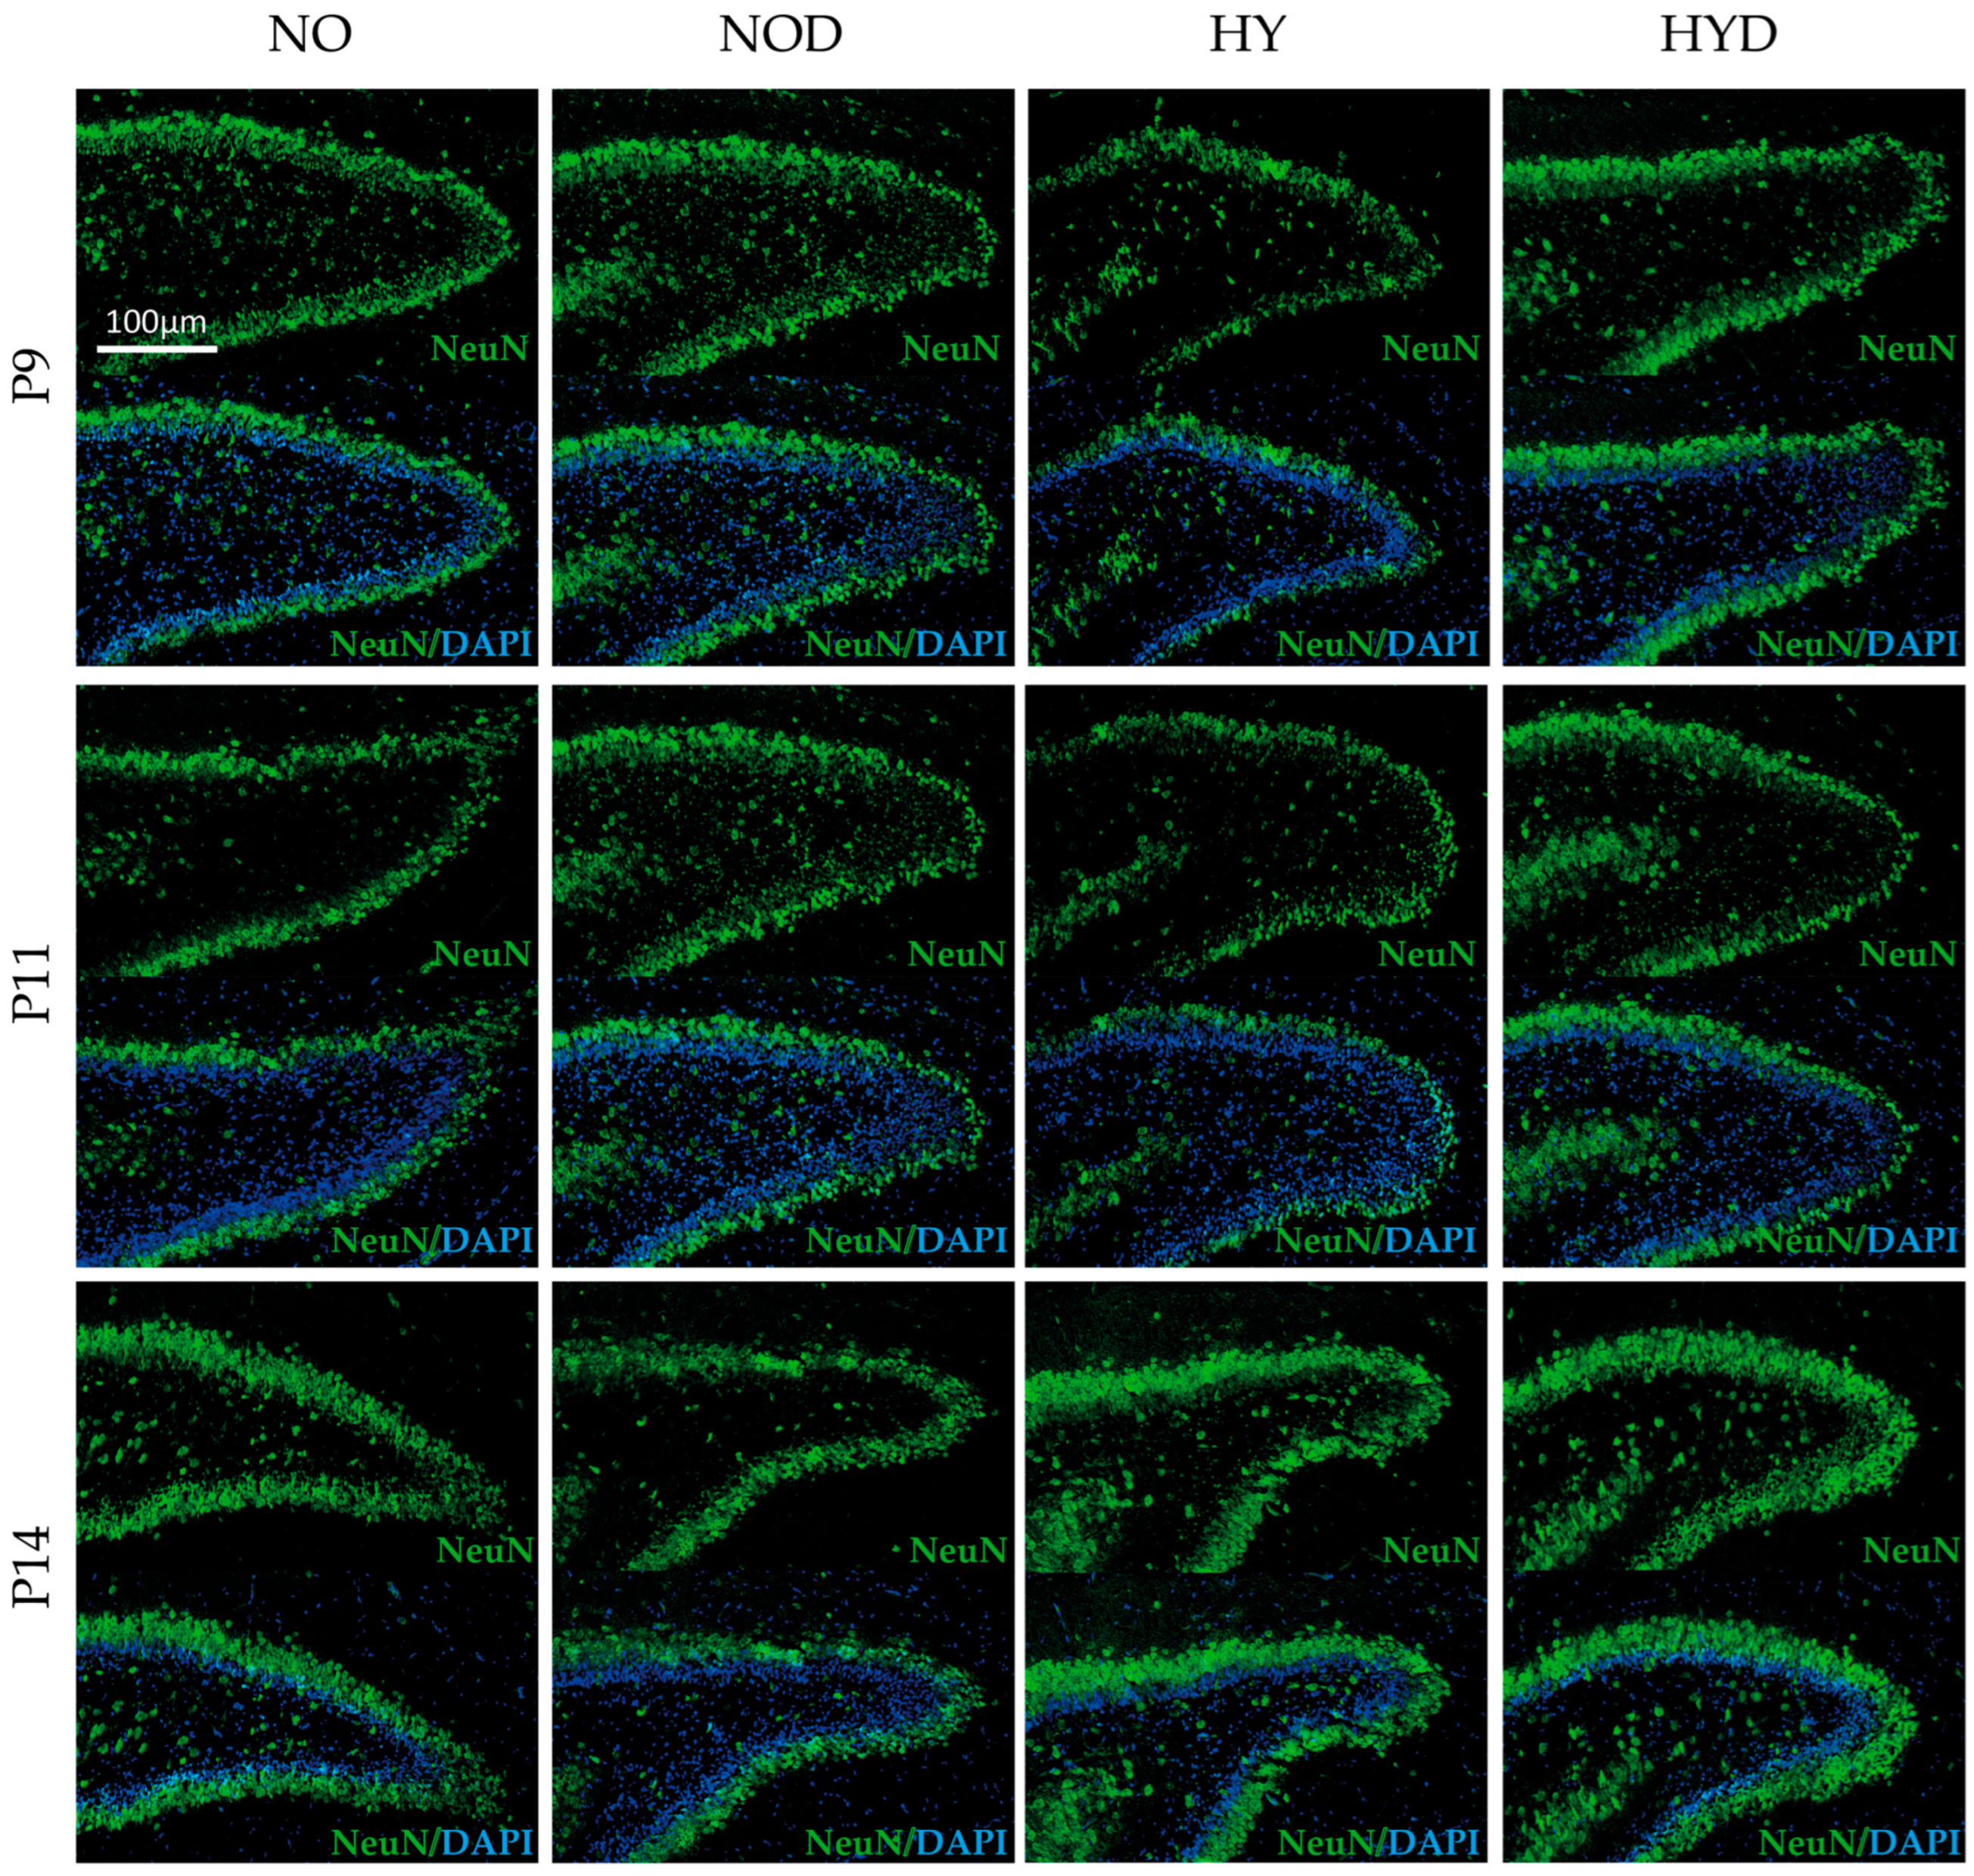
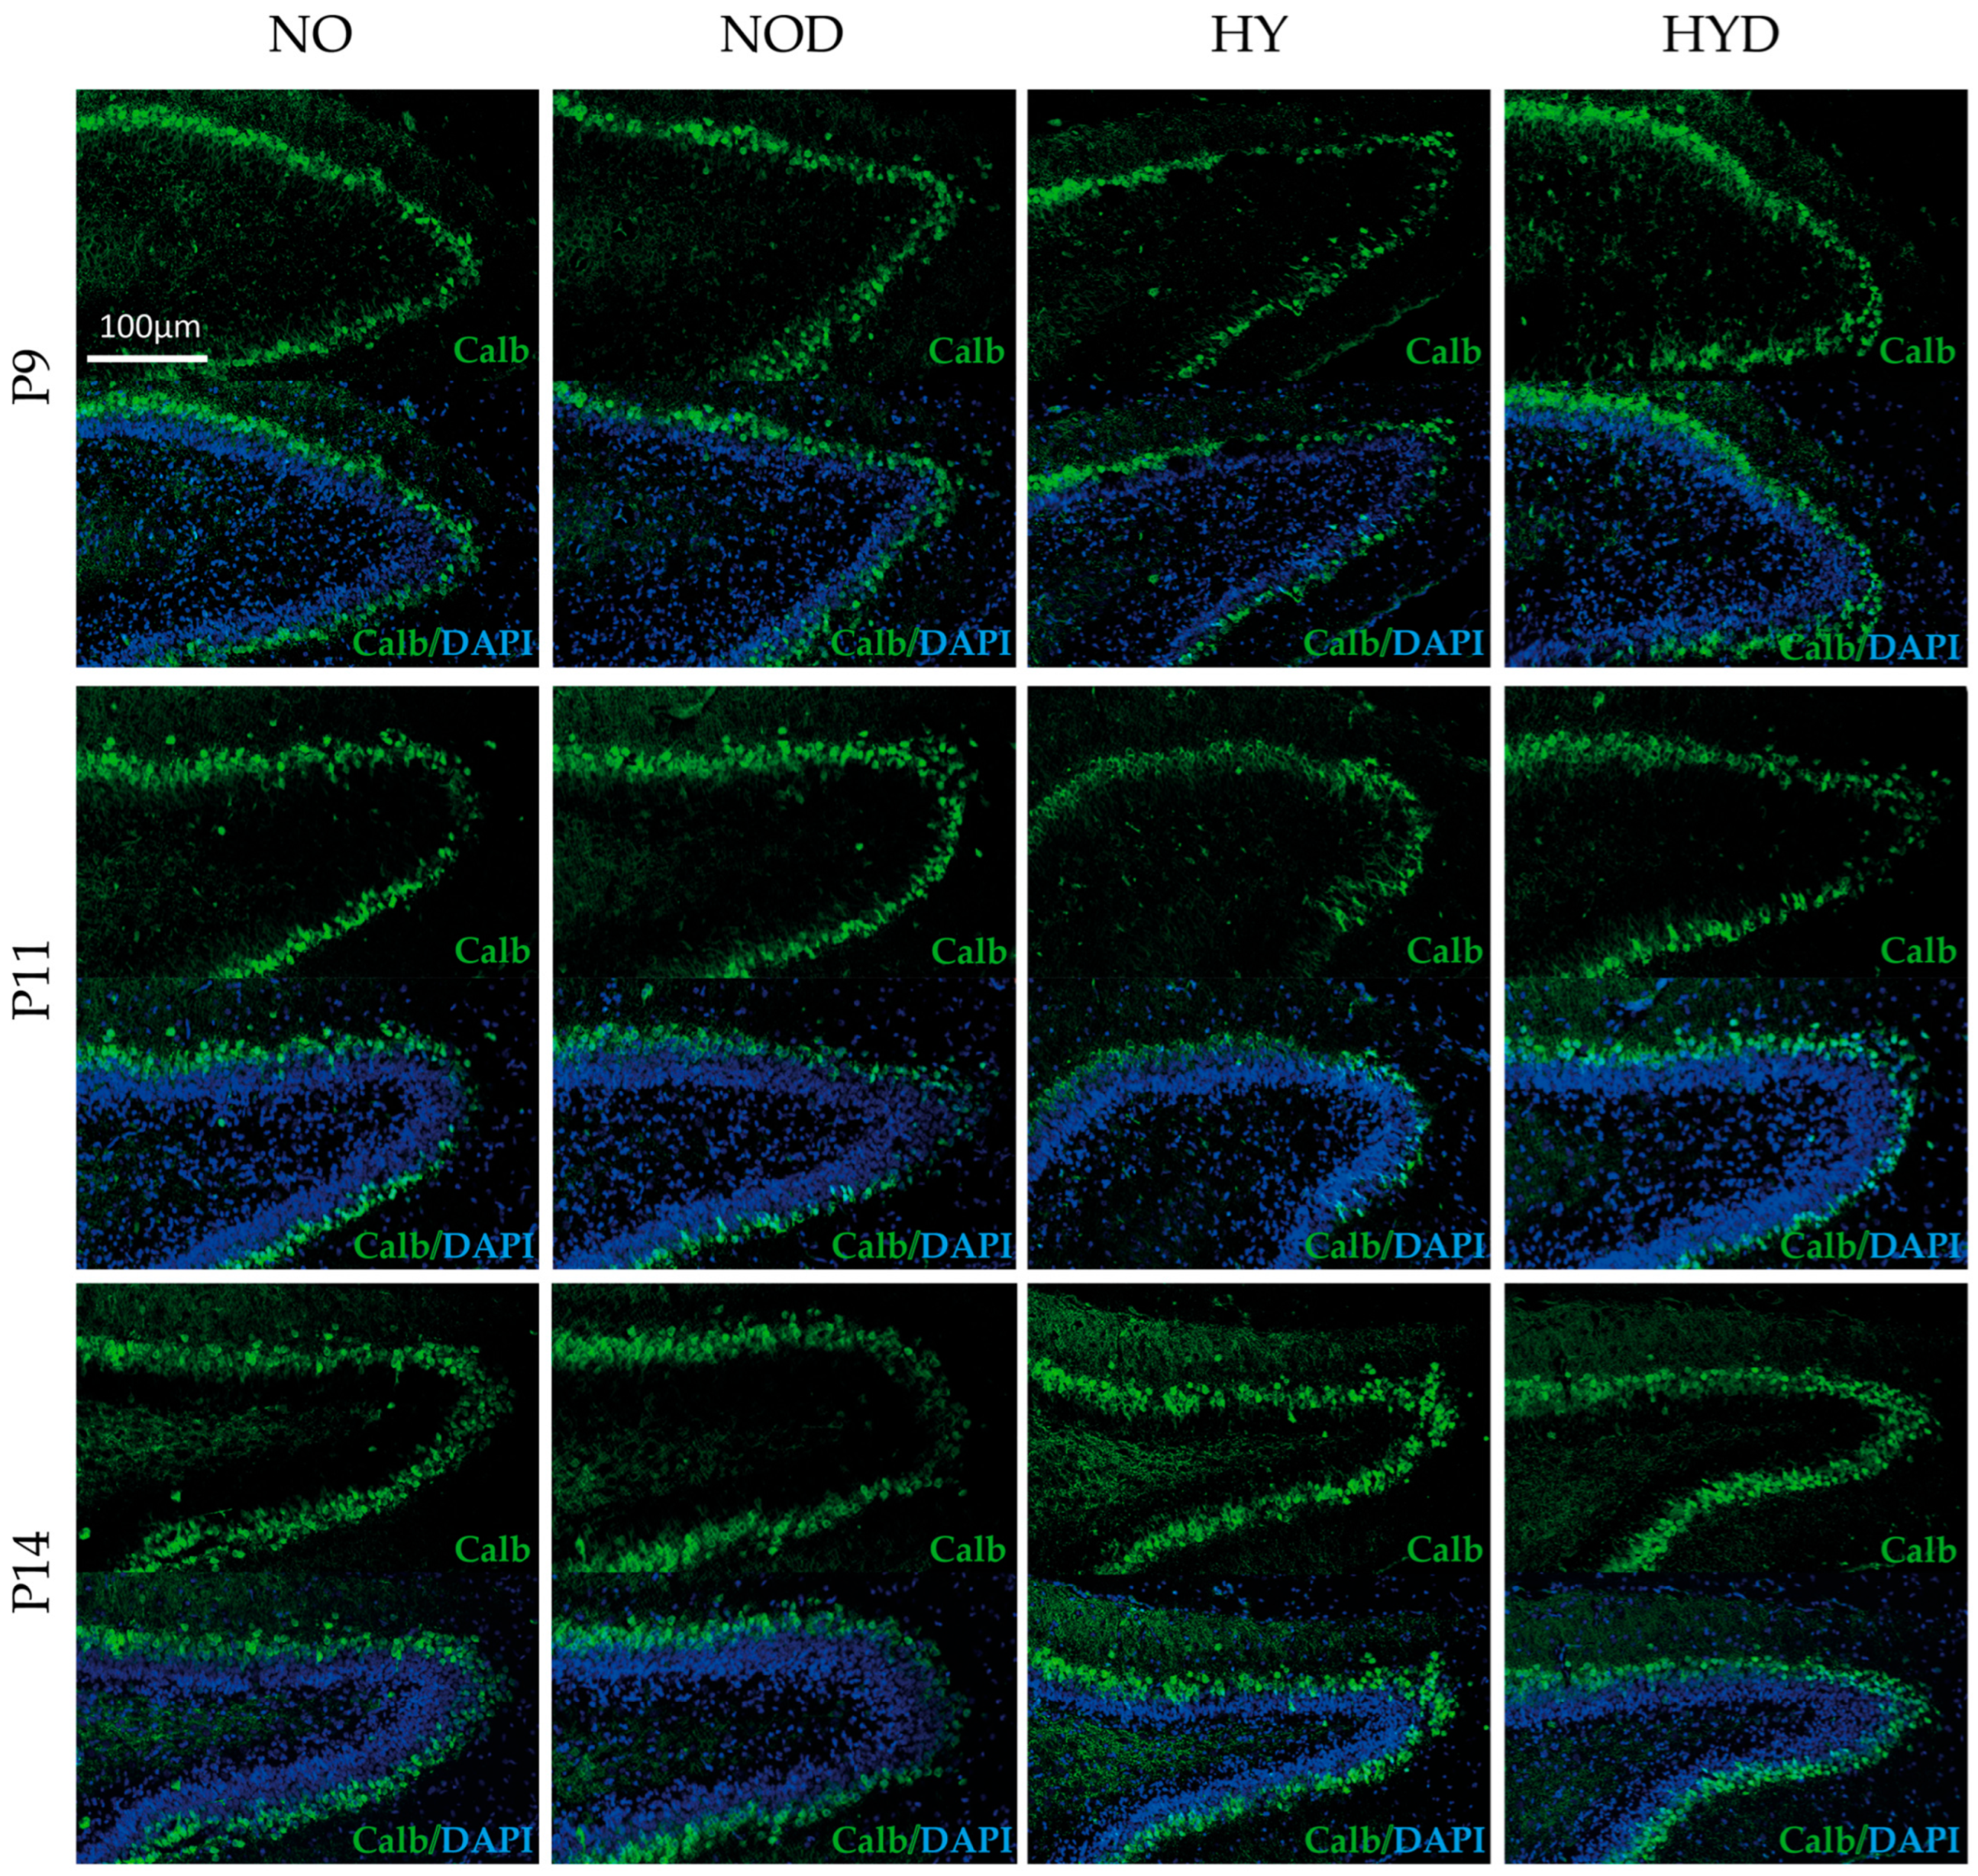
Finally, the transition to a mature neuronal phenotype was delayed by hyperoxia, as indicated by decreased NeuN−(Figure 9) and Calb1−(Figure 10) labeled neurons in the DG and at the mRNA level at P9–P11 (Figure 11a,b). Immunohistochemical staining for the mature neuronal markers NeuN (Figure 9) and Calbindin-1 (Calb1; Figure 10) within the dentate gyrus (DG) revealed a significant disruption of the neuronal maturation cascade under hyperoxic conditions. At postnatal day 9 (P9), the hyperoxia (HY) group exhibited a marked rarefaction of both NeuN-positive (Figure 9, upper panel) and Calb1-positive cell populations within the granular cell layer. This deficit in neuronal density persisted through P11 (Figure 9, middle panel), suggesting a sustained suppression of terminal neuronal differentiation. By P14 (Figure 9, lower panel), however, representative images indicated a subjective restoration to control-like levels, reflecting a delayed onset of spontaneous normalization in the expression of mature neuronal markers despite the preceding hyperoxic insult. Interestingly, a late-stage mRNA increase in these markers was observed at P14 in the HY group (Figure 11b–d). Syp mRNA transcription was reduced by hyperoxia at P9 (Figure 11e).
DEX treatment (HYDEX) accelerated the maturation process, resulting in a significant increase in NeuN and Calbindin-1 (Calb1) protein expression in the DG at P9 and P11 (Figure 11c,d), as well as a reversal of the hyperoxia-induced reduction of the synaptic marker Syp at P9 (Figure 11e). DEX administration effectively counteracted the hyperoxia-induced impairment of neuronal maturation. Representative sections demonstrated an impressive preservation of neuronal differentiation, characterized by a substantially higher density of NeuN− (Figure 9) and Calb1-positive cells (Figure 10) compared to the oxygen-exposed vehicle group. This protective effect of DEX was consistently observed across all analyzed time points (P9, P11, and P14).

3.4.3. Neurotrophic Support and Plasticity

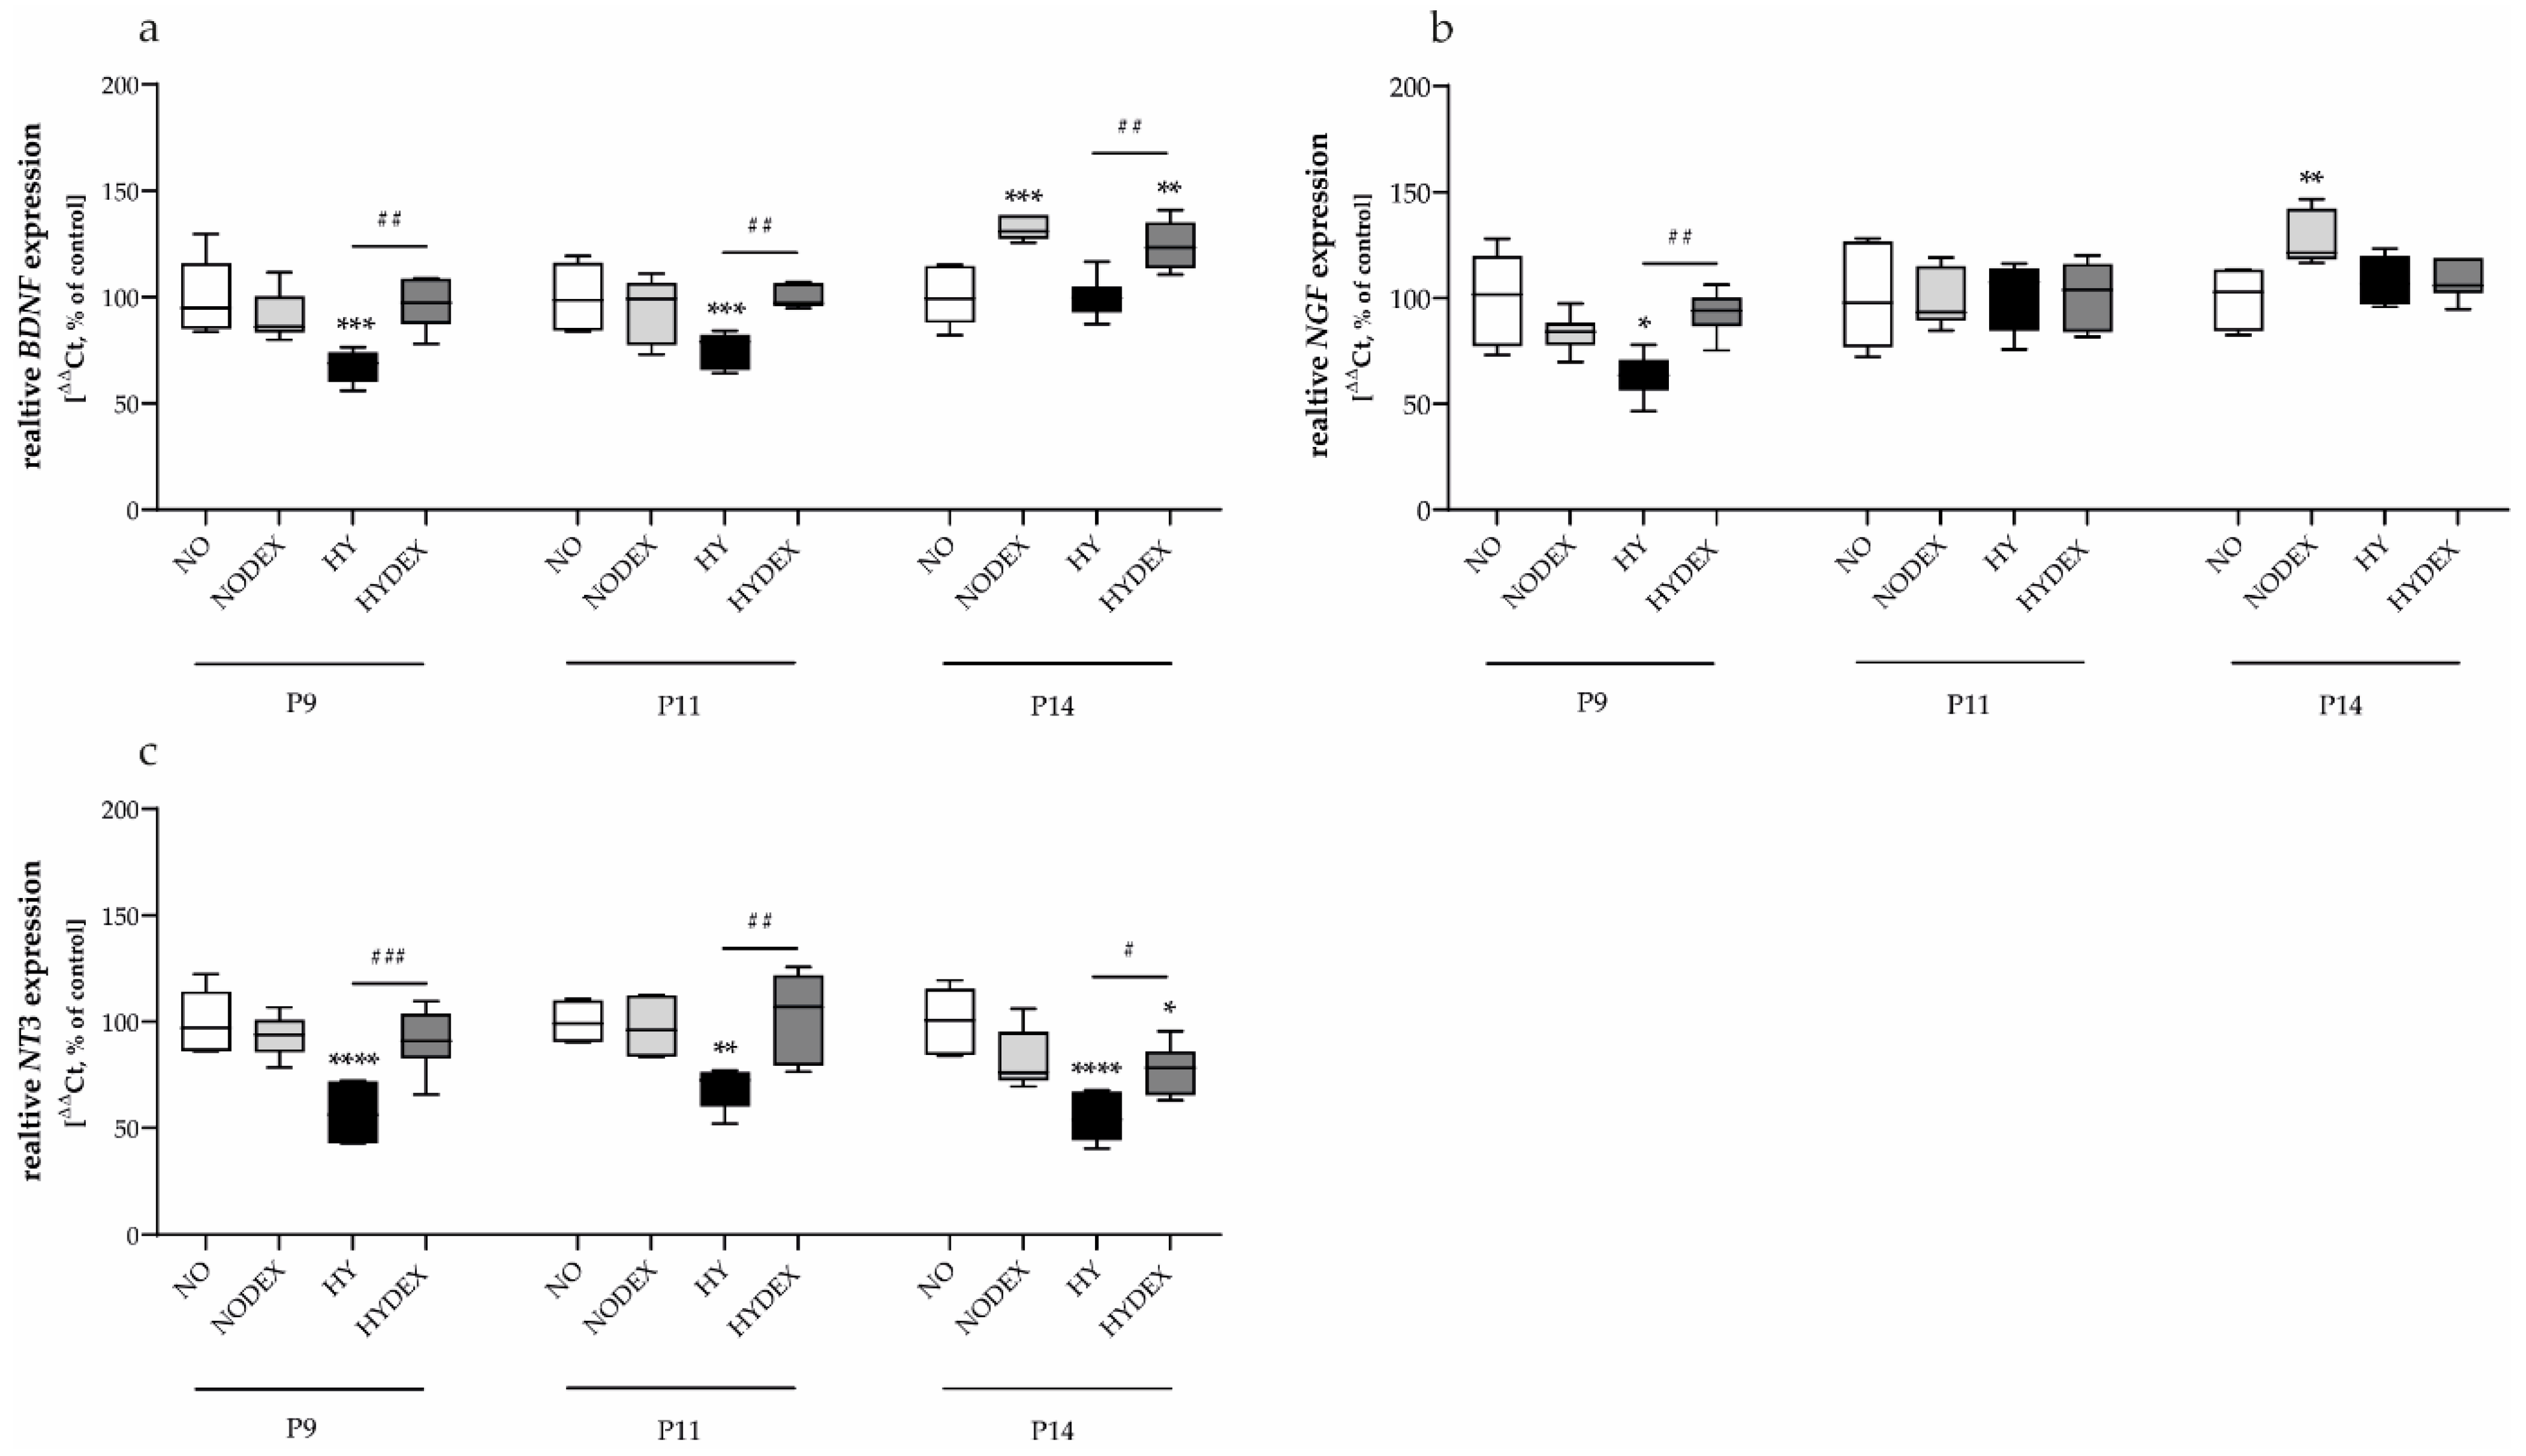
Neurotrophic signaling, essential for survival and differentiation, was significantly hampered by HY, with BDNF, NGF, and NT3 showing marked downregulation at multiple time points (Figure 12a–c). DEX administration (HYDEX) significantly boosted the expression of all three neurotrophins (BDNF, NGF, and NT3) throughout the entire observation period (Figure 12a–c).
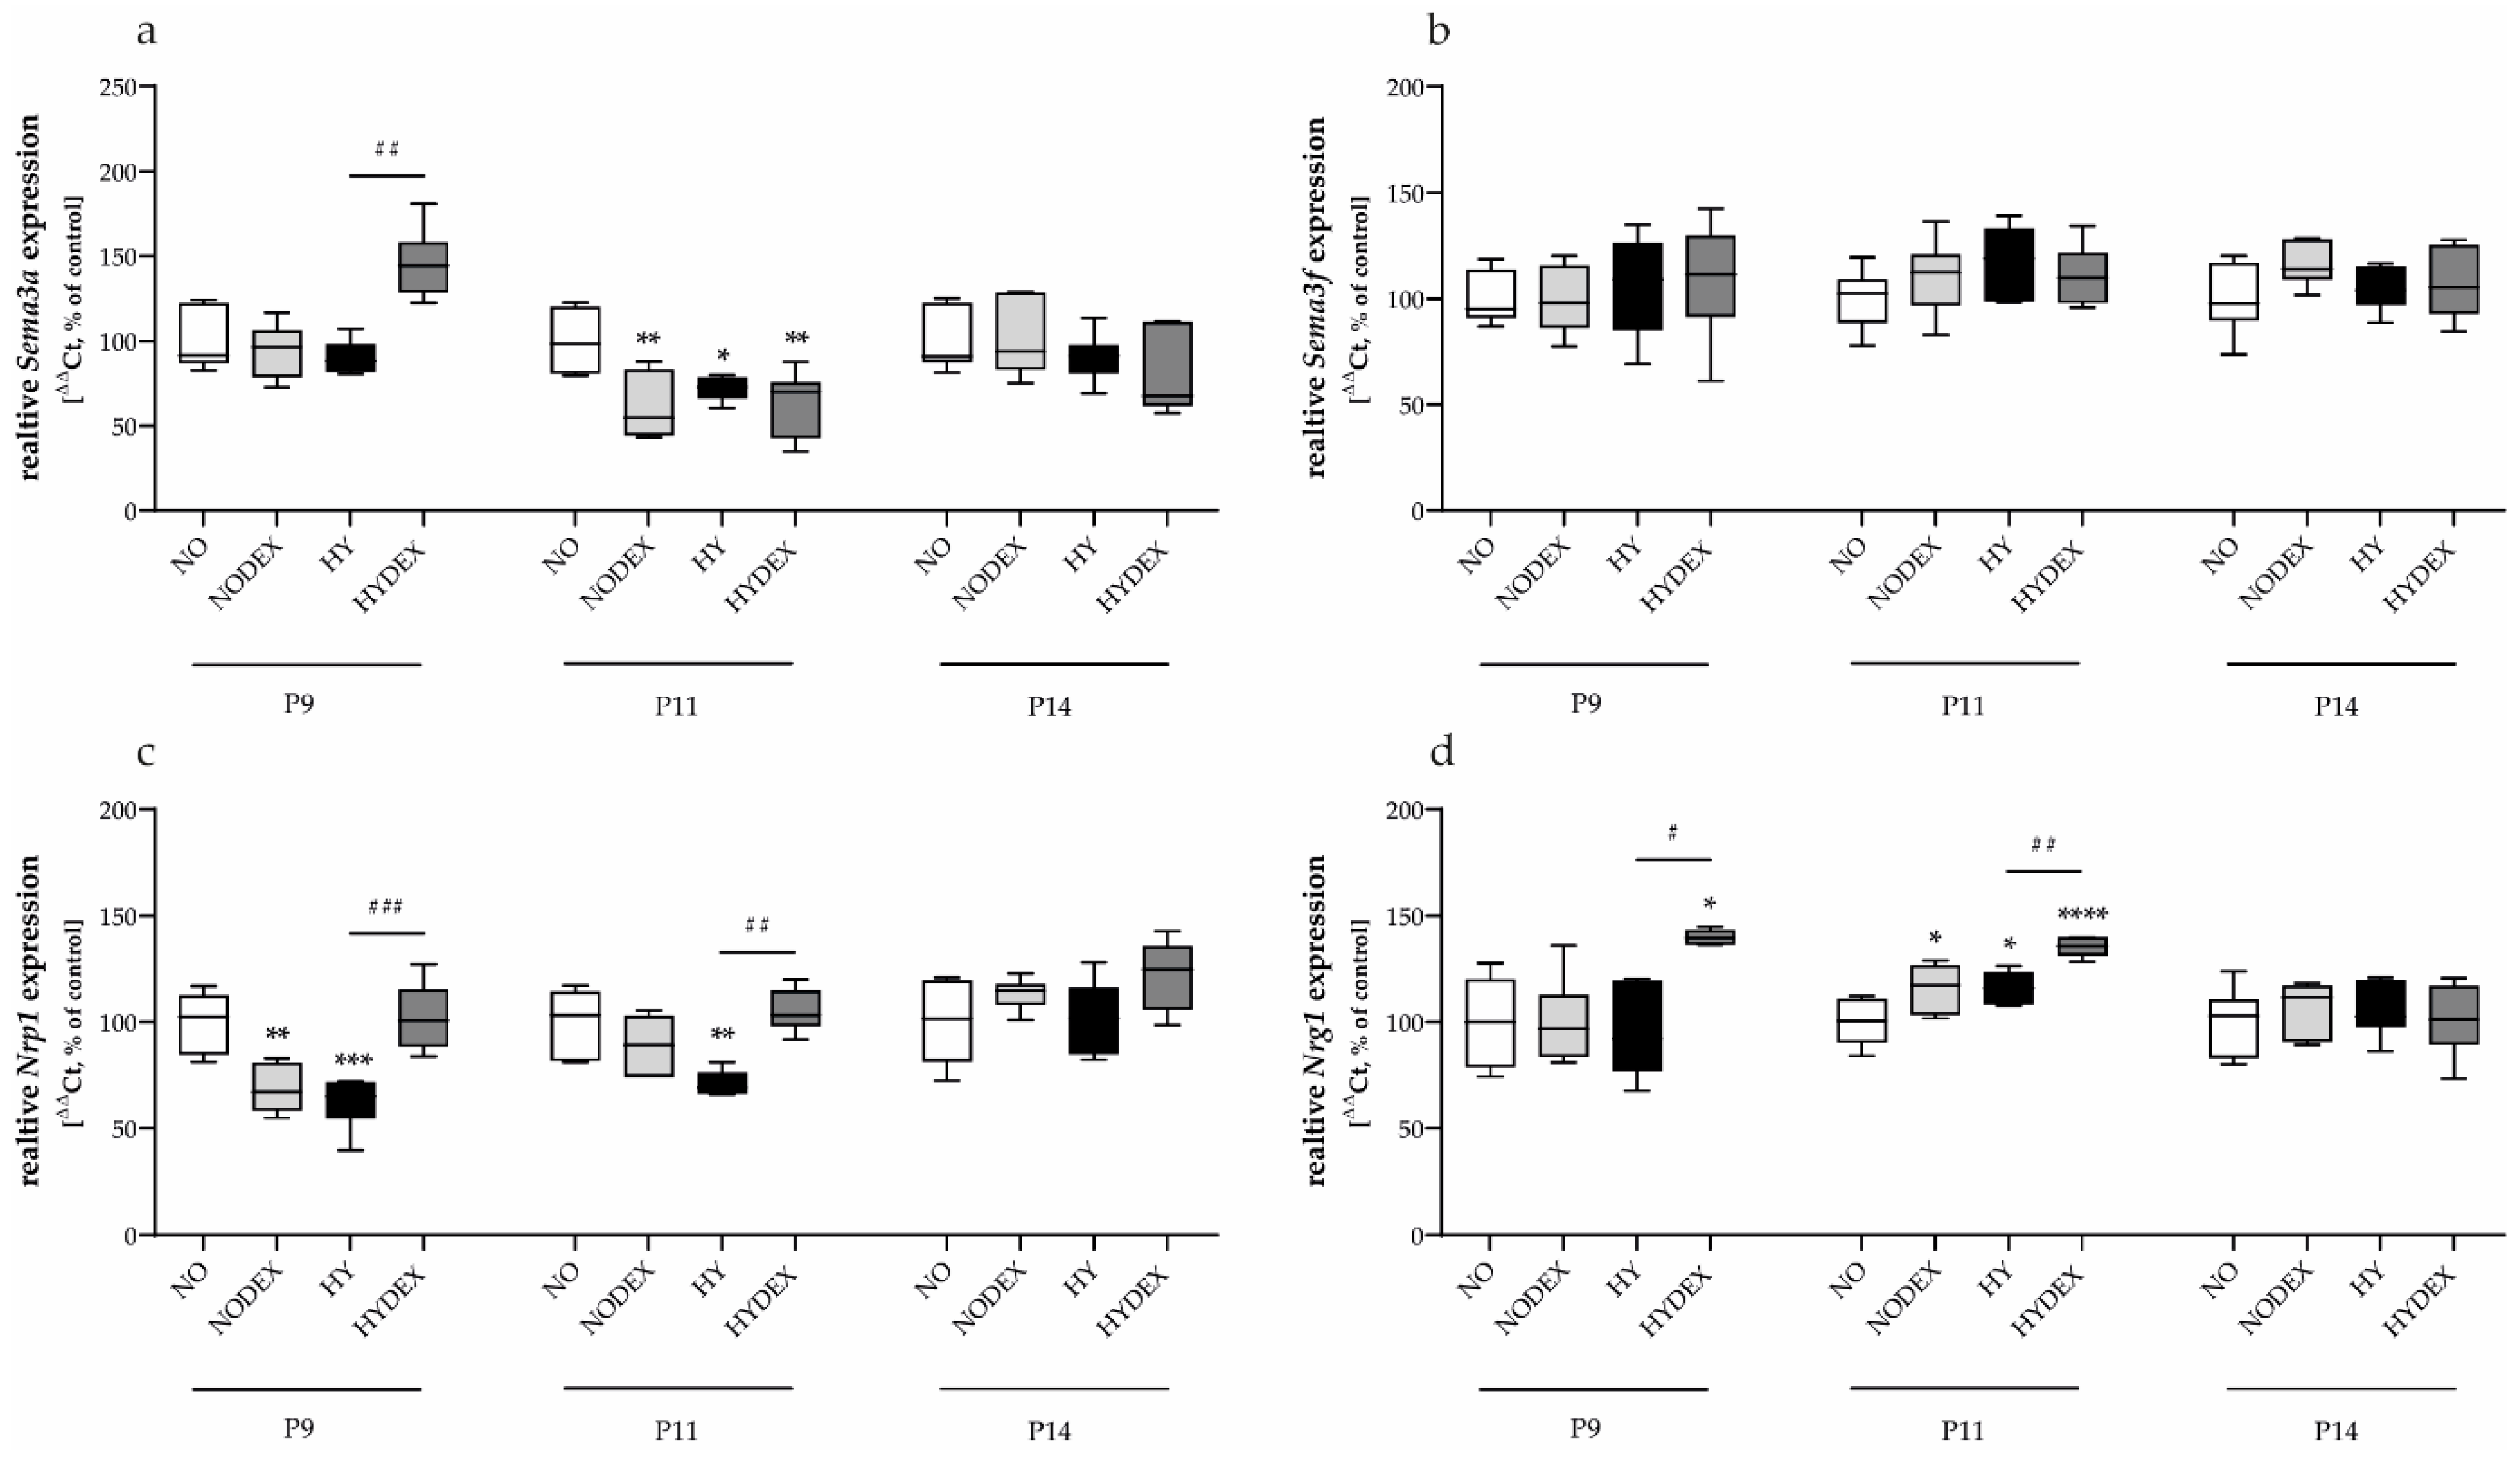
This neurotrophic environment likely supported the observed changes in neuronal plasticity markers (Figure 13). While hyperoxia suppressed Nrp1 (P9 and P11) and Sema3a (P11) (Figure 13a,c), DEX treatment (HYDEX) led to a significant upregulation of Sema3a, Nrp1, and Nrg1 at P9 and/or P11 (Figure 13a,c,d), suggesting an enhanced capacity for circuit remodeling and repair. Remarkably, the Sema3f expression remained stable under both HY and DEX conditions. (Figure 13b).

3.5. Integrative Summary of Hyperoxia-Induced Impairment and Dexmedetomidine Neuroprotection

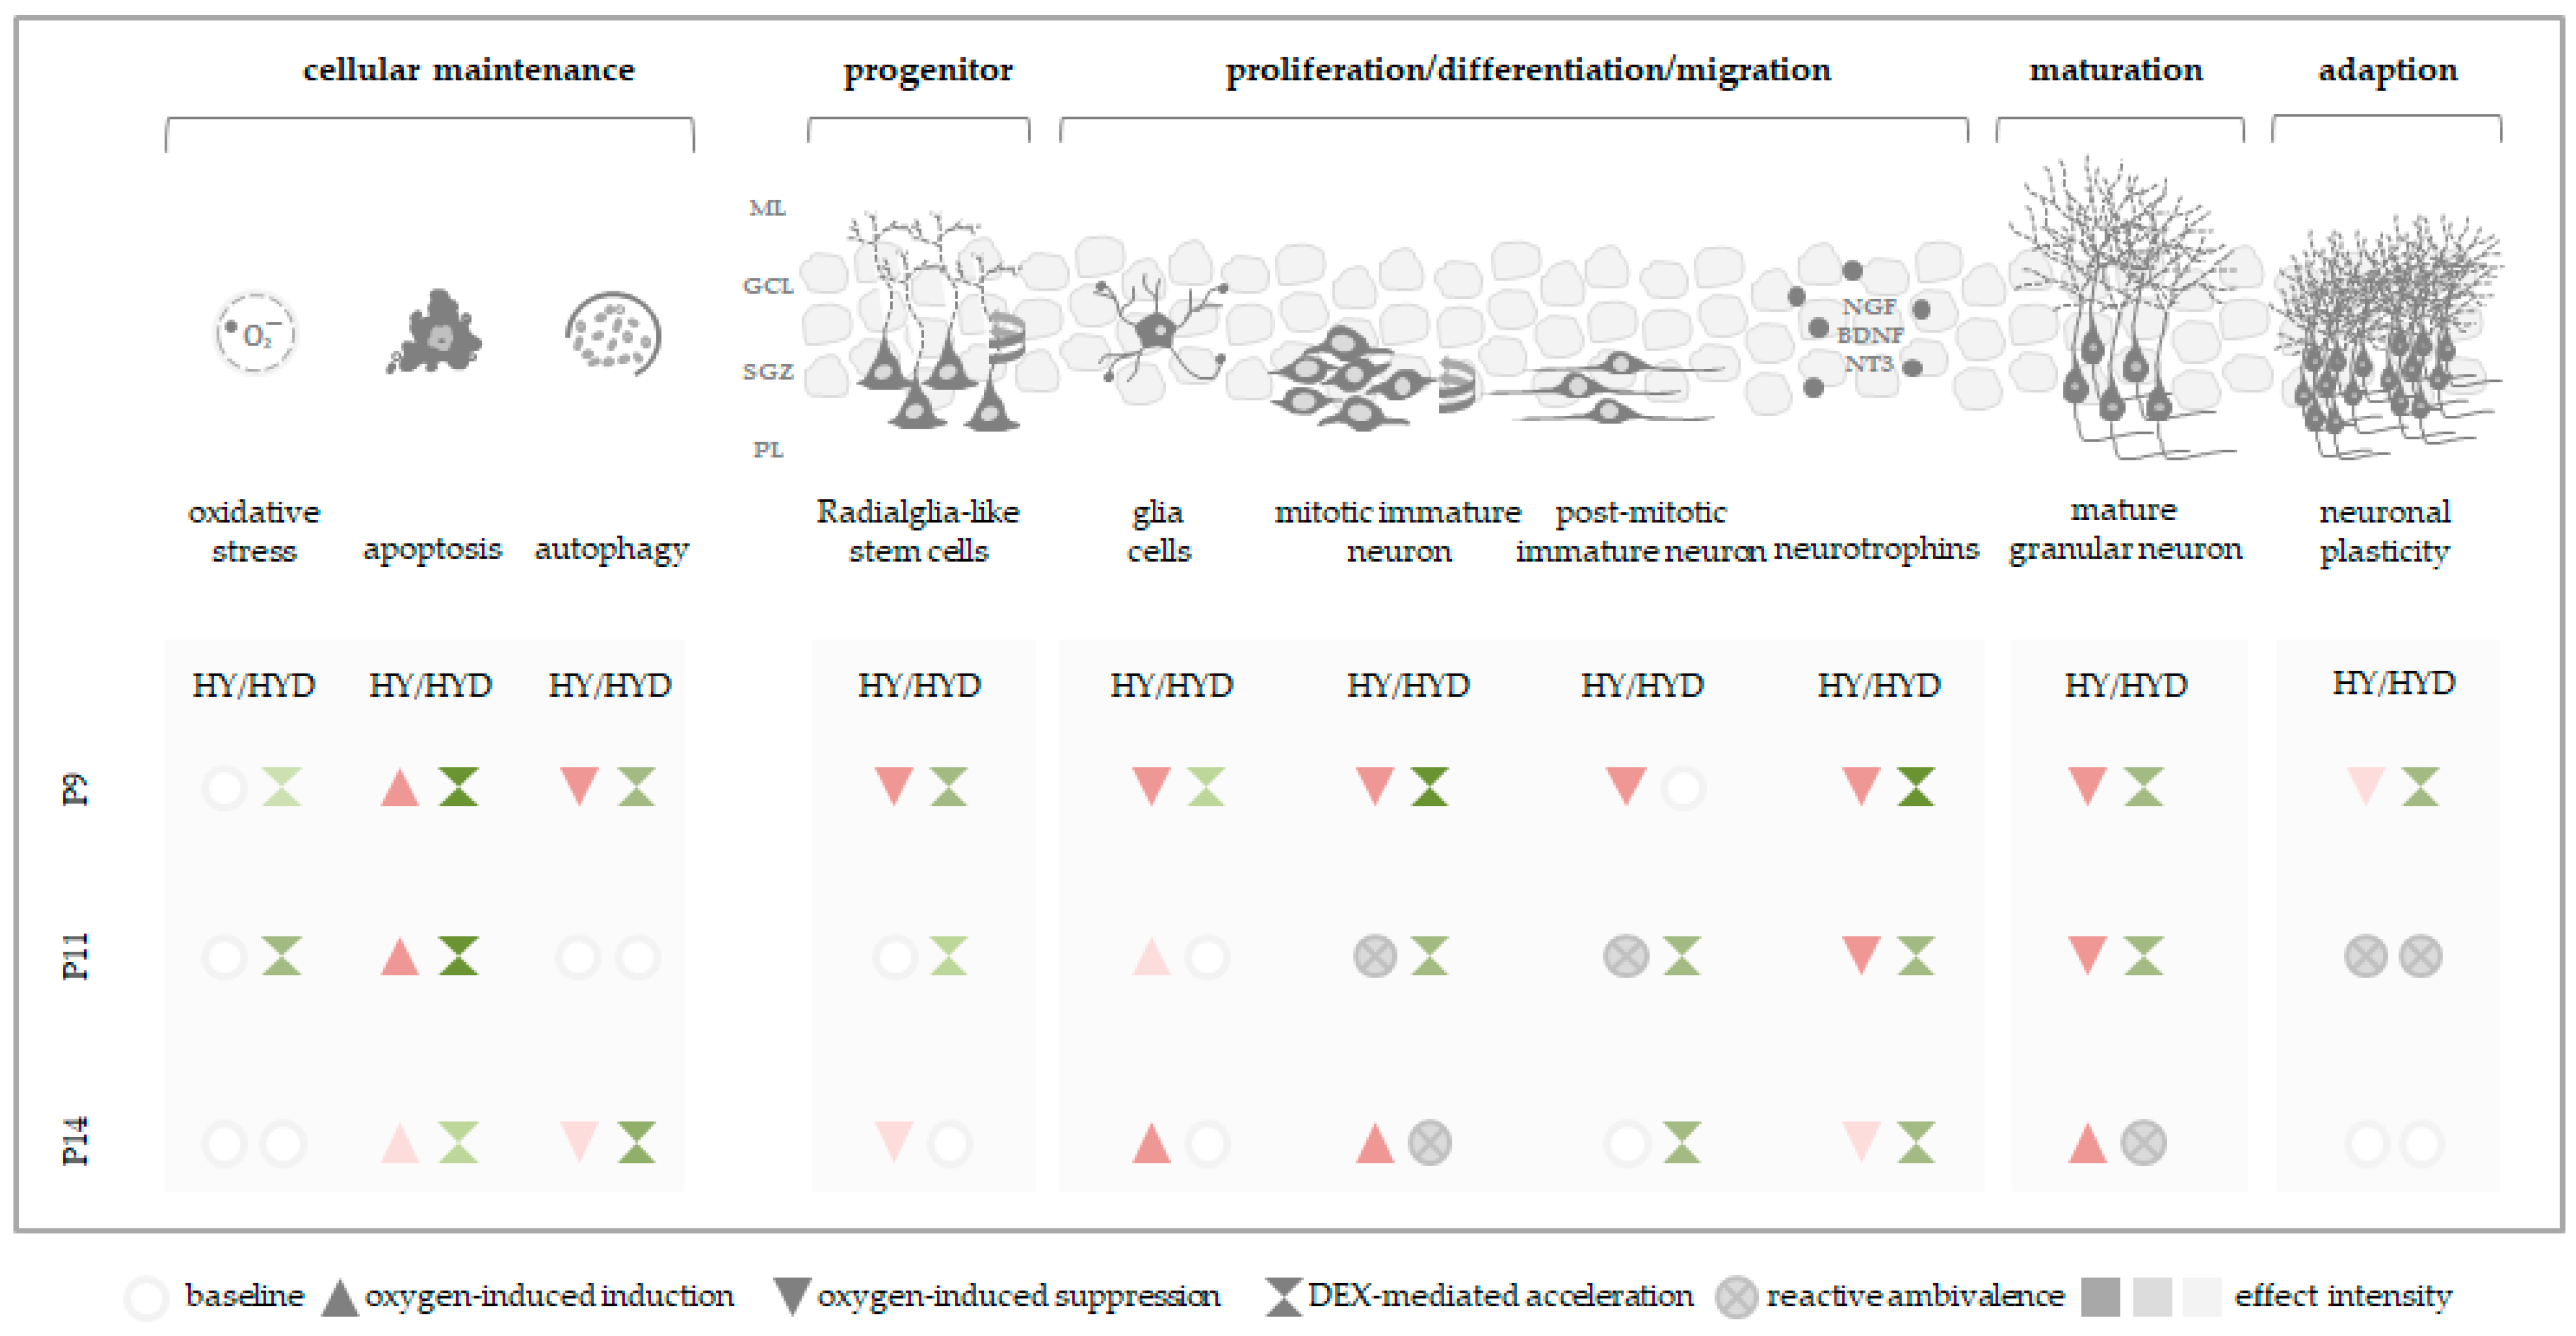
To provide a comprehensive overview of the complex interactions between hyperoxic injury and the protective potential of dexmedetomidine (DEX), our findings are synthesized into a holistic temporal model covering the neonatal and juvenile developmental phases (Figure 14).
While oxidative stress markers exhibited a delayed or mild response, programmed cell death (apoptosis) was acutely and persistently induced from P9 to P14. This was accompanied by a significant inhibition of autophagic flux, particularly immediately following oxygen exposure at P9. DEX administration (HYD) demonstrated robust regenerative efficacy; it not only accelerated the normalization of apoptotic signaling but also activated antioxidant defenses and autophagy, effectively shifting the cellular environment from injury toward maintenance.
Neuronal maturation and differentiation were severely compromised by hyperoxia, as evidenced by a marked decline in the radial glia-like stem cell population and the broad suppression of both mitotic and post-mitotic immature neurons at P9. Although the system exhibited “reactive ambivalence” at later stages (P11–P14), characterized by irregular induction or sustained suppression, natural recovery was insufficient to restore baseline growth patterns. DEX treatment (HYD) served as a developmental catalyst, significantly accelerating progenitor proliferation and facilitating an orderly progression through the interneuron lineage.
The supportive niche essential for neuronal maturation was significantly impaired under hyperoxia, reflected by the sustained downregulation of critical neurotrophins and a corresponding delay in the appearance of mature granule cells at P9 and P11. Furthermore, the capacity for neuronal plasticity and adaptation was markedly diminished during the early phase. DEX administration effectively bypassed these developmental blocks. By bolstering neurotrophic support and enhancing plasticity signaling, DEX promoted granule cell maturation, ensuring the preservation of structural and functional brain adaptation despite hyperoxic stress.

4. Discussion

The present study confirms that short-term neonatal hyperoxia does not merely induce transient oxidative stress but moreover initiates a sustained dysmaturational cascade affecting multiple hierarchical levels of brain development. While classical antioxidant transcriptional responses remained relatively modest, the pronounced and persistent activation of apoptotic pathways indicates that oxidative injury is rapidly translated into structural cellular loss. This apparent dissociation suggests that even subtle redox imbalances in the immature brain are sufficient to trigger downstream degenerative programs without inducing a robust transcriptional antioxidant response. Importantly, hyperoxia perturbed not only cell survival but also developmental timing. The early suppression of progenitor proliferation, interneuron lineage progression, and neuronal maturation, followed by partial or compensatory rebounds at later stages, reflects a pattern of reactive maladaptation. This phenomenon aligns with the concept of developmental dysmaturation, where injury alters the trajectory rather than causing uniform loss. The late increases in proliferative and maturational markers likely represent an attempt to restore cellular deficits; however, such delayed responses are unlikely to recapitulate the tightly coordinated sequence of neurodevelopmental events required for functional circuit formation.
The mechanistic basis of this observed dysmaturation lies in a biphasic injury dynamic, where the initial suppression of neural progenitor cell (NPC) proliferation and interneuron lineage progression is driven by oxidative stress-mediated pathways, particularly aberrant GSK3β signaling [17,28,46]. This phase is marked by the downregulation of key transcription factors, such as PAX6 and Tbr2, and disruption of vascular–neural coupling, compromising the neurovascular niche critical for NPC maintenance [17,23,40,46,47,48]. The subsequent failure of late proliferative rebounds reflects temporal dysregulation, as core developmental programs such as SHH and Wnt signaling are irreversibly altered, causing delayed responses to occur outside critical windows for circuit refinement [12,20,28,47]. As a result, reactive maladaptation leads to structurally abnormal networks characterized by impaired synaptogenesis, altered GABA homeostasis, and reduced dendritic complexity [21,49]. Unlike adaptive plasticity, this process represents a failure to recapitulate the neurodevelopmental sequence, establishing lasting cellular substrates for cognitive and motor deficits observed clinically [12,17,20,49,50].

4.1. Orchestration of Antioxidant Defenses and Autophagic Priming

A key finding is the temporal mismatch between hyperoxic insult and the endogenous antioxidant response, reflecting the intrinsic immaturity of the preterm brain, which lacks efficient levels of enzymes such as SOD, glutathione peroxidase, and catalase [3,51]. Hyperoxia induced an immediate downregulation of SOD3, shifting the redox balance toward reactive oxygen and nitrating species [46,52,53], while the broader antioxidant system, including Nrf2, Keap1, and GCLC, remained largely unresponsive. The impact of this imbalance is indicated by the delayed or insufficient activation of the Nrf2–Keap1 pathway in the neonatal brain [54,55]. In contrast, DEX elicited a proactive antioxidant response, with early SOD3 induction followed by mid-term upregulation of Nrf2 and GCLC. This pattern suggests that DEX not only scavenges ROS but actively recalibrates redox sensing, likely by promoting Nrf2 nuclear translocation, potentially via MALAT1/miR-140-5p signaling [56], thereby restoring glutathione homeostasis and reducing lipid peroxidation [39,41,42]. Additionally, hyperoxia-induced suppression of Beclin1 and Atg12 at P9 indicates impaired basal autophagy and reduced clearance of damaged organelles [57,58]. DEX counteracted this by early upregulation of these markers, enhancing proteostasis and limiting the accumulation of toxic protein aggregates and dysfunctional mitochondria, thereby attenuating downstream apoptotic signaling [57,59]. However, the later reduction of Atg5 under hyperoxia exposure suggests incomplete long-term compensation of autophagic capacity, pointing to a persistent proteostatic deficit with implications for clinical translation [26,60,61,62].

4.2. Mitigation of Persistent Apoptotic Signaling

Our findings show that hyperoxia-induced programmed cell death in the neonatal CNS is widespread and persists into the second postnatal week, with elevated cleaved caspase-3 and TUNEL positivity across the frontal cortex, retrosplenial cortex, and hippocampus. This regional vulnerability is consistent with established models in which 80% oxygen exposure induces neurodegeneration in key developmental structures [41,47,63]. The lack of significant AIF modulation indicates that injury primarily proceeds via caspase-dependent rather than caspase-independent mitochondrial pathways [64,65], in line with activation of Fas/CD95 and BAX-dependent cascades leading to caspase-8 and caspase-3 activation [66,67].
DEX treatment markedly reduced apoptotic markers across regions from P9 to P14, consistent with evidence that α2-adrenoceptor agonism attenuates neurodegeneration and preserves neuronal density in the developing hippocampus and cortex [23,26,41,67]. Meta-analyses further support a consistent reduction in TUNEL-positive cells across brain injury models [68]. This broad neuroprotection likely reflects combined anti-inflammatory effects and preservation of mitochondrial and blood–brain barrier integrity [39,69].
Mechanistically, the PI3K/Akt pathway appears central to DEX-mediated protection. Its activation decouples oxidative stress from apoptotic execution, as shown by increased phosphorylated Akt and Bad, restoration of the Bcl-xL/Bad ratio, and suppression of caspase-3 cleavage [70,71,72]. This α2-adrenoceptor–mediated signaling also reduces ROS and downstream inflammatory cytokines [70,73,74,75]. Emerging evidence further suggests modulation of pyroptosis and calcium homeostasis, indicating neuroprotective effects beyond the PI3K/Akt axis [73,76].

4.3. Preservation of the Progenitor Niche and Prevention of Reactive Ambivalence

A central finding is the dynamic vulnerability of the neural progenitor pool in the dentate gyrus. Hyperoxia induced a pronounced maturation arrest, reflected by reduced Sox2, essential for radial glia stemness and proliferation [77], and Hes5, a Notch-dependent regulator maintaining undifferentiated states [78]. This early depletion, supported by reduced mitotic Pax6/PCNA+ cells, aligns with and extends prior evidence of impaired hippocampal neurogenesis following oxygen exposure [25,40,48,79]. Mechanistically, the loss of Hes5+ cells indicates disruption of Notch signaling, promoting premature differentiation and progenitor exhaustion [80,81,82]. Translational data further suggest that such early deficits in self-renewal result in persistent impairments in neurogenesis and cognition [17].
At later stages, a pattern of reactive ambivalence emerged: initial progenitor suppression was followed by a delayed, disorganized increase in PCNA+ cells at P14. This unsynchronized proliferative rebound is consistent with ineffective neurogenesis, as increased proliferation does not translate into structural growth, indicating maladaptive circuit formation [83]. Such temporal dysregulation is known to impair hippocampal circuit organization and excitatory/inhibitory balance [28].
DEX treatment preserved progenitor dynamics by maintaining Pax6+ and Sox2+ populations at P9 and P11, thereby preventing early reservoir depletion. This effect is supported by increased Sox2 and PCNA+ expression following DEX treatment [40,84], and by evidence that DEX modulates Pax6+ progenitors to restore physiological growth trajectories after hyperoxic injury [26]. Importantly, DEX prevented the late-stage proliferative overshoot at P14, stabilizing developmental timing and cellular turnover. This normalization likely involves integrated mechanisms, including GDNF/NCAM/CREB signaling [85], inhibition of JNK and p38 MAPK pathways [86], and suppression of microglial activation and inflammatory cytokines [87].
Clinically, the ability of DEX to normalize progenitor dynamics is highly relevant for preterm infants exposed to oxygen therapy, where hyperoxia contributes to adverse neurodevelopmental outcomes, particularly within the lung–brain axis in bronchopulmonary dysplasia [14,16]. Consistent with this, DEX exhibits a multifaceted neuroprotective profile, reducing oxidative stress, limiting lipid peroxidation, and preserving transcriptional programs critical for neuronal development [39,41,88].

4.4. Restoration of the Neurotrophic Niche and Neuronal Plasticity

This study demonstrates that DEX confers robust, multimodal neuroprotection against hyperoxia-induced hippocampal injury, primarily by restoring neurotrophic signaling and promoting neuronal maturation and plasticity. Hyperoxia markedly delayed the transition from immature progenitors to mature neurons (NeuN+/Calb1+), coinciding with sustained downregulation of BDNF, NGF, and NT3. This neurotrophic deficit impaired synaptogenesis and dendritic development, reflected by reduced Synaptophysin (Syp) levels [17,88], consistent with reports of decreased PSD95 and GAP43 and subsequent long-term cognitive deficits in neonatal models [21,28,40,47,89].
DEX restored neurotrophin expression throughout P9–P14, facilitating granule cell maturation. Mechanistically, DEX enhances astrocytic BDNF via ERK-dependent signaling and activates the BDNF/TrkB pathway, reducing apoptosis and improving functional outcomes [90,91]. Sustained neurotrophic support also preserved key developmental markers (e.g., PSA-NCAM+, Nestin+, Sox2, Tbr1/2, Prox1) suppressed by hyperoxia [26,40].
In parallel, DEX modulated plasticity-related pathways. Hyperoxia reduced expression of Sema3a, Nrp1, and Nrg1, whereas DEX restored their levels [40]. The Sema3a/neuropilin-1 axis is critical for activity-dependent synaptic plasticity and AMPA receptor trafficking [92]. DEX further supports hippocampal neurogenesis and spatial learning via GDNF/NCAM/CREB signaling and NMDA receptor phosphorylation, while preserving Purkinje cells and cerebellar progenitors [26,85,93].
In terms of translational relevance, DEX seems to have remarkable pharmacological properties not only for efficacy for neuroprotection in injury-stimulated animals, but also for safety in control animals. It is of high relevance for the goal of defining a neuroprotective compound for the clinical use in a vulnerable patient population represented in newborn and preterm infants, that it will not itself cause damage in cells, brains, and patients [38]. Notably, in our experiments, DEX appeared to be harmless in all experimental readouts of cellular development, survival, and anti-oxidant functions in the brains of newborn rats. In comparison to many other CNS protective agents, this beneficial efficacy-harm-profile of DEX is very promising for benign and yet protective use in the neonatal and preterm infant population, highlighting it as candidate for future research in well-defined clinical studies.
Overall, DEX exerts neuroprotection by targeting multiple injury pathways, including oxidative stress, neurotrophic depletion, synaptic dysfunction, and mitochondrial impairment [39,40,41,90,91]. By restoring neurotrophic and plasticity signaling, it promotes not only neuronal survival but functional network integration [40,85,94]. Long-term data indicate preserved hippocampal plasticity and intact LTP following neonatal DEX exposure, supporting its safety and translational potential in the preterm brain [75,94].

4.5. Limitations and Future Research Directions

For gene expression analyses, we used one complete cerebral hemisphere after removal of the olfactory bulb and cerebellum. We acknowledge that the obtained transcriptional data cannot be attributed exclusively to the hippocampus and that the investigated markers are also expressed in other regions of the developing brain [95,96,97,98,99,100]. The experimental approach was chosen deliberately because both hyperoxia-induced injury and systemic α2-adrenoceptor agonist exposure are not restricted to a single anatomical region but affect multiple cellular and developmental pathways throughout the immature brain. During the early postnatal period, however, the dentate gyrus represents one of the most active neurogenic niches and is therefore particularly susceptible to disturbances in proliferation, differentiation, and neuronal maturation [101]. Consequently, transcriptional alterations detected in whole-hemisphere homogenates are likely to reflect, at least in part, hippocampus-associated developmental processes. In addition, the use of whole-hemisphere tissue reduced variability associated with microdissection of small and developmentally dynamic brain structures in neonatal animals and allowed a robust assessment of global neurodevelopmental responses. Further region-specific transcriptional studies may help to refine these observations in future investigations.
We acknowledge that a limitation of the current study is the lack of immediate functional validation, including detailed structural assessments of spine morphogenesis or long-term behavioral and cognitive phenotypic testing. While neonatal hyperoxia is well-known to cause lasting motor and behavioral deficits, the present study deliberately focused on mapping the longitudinal, multi-stage molecular and cellular landscape (P9 to P14) during the recovery phase, moving beyond simple acute snapshot analyses. Demonstrating that a single dose of dexmedetomidine can partially rescue neural progenitor niches and protect cellular maturation during this critical developmental window provides a necessary mechanistic foundation. Nevertheless, future long-term studies utilizing adolescent and adult behavioral matrices alongside high-resolution structural imaging are warranted to definitively confirm whether these preserved molecular trajectories translate into sustained functional neuroprotection.
Furthermore, the present study utilized a single-dose regimen designed to intercept the immediate, hyperacute oxidative and apoptotic cascades triggered at the onset of the 24 h hyperoxic insult. While our findings demonstrate that this single early intervention is sufficient to yield sustained protective and regenerative effects on the hippocampal neurogenic niche up to P14, we acknowledge that alternative treatment schemes, such as repeated dosing during the recovery phase or delayed post-injury administration, were not evaluated. Investigating repeated or post-injury dosing protocols remains a critical objective for future studies, particularly to optimize therapeutic strategies for clinical scenarios characterized by chronic, prolonged, or intermittent oxygen fluctuations in the neonatal intensive care unit.

5. Conclusions

In summary, neonatal hyperoxia disrupts hippocampal development via three key mechanisms: persistent oxidative–apoptotic signaling, depletion of the neural progenitor pool, and suppression of the neurotrophic niche required for maturation. Dexmedetomidine (DEX) counteracts these processes through a multimodal neuroprotective profile. By enhancing antioxidant and autophagic responses, DEX limits apoptotic signaling, while acting as an ontogenetic stabilizer that prevents maturation arrest and maladaptive reactive proliferation. Through preservation of neurogenic timing and neurotrophic support, DEX maintains the structural and functional trajectory of the developing brain. These findings highlight its potential not only as a safe sedative but also as a highly efficient neuroprotective agent in preterm infants exposed to hyperoxic stress.

Supplementary Materials

The following supporting information can be downloaded at: https://www.mdpi.com/article/10.3390/cells15121094/s1, Table S1: Sequences of oligonucleotides, Table S2: Underlying 2−ΔΔCt values utilized for the generation of RT-qPCR box-and-whisker plots at P9. Table S3: Underlying 2−ΔΔCt values utilized for the generation of RT-qPCR box-and-whisker plots at P11. Table S4: Underlying 2−ΔΔCt values utilized for the generation of RT-qPCR box-and-whisker plots at P14.

Author Contributions

Conceptualization, S.E.; methodology, S.E.; validation, S.E., C.B. and T.S.; formal analysis, S.E.; investigation, S.E.; resources, S.E. and C.B.; data curation, S.E.; writing—original draft preparation, S.E.; writing—review and editing, S.E., C.B. and T.S.; visualization, S.E.; supervision, S.E. and T.S.; project administration, S.E.; funding acquisition, S.E. All authors have read and agreed to the published version of the manuscript.

Funding

This research was supported by our employer, the Department of Neonatology, Charité-Universitätsmedizin Berlin, Germany, and by the “Förderverein für frühgeborene Kinder an der Charité e.V.” and Sonnenfeld Stiftung, Berlin, Germany.

Institutional Review Board Statement

Animal care and the general protocols for animal use were approved by the local animal welfare authorities (LAGeSo, approval number G-0145/13 on 1 July 2013, and G-0139/18 on 3 July 2018) and followed institutional guidelines.

Informed Consent Statement

Not applicable.

Data Availability Statement

The data presented in this study are available on request from the corresponding author due to the ongoing nature of the research project. The oligonucleotides used for qPCR and their target gene sequences are summarized in the Supplementary Table S1.

Acknowledgments

We would like to thank Evy Strauß, who passed away before this work was completed, for her assistance with the elaborate animal preparations and the preparation of paraffin sections. Many thanks to Nora Künzel for preparing the immunohistological stainings.

Conflicts of Interest

The authors declare no conflicts of interest.

References

  1. Bruschettini, M.; Moberg, T.; O’Donnell, C.P.; Davis, P.G.; Morley, C.J.; Moja, L.; Calevo, M.G. Sustained versus standard inflations during neonatal resuscitation to prevent mortality and improve respiratory outcomes. Cochrane Database Syst. Rev. 2025, 7, Cd004953. [Google Scholar] [CrossRef]
  2. Mamidi, R.R.; McEvoy, C.T. Oxygen in the neonatal ICU: A complicated history and where are we now? Front. Pediatr. 2024, 12, 1371710. [Google Scholar] [CrossRef]
  3. Albertella, M.; Gentyala, R.R.; Paraskevas, T.; Ehret, D.; Bruschettini, M.; Soll, R. Superoxide dismutase for bronchopulmonary dysplasia in preterm infants. Cochrane Database Syst. Rev. 2023, 10, Cd013232. [Google Scholar] [CrossRef] [PubMed]
  4. Peña-Bautista, C.; Durand, T.; Vigor, C.; Oger, C.; Galano, J.M.; Cháfer-Pericás, C. Non-invasive assessment of oxidative stress in preterm infants. Free Radic. Biol. Med. 2019, 142, 73–81. [Google Scholar] [CrossRef]
  5. Teng, C.; Wei, J.; Zhu, Y.; Chen, A.; Chen, X. Mitochondrial dysfunction in neonatal brain injury: From molecular mechanisms to therapeutic interventions. J. Transl. Med. 2026, 24, 698. [Google Scholar] [CrossRef] [PubMed]
  6. Badurdeen, S.; Cheong, J.L.Y.; Donath, S.; Graham, H.; Hooper, S.B.; Polglase, G.R.; Jacobs, S.; Davis, P.G. Early Hyperoxemia and 2-year Outcomes in Infants with Hypoxic-ischemic Encephalopathy: A Secondary Analysis of the Infant Cooling Evaluation Trial. J. Pediatr. 2024, 267, 113902. [Google Scholar] [CrossRef] [PubMed]
  7. Martínez-Orgado, J.; Martínez-Vega, M.; Silva, L.; Romero, A.; de Hoz-Rivera, M.; Villa, M.; Del Pozo, A. Protein Carbonylation as a Biomarker of Oxidative Stress and a Therapeutic Target in Neonatal Brain Damage. Antioxidants 2023, 12, 1839. [Google Scholar] [CrossRef]
  8. Alva, R.; Mirza, M.; Baiton, A.; Lazuran, L.; Samokysh, L.; Bobinski, A.; Cowan, C.; Jaimon, A.; Obioru, D.; Al Makhoul, T.; et al. Oxygen toxicity: Cellular mechanisms in normobaric hyperoxia. Cell Biol. Toxicol. 2023, 39, 111–143. [Google Scholar] [CrossRef]
  9. Simon Machado, R.; Mathias, K.; Joaquim, L.; de Quadros, R.W.; Rezin, G.T.; Petronilho, F. Hyperoxia and brain: The link between necessity and injury from a molecular perspective. Neurotox. Res. 2024, 42, 25. [Google Scholar] [CrossRef]
  10. Truttmann, A.C.; Ginet, V.; Puyal, J. Current Evidence on Cell Death in Preterm Brain Injury in Human and Preclinical Models. Front. Cell Dev. Biol. 2020, 8, 27. [Google Scholar] [CrossRef]
  11. Dapaah-Siakwan, F.; Zambrano, R.; Luo, S.; Duncan, M.R.; Kerr, N.; Donda, K.; de Rivero Vaccari, J.P.; Keane, R.W.; Dietrich, W.D.; Benny, M.; et al. Caspase-1 Inhibition Attenuates Hyperoxia-induced Lung and Brain Injury in Neonatal Mice. Am. J. Respir. Cell Mol. Biol. 2019, 61, 341–354. [Google Scholar] [CrossRef]
  12. Reich, B.; Hoeber, D.; Bendix, I.; Felderhoff-Mueser, U. Hyperoxia and the Immature Brain. Dev. Neurosci. 2016, 38, 311–330. [Google Scholar] [CrossRef] [PubMed]
  13. Brill, C.; Scheuer, T.; Bührer, C.; Endesfelder, S.; Schmitz, T. Oxygen impairs oligodendroglial development via oxidative stress and reduced expression of HIF-1α. Sci. Rep. 2017, 7, 43000, Correction in Sci. Rep. 2017, 7, 46800.. [Google Scholar] [CrossRef]
  14. Xue-Jiao, H.; Jian-Hua, F. A review of the effects of early postnatal hyperoxia exposure on the immature brain. Exp. Neurol. 2023, 370, 114550. [Google Scholar] [CrossRef] [PubMed]
  15. Serdar, M.; Walther, K.A.; Gallert, M.; Kempe, K.; Obst, S.; Labusek, N.; Herrmann, R.; Herz, J.; Felderhoff-Müser, U.; Bendix, I. Prenatal inflammation exacerbates hyperoxia-induced neonatal brain injury. J. Neuroinflamm. 2025, 22, 57. [Google Scholar] [CrossRef]
  16. Obst, S.; Herz, J.; Alejandre Alcazar, M.A.; Endesfelder, S.; Möbius, M.A.; Rüdiger, M.; Felderhoff-Müser, U.; Bendix, I. Perinatal Hyperoxia and Developmental Consequences on the Lung-Brain Axis. Oxid. Med. Cell Longev. 2022, 2022, 5784146. [Google Scholar] [CrossRef]
  17. Lithopoulos, M.A.; Toussay, X.; Zhong, S.; Xu, L.; Mustafa, S.B.; Ouellette, J.; Freitas-Andrade, M.; Comin, C.H.; Bassam, H.A.; Baker, A.N.; et al. Neonatal hyperoxia in mice triggers long-term cognitive deficits via impairments in cerebrovascular function and neurogenesis. J. Clin. Investig. 2022, 132, e146095. [Google Scholar] [CrossRef]
  18. Kostović, I. Development of the basic architecture of neocortical circuitry in the human fetus as revealed by the coupling spatiotemporal pattern of synaptogenesis along with microstructure and macroscale in vivo MR imaging. Brain Struct. Funct. 2024, 229, 2339–2367. [Google Scholar] [CrossRef]
  19. Yuan, S.; Liu, M.; Kim, S.; Yang, J.; Barkovich, A.J.; Xu, D.; Kim, H. Cyto/myeloarchitecture of cortical gray matter and superficial white matter in early neurodevelopment: Multimodal MRI study in preterm neonates. Cereb. Cortex. 2022, 33, 357–373. [Google Scholar] [CrossRef] [PubMed]
  20. Scheuer, T.; dem Brinke, E.A.; Grosser, S.; Wolf, S.A.; Mattei, D.; Sharkovska, Y.; Barthel, P.C.; Endesfelder, S.; Friedrich, V.; Bührer, C.; et al. Reduction of cortical parvalbumin-expressing GABAergic interneurons in a rodent hyperoxia model of preterm birth brain injury with deficits in social behavior and cognition. Development 2021, 148, dev198390. [Google Scholar] [CrossRef]
  21. Scheuer, T.; Endesfelder, S.; Auf dem Brinke, E.; Bührer, C.; Schmitz, T. Neonatal Oxidative Stress Impairs Cortical Synapse Formation and GABA Homeostasis in Parvalbumin-Expressing Interneurons. Oxid. Med. Cell Longev. 2022, 2022, 8469756. [Google Scholar] [CrossRef]
  22. Inder, T.E.; Volpe, J.J.; Anderson, P.J. Defining the Neurologic Consequences of Preterm Birth. N. Engl. J. Med. 2023, 389, 441–453. [Google Scholar] [CrossRef]
  23. Endesfelder, S.; Weichelt, U.; Strauss, E.; Schlor, A.; Sifringer, M.; Scheuer, T.; Buhrer, C.; Schmitz, T. Neuroprotection by Caffeine in Hyperoxia-Induced Neonatal Brain Injury. Int. J. Mol. Sci. 2017, 18, 187. [Google Scholar] [CrossRef]
  24. Giszas, V.; Strauß, E.; Bührer, C.; Endesfelder, S. The Conflicting Role of Caffeine Supplementation on Hyperoxia-Induced Injury on the Cerebellar Granular Cell Neurogenesis of Newborn Rats. Oxid. Med. Cell Longev. 2022, 2022, 5769784. [Google Scholar] [CrossRef] [PubMed]
  25. Heise, J.; Schmitz, T.; Bührer, C.; Endesfelder, S. Protective Effects of Early Caffeine Administration in Hyperoxia-Induced Neurotoxicity in the Juvenile Rat. Antioxidants 2023, 12, 295. [Google Scholar] [CrossRef] [PubMed]
  26. Puls, R.; von Haefen, C.; Bührer, C.; Endesfelder, S. Protective Effect of Dexmedetomidine against Hyperoxia-Damaged Cerebral Neurodevelopment in the Juvenile Rat. Antioxidants 2023, 12, 980. [Google Scholar] [CrossRef]
  27. Puls, R.; von Haefen, C.; Bührer, C.; Endesfelder, S. Dexmedetomidine Protects Cerebellar Neurons against Hyperoxia-Induced Oxidative Stress and Apoptosis in the Juvenile Rat. Int. J. Mol. Sci. 2023, 24, 7804. [Google Scholar] [CrossRef]
  28. Abbah, J.; Vacher, C.-M.; Goldstein, E.Z.; Li, Z.; Kundu, S.; Talbot, B.; Bhattacharya, S.; Hashimoto-Torii, K.; Wang, L.; Banerjee, P.; et al. Oxidative Stress-Induced Damage to the Developing Hippocampus Is Mediated by GSK3β. J. Neurosci. 2022, 42, 4812–4827. [Google Scholar] [CrossRef] [PubMed]
  29. Ramani, M.; Kumar, R.; Halloran, B.; Lal, C.V.; Ambalavanan, N.; McMahon, L.L. Supraphysiological Levels of Oxygen Exposure During the Neonatal Period Impairs Signaling Pathways Required for Learning and Memory. Sci. Rep. 2018, 8, 9914. [Google Scholar] [CrossRef]
  30. Sahinoglu, E.; Lo, E.; El Shahed, A.; Ly, L.G.; Kalish, B.T.; Cizmeci, M.N. Neonatal neuroplasticity and metaplasticity: Bridging neuroscience to clinical practice. Pediatr. Res. 2026. [Google Scholar] [CrossRef]
  31. Caballero, A.; Bashqoy, F.; Spilios, M.; Saad, A.; Tracy, J.; Verma, S.; Wachtel, E.V. Dexmedetomidine as the primary sedative in the NICU. J. Perinatol. 2025, 46, 598–604. [Google Scholar] [CrossRef]
  32. Puia-Dumitrescu, M.; Comstock, B.A.; Li, S.; Heagerty, P.J.; Perez, K.M.; Law, J.B.; Wood, T.R.; Gogcu, S.; Mayock, D.E.; Juul, S.E.; et al. Assessment of 2-Year Neurodevelopmental Outcomes in Extremely Preterm Infants Receiving Opioids and Benzodiazepines. JAMA Netw. Open 2021, 4, e2115998. [Google Scholar] [CrossRef]
  33. Schiller, R.; IJsselstijn, H.; Hoskote, A.; White, T.; Verhulst, F.; van Heijst, A.; Tibboel, D. Memory deficits following neonatal critical illness: A common neurodevelopmental pathway. Lancet Child. Adolesc. Health 2018, 2, 281–289. [Google Scholar] [CrossRef]
  34. Stróżyk, A.; Paraskevas, T.; Romantsik, O.; Calevo, M.G.; Banzi, R.; Ley, D.; Bruschettini, M. Pharmacological pain and sedation interventions for the prevention of intraventricular hemorrhage in preterm infants on assisted ventilation—an overview of systematic reviews. Cochrane Database Syst. Rev. 2023. [Google Scholar] [CrossRef]
  35. Chen, X.; Chen, D.; Li, Q.; Wu, S.; Pan, J.; Liao, Y.; Zheng, X.; Zeng, W. Dexmedetomidine Alleviates Hypoxia-Induced Synaptic Loss and Cognitive Impairment via Inhibition of Microglial NOX2 Activation in the Hippocampus of Neonatal Rats. Oxid. Med. Cell Longev. 2021, 2021, 6643171. [Google Scholar] [CrossRef]
  36. Sun, Z.; Lin, Y.; Li, Y.; Ren, T.; Du, G.; Wang, J.; Jin, X.; Yang, L.C. The effect of dexmedetomidine on inflammatory inhibition and microglial polarization in BV-2 cells. Neurol. Res. 2018, 40, 838–846. [Google Scholar] [CrossRef] [PubMed]
  37. Chamzas, A.; Aycan, F.; Gopalakrishnan, M.; El Metwally, D. Dexmedetomidine versus opioids for sedation during therapeutic hypothermia in neonatal HIE: Efficacy, safety, and dose-response relationship. Pediatr. Res. 2026. ahead of print. [Google Scholar] [CrossRef]
  38. Cocchi, E.; Shabani, J.; Aceti, A.; Ancora, G.; Corvaglia, L.; Marchetti, F. Dexmedetomidine as a Promising Neuroprotective Sedoanalgesic in Neonatal Therapeutic Hypothermia: A Systematic Review and Meta-Analysis. Neonatology 2025, 122, 495–504. [Google Scholar] [CrossRef]
  39. Zhu, Y.; Chen, A.; Gai, C.; Lin, L.; Teng, C.; Wei, J.; Yang, Y.; Wei, X.; Chen, X. Dexmedetomidine in ischemic and hemorrhagic brain injury: Neuroprotection from mechanisms to therapy. Biomed. Pharmacother. 2025, 193, 118872. [Google Scholar] [CrossRef] [PubMed]
  40. Endesfelder, S.; Makki, H.; von Haefen, C.; Spies, C.D.; Buhrer, C.; Sifringer, M. Neuroprotective effects of dexmedetomidine against hyperoxia-induced injury in the developing rat brain. PLoS ONE 2017, 12, e0171498. [Google Scholar] [CrossRef] [PubMed]
  41. Sifringer, M.; von Haefen, C.; Krain, M.; Paeschke, N.; Bendix, I.; Buhrer, C.; Spies, C.D.; Endesfelder, S. Neuroprotective effect of dexmedetomidine on hyperoxia-induced toxicity in the neonatal rat brain. Oxid. Med. Cell Longev. 2015, 2015, 530371. [Google Scholar] [CrossRef] [PubMed]
  42. Unchiti, K.; Leurcharusmee, P.; Samerchua, A.; Pipanmekaporn, T.; Chattipakorn, N.; Chattipakorn, S.C. The potential role of dexmedetomidine on neuroprotection and its possible mechanisms: Evidence from in vitro and in vivo studies. Eur. J. Neurosci. 2021, 54, 7006–7047. [Google Scholar] [CrossRef]
  43. Hu, Y.; Zhou, H.; Zhang, H.; Sui, Y.; Zhang, Z.; Zou, Y.; Li, K.; Zhao, Y.; Xie, J.; Zhang, L. The neuroprotective effect of dexmedetomidine and its mechanism. Front. Pharmacol. 2022, 13, 965661. [Google Scholar] [CrossRef]
  44. Percie du Sert, N.; Hurst, V.; Ahluwalia, A.; Alam, S.; Avey, M.T.; Baker, M.; Browne, W.J.; Clark, A.; Cuthill, I.C.; Dirnagl, U.; et al. The ARRIVE guidelines 2.0: Updated guidelines for reporting animal research. Exp. Physiol. 2020, 105, 1459–1466. [Google Scholar] [CrossRef]
  45. Livak, K.J.; Schmittgen, T.D. Analysis of relative gene expression data using real-time quantitative PCR and the 2(-Delta Delta C(T)) Method. Methods 2001, 25, 402–408. [Google Scholar] [CrossRef]
  46. Sirinyan, M.; Sennlaub, F.; Dorfman, A.; Sapieha, P.; Gobeil, F., Jr.; Hardy, P.; Lachapelle, P.; Chemtob, S. Hyperoxic exposure leads to nitrative stress and ensuing microvascular degeneration and diminished brain mass and function in the immature subject. Stroke 2006, 37, 2807–2815. [Google Scholar] [CrossRef]
  47. Scheuer, T.; Sharkovska, Y.; Tarabykin, V.; Marggraf, K.; Brockmoller, V.; Buhrer, C.; Endesfelder, S.; Schmitz, T. Neonatal Hyperoxia Perturbs Neuronal Development in the Cerebellum. Mol. Neurobiol. 2017, 55, 3901–3915. [Google Scholar] [CrossRef]
  48. Endesfelder, S. Caffeine: The Story beyond Oxygen-Induced Lung and Brain Injury in Neonatal Animal Models-A Narrative Review. Antioxidants 2024, 13, 1076. [Google Scholar] [CrossRef] [PubMed]
  49. Stolp, H.B.; Fleiss, B.; Arai, Y.; Supramaniam, V.; Vontell, R.; Birtles, S.; Yates, A.G.; Baburamani, A.A.; Thornton, C.; Rutherford, M.; et al. Interneuron Development Is Disrupted in Preterm Brains With Diffuse White Matter Injury: Observations in Mouse and Human. Front. Physiol. 2019, 10, 955. [Google Scholar] [CrossRef]
  50. Tibrewal, M.; Cheng, B.; Dohare, P.; Hu, F.; Mehdizadeh, R.; Wang, P.; Zheng, D.; Ungvari, Z.; Ballabh, P. Disruption of Interneuron Neurogenesis in Premature Newborns and Reversal with Estrogen Treatment. J. Neurosci. 2018, 38, 1100–1113. [Google Scholar] [CrossRef] [PubMed]
  51. Askie, L.M.; Darlow, B.A.; Davis, P.G.; Finer, N.; Stenson, B.; Vento, M.; Whyte, R. Effects of targeting lower versus higher arterial oxygen saturations on death or disability in preterm infants. Cochrane Database Syst. Rev. 2017, 4, Cd011190. [Google Scholar] [CrossRef]
  52. Zhao, Y.; Liang, L.; Liu, G.; Liu, Y.; Zheng, H.; Dai, L. The effects of short time hyperoxia on glutamate concentration and glutamate transporters expressions in brain of neonatal rats. Neurosci. Lett. 2021, 758, 136013. [Google Scholar] [CrossRef] [PubMed]
  53. Pomatto, L.C.D.; Sun, P.Y.; Yu, K.; Gullapalli, S.; Bwiza, C.P.; Sisliyan, C.; Wong, S.; Zhang, H.; Forman, H.J.; Oliver, P.L.; et al. Limitations to adaptive homeostasis in an hyperoxia-induced model of accelerated ageing. Redox Biol. 2019, 24, 101194. [Google Scholar] [CrossRef]
  54. Navarro, E.; Esteras, N. Multitarget Effects of Nrf2 Signalling in the Brain: Common and Specific Functions in Different Cell Types. Antioxidants 2024, 13, 1502. [Google Scholar] [CrossRef] [PubMed]
  55. Hu, Y.; Wang, P.; Han, K. Hydrogen Attenuated Inflammation Response and Oxidative in Hypoxic Ischemic Encephalopathy via Nrf2 Mediated the Inhibition of NLRP3 and NF-κB. Neuroscience 2022, 485, 23–36. [Google Scholar] [CrossRef]
  56. Qin, Z.; Xu, Y. Dexmedetomidine Alleviates Brain Ischemia/Reperfusion Injury by Regulating Metastasis-associated Lung Adenocarcinoma Transcript 1/MicroRNA-140-5p/ Nuclear Factor Erythroid-derived 2-like 2 Axis. Protein Pept. Lett. 2024, 31, 116–127. [Google Scholar] [CrossRef]
  57. Sun, T.; Yu, H.; Li, D.; Zhang, H.; Fu, J. Emerging role of metabolic reprogramming in hyperoxia-associated neonatal diseases. Redox Biol. 2023, 66, 102865. [Google Scholar] [CrossRef] [PubMed]
  58. Zhou, J.; Li, X.Y.; Liu, Y.J.; Feng, J.; Wu, Y.; Shen, H.M.; Lu, G.D. Full-coverage regulations of autophagy by ROS: From induction to maturation. Autophagy 2022, 18, 1240–1255. [Google Scholar] [CrossRef]
  59. Xue, H.; Wu, Z.; Xu, Y.; Gao, Q.; Zhang, Y.; Li, C.; Zhao, P. Dexmedetomidine post-conditioning ameliorates long-term neurological outcomes after neonatal hypoxic ischemia: The role of autophagy. Life Sci. 2021, 270, 118980. [Google Scholar] [CrossRef]
  60. Feng, X.; Ma, W.; Zhu, J.; Jiao, W.; Wang, Y. Dexmedetomidine alleviates early brain injury following traumatic brain injury by inhibiting autophagy and neuroinflammation through the ROS/Nrf2 signaling pathway. Mol. Med. Rep. 2021, 24, 661. [Google Scholar] [CrossRef]
  61. Jin, J.; Cen, Q.; Wang, H.; Xin, Y.; Feng, J.; Cui, Y.; Li, J.; You, Z.; Jing, F.; Yu, Y.; et al. New perspective on neurodegenerative diseases: Focusing on the interaction between autophagy and oxidative stress and targeted strategies. Neurobiol. Dis. 2026, 220, 107283. [Google Scholar] [CrossRef]
  62. Tsivitis, A.; Wang, A.; Murphy, J.; Khan, A.; Jin, Z.; Moore, R.; Tateosian, V.; Bergese, S. Anesthesia, the developing brain, and dexmedetomidine for neuroprotection. Front. Neurol. 2023, 14, 1150135. [Google Scholar] [CrossRef] [PubMed]
  63. Yis, U.; Kurul, S.H.; Kumral, A.; Cilaker, S.; Tugyan, K.; Genc, S.; Yilmaz, O. Hyperoxic exposure leads to cell death in the developing brain. Brain Dev. 2008, 30, 556–562. [Google Scholar] [CrossRef]
  64. Johnston, M.V.; Fatemi, A.; Wilson, M.A.; Northington, F. Treatment advances in neonatal neuroprotection and neurointensive care. Lancet Neurol. 2011, 10, 372–382. [Google Scholar] [CrossRef] [PubMed]
  65. Hagberg, H.; Mallard, C.; Rousset, C.I.; Thornton, C. Mitochondria: Hub of injury responses in the developing brain. Lancet Neurol. 2014, 13, 217–232. [Google Scholar] [CrossRef]
  66. Dzietko, M.; Boos, V.; Sifringer, M.; Polley, O.; Gerstner, B.; Genz, K.; Endesfelder, S.; Borner, C.; Jacotot, E.; Chauvier, D.; et al. A critical role for Fas/CD-95 dependent signaling pathways in the pathogenesis of hyperoxia-induced brain injury. Ann. Neurol. 2008, 64, 664–673. [Google Scholar] [CrossRef]
  67. Zaghloul, N.; Nasim, M.; Patel, H.; Codipilly, C.; Marambaud, P.; Dewey, S.; Schiffer, W.K.; Ahmed, M. Overexpression of extracellular superoxide dismutase has a protective role against hyperoxia-induced brain injury in neonatal mice. FEBS J. 2012, 279, 871–881. [Google Scholar] [CrossRef]
  68. Gatica, S.; Aravena, C.; Prado, Y.; Aravena, D.; Echeverría, C.; Santibanez, J.F.; Riedel, C.A.; Stehberg, J.; Simon, F. Appraisal of the Neuroprotective Effect of Dexmedetomidine: A Meta-Analysis. Adv. Exp. Med. Biol. 2023, 1408, 163–181. [Google Scholar] [CrossRef] [PubMed]
  69. Akpınar, H.; Nazıroğlu, M.; Övey, I.S.; Çiğ, B.; Akpınar, O. The neuroprotective action of dexmedetomidine on apoptosis, calcium entry and oxidative stress in cerebral ischemia-induced rats: Contribution of TRPM2 and TRPV1 channels. Sci. Rep. 2016, 6, 37196, Correction in Sci. Rep. 2018, 8, 47002.. [Google Scholar] [CrossRef]
  70. Li, Y.; Zhang, W.; Mantell, L.L.; Kazzaz, J.A.; Fein, A.M.; Horowitz, S. Nuclear factor-kappaB is activated by hyperoxia but does not protect from cell death. J. Biol. Chem. 1997, 272, 20646–20649. [Google Scholar]
  71. Lv, J.; Wei, Y.; Chen, Y.; Zhang, X.; Gong, Z.; Jiang, Y.; Gong, Q.; Zhou, L.; Wang, H.; Xie, Y. Dexmedetomidine attenuates propofol-induce neuroapoptosis partly via the activation of the PI3k/Akt/GSK3beta pathway in the hippocampus of neonatal rats. Environ. Toxicol. Pharmacol. 2017, 52, 121–128. [Google Scholar] [CrossRef]
  72. Wang, Y.; Wu, C.; Han, B.; Xu, F.; Mao, M.; Guo, X.; Wang, J. Dexmedetomidine attenuates repeated propofol exposure-induced hippocampal apoptosis, PI3K/Akt/Gsk-3β signaling disruption, and juvenile cognitive deficits in neonatal rats. Mol. Med. Rep. 2016, 14, 769–775. [Google Scholar] [CrossRef] [PubMed]
  73. Xing, N.; Xing, F.; Li, Y.; Li, P.; Zhang, J.; Wang, D.; Zhang, W.; Yang, J. Dexmedetomidine improves propofol-induced neuronal injury in rat hippocampus with the involvement of miR-34a and the PI3K/Akt signaling pathway. Life Sci. 2020, 247, 117359. [Google Scholar] [CrossRef]
  74. Chen, X.; Chen, D.; Chen, P.; Chen, A.; Deng, J.; Wei, J.; Zeng, W.; Zheng, X. Dexmedetomidine Attenuates Apoptosis and Neurological Deficits by Modulating Neuronal NADPH Oxidase 2-Derived Oxidative Stress in Neonates Following Hypoxic Brain Injury. Antioxidants 2022, 11, 2199. [Google Scholar] [CrossRef]
  75. Rodríguez-González, R.; Sobrino, T.; Veiga, S.; López, P.; Rodríguez-García, J.; del Río, S.V.; Baluja, A.; Castillo, J.; Álvarez, J. Neuroprotective effects of dexmedetomidine conditioning strategies: Evidences from an in vitro model of cerebral ischemia. Life Sci. 2016, 144, 162–169. [Google Scholar] [CrossRef] [PubMed]
  76. Zhang, Q.Y.; Feng, Y.; Cai, H. Dexmedetomidine’s protective mechanism against hyperoxic injury in neonatal rats. J. Physiol. Pharmacol. 2024, 75, 339–348. [Google Scholar] [CrossRef]
  77. Hutton, S.R.; Pevny, L.H. SOX2 expression levels distinguish between neural progenitor populations of the developing dorsal telencephalon. Dev. Biol. 2011, 352, 40–47. [Google Scholar] [CrossRef]
  78. Ohtsuka, T.; Sakamoto, M.; Guillemot, F.; Kageyama, R. Roles of the basic helix-loop-helix genes Hes1 and Hes5 in expansion of neural stem cells of the developing brain. J. Biol. Chem. 2001, 276, 30467–30474. [Google Scholar] [CrossRef]
  79. Endesfelder, S.; Zaak, I.; Weichelt, U.; Bührer, C.; Schmitz, T. Caffeine protects neuronal cells against injury caused by hyperoxia in the immature brain. Free Radic. Biol. Med. 2014, 67, 221–234. [Google Scholar] [CrossRef]
  80. Du, M.; Tan, Y.; Liu, G.; Liu, L.; Cao, F.; Liu, J.; Jiang, P.; Xu, Y. Effects of the Notch signalling pathway on hyperoxia-induced immature brain damage in newborn mice. Neurosci. Lett. 2017, 653, 220–227. [Google Scholar] [CrossRef] [PubMed]
  81. Hatakeyama, J.; Bessho, Y.; Katoh, K.; Ookawara, S.; Fujioka, M.; Guillemot, F.; Kageyama, R. Hes genes regulate size, shape and histogenesis of the nervous system by control of the timing of neural stem cell differentiation. Development 2004, 131, 5539–5550. [Google Scholar] [CrossRef] [PubMed]
  82. Imayoshi, I.; Sakamoto, M.; Yamaguchi, M.; Mori, K.; Kageyama, R. Essential roles of Notch signaling in maintenance of neural stem cells in developing and adult brains. J. Neurosci. 2010, 30, 3489–3498. [Google Scholar] [CrossRef]
  83. Porzionato, A.; Macchi, V.; Zaramella, P.; Sarasin, G.; Grisafi, D.; Dedja, A.; Chiandetti, L.; De Caro, R. Effects of postnatal hyperoxia exposure on the rat dentate gyrus and subventricular zone. Brain Struct. Funct. 2015, 220, 229–247. [Google Scholar] [CrossRef]
  84. Englund, C.; Fink, A.; Lau, C.; Pham, D.; Daza, R.A.; Bulfone, A.; Kowalczyk, T.; Hevner, R.F. Pax6, Tbr2, and Tbr1 are expressed sequentially by radial glia, intermediate progenitor cells, and postmitotic neurons in developing neocortex. J. Neurosci. 2005, 25, 247–251. [Google Scholar] [CrossRef]
  85. Zhang, Y.; Gao, Q.; Wu, Z.; Xue, H.; Liu, B.; Zhao, P. Dexmedetomidine Promotes Hippocampal Neurogenesis and Improves Spatial Learning and Memory in Neonatal Rats. Drug Des. Devel. Ther. 2019, 13, 4439–4449. [Google Scholar] [CrossRef]
  86. Lei, S.; Lu, P.; Lu, Y.; Zheng, J.; Li, W.; Wang, N.; Zhang, H.; Li, R.; Wang, K.; Wen, J.; et al. Dexmedetomidine Alleviates Neurogenesis Damage Following Neonatal Midazolam Exposure in Rats through JNK and P38 MAPK Pathways. ACS Chem. Neurosci. 2020, 11, 579–591. [Google Scholar] [CrossRef]
  87. Lv, K.; Yang, C.; Xiao, R.; Yang, L.; Liu, T.; Zhang, R.; Fan, X. Dexmedetomidine attenuates ethanol-induced inhibition of hippocampal neurogenesis in neonatal mice. Toxicol. Appl. Pharmacol. 2020, 390, 114881. [Google Scholar] [CrossRef] [PubMed]
  88. Challa, N.V.D.; Chen, S.; Yuan, H.; Duncan, M.R.; Moreno, W.J.; Bramlett, H.; Dietrich, W.D.; Benny, M.; Schmidt, A.F.; Young, K.; et al. GSDMD gene knockout alleviates hyperoxia-induced hippocampal brain injury in neonatal mice. J. Neuroinflamm. 2023, 20, 205. [Google Scholar] [CrossRef] [PubMed]
  89. Ramani, M.; Miller, K.; Brown, J.; Kumar, R.; Kadasamy, J.; McMahon, L.; Ballinger, S.; Ambalavanan, N. Early Life Supraphysiological Levels of Oxygen Exposure Permanently Impairs Hippocampal Mitochondrial Function. Sci. Rep. 2019, 9, 13364. [Google Scholar] [CrossRef]
  90. Degos, V.; Charpentier, T.L.; Chhor, V.; Brissaud, O.; Lebon, S.; Schwendimann, L.; Bednareck, N.; Passemard, S.; Mantz, J.; Gressens, P. Neuroprotective Effects of Dexmedetomidine against Glutamate Agonist-induced Neuronal Cell Death Are Related to Increased Astrocyte Brain-derived Neurotrophic Factor Expression. Anesthesiology 2013, 118, 1123–1132. [Google Scholar] [CrossRef]
  91. Simayi, A.; Qu, L.; Wang, X.L.; Cao, W.Y.; Zhao, X.; Xu, G.P. Mechanisms of dexmedetomidine-induced cerebral protection following ischemic brain injury via the brain-derived neurotrophic factor-tyrosine kinase receptor B pathway. Neuroreport 2026, 37, 297–307. [Google Scholar] [CrossRef]
  92. Jitsuki-Takahashi, A.; Jitsuki, S.; Yamashita, N.; Kawamura, M.; Abe, M.; Sakimura, K.; Sano, A.; Nakamura, F.; Goshima, Y.; Takahashi, T. Activity-induced secretion of semaphorin 3A mediates learning. Eur. J. Neurosci. 2021, 53, 3279–3293. [Google Scholar] [CrossRef]
  93. Lv, J.; Ou, W.; Zou, X.H.; Yao, Y.; Wu, J.L. Effect of dexmedetomidine on hippocampal neuron development and BDNF-TrkB signal expression in neonatal rats. Neuropsychiatr. Dis. Treat. 2016, 12, 3153–3159. [Google Scholar] [CrossRef]
  94. Tachibana, K.; Hashimoto, T.; Kato, R.; Uchida, Y.; Ito, R.; Takita, K.; Morimoto, Y. Neonatal administration with dexmedetomidine does not impair the rat hippocampal synaptic plasticity later in adulthood. Paediatr. Anaesth. 2012, 22, 713–719. [Google Scholar] [CrossRef]
  95. Bedogni, F.; Hodge, R.D.; Elsen, G.E.; Nelson, B.R.; Daza, R.A.; Beyer, R.P.; Bammler, T.K.; Rubenstein, J.L.; Hevner, R.F. Tbr1 regulates regional and laminar identity of postmitotic neurons in developing neocortex. Proc. Natl. Acad. Sci. USA 2010, 107, 13129–13134. [Google Scholar] [CrossRef]
  96. Hsieh, J. Orchestrating transcriptional control of adult neurogenesis. Genes. Dev. 2012, 26, 1010–1021. [Google Scholar] [CrossRef]
  97. Lavado, A.; Oliver, G. Prox1 expression patterns in the developing and adult murine brain. Dev. Dyn. 2007, 236, 518–524. [Google Scholar] [CrossRef]
  98. Miyoshi, G.; Young, A.; Petros, T.; Karayannis, T.; McKenzie Chang, M.; Lavado, A.; Iwano, T.; Nakajima, M.; Taniguchi, H.; Huang, Z.J.; et al. Prox1 Regulates the Subtype-Specific Development of Caudal Ganglionic Eminence-Derived GABAergic Cortical Interneurons. J. Neurosci. 2015, 35, 12869–12889. [Google Scholar] [CrossRef]
  99. Rice, D.; Barone, S., Jr. Critical periods of vulnerability for the developing nervous system: Evidence from humans and animal models. Environ. Health Perspect. 2000, 108, 511–533. [Google Scholar] [CrossRef]
  100. Rodier, P.M. Chronology of neuron development: Animal studies and their clinical implications. Dev. Med. Child. Neurol. 1980, 22, 525–545. [Google Scholar] [CrossRef]
  101. Stefovska, V.G.; Uckermann, O.; Czuczwar, M.; Smitka, M.; Czuczwar, P.; Kis, J.; Kaindl, A.M.; Turski, L.; Turski, W.A.; Ikonomidou, C. Sedative and anticonvulsant drugs suppress postnatal neurogenesis. Ann. Neurol. 2008, 64, 434–445. [Google Scholar] [CrossRef]
Figure 1. Quantification of oxidative stress regulating transcripts for (a) Nrf2, (b) Keap1, (c) GCLC, (d) SOD1, (e) SOD2, and (f) SOD3 of whole cerebrum after 24 h oxygen exposure (P6 to P7) and recovery until for P9, P11, and P14 using qPCR. Data are normalized to the level of mouse pups exposed to normoxia at each time point (control 100%, NO, 21% O2, white bars) with verum groups hyperoxia (HY, 80% O2, black), normoxia with DEX 5 µg/kg (NODEX, light grey), and hyperoxia with DEX 5 µg/kg (HYDEX, dark grey). Data are presented as Box-Whisker-Plots with n = 6 per group. ** p < 0.01, *** p < 0.001 vs. normoxia; # p < 0.05, ## p < 0.01, ### p < 0.001 vs. hyperoxia (ANOVA; Kruskal–Wallis).
Cells 15 01094 g001
Figure 2. Quantification of apoptosis regulating transcripts for (a) Casp3 and (b) AIF of whole cerebrum after 24 h oxygen exposure (P6 to P7) and recovery until for P9, P11, and P14 using qPCR. Data are normalized to the level of mouse pups exposed to normoxia at each time point (control 100%, NO, 21% O2, white bars) with verum groups hyperoxia (HY, 80% O2, black), normoxia with DEX 5 µg/kg (NODEX, light grey), and hyperoxia with DEX 5 µg/kg (HYDEX, dark grey). Data are presented as Box-Whisker-Plots with n = 6 per group. *** p < 0.001, **** p < 0.0001 vs. normoxia; # p < 0.05, ## p < 0.01, #### p < 0.0001 vs. hyperoxia (ANOVA; Kruskal–Wallis).
Cells 15 01094 g002
Figure 3. Quantification of autophagy regulating transcripts for (a) Atg5, (b) Atg12, and (c) Beclin1 of whole cerebrum after 24 h oxygen exposure (P6 to P7) and recovery until for P9, P11, and P14 using qPCR. Data are normalized to the level of mouse pups exposed to normoxia at each time point (control 100%, NO, 21% O2, white bars) with verum groups hyperoxia (HY, 80% O2, black), normoxia with DEX 5 µg/kg (NODEX, light grey), and hyperoxia with DEX 5 µg/kg (HYDEX, dark grey). Data are presented as Box-Whisker-Plots with n = 6 per group. * p < 0.05, *** p < 0.001 vs. normoxia; ## p < 0.01, ### p < 0.001 vs. hyperoxia (ANOVA; Kruskal–Wallis).
Cells 15 01094 g003
Figure 4. Quantification of radial glia pool regulating transcripts for (a) Sox2, (b) Hes5, and (c) Pax6 of whole cerebrum and quantification of (d) Pax6 and (e) Pax6/PCNA immunostaining of dentate gyrus after 24 h oxygen exposure (P6 to P7) and recovery until for P9, P11, and P14 using qPCR. Data are normalized to the level of mouse pups exposed to normoxia at each time point (control 100%, NO, 21% O2, white bars) with verum groups hyperoxia (HY, 80% O2, black), normoxia with DEX 5 µg/kg (NODEX, light grey), and hyperoxia with DEX 5 µg/kg (HYDEX, dark grey). Data are presented as Box-Whisker-Plots with n = 6 per group. * p < 0.05, ** p < 0.01, *** p < 0.001, **** p < 0.0001 vs. normoxia; # p < 0.05, ## p < 0.01, #### p < 0.0001 vs. hyperoxia (ANOVA; Kruskal–Wallis).
Cells 15 01094 g004
Figure 5. Representative sections of the neonatal hippocampus with the dentate gyrus at postnatal day 9 (P9), P11, and P14, after a recovery phase following a 24 h hyperoxia (HY) exposure period (P6–P7) labeled with Pax6 (red), double labeled Pax6/PCNA (orange), PCNA (green) and DAPI (blue), are shown with normoxia (NO, 21% O2), with verum groups hyperoxia (HY, 80% O2), normoxia with DEX 5 µg/kg (NOD), and hyperoxia with DEX 5 µg/kg (HYD).
Cells 15 01094 g005aCells 15 01094 g005b
Figure 6. Quantification of glia pool regulating transcripts for (a) GFAP and (b) Scl1a3, of whole cerebrum after 24 h oxygen exposure (P6 to P7) and recovery until for P9, P11, and P14 using qPCR. Data are normalized to the level of mouse pups exposed to normoxia at each time point (control 100%, NO, 21% O2, white bars) with verum groups hyperoxia (HY, 80% O2, black), normoxia with DEX 5 µg/kg (NODEX, light grey), and hyperoxia with DEX 5 µg/kg (HYDEX, dark grey). Data are presented as Box-Whisker-Plots with n = 6 per group. * p < 0.05, ** p < 0.01, *** p < 0.001 vs. normoxia; # p < 0.05 vs. hyperoxia (ANOVA; Kruskal–Wallis).
Cells 15 01094 g006
Figure 7. Quantification of mitotic immature neuron regulating transcripts for (a) Ascl1, (b) Tbr2, (c) CycD2, and of whole cerebrum and quantification of (d) PCNA immunostaining of dentate gyrus after 24 h oxygen exposure (P6 to P7) and recovery until for P9, P11, and P14 using qPCR. Data are normalized to the level of mouse pups exposed to normoxia at each time point (control 100%, NO, 21% O2, white bars) with verum groups hyperoxia (HY, 80% O2, black), normoxia with DEX 5 µg/kg (NODEX, light grey), and hyperoxia with DEX 5 µg/kg (HYDEX, dark grey). Data are presented as Box-Whisker-Plots with n = 6 per group. * p < 0.05, ** p < 0.01, *** p < 0.001, **** p < 0.0001 vs. normoxia; # p < 0.05, ## p < 0.01, ### p < 0.001, #### p < 0.0001 vs. hyperoxia (ANOVA; Kruskal–Wallis).
Cells 15 01094 g007
Figure 8. Quantification of post-mitotic immature neuron regulating transcripts for (a) NeuroD1, (b) Prox1, (c) Tbr1, and (d) NeuroD2 of whole cerebrum and quantification of d) PCNA immunostaining of dentate gyrus after 24 h oxygen exposure (P6 to P7) and recovery until for P9, P11, and P14 using qPCR. Data are normalized to the level of mouse pups exposed to normoxia at each time point (control 100%, NO, 21% O2, white bars) with verum groups hyperoxia (HY, 80% O2, black), normoxia with DEX 5 µg/kg (NODEX, light grey), and hyperoxia with DEX 5 µg/kg (HYDEX, dark grey). Data are presented as Box-Whisker-Plots with n = 6 per group. * p < 0.05, ** p < 0.01 vs. normoxia; # p < 0.05 vs. hyperoxia (ANOVA; Kruskal–Wallis).
Cells 15 01094 g008
Figure 9. Representative sections of the neonatal hippocampus with the dentate gyrus at postnatal day 9 (P9), P11, and P14, after a recovery phase following a 24 h hyperoxia (HY) exposure period (P6–P7) labeled with NeuN (green) and DAPI (blue), are shown with normoxia (NO, 21% O2), with verum groups hyperoxia (HY, 80% O2), normoxia with DEX 5 µg/kg (NOD), and hyperoxia with DEX 5 µg/kg (HYD).
Cells 15 01094 g009
Figure 10. Representative sections of the neonatal hippocampus with the dentate gyrus at postnatal day 9 (P9), P11, and P14, after a recovery phase following a 24 h hyperoxia (HY) exposure period (P6–P7) labeled with Calb1 (green) and DAPI (blue), are shown with normoxia (NO, 21% O2), with verum groups hyperoxia (HY, 80% O2), normoxia with DEX 5 µg/kg (NOD), and hyperoxia with DEX 5 µg/kg (HYD).
Cells 15 01094 g010
Figure 11. Quantification of mature neuron regulating transcripts for (a) NeuN, (b) Calb1, (c) Syp, and of whole cerebrum and quantification of (d) NeuN, and (e) Calb1 immunostaining of dentate gyrus after 24 h oxygen exposure (P6 to P7) and recovery until for P9, P11, and P14 using qPCR. Data are normalized to the level of mouse pups exposed to normoxia at each time point (control 100%, NO, 21% O2, white bars) with verum groups hyperoxia (HY, 80% O2, black), normoxia with DEX 5 µg/kg (NODEX, light grey), and hyperoxia with DEX 5 µg/kg (HYDEX, dark grey). Data are presented as Box-Whisker-Plots with n = 6 per group. * p < 0.05, ** p < 0.01, *** p < 0.001, **** p < 0.0001 vs. normoxia; # p < 0.05, ### p < 0.001, #### p < 0.0001 vs. hyperoxia (ANOVA; Kruskal–Wallis).
Cells 15 01094 g011
Figure 12. Quantification of neurotrophin transcripts for (a) BDNF, (b) NGF, and (c) NT3 of whole cerebrum after 24 h oxygen exposure (P6 to P7) and recovery until for P9, P11, and P14 using qPCR. Data are normalized to the level of mouse pups exposed to normoxia at each time point (control 100%, NO, 21% O2, white bars) with verum groups hyperoxia (HY, 80% O2, black), normoxia with DEX 5 µg/kg (NODEX, light grey), and hyperoxia with DEX 5 µg/kg (HYDEX, dark grey). Data are presented as Box-Whisker-Plots with n = 6 per group. * p < 0.05, ** p < 0.01, *** p < 0.001, **** p < 0.0001 vs. normoxia; # p < 0.05, ## p < 0.01, ### p < 0.001 vs. hyperoxia (ANOVA; Kruskal–Wallis).
Cells 15 01094 g012
Figure 13. Quantification of neuronal plasticity regulating transcripts for (a) Sema3a, (b) Sema3f, (c) Nrp1, and (d) Nrg1 of whole cerebrum after 24 h oxygen exposure (P6 to P7) and recovery until for P9, P11, and P14 using qPCR. Data are normalized to the level of mouse pups exposed to normoxia at each time point (control 100%, NO, 21% O2, white bars) with verum groups hyperoxia (HY, 80% O2, black), normoxia with DEX 5 µg/kg (NODEX, light grey), and hyperoxia with DEX 5 µg/kg (HYDEX, dark grey). Data are presented as Box-Whisker-Plots with n = 6 per group. * p < 0.05, ** p < 0.01, *** p < 0.001, **** p < 0.0001 vs. normoxia; # p < 0.05, ## p < 0.01, ### p < 0.001 vs. hyperoxia (ANOVA; Kruskal–Wallis).
Cells 15 01094 g013
Figure 14. Graphical summary of the spatiotemporal effects of hyperoxia (HY) and dexmedetomidine (HYD) on the developing rat brain. The overview illustrates the shift from oxygen-induced suppression/induction toward DEX-mediated acceleration of recovery and developmental normalization across cellular maintenance, progenitor maintenance, proliferation, maturation, and adaptation phases.
Cells 15 01094 g014
Table 1. Quantification of TUNEL-positive cells in different brain regions at postnatal days P9, P11, and P14. Absolute values are given for the control group (NO) as mean ± SD, while all other groups are expressed as percentage of the control (NO = 100%, mean ± SD).
TUNELRegionAbs. Value
of NO Control
[Mean ± SD]
NO
[%,
Mean ± SD]
NOD
[% of NO,
Mean ± SD]
HY
[% of NO, Mean ± SD]
[p vs. NO]HYD
[% of NO, Mean ± SD]
[p vs. HY]
P9FC15 ± 1.1100 ± 7.4103 ± 13.7218 ± 7.8(p > 0.0001)122 ± 10.7(p > 0.0001)
RSC13 ± 1.5100 ± 11.8117 ± 9.4171 ± 15.5(p > 0.0001)120 ± 26.1(p > 0.001)
HC8 ± 1.3100 ± 15.996 ± 18.9112 ± 10.889 ± 6.5
Th6 ± 1.1100 ± 17.899 ± 12.1122 ± 28.696 ± 33.1
HTh11 ± 1.3100 ± 11.8115 ± 26.5140 ± 13.4(p > 0.05)110 ± 26.2
P11FC15 ± 1.6100 ± 10.797 ± 15.3184 ± 10.2(p > 0.0001)105 ± 11.4(p > 0.0001)
RSC10 ± 1.6100 ± 16.096 ± 23.0195 ± 22.0(p > 0.0001)107 ± 17.1(p > 0.0001)
HC9 ± 1.0100 ± 11.4104 ± 11.2106 ± 15.699 ± 10.1
Th4 ± 0.9100 ± 24.6106 ± 18.6122 ± 23.899 ± 16.0
HTh18 ± 1.8100 ± 10.099 ± 12.9138 ± 21.1(p > 0.001)94 ± 11.0
P14FC17 ± 1.6100 ± 9.3103 ± 13.3127 ± 12.7(p > 0.01)80 ± 9.5(p > 0.0001)
RSC18 ± 2.0100 ± 12.0101 ± 12.4134 ± 8.6(p > 0.05)108 ± 23.2(p > 0.05)
HC10 ± 1.9100 ± 19.098 ± 12.398 ± 4.695 ± 11.0(p > 0.05)
Th5 ± 0.8100 ± 15.283 ± 9.9107 ± 13.893 ± 15.1
HTh23 ± 4.5100 ± 19.585 ± 11.189 ± 19.687 ± 21.6
FC, frontal cortex; RSC, retrosplenial cortex; HC, hippocampus; Th, thalamus; HTh, hypothalamus; NO, normoxia (control); NOD, normoxia + dexmedetomidine; HY, hyperoxia; HYD, hyperoxia + dexmedetomidine.
Table 2. Quantification of cCasp3-positive cells in different brain regions at postnatal days P9, P11, and P14. Absolute values are given for the control group (NO) as mean ± SD, while all other groups are expressed as percentage of the control (NO = 100%, mean ± SD).
cCasp3RegionAbs. Value
of NO Control
[Mean ± SD]
NO
[%,
Mean ± SD]
NOD
[% of NO,
Mean ± SD]
HY
[% of NO, Mean ± SD]
[p vs. NO]HYD
[% of NO, Mean ± SD]
[p vs. HY]
P9FC9.0 ± 1.1100 ± 12.4105 ± 22.9264 ± 29.2(p > 0.0001)148 ± 40.3(p > 0.0001)
RSC5.1 ± 1.5100 ± 30.5167 ± 50.5313 ± 42.5(p > 0.0001)206 ± 51.8(p > 0.01)
HC4.3 ± 0.9100 ± 21.097 ± 11.0128 ± 13.6(p > 0.05)77 ± 13.6(p > 0.0001)
P11FC11.9 ± 1.6100 ± 13.3105 ± 19.1177 ± 28.5(p > 0.0001)98 ± 14.3(p > 0.0001)
RSC7.9 ± 1.6100 ± 20.195 ± 28.8231 ± 27.5(p > 0.0001)118 ± 18.0(p > 0.0001)
HC3.6 ± 1.1100 ± 31.7129 ± 27.1159 ± 28.4(p > 0.01)94 ± 18.2(p > 0.05)
P14FC10.1 ± 1.5100 ± 15.7104 ± 22.6166 ± 21.5(p > 0.0001)70 ± 13.6(p > 0.0001)
RSC10.9 ± 2.4100 ± 24.0102 ± 21.0168 ± 14.6(p > 0.001)112 ± 27.8(p > 0.0001)
HC3.0 ± 0.7100 ± 23.697 ± 15.8164 ± 18.3(p > 0.001)103 ± 23.5(p > 0.001)
FC, frontal cortex; RSC, retrosplenial cortex; HC, hippocampus; NO, normoxia (control); NOD, normoxia + dexmedetomidine; HY, hyperoxia; HYD, hyperoxia + dexmedetomidine.
Disclaimer/Publisher’s Note: The statements, opinions and data contained in all publications are solely those of the individual author(s) and contributor(s) and not of MDPI and/or the editor(s). MDPI and/or the editor(s) disclaim responsibility for any injury to people or property resulting from any ideas, methods, instructions or products referred to in the content.