
Microfungus Podosphaera fusca and the Fungus-like Organism Peronospora ficariae as Potential Inhalant Allergens in a Mouse Model of Asthma

 , , , ,
Abstract
1. Introduction
2. Materials and Methods
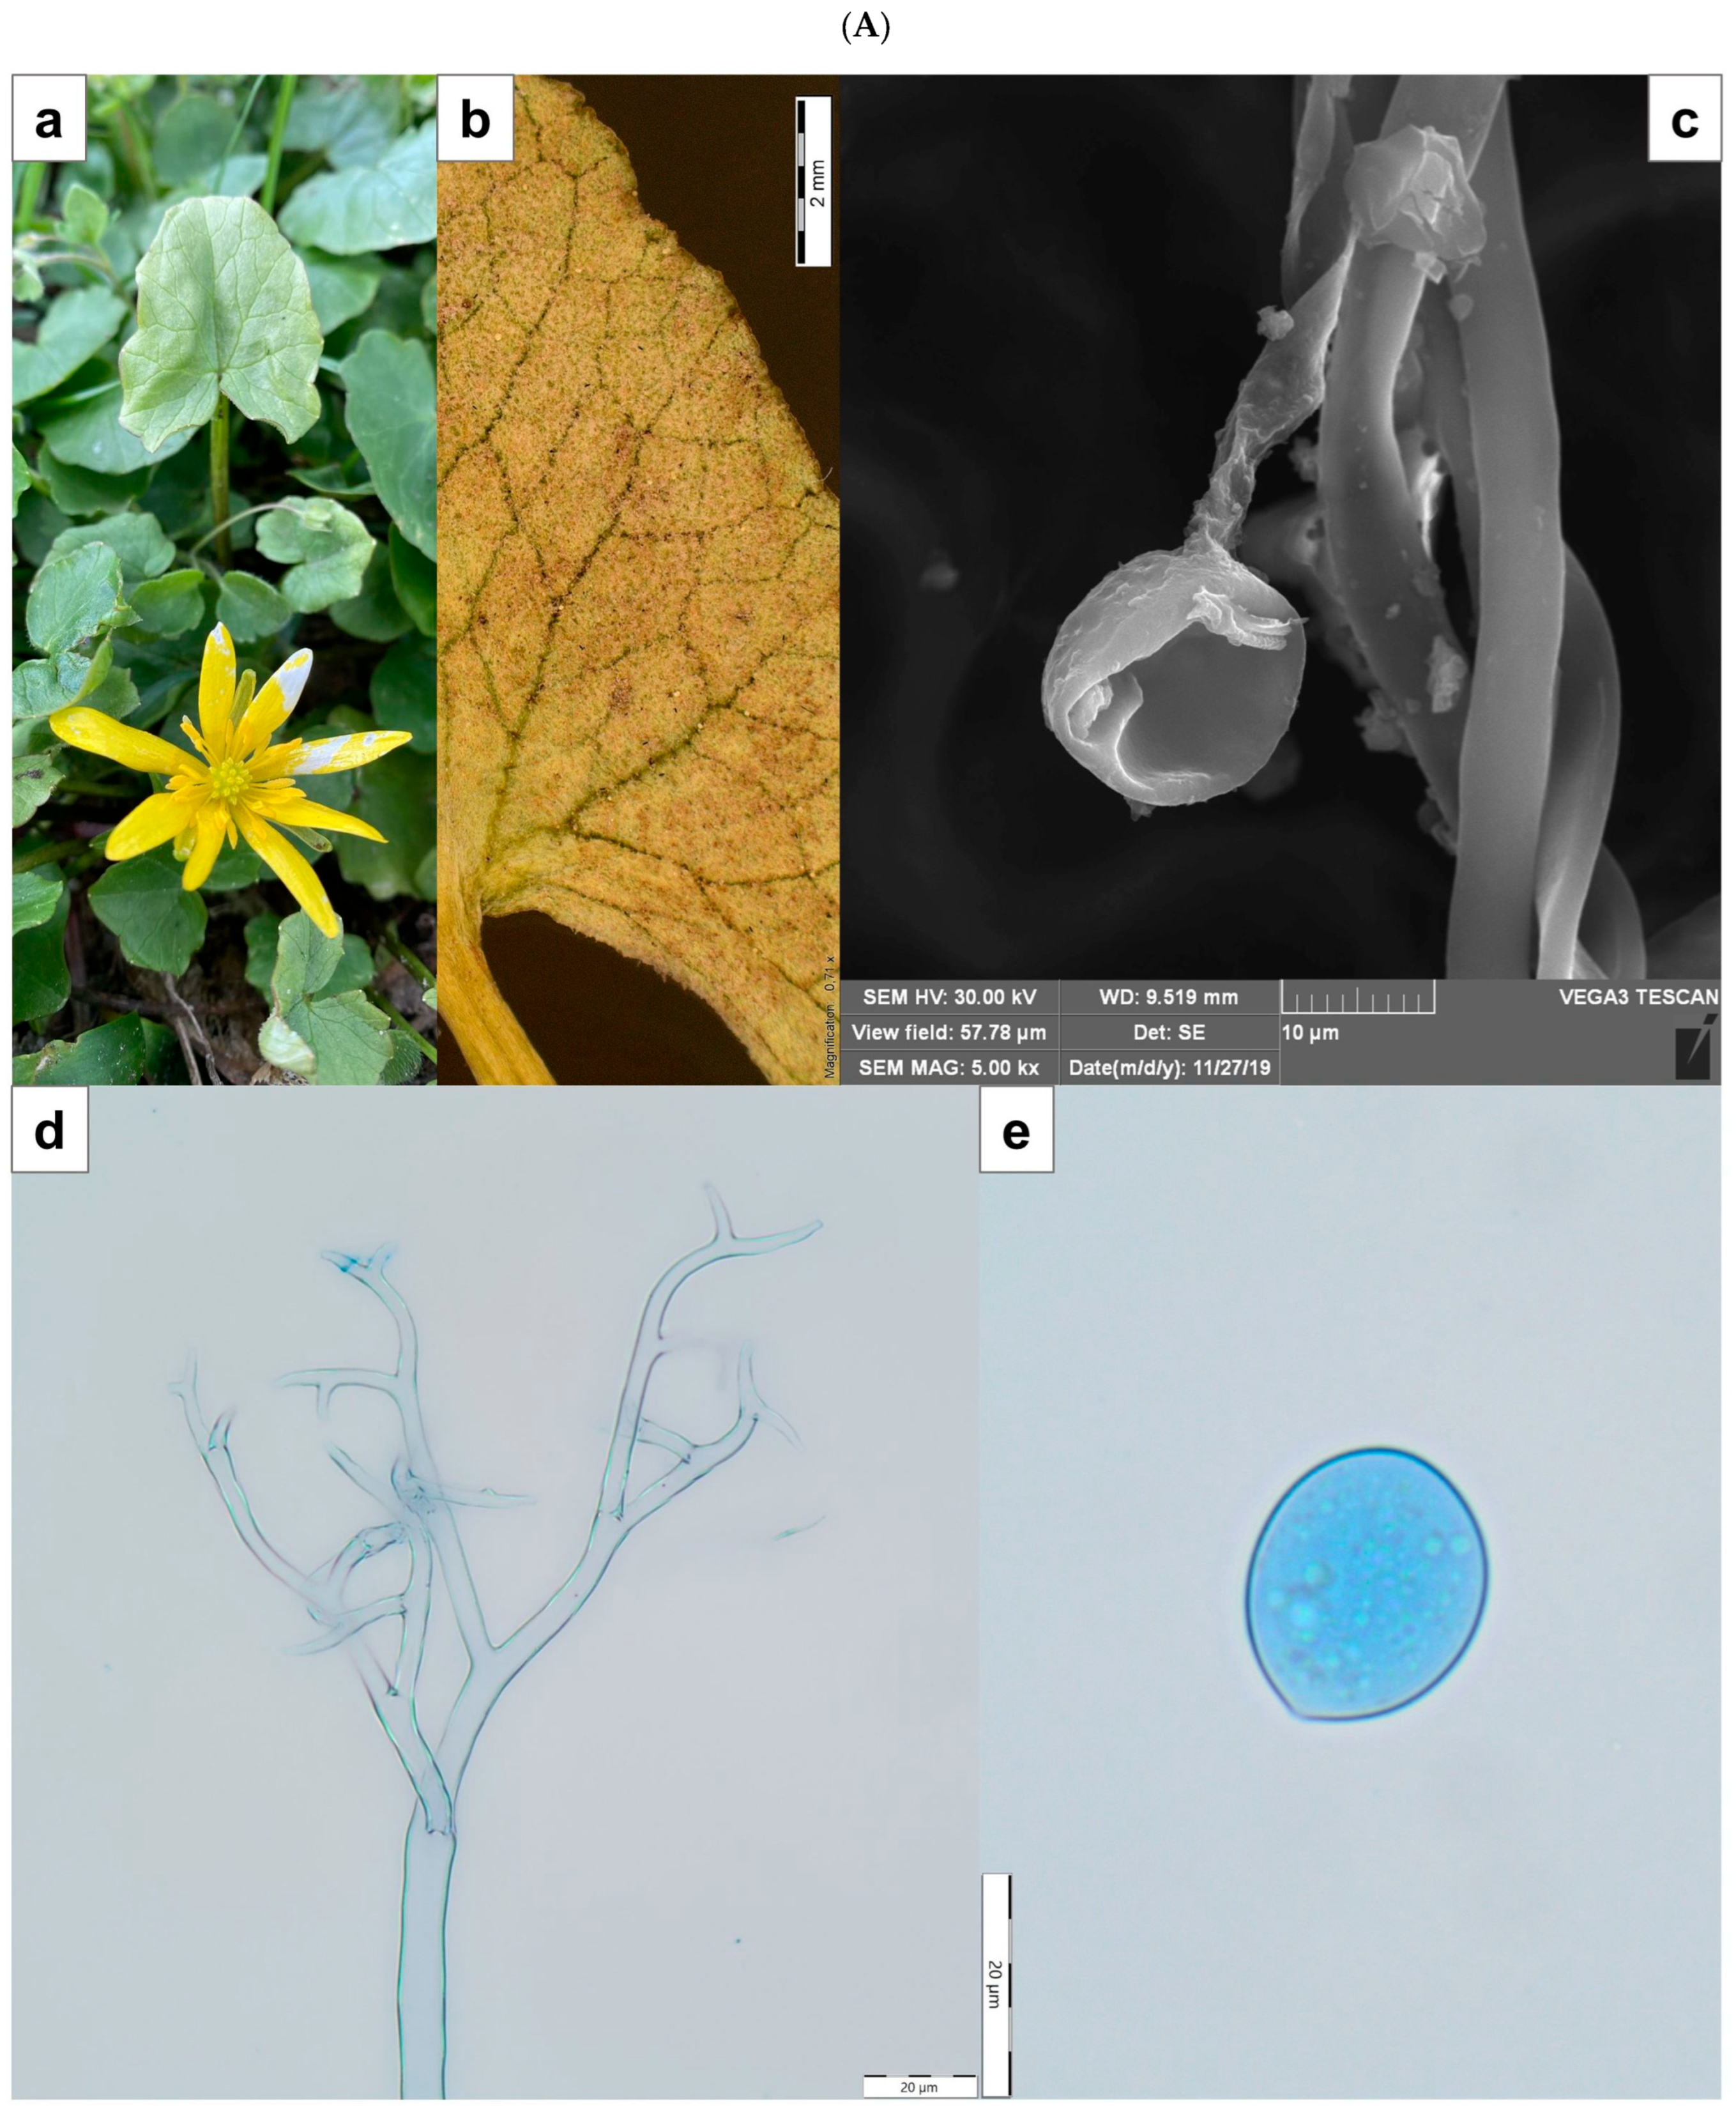
2.1. Plant Material and Morphological Identification
2.2. Preparation of Crude Fungal Extracts
2.3. Animal Model and Experimental Design
2.3.1. Animals
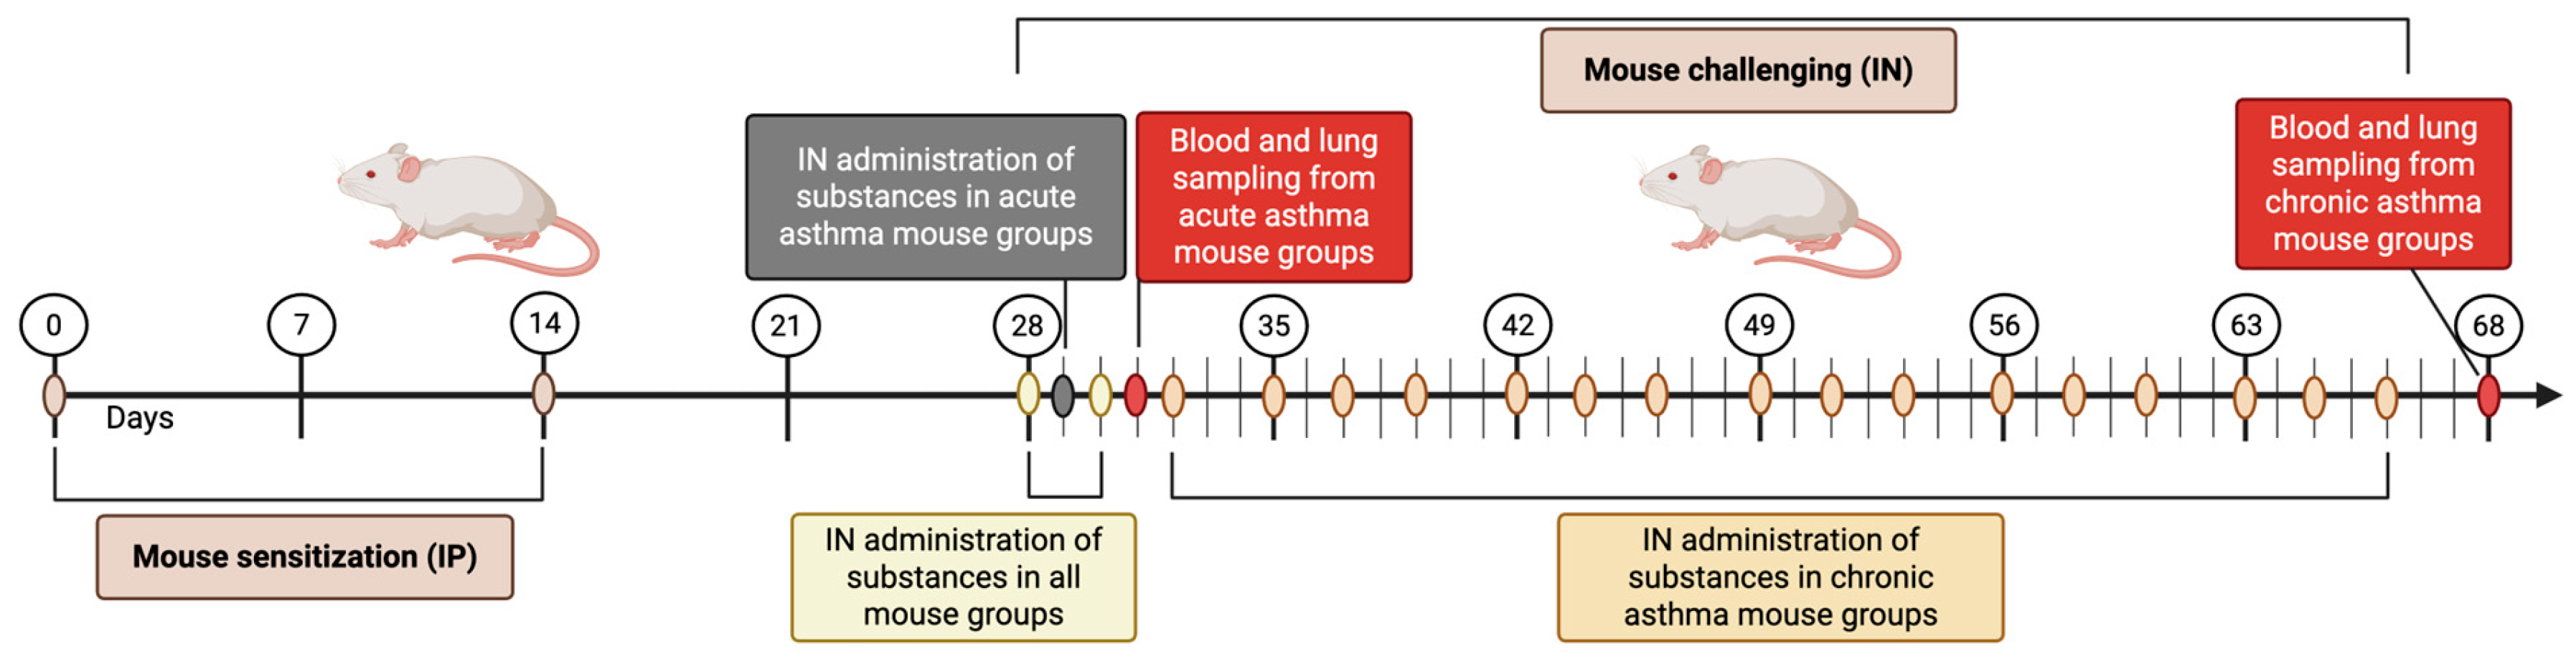
2.3.2. Study Design
2.3.3. Acute and Chronic Asthma Model
2.3.4. Tissue Collection
2.3.5. Blood Smear Staining
2.3.6. Histological Analysis
2.4. Measurement of Cytokine Levels
2.5. Determination of Specific IgE Levels in Mouse Sera
2.6. Statistical Analyses
3. Results
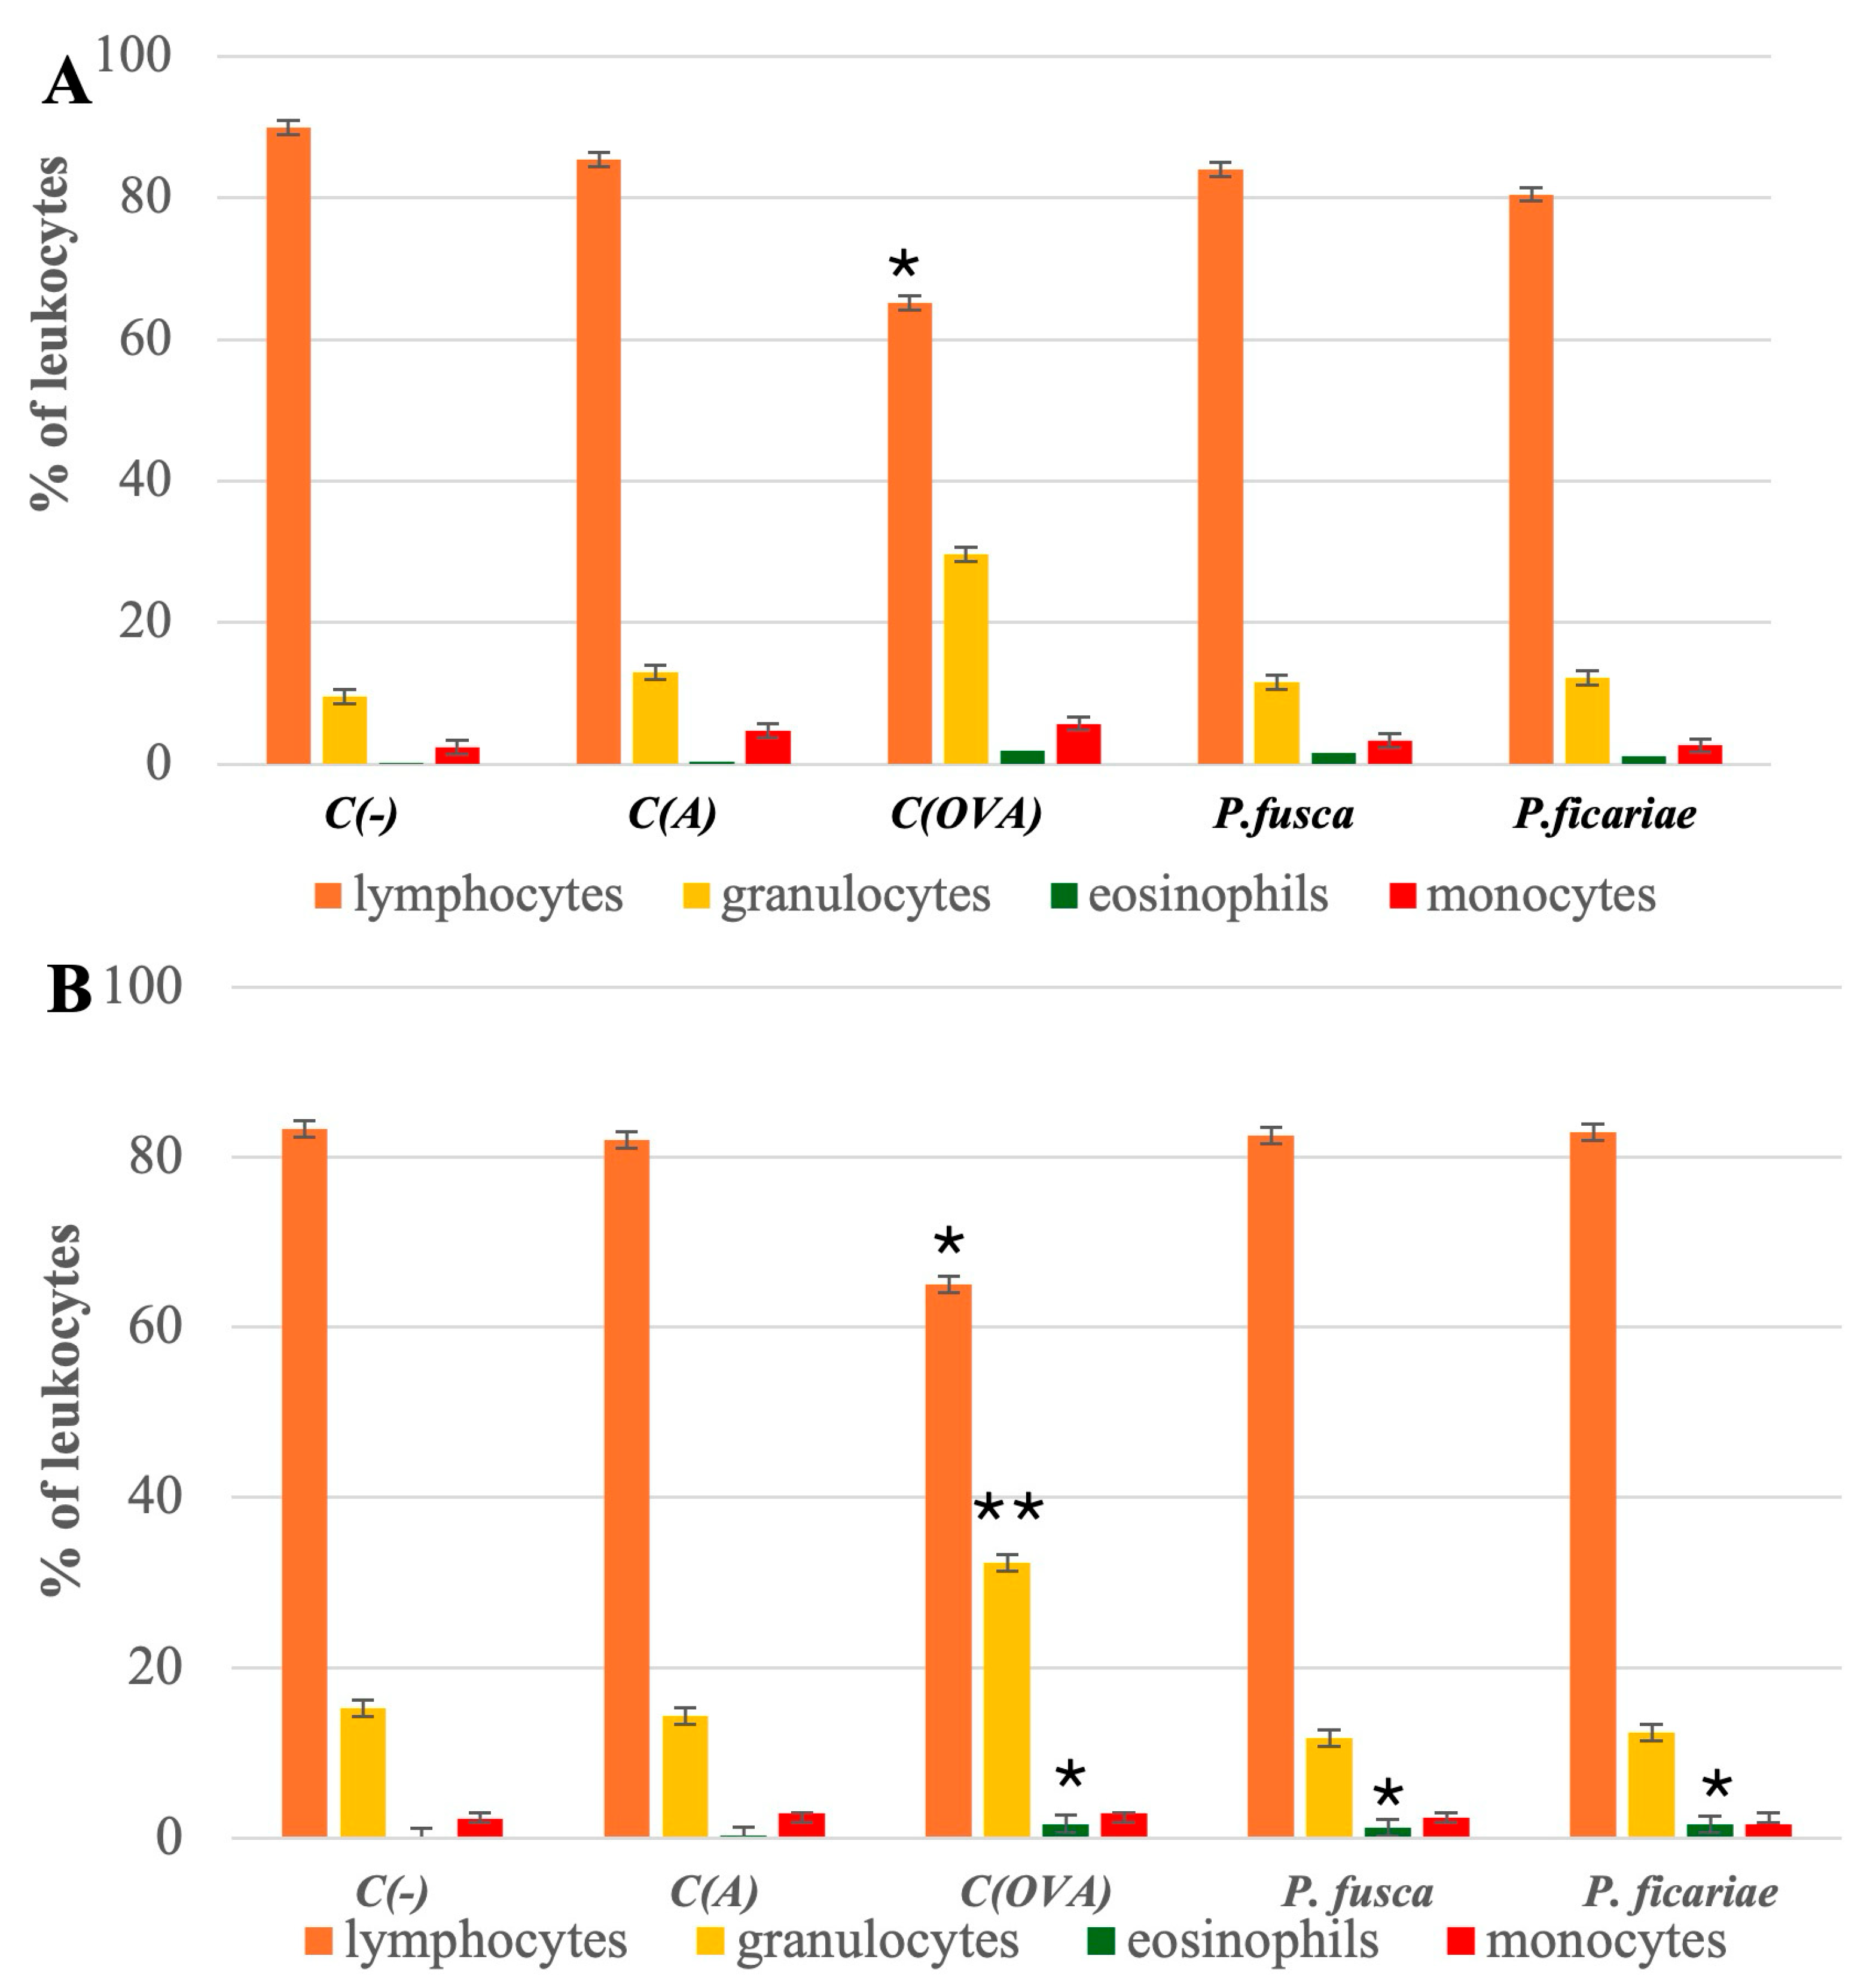
3.1. Composition of Leukocytes in the Peripheral Blood of Mice
3.2. Cytokine Levels in Mouse Sera Following the Induction of Acute and Chronic Asthma
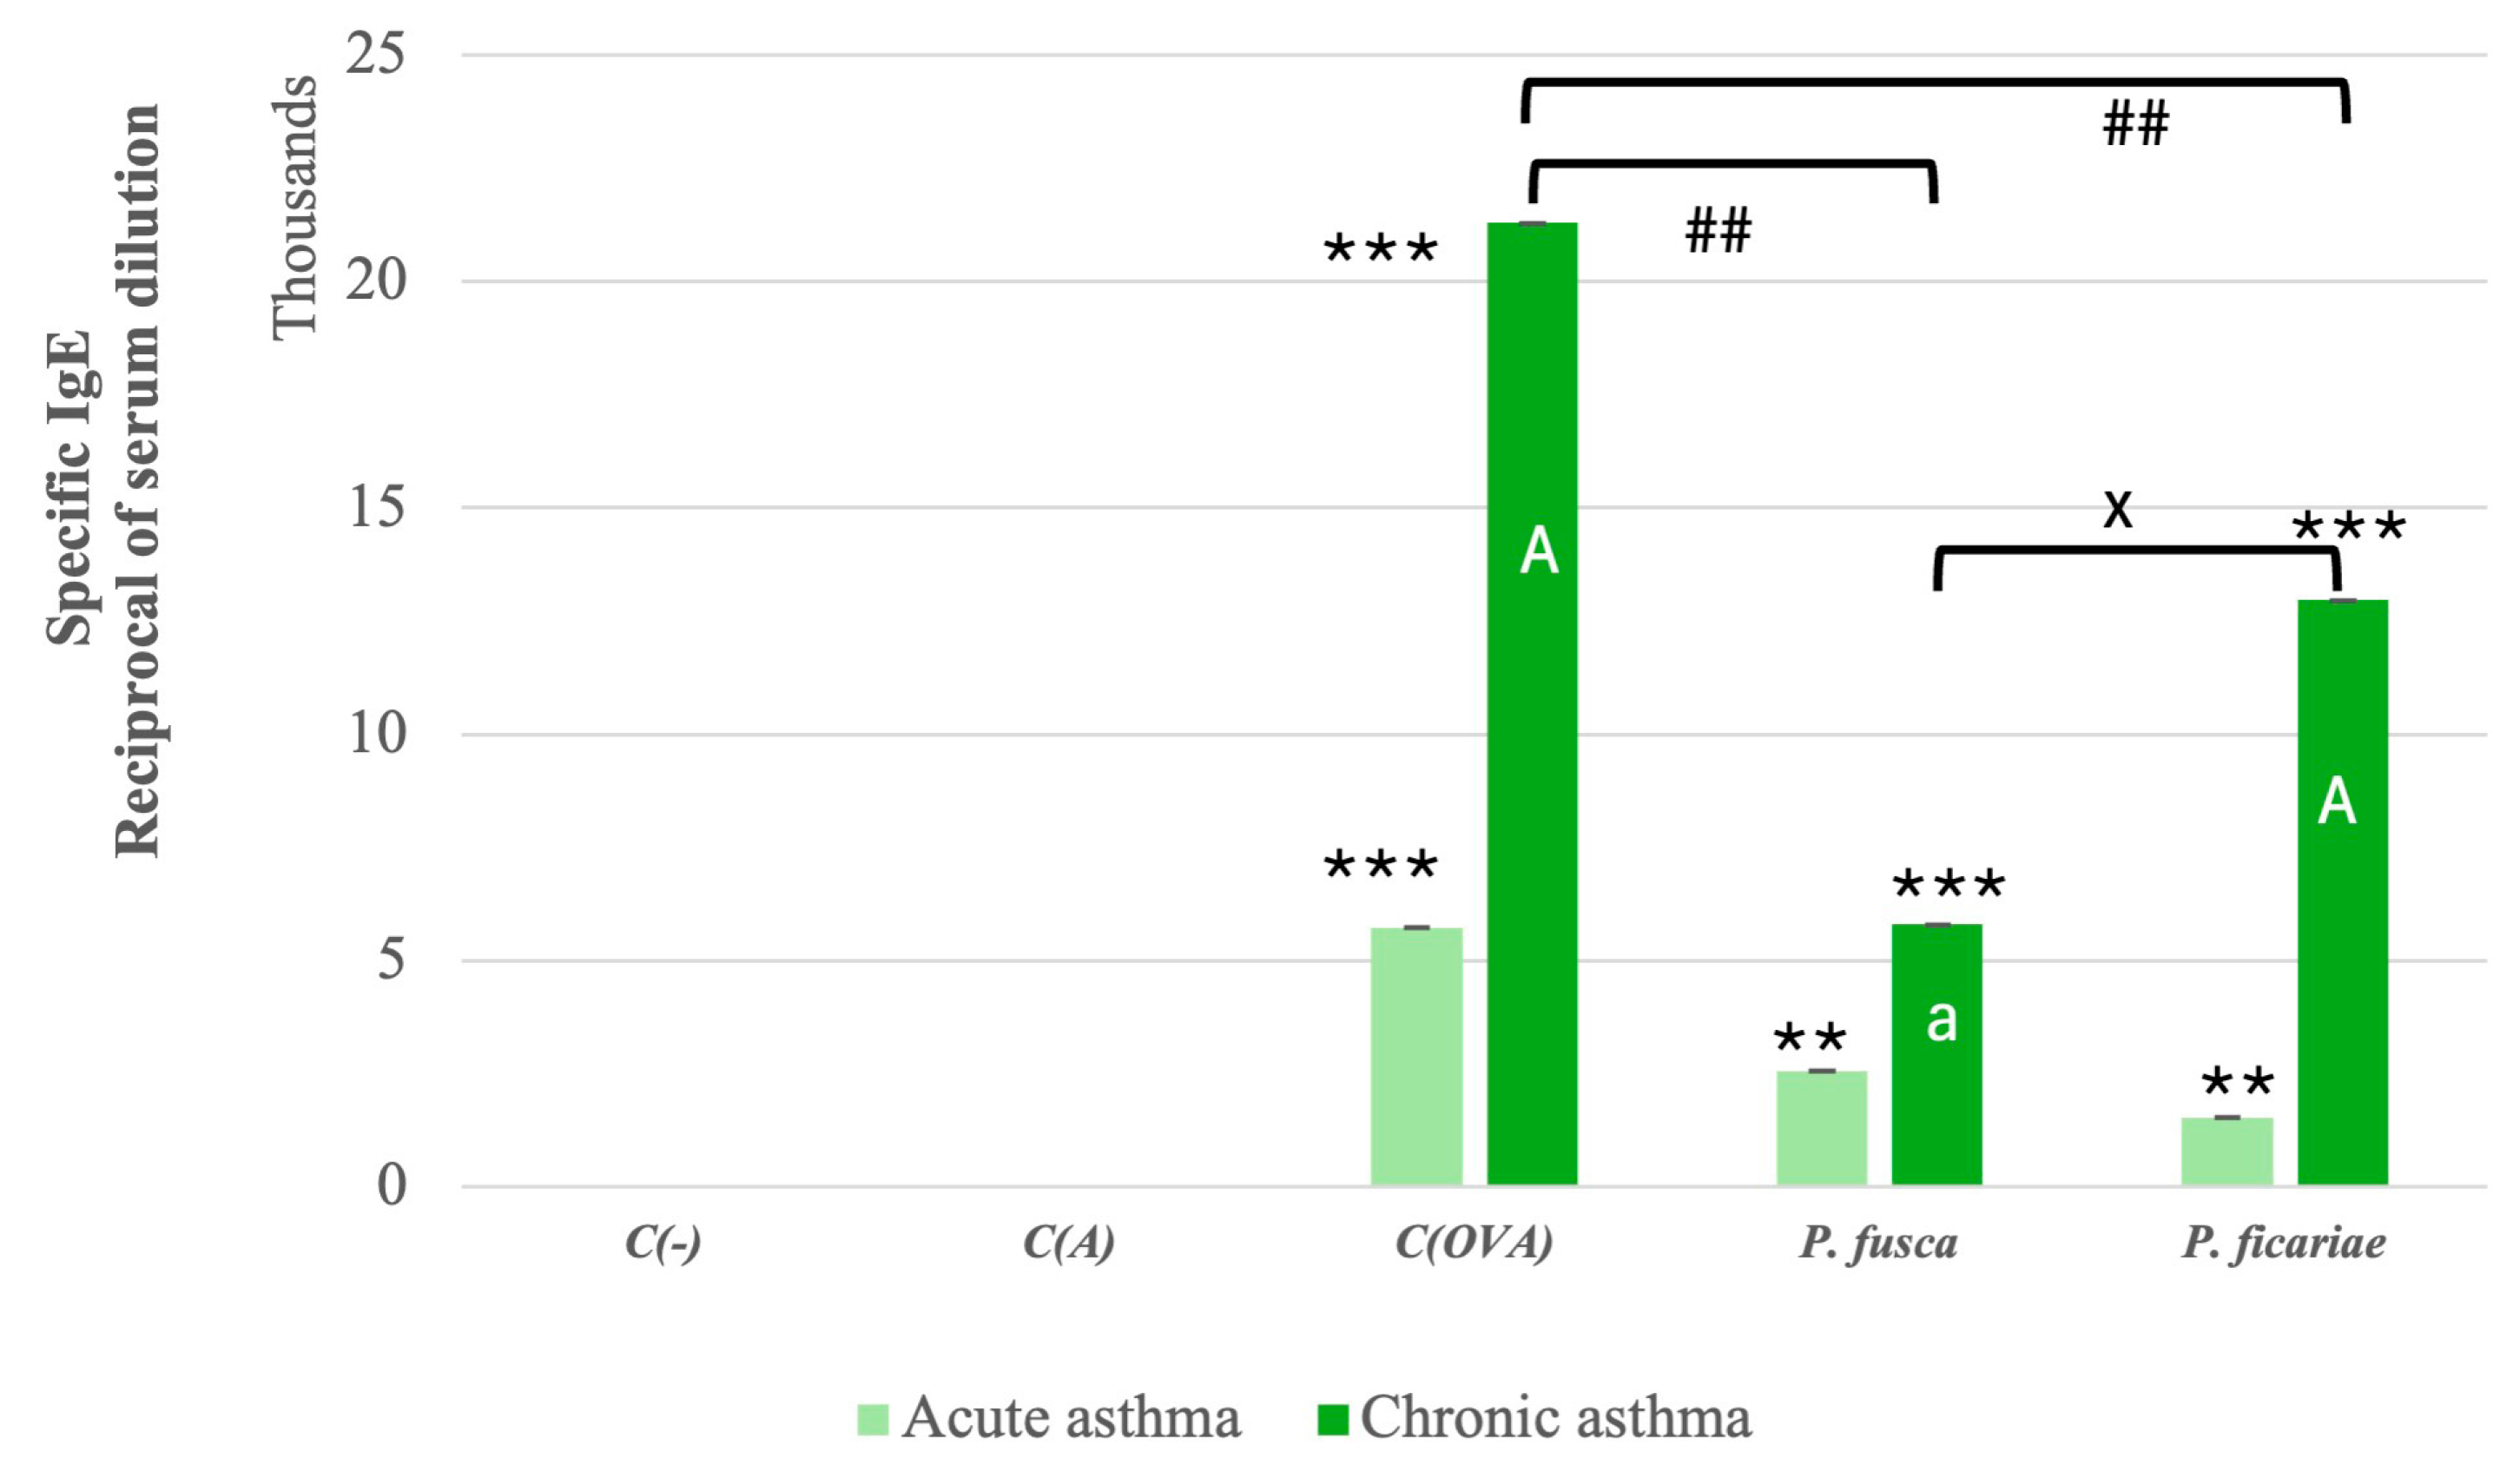
3.3. Serum Levels of Allergen-Specific IgE in Mice After the Induction of Acute and Chronic Asthma
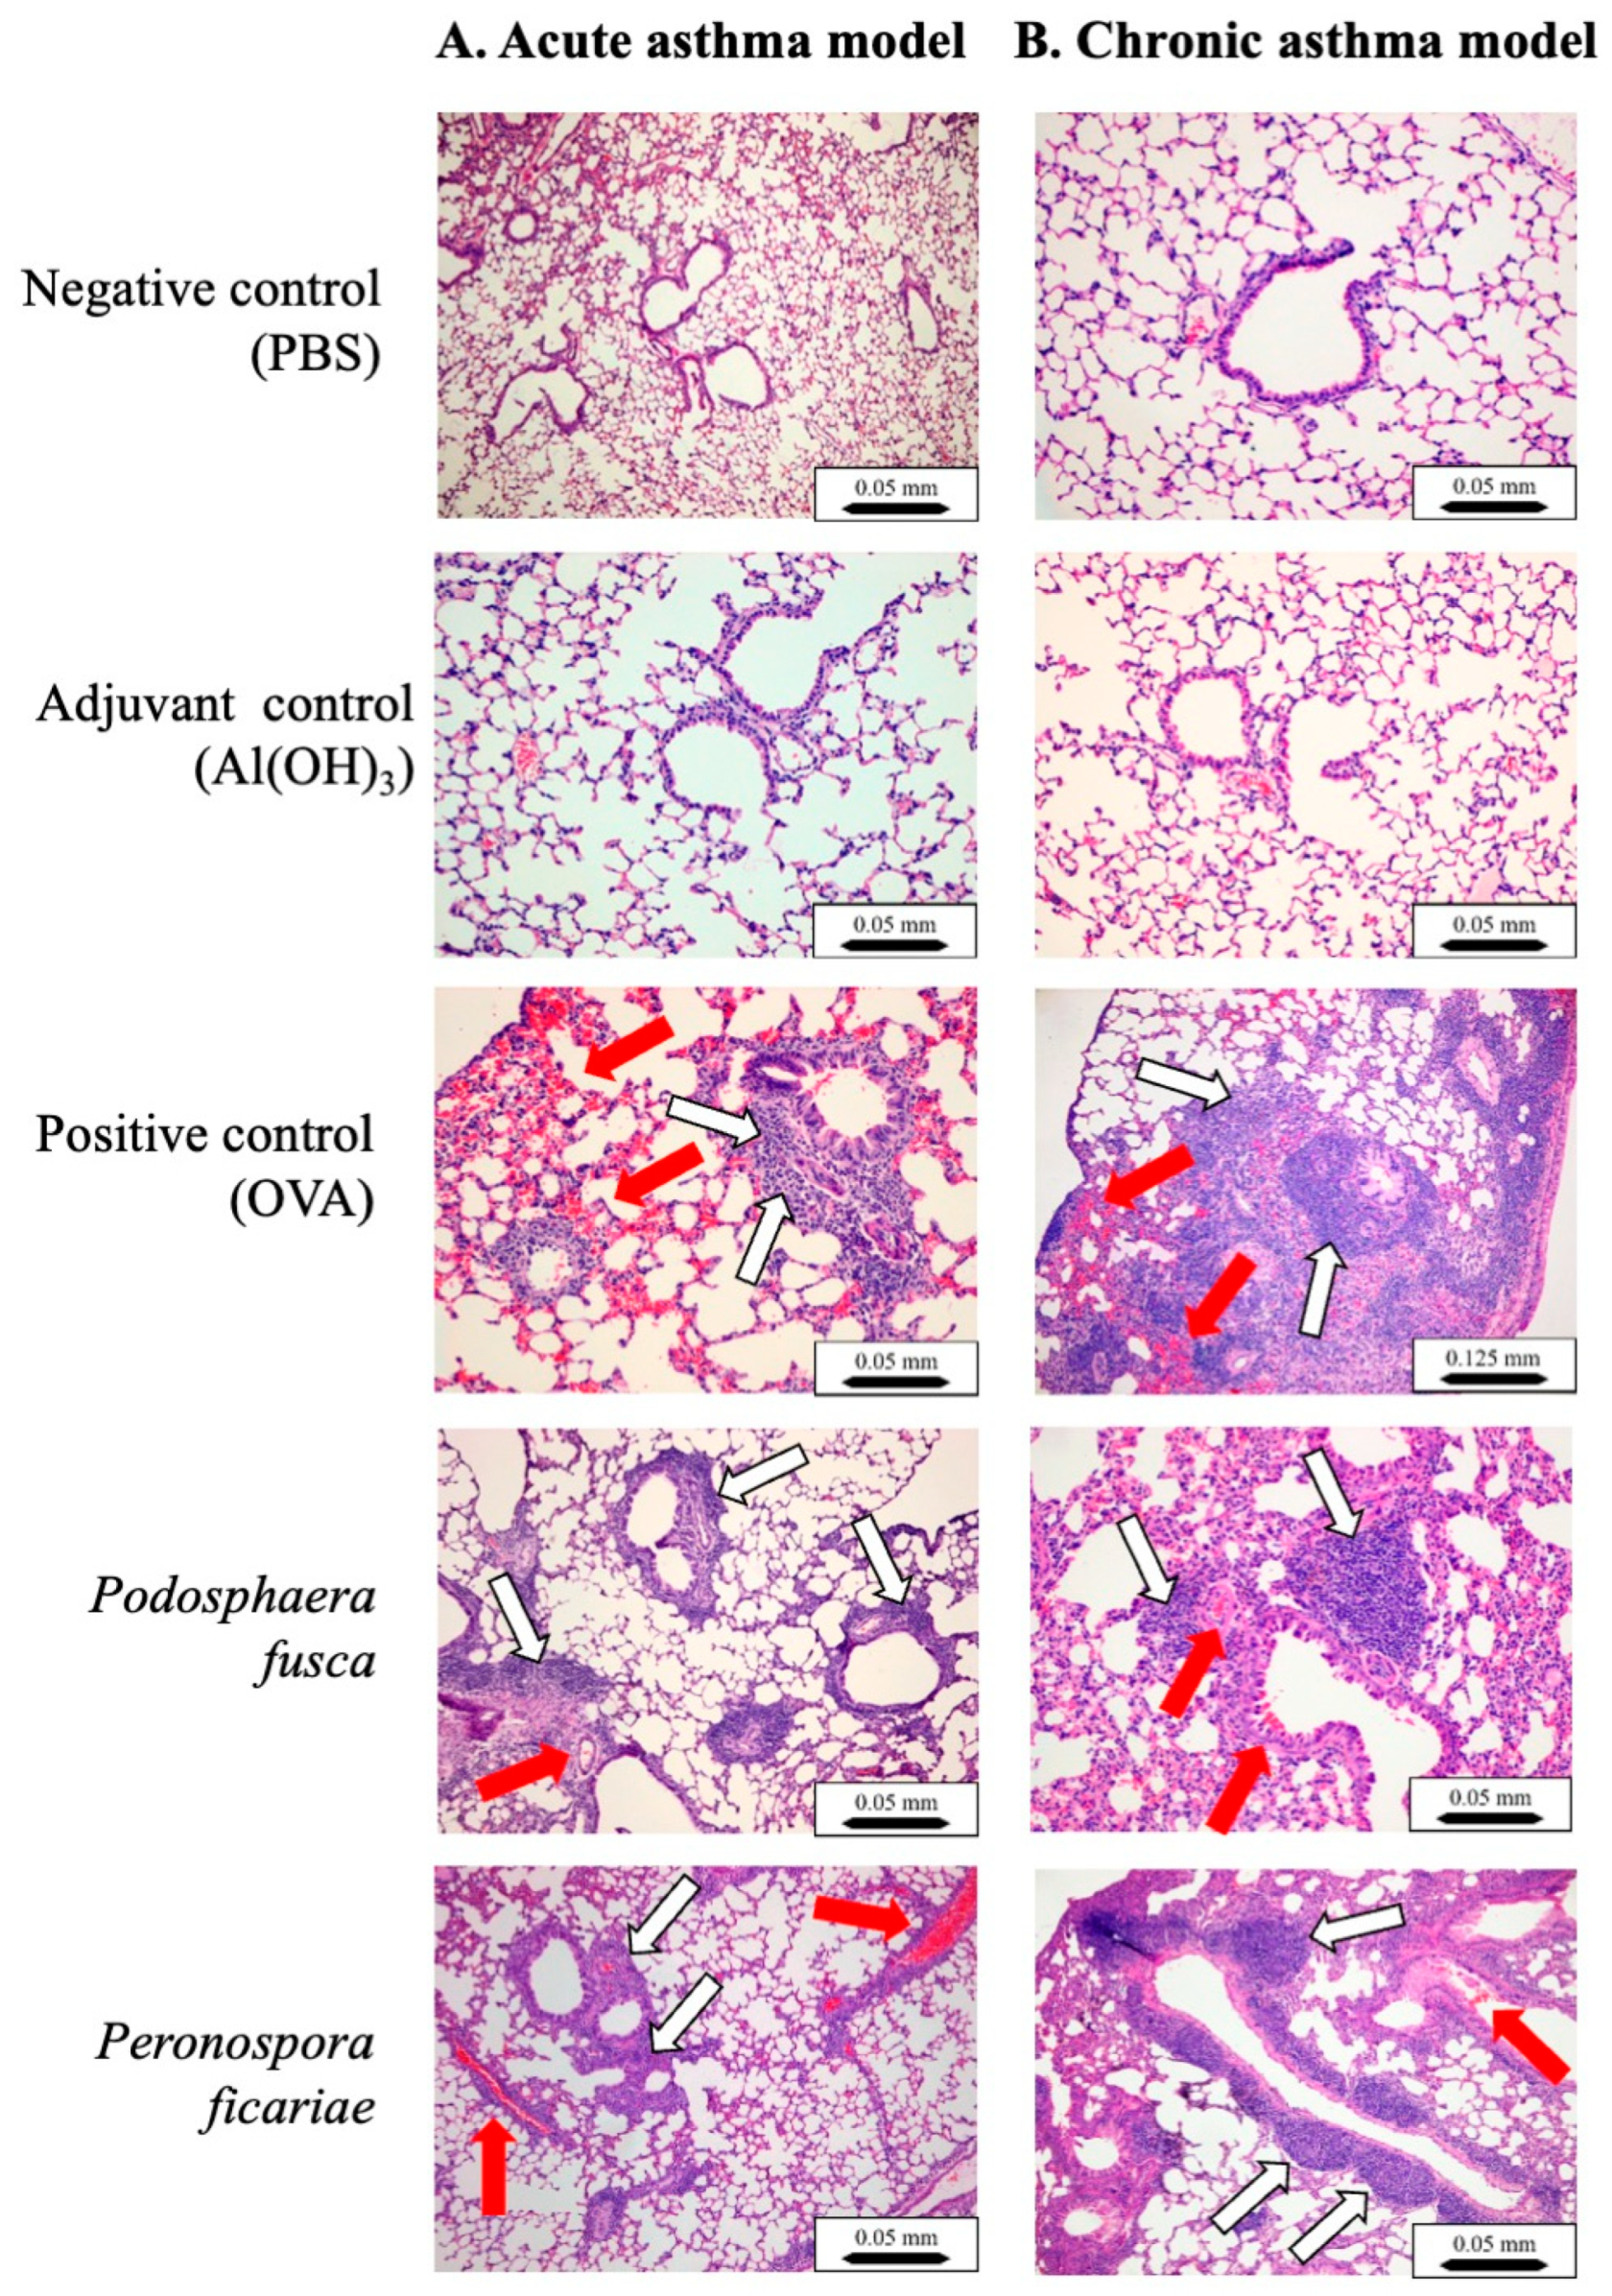
3.4. Histological Analyses of Mouse Lungs
4. Discussion
5. Conclusions
6. Study Limitations
Author Contributions
Funding
Institutional Review Board Statement
Informed Consent Statement
Data Availability Statement
Conflicts of Interest
Abbreviations
| NCD | Noncommunicable Disease |
| ELISA | Enzyme-Linked ImmunoSorbent Assay |
| OVA | OVAlbumin |
| ASM | Airway Smooth Muscle |
References
- Dharmage, S.C.; Perret, J.L.; Custovic, A. Epidemiology of Asthma in Children and Adults. Front. Pediatr. 2019, 7, 246. [Google Scholar] [CrossRef] [PubMed]
- Available online: https://www.aihw.gov.au/reports/chronic-respiratory-conditions/asthma (accessed on 2 March 2025).
- Available online: https://www.lung.org/research/trends-in-lung-disease/asthma-trends-brief/trends-and-burden (accessed on 2 March 2025).
- Selroos, O.; Kupczyk, M.; Kuna, P.; Lacwik, P.; Bousquet, J.; Brennan, D.; Palkonen, S.; Contreras, J.; FitzGerald, M.; Hedlin, G.; et al. National and regional asthma programmes in Europe. Eur. Respir. Rev. 2015, 24, 474–483. [Google Scholar] [CrossRef] [PubMed]
- Barnes, P.J. Immunology of asthma and chronic obstructive pulmonary disease. Nat. Rev. Immunol. 2008, 8, 183–192. [Google Scholar] [CrossRef]
- Hall, S.; Agrawal, D.K. Key mediators in the immunopathogenesis of allergic asthma. Int. Immunopharmacol. 2014, 23, 316–329. [Google Scholar] [CrossRef]
- Sinyor, B.; Concepcion Perez, L. Pathophysiology of Asthma; StatPearls: Treasure Island, FL, USA, 2023. [Google Scholar]
- Yamasaki, A.; Okazaki, R.; Harada, T. Neutrophils and Asthma. Diagnostics 2022, 12, 1175. [Google Scholar] [CrossRef]
- Morianos, I.; Semitekolou, M. Dendritic Cells: Critical Regulators of Allergic Asthma. Int. J. Mol. Sci. 2020, 21, 7930. [Google Scholar] [CrossRef]
- Wills-Karp, M.; Karp, C.L. Biomedicine. Eosinophils in asthma: Remodeling a tangled tale. Science 2004, 305, 1726–1729. [Google Scholar] [CrossRef]
- Lin, W.R.; Chen, Y.H.; Lee, M.F.; Hsu, L.Y.; Tien, C.J.; Shih, F.M.; Hsiao, S.C.; Wang, P.H. Does Spore Count Matter in Fungal Allergy?: The Role of Allergenic Fungal Species. Allergy Asthma Immunol. Res. 2016, 8, 404–411. [Google Scholar] [CrossRef]
- Twaroch, T.E.; Curin, M.; Valenta, R.; Swoboda, I. Mold allergens in respiratory allergy: From structure to therapy. Allergy Asthma Immunol. Res. 2015, 7, 205–220. [Google Scholar] [CrossRef]
- Patel, T.Y.; Buttner, M.; Rivas, D.; Cross, C.; Bazylinski, D.A.; Seggev, J. Variation in airborne fungal spore concentrations among five monitoring locations in a desert urban environment. Environ. Monit. Assess. 2018, 190, 634. [Google Scholar] [CrossRef]
- Abel-Fernandez, E.; Martinez, M.J.; Galan, T.; Pineda, F. Going over Fungal Allergy: Alternaria alternata and Its Allergens. J. Fungi 2023, 9, 582. [Google Scholar] [CrossRef] [PubMed]
- Jaakkola, M.S.; Quansah, R.; Hugg, T.T.; Heikkinen, S.A.; Jaakkola, J.J. Association of indoor dampness and molds with rhinitis risk: A systematic review and meta-analysis. J. Allergy Clin. Immunol. 2013, 132, 1099–1110.e1018. [Google Scholar] [CrossRef] [PubMed]
- Simon-Nobbe, B.; Denk, U.; Poll, V.; Rid, R.; Breitenbach, M. The spectrum of fungal allergy. Int. Arch. Allergy Immunol. 2008, 145, 58–86. [Google Scholar] [CrossRef] [PubMed]
- Baxi, S.N.; Portnoy, J.M.; Larenas-Linnemann, D.; Phipatanakul, W.; Environmental Allergens, W. Exposure and Health Effects of Fungi on Humans. J. Allergy Clin. Immunol. Pract. 2016, 4, 396–404. [Google Scholar] [CrossRef]
- Verstraelen, S.; Bloemen, K.; Nelissen, I.; Witters, H.; Schoeters, G.; Van Den Heuvel, R. Cell types involved in allergic asthma and their use in in vitro models to assess respiratory sensitization. Toxicol. In Vitro 2008, 22, 1419–1431. [Google Scholar] [CrossRef]
- Blume, C.; Foerster, S.; Gilles, S.; Becker, W.M.; Ring, J.; Behrendt, H.; Petersen, A.; Traidl-Hoffmann, C. Human epithelial cells of the respiratory tract and the skin differentially internalize grass pollen allergens. J. Investig. Dermatol. 2009, 129, 1935–1944. [Google Scholar] [CrossRef]
- Crossen, A.J.; Ward, R.A.; Reedy, J.L.; Surve, M.V.; Klein, B.S.; Rajagopal, J.; Vyas, J.M. Human Airway Epithelium Responses to Invasive Fungal Infections: A Critical Partner in Innate Immunity. J. Fungi 2022, 9, 40. [Google Scholar] [CrossRef]
- Blanco, C.; de Los Santos, B.; Barrau, C.; Arroyo, F.T.; Porras, M.; Romero, F. Relationship Among Concentrations of Sphaerotheca macularis Conidia in the Air, Environmental Conditions, and the Incidence of Powdery Mildew in Strawberry. Plant Dis. 2004, 88, 878–881. [Google Scholar] [CrossRef]
- Menezes, E.A.; Gambale, W.; Macedo, M.S.; Abdalla, D.S.; Paula, C.R.; Croce, J. Biochemical, antigenic and allergenic characterization of crude extracts of Drechslera (Helminthosporium) monoceras. Mycopathologia 1995, 131, 75–81. [Google Scholar] [CrossRef]
- Kim, D.I.; Song, M.K.; Lee, K. Comparison of asthma phenotypes in OVA-induced mice challenged via inhaled and intranasal routes. BMC Pulm. Med. 2019, 19, 241. [Google Scholar] [CrossRef]
- Daubeuf, F.; Frossard, N. Acute Asthma Models to Ovalbumin in the Mouse. Curr. Protoc. Mouse Biol. 2013, 3, 31–37. [Google Scholar] [CrossRef] [PubMed]
- Shinagawa, K.; Kojima, M. Mouse model of airway remodeling: Strain differences. Am. J. Respir. Crit. Care Med. 2003, 168, 959–967. [Google Scholar] [CrossRef] [PubMed]
- Hoselton, S.A.; Samarasinghe, A.E.; Seydel, J.M.; Schuh, J.M. An inhalation model of airway allergic response to inhalation of environmental Aspergillus fumigatus conidia in sensitized BALB/c mice. Med. Mycol. 2010, 48, 1056–1065. [Google Scholar] [CrossRef] [PubMed]
- Han, H.; Park, Y.H.; Park, H.J.; Lee, K.; Um, K.; Park, J.W.; Lee, J.H. Toxic and adjuvant effects of silica nanoparticles on ovalbumin-induced allergic airway inflammation in mice. Respir. Res. 2016, 17, 60. [Google Scholar] [CrossRef]
- Jiang, Y.; Li, Y.; Cheng, M.; Xu, J.; Wei, X.; Liu, C. Protocol for acquiring high-quality fresh mouse lung spatial transcriptomics data. STAR Protoc. 2024, 5, 102825. [Google Scholar] [CrossRef]
- Szuster-Ciesielska, A.; Wawiorka, L.; Krokowski, D.; Grankowski, N.; Jarosz, L.; Lisiecka, U.; Tchorzewski, M. Immunogenic Evaluation of Ribosomal P-Protein Antigen P0, P1, and P2 and Pentameric Protein Complex P0-(P1-P2)(2) of Plasmodium falciparum in a Mouse Model. J. Immunol. Res. 2019, 2019, 9264217. [Google Scholar] [CrossRef]
- Crameri, R.; Garbani, M.; Rhyner, C.; Huitema, C. Fungi: The neglected allergenic sources. Allergy 2014, 69, 176–185. [Google Scholar] [CrossRef]
- Zukiewicz-Sobczak, W.A. The role of fungi in allergic diseases. Postepy Dermatol. Alergol. 2013, 30, 42–45. [Google Scholar] [CrossRef]
- Yuan, L.; Tao, J.; Wang, J.; She, W.; Zou, Y.; Li, R.; Ma, Y.; Sun, C.; Bi, S.; Wei, S.; et al. Global, regional, national burden of asthma from 1990 to 2021, with projections of incidence to 2050: A systematic analysis of the global burden of disease study 2021. eClinicalMedicine 2025, 80, 103051. [Google Scholar] [CrossRef]
- Lemanske, R.F., Jr. Inflammatory events in asthma: An expanding equation. J. Allergy Clin. Immunol. 2000, 105, S633–S636. [Google Scholar] [CrossRef]
- Carroll, N.; Cooke, C.; James, A. The distribution of eosinophils and lymphocytes in the large and small airways of asthmatics. Eur. Respir. J. 1997, 10, 292–300. [Google Scholar] [CrossRef] [PubMed]
- Barnes, P.J. Pathophysiology of allergic inflammation. Immunol. Rev. 2011, 242, 31–50. [Google Scholar] [CrossRef] [PubMed]
- Hammad, H.; Lambrecht, B.N. The basic immunology of asthma. Cell 2021, 184, 1469–1485. [Google Scholar] [CrossRef] [PubMed]
- Pelaia, G.; Vatrella, A.; Busceti, M.T.; Gallelli, L.; Calabrese, C.; Terracciano, R.; Maselli, R. Cellular mechanisms underlying eosinophilic and neutrophilic airway inflammation in asthma. Mediat. Inflamm. 2015, 2015, 879783. [Google Scholar] [CrossRef]
- Janssens, I.; Lambrecht, B.N.; Van Braeckel, E. Aspergillus and the Lung. Semin. Respir. Crit. Care Med. 2024, 45, 3–20. [Google Scholar] [CrossRef]
- Havaux, X.; Zeine, A.; Dits, A.; Denis, O. A new mouse model of lung allergy induced by the spores of Alternaria alternata and Cladosporium herbarum molds. Clin. Exp. Immunol. 2005, 139, 179–188. [Google Scholar] [CrossRef]
- Gour, N.; Wills-Karp, M. IL-4 and IL-13 signaling in allergic airway disease. Cytokine 2015, 75, 68–78. [Google Scholar] [CrossRef]
- Lambrecht, B.N.; Hammad, H.; Fahy, J.V. The Cytokines of Asthma. Immunity 2019, 50, 975–991. [Google Scholar] [CrossRef]
- Doherty, T.; Broide, D. Cytokines and growth factors in airway remodeling in asthma. Curr. Opin. Immunol. 2007, 19, 676–680. [Google Scholar] [CrossRef]
- Nakajima, H.; Takatsu, K. Role of cytokines in allergic airway inflammation. Int. Arch. Allergy Immunol. 2007, 142, 265–273. [Google Scholar] [CrossRef]
- Agarwal, R.; Muthu, V.; Sehgal, I.S. Relationship between Aspergillus and asthma. Allergol. Int. 2023, 72, 507–520. [Google Scholar] [CrossRef] [PubMed]
- Yuksel, H.; Ocalan, M.; Yilmaz, O. E-Cadherin: An Important Functional Molecule at Respiratory Barrier Between Defence and Dysfunction. Front. Physiol. 2021, 12, 720227. [Google Scholar] [CrossRef] [PubMed]
- Hardyman, M.A.; Wilkinson, E.; Martin, E.; Jayasekera, N.P.; Blume, C.; Swindle, E.J.; Gozzard, N.; Holgate, S.T.; Howarth, P.H.; Davies, D.E.; et al. TNF-alpha-mediated bronchial barrier disruption and regulation by src-family kinase activation. J. Allergy Clin. Immunol. 2013, 132, 665–675.e668. [Google Scholar] [CrossRef] [PubMed]
- Ammit, A.J.; Armour, C.L.; Black, J.L. Smooth-muscle myosin light-chain kinase content is increased in human sensitized airways. Am. J. Respir. Crit. Care Med. 2000, 161, 257–263. [Google Scholar] [CrossRef]
- Dekkers, B.G.; Maarsingh, H.; Meurs, H.; Gosens, R. Airway structural components drive airway smooth muscle remodeling in asthma. Proc. Am. Thorac. Soc. 2009, 6, 683–692. [Google Scholar] [CrossRef]
- McMillan, S.J.; Xanthou, G.; Lloyd, C.M. Manipulation of allergen-induced airway remodeling by treatment with anti-TGF-beta antibody: Effect on the Smad signaling pathway. J. Immunol. 2005, 174, 5774–5780. [Google Scholar] [CrossRef]
- Tatler, A.L.; Jenkins, G. TGF-beta activation and lung fibrosis. Proc. Am. Thorac. Soc. 2012, 9, 130–136. [Google Scholar] [CrossRef]
- Namvar, S.; Labram, B.; Rowley, J.; Herrick, S. Aspergillus fumigatus-Host Interactions Mediating Airway Wall Remodelling in Asthma. J. Fungi 2022, 8, 159. [Google Scholar] [CrossRef]
- Labram, B.; Namvar, S.; Hussell, T.; Herrick, S.E. Endothelin-1 mediates Aspergillus fumigatus-induced airway inflammation and remodelling. Clin. Exp. Allergy 2019, 49, 861–873. [Google Scholar] [CrossRef]
- Bax, H.J.; Keeble, A.H.; Gould, H.J. Cytokinergic IgE Action in Mast Cell Activation. Front. Immunol. 2012, 3, 229. [Google Scholar] [CrossRef]
- Oettgen, H.C.; Geha, R.S. IgE in asthma and atopy: Cellular and molecular connections. J. Clin. Investig. 1999, 104, 829–835. [Google Scholar] [CrossRef] [PubMed]
- Zhang, Z.; Reponen, T.; Hershey, G.K. Fungal Exposure and Asthma: IgE and Non-IgE-Mediated Mechanisms. Curr. Allergy Asthma Rep. 2016, 16, 86. [Google Scholar] [CrossRef] [PubMed]
- Hedayati, N.; Mortezaee, V.; Mahdaviani, S.A.; Mirenayat, M.S.; Hassanzad, M.; Pourabdollah, M.; Heshmatnia, J.; Fakharian, A.; Pourdolat, G.; Sharifynia, S.; et al. Prevalence of specific immunoglobulin E and G against Aspergillus fumigatus in patients with asthma. Curr. Med. Mycol. 2018, 4, 7–11. [Google Scholar] [CrossRef] [PubMed]
- Fairs, A.; Agbetile, J.; Hargadon, B.; Bourne, M.; Monteiro, W.R.; Brightling, C.E.; Bradding, P.; Green, R.H.; Mutalithas, K.; Desai, D.; et al. IgE sensitization to Aspergillus fumigatus is associated with reduced lung function in asthma. Am. J. Respir. Crit. Care Med. 2010, 182, 1362–1368. [Google Scholar] [CrossRef]
- Muller, C.; Braag, S.A.; Herlihy, J.D.; Wasserfall, C.H.; Chesrown, S.E.; Nick, H.S.; Atkinson, M.A.; Flotte, T.R. Enhanced IgE allergic response to Aspergillus fumigatus in CFTR−/− mice. Lab. Investig. 2006, 86, 130–140. [Google Scholar] [CrossRef]
- Knutsen, A.P.; Slavin, R.G. Allergic bronchopulmonary aspergillosis in asthma and cystic fibrosis. Clin. Dev. Immunol. 2011, 2011, 843763. [Google Scholar] [CrossRef]
- Hellings, P.W.; Steelant, B. Epithelial barriers in allergy and asthma. J. Allergy Clin. Immunol. 2020, 145, 1499–1509. [Google Scholar] [CrossRef]
- Ghosh, S.; Hoselton, S.A.; Schuh, J.M. Allergic Inflammation in Aspergillus fumigatus-Induced Fungal Asthma. Curr. Allergy Asthma Rep. 2015, 15, 59. [Google Scholar] [CrossRef]
- Bergeron, C.; Tulic, M.K.; Hamid, Q. Airway remodelling in asthma: From benchside to clinical practice. Can. Respir. J. 2010, 17, e85–e93. [Google Scholar] [CrossRef]
- Hackett, T.L. Epithelial-mesenchymal transition in the pathophysiology of airway remodelling in asthma. Curr. Opin. Allergy Clin. Immunol. 2012, 12, 53–59. [Google Scholar] [CrossRef]
- Hough, K.P.; Curtiss, M.L.; Blain, T.J.; Liu, R.M.; Trevor, J.; Deshane, J.S.; Thannickal, V.J. Airway Remodeling in Asthma. Front. Med. 2020, 7, 191. [Google Scholar] [CrossRef]


| Group | Sensitization | Challenge | |
|---|---|---|---|
| Day 0 and 14 (IP) | Acute Asthma | Chronic Asthma | |
| Days 28, 29, and 30 (IN Under General Anesthesia) | 3× per Week for 6 Weeks Starting from Day 28 (IN Under General Anesthesia) | ||
| PBS | 20 µL PBS/mouse | 20 µL PBS/mouse |
| PBS/Al(OH)3 (1:1) | 20 µL PBS/mouse | 20 µL PBS/mouse |
| OVA (400 μg/kg) in PBS/Al(OH)3 (1:1) | OVA (conc. 1 mg of protein/mL PBS)—20 μL/mouse | OVA (conc. 1 mg of protein/mL PBS)—20 μL/mouse |
| Fungal extract (400 μg of protein/kg) in PBS/Al(OH)3 (1:1) | Fungal extract (conc. 1 mg of protein/mL PBS)—20 μL/mouse | Fungal extract (conc. 1 mg of protein/mL PBS)—20 μL/mouse |
| |||
| Leukocyte Subpopulations | Acute Asthma Model | Chronic Asthma Model | ||
|---|---|---|---|---|
| F | p | F | p | |
| Lymphocytes | 146 (3, 42) | 0.001 | 83.4 (5, 33) | 0.001 |
| Granulocytes | 216 (15, 38) | 0.001 | 246.8 (10, 45) | 0.001 |
| Eosinophils | 4.66 (1, 3) | 0.004 | 6.16 (1, 5) | 0.04 |
| Monocytes | 1.06 (1, 3) | 0.25 | 1.94 (1, 2) | 0.12 |
| Cytokine | Acute Asthma Model | Chronic Asthma Model | ||
|---|---|---|---|---|
| F | p | F | p | |
| IL-4 | 296.8 (20, 62) | 0.001 | 280.3 (35, 65) | 0.002 |
| IL-5 | 441 (29, 47) | 0.001 | 1 508 (48, 86) | 0.004 |
| IL-13 | 364.5 (32, 56) | 0.002 | 522 (29, 66) | 0.001 |
| TNF-α | 452.6 (31, 54) | 0.007 | 420 (25, 52) | 0.005 |
| TGF-β | 1 130 (33, 51) | 0.001 | 1 241 (36, 75) | 0.005 |
| Ig | Acute Asthma Model | Chronic Asthma Model | ||||
|---|---|---|---|---|---|---|
| Chi-Square | df | p | Chi-Square | df | p | |
| IgE | 17.0 | 6 | 0.009 | 18.75 | 6 | 0.008 |
Disclaimer/Publisher’s Note: The statements, opinions and data contained in all publications are solely those of the individual author(s) and contributor(s) and not of MDPI and/or the editor(s). MDPI and/or the editor(s) disclaim responsibility for any injury to people or property resulting from any ideas, methods, instructions or products referred to in the content. |
© 2025 by the authors. Licensee MDPI, Basel, Switzerland. This article is an open access article distributed under the terms and conditions of the Creative Commons Attribution (CC BY) license (https://creativecommons.org/licenses/by/4.0/).
Share and Cite
Wlaź, P.; Socała, K.; Palusińska-Szysz, M.; Świderska, U.; Szczypior, D.; Krasowska, M.; Szuster-Ciesielska, A. Microfungus Podosphaera fusca and the Fungus-like Organism Peronospora ficariae as Potential Inhalant Allergens in a Mouse Model of Asthma. Cells 2025, 14, 914. https://doi.org/10.3390/cells14120914
Wlaź P, Socała K, Palusińska-Szysz M, Świderska U, Szczypior D, Krasowska M, Szuster-Ciesielska A. Microfungus Podosphaera fusca and the Fungus-like Organism Peronospora ficariae as Potential Inhalant Allergens in a Mouse Model of Asthma. Cells. 2025; 14(12):914. https://doi.org/10.3390/cells14120914
Chicago/Turabian StyleWlaź, Piotr, Katarzyna Socała, Marta Palusińska-Szysz, Urszula Świderska, Dominika Szczypior, Magdalena Krasowska, and Agnieszka Szuster-Ciesielska. 2025. "Microfungus Podosphaera fusca and the Fungus-like Organism Peronospora ficariae as Potential Inhalant Allergens in a Mouse Model of Asthma" Cells 14, no. 12: 914. https://doi.org/10.3390/cells14120914
APA StyleWlaź, P., Socała, K., Palusińska-Szysz, M., Świderska, U., Szczypior, D., Krasowska, M., & Szuster-Ciesielska, A. (2025). Microfungus Podosphaera fusca and the Fungus-like Organism Peronospora ficariae as Potential Inhalant Allergens in a Mouse Model of Asthma. Cells, 14(12), 914. https://doi.org/10.3390/cells14120914