
Development and In Vitro Characterization of [3H]GMC-058 as Radioligand for Imaging Parkinsonian-Related Proteinopathies

 ,
,  , ,
, ,  ,
,  ,
,  , and
, and
Abstract
1. Introduction
2. Materials and Methods
2.1. In Vitro Binding Assays
2.1.1. Radioligand Binding to α-Syn Fibrils
2.1.2. Radioligand Binding to Native Tau and Aβ Fibrils
2.2. Radiosynthesis of [3H]GMC-058, [3H]GMC-073, and [3H]GMC-098
2.3. Autopsy Material
2.4. Preparation of Human Brain Tissue for In Vitro Binding Studies
2.5. Saturation Binding Assays
2.6. Autoradiography Experiments on Fresh-Frozen Tissue Sections
2.7. Autoradiography and Emulsion Autoradiography on Tissue Microarrays
2.8. Immunohistochemistry
3. Results
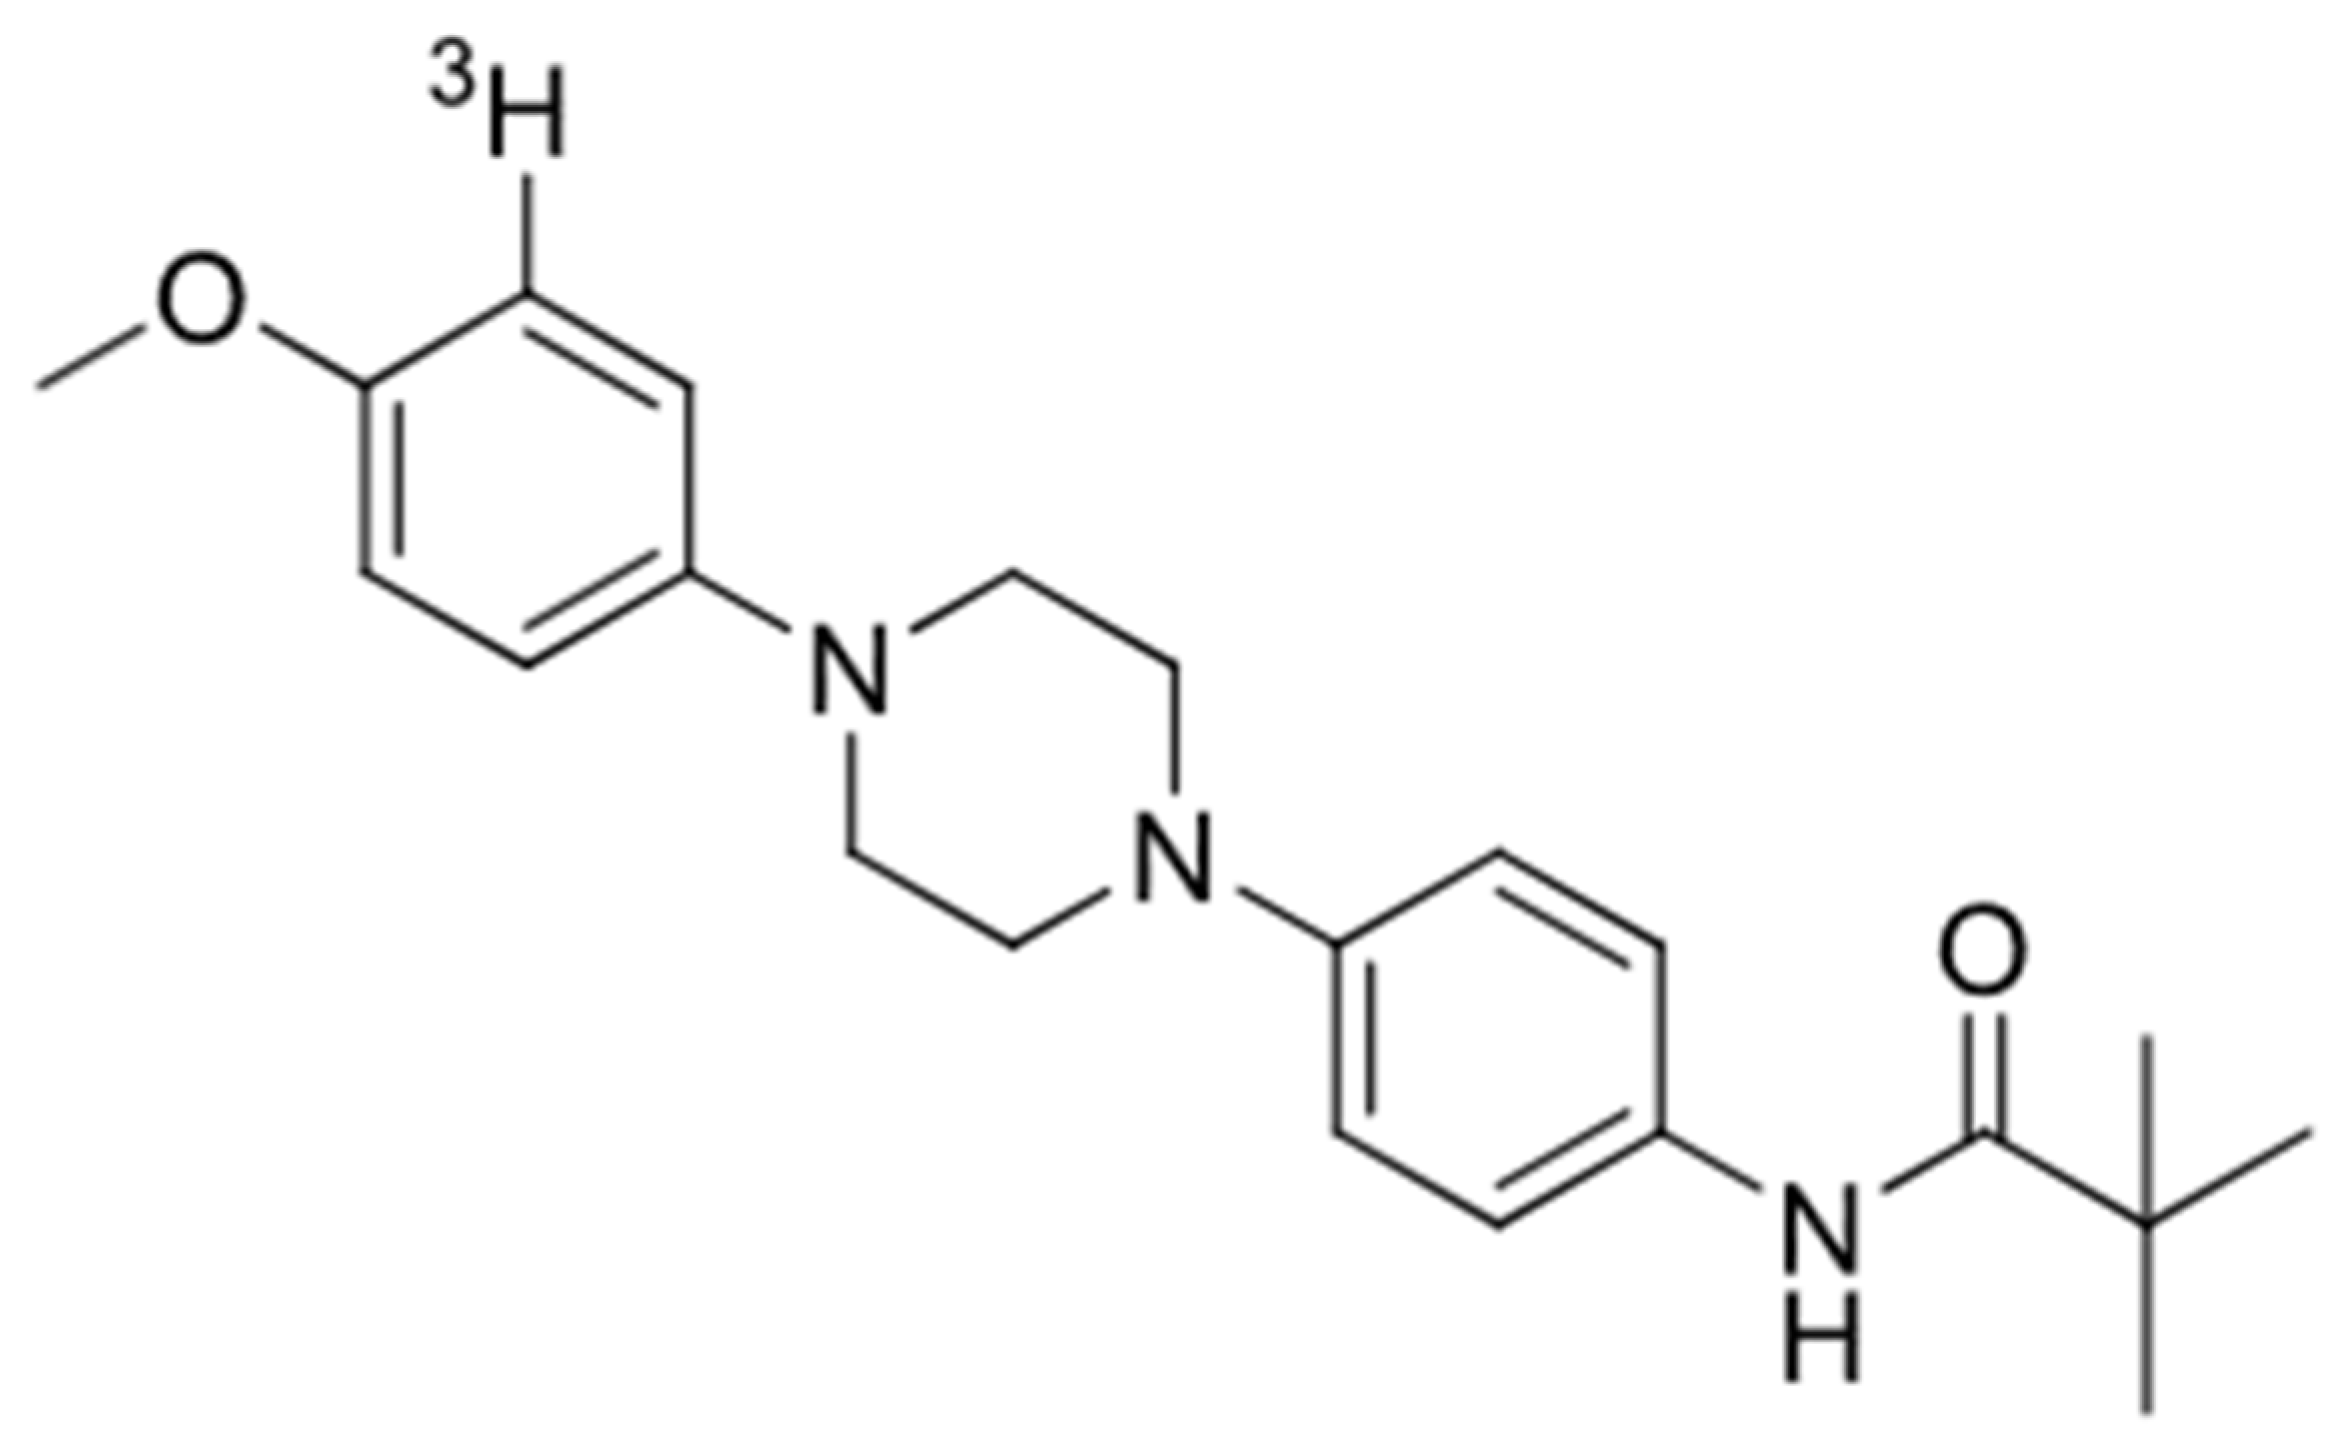
3.1. Discovery and In Vitro Characterization of GMC-058
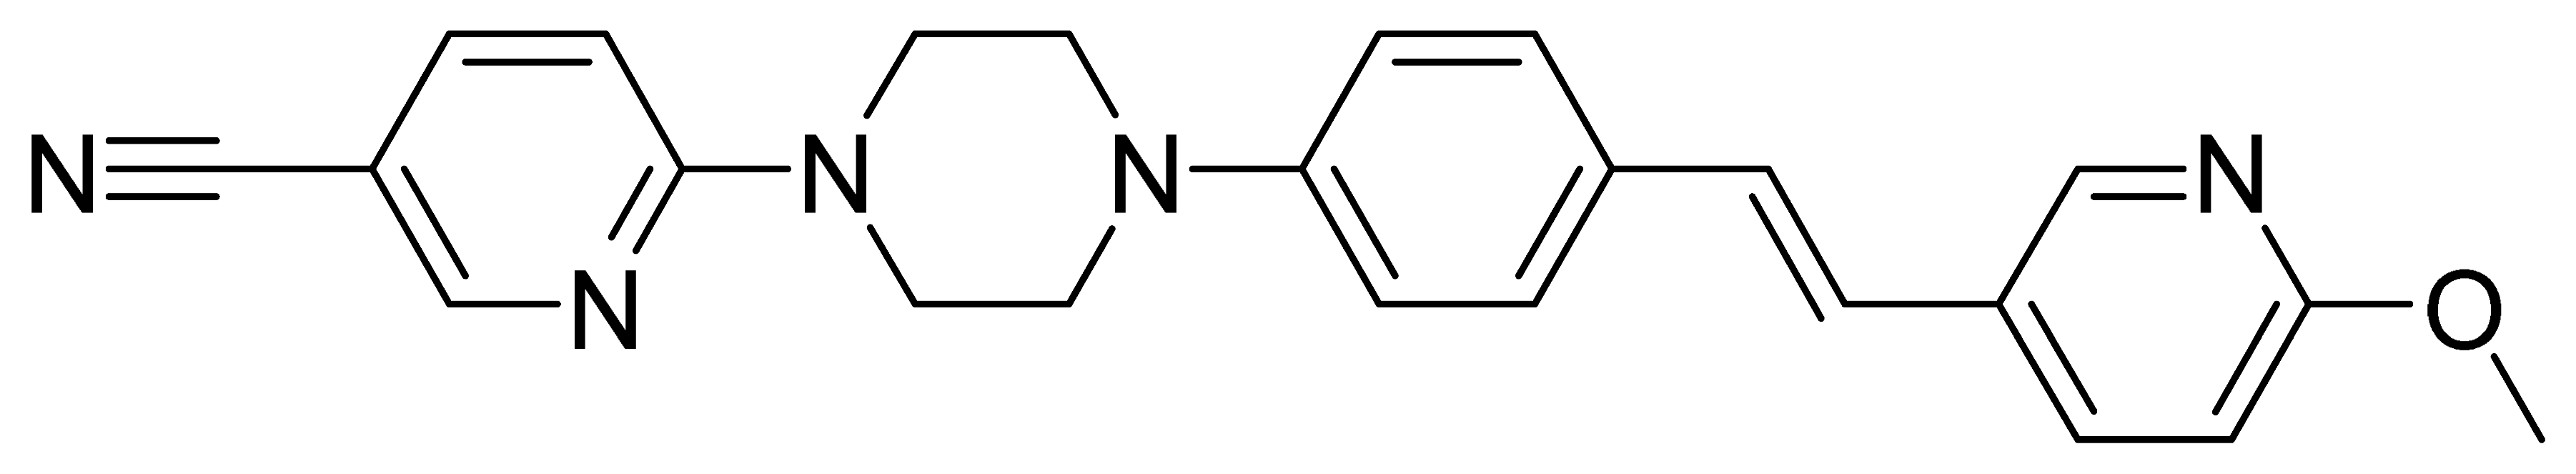
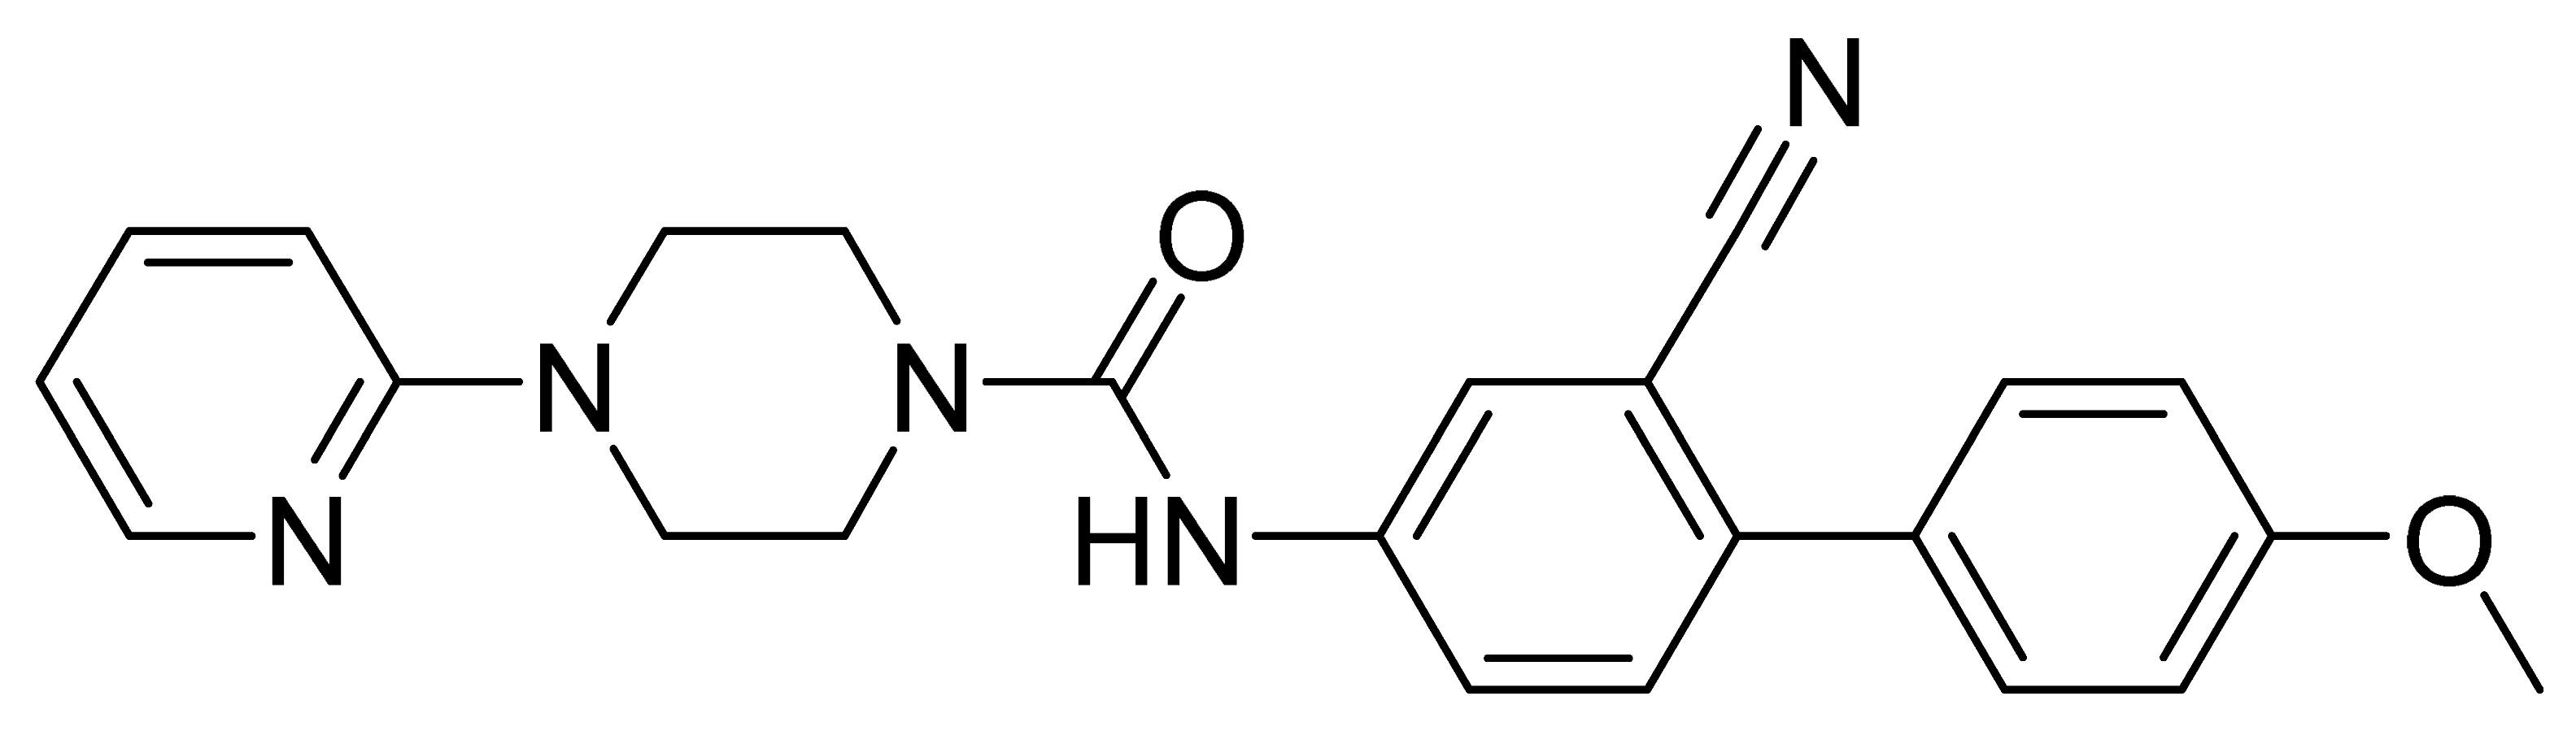
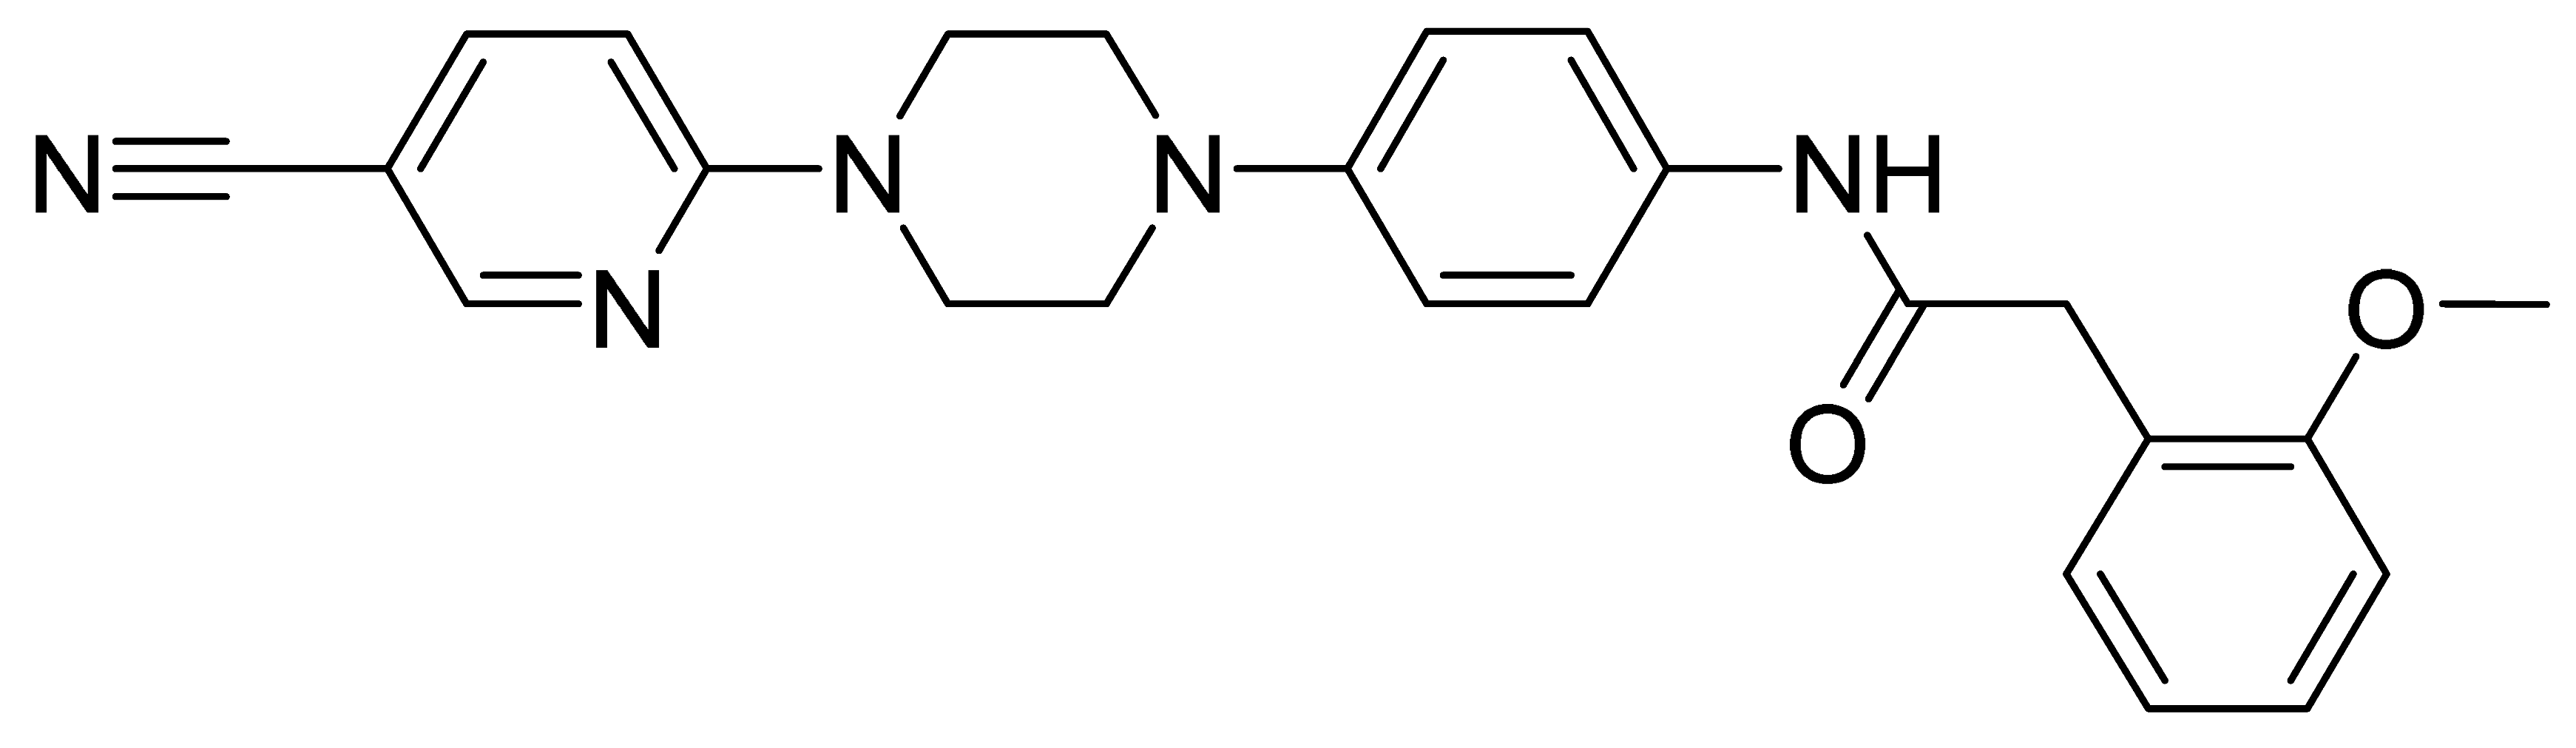
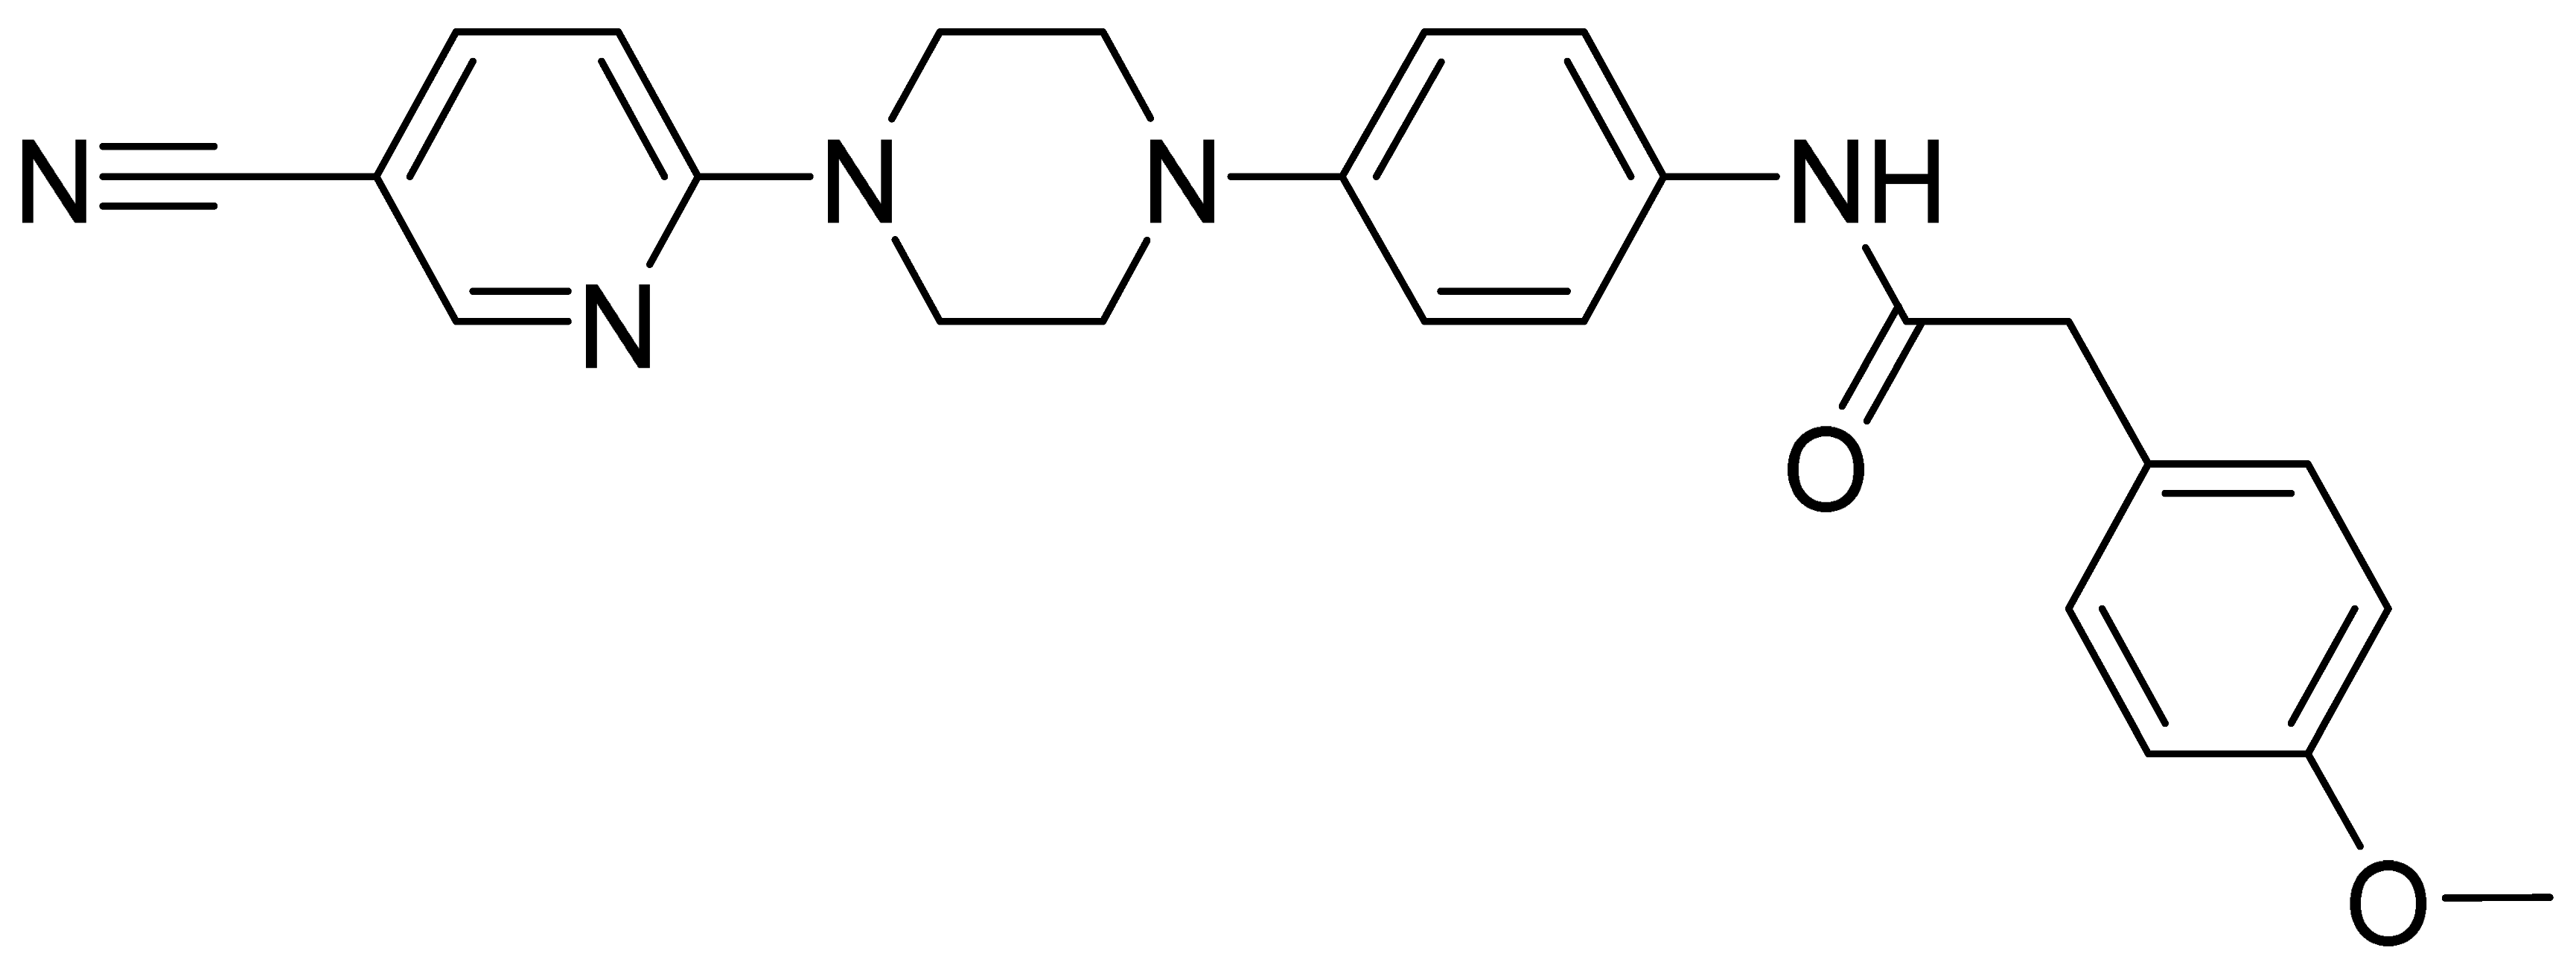
3.1.1. Discovery of GMC-058, GMC-073 and GMC-098
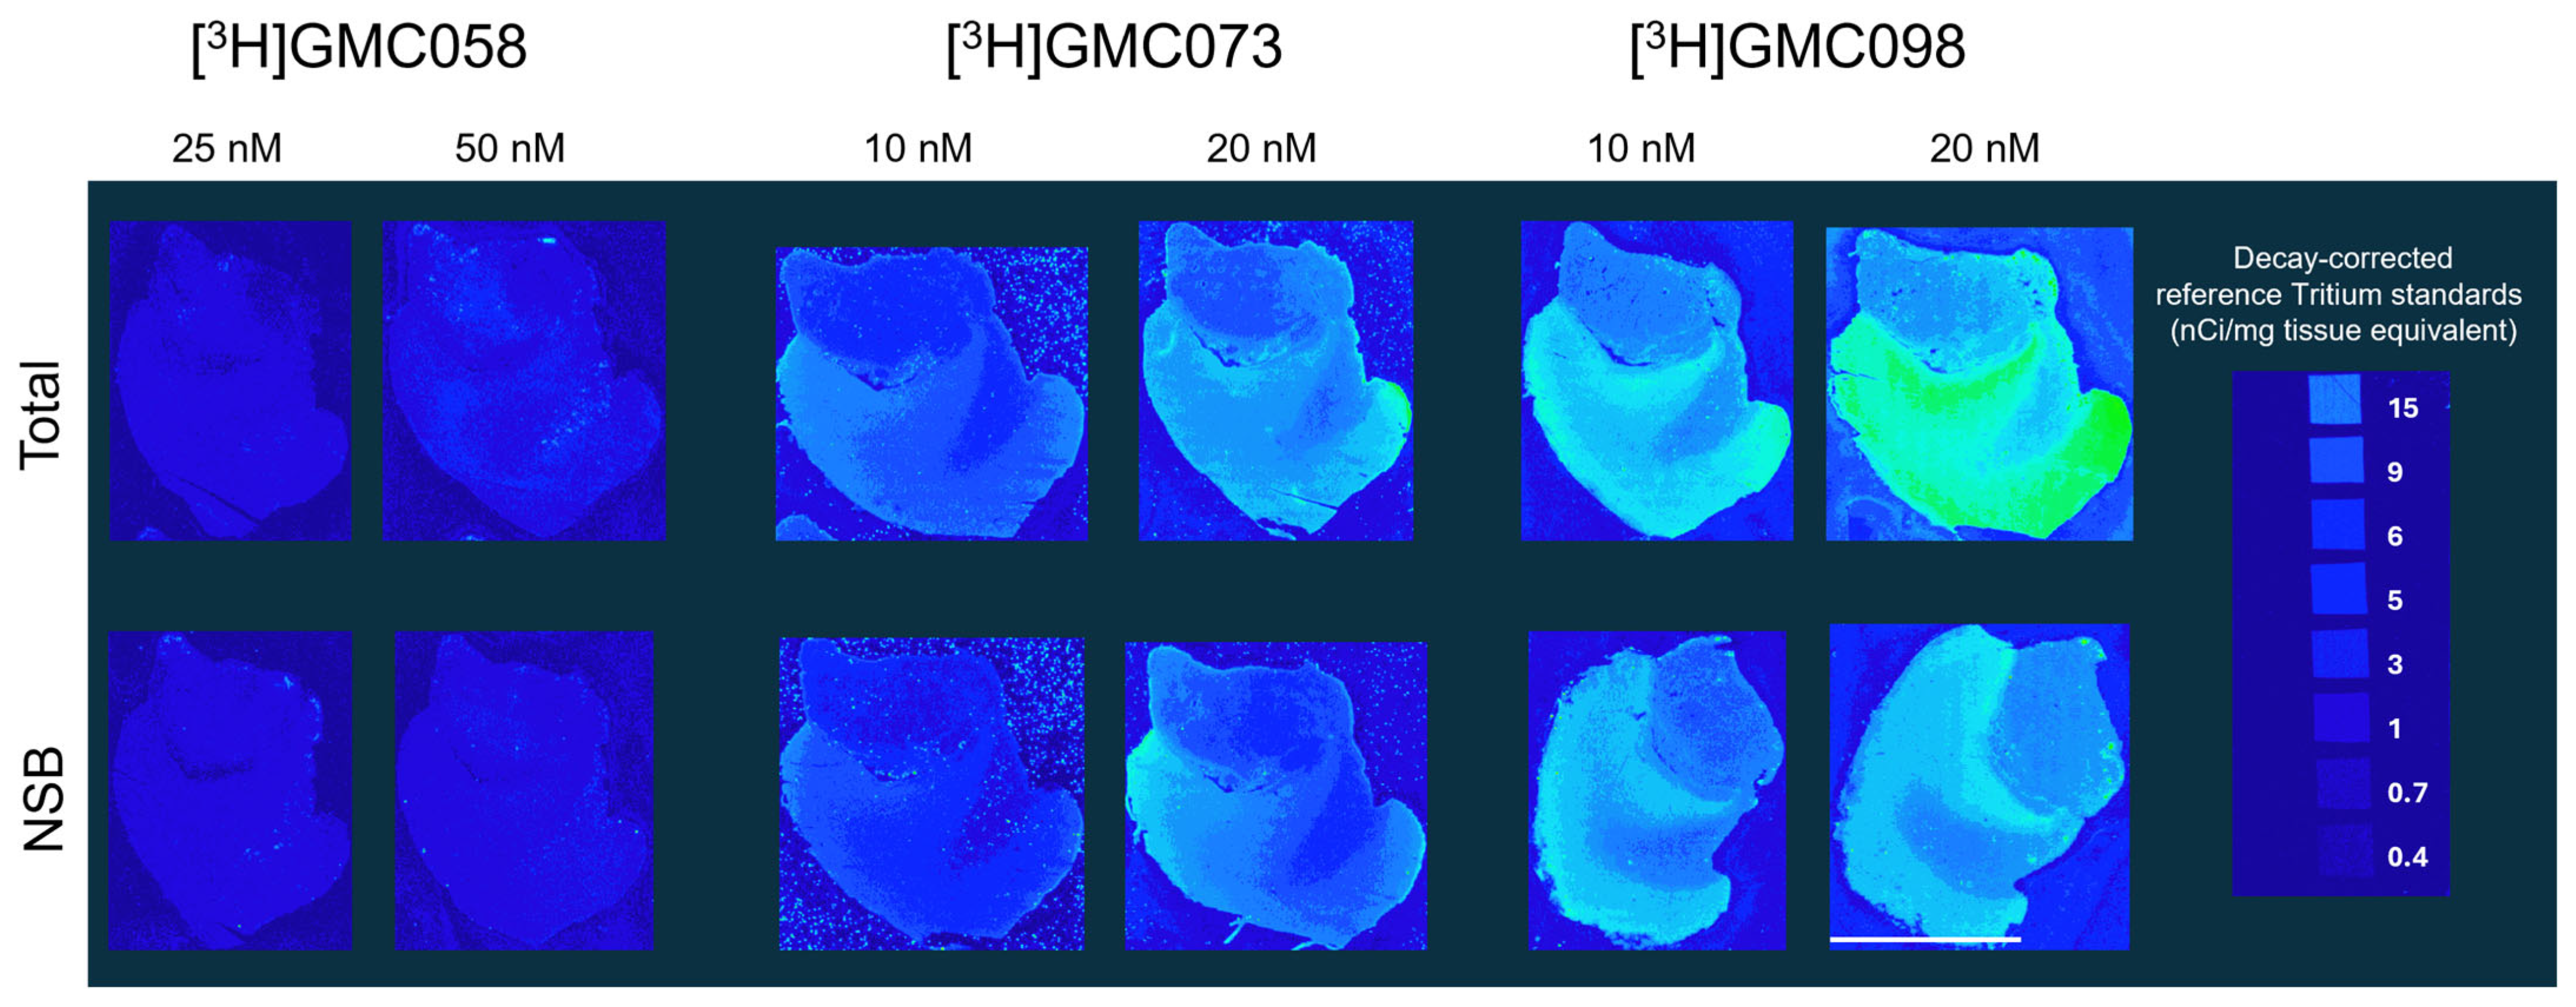
3.1.2. Autoradiography Experiments with [3H]GMC-058, [3H]GMC-073 and [3H]GMC-098
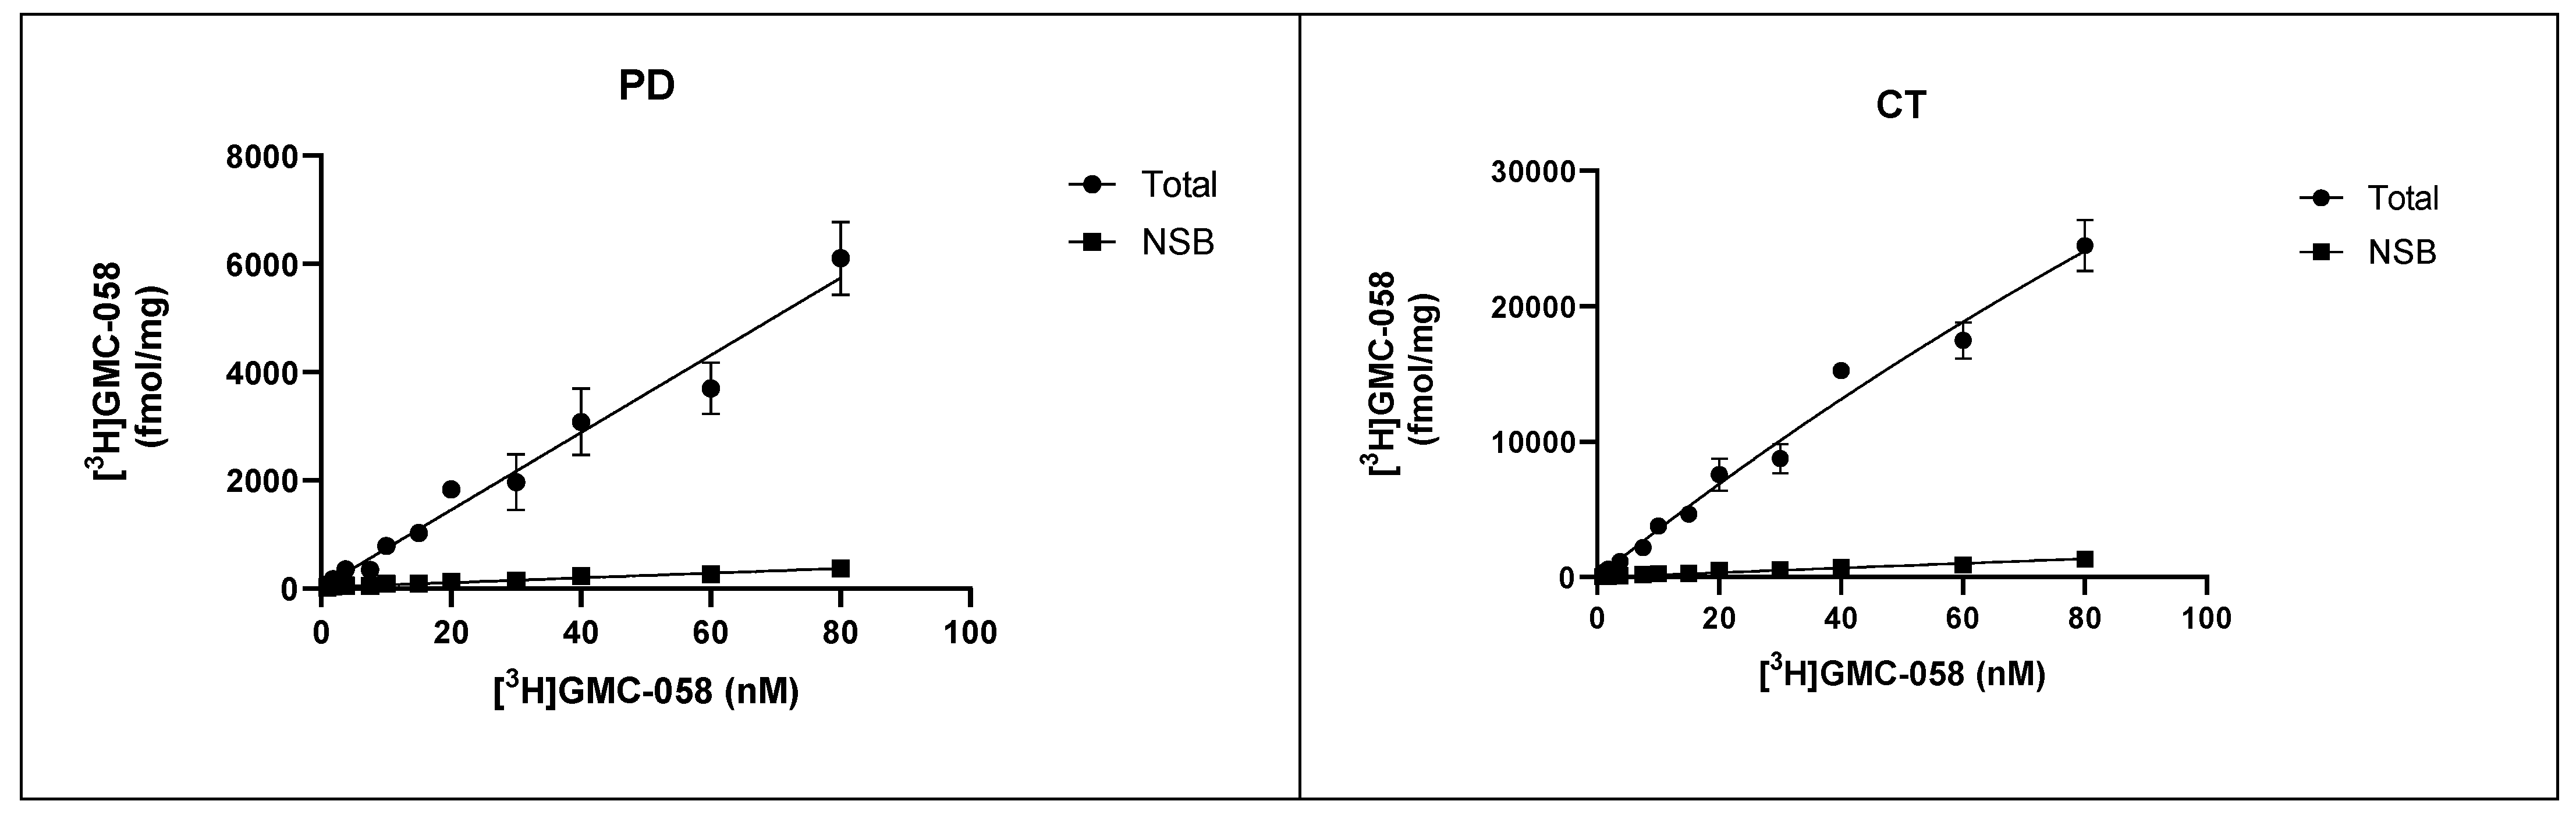
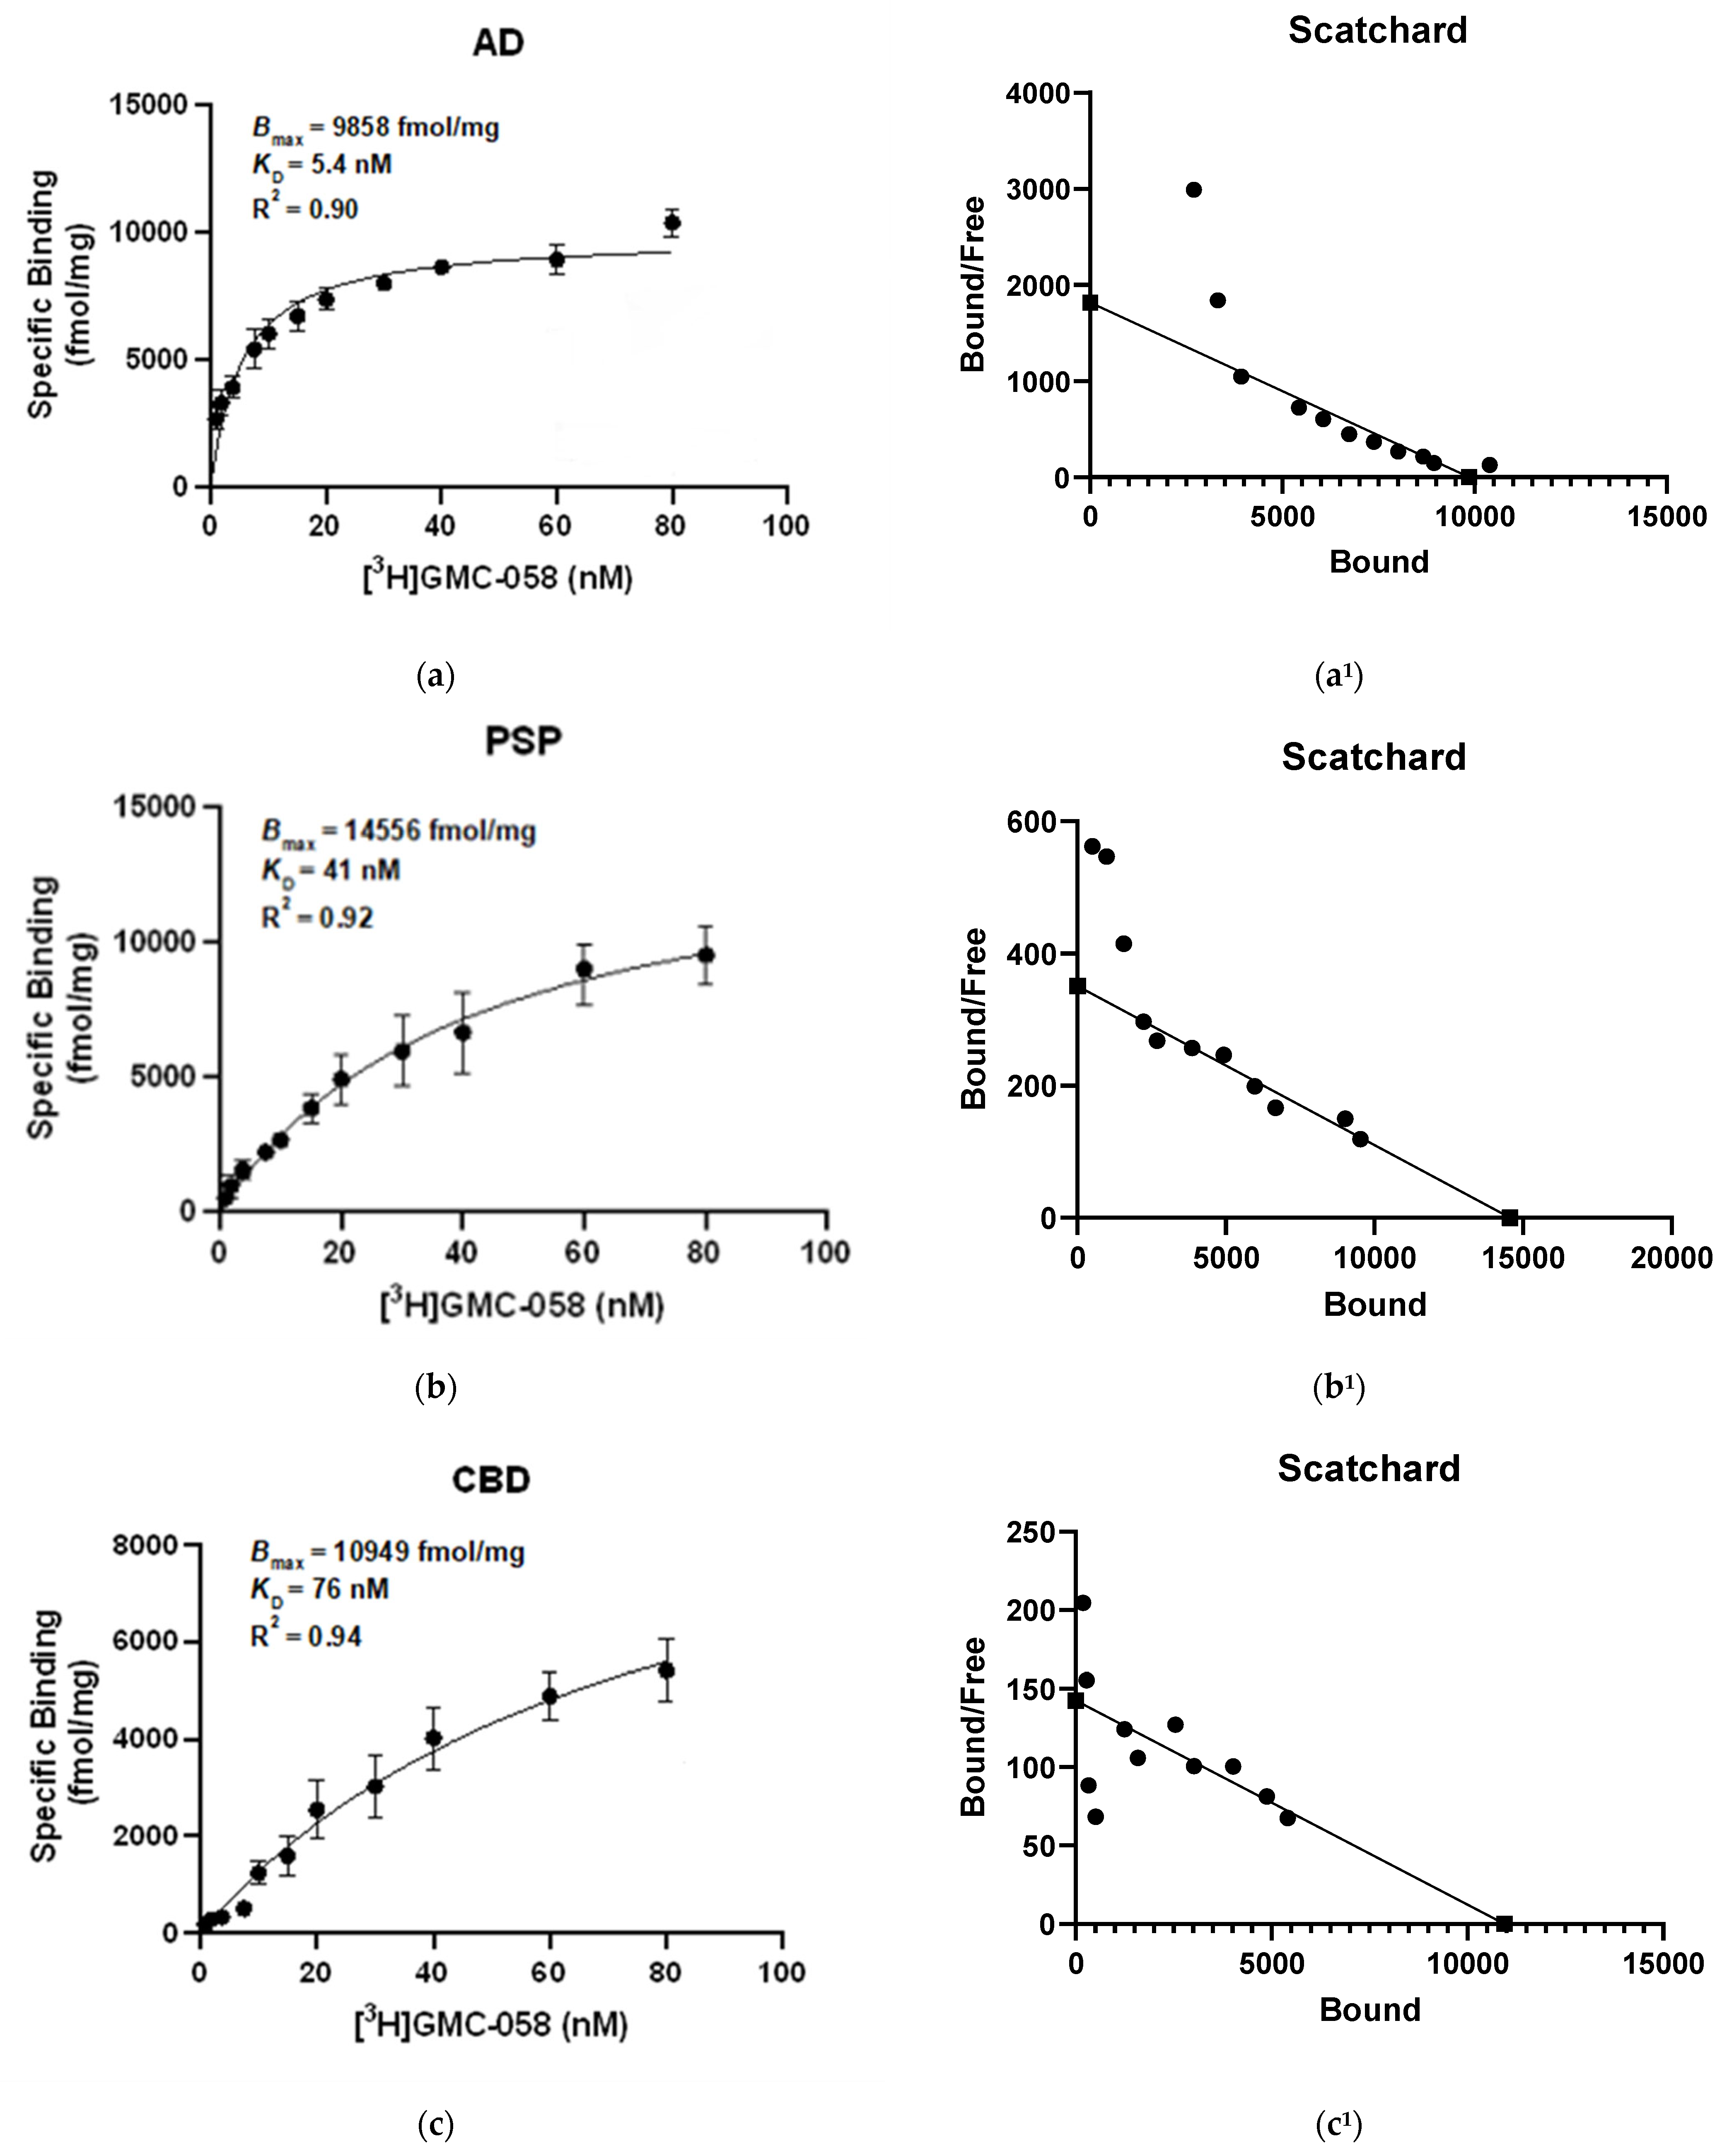
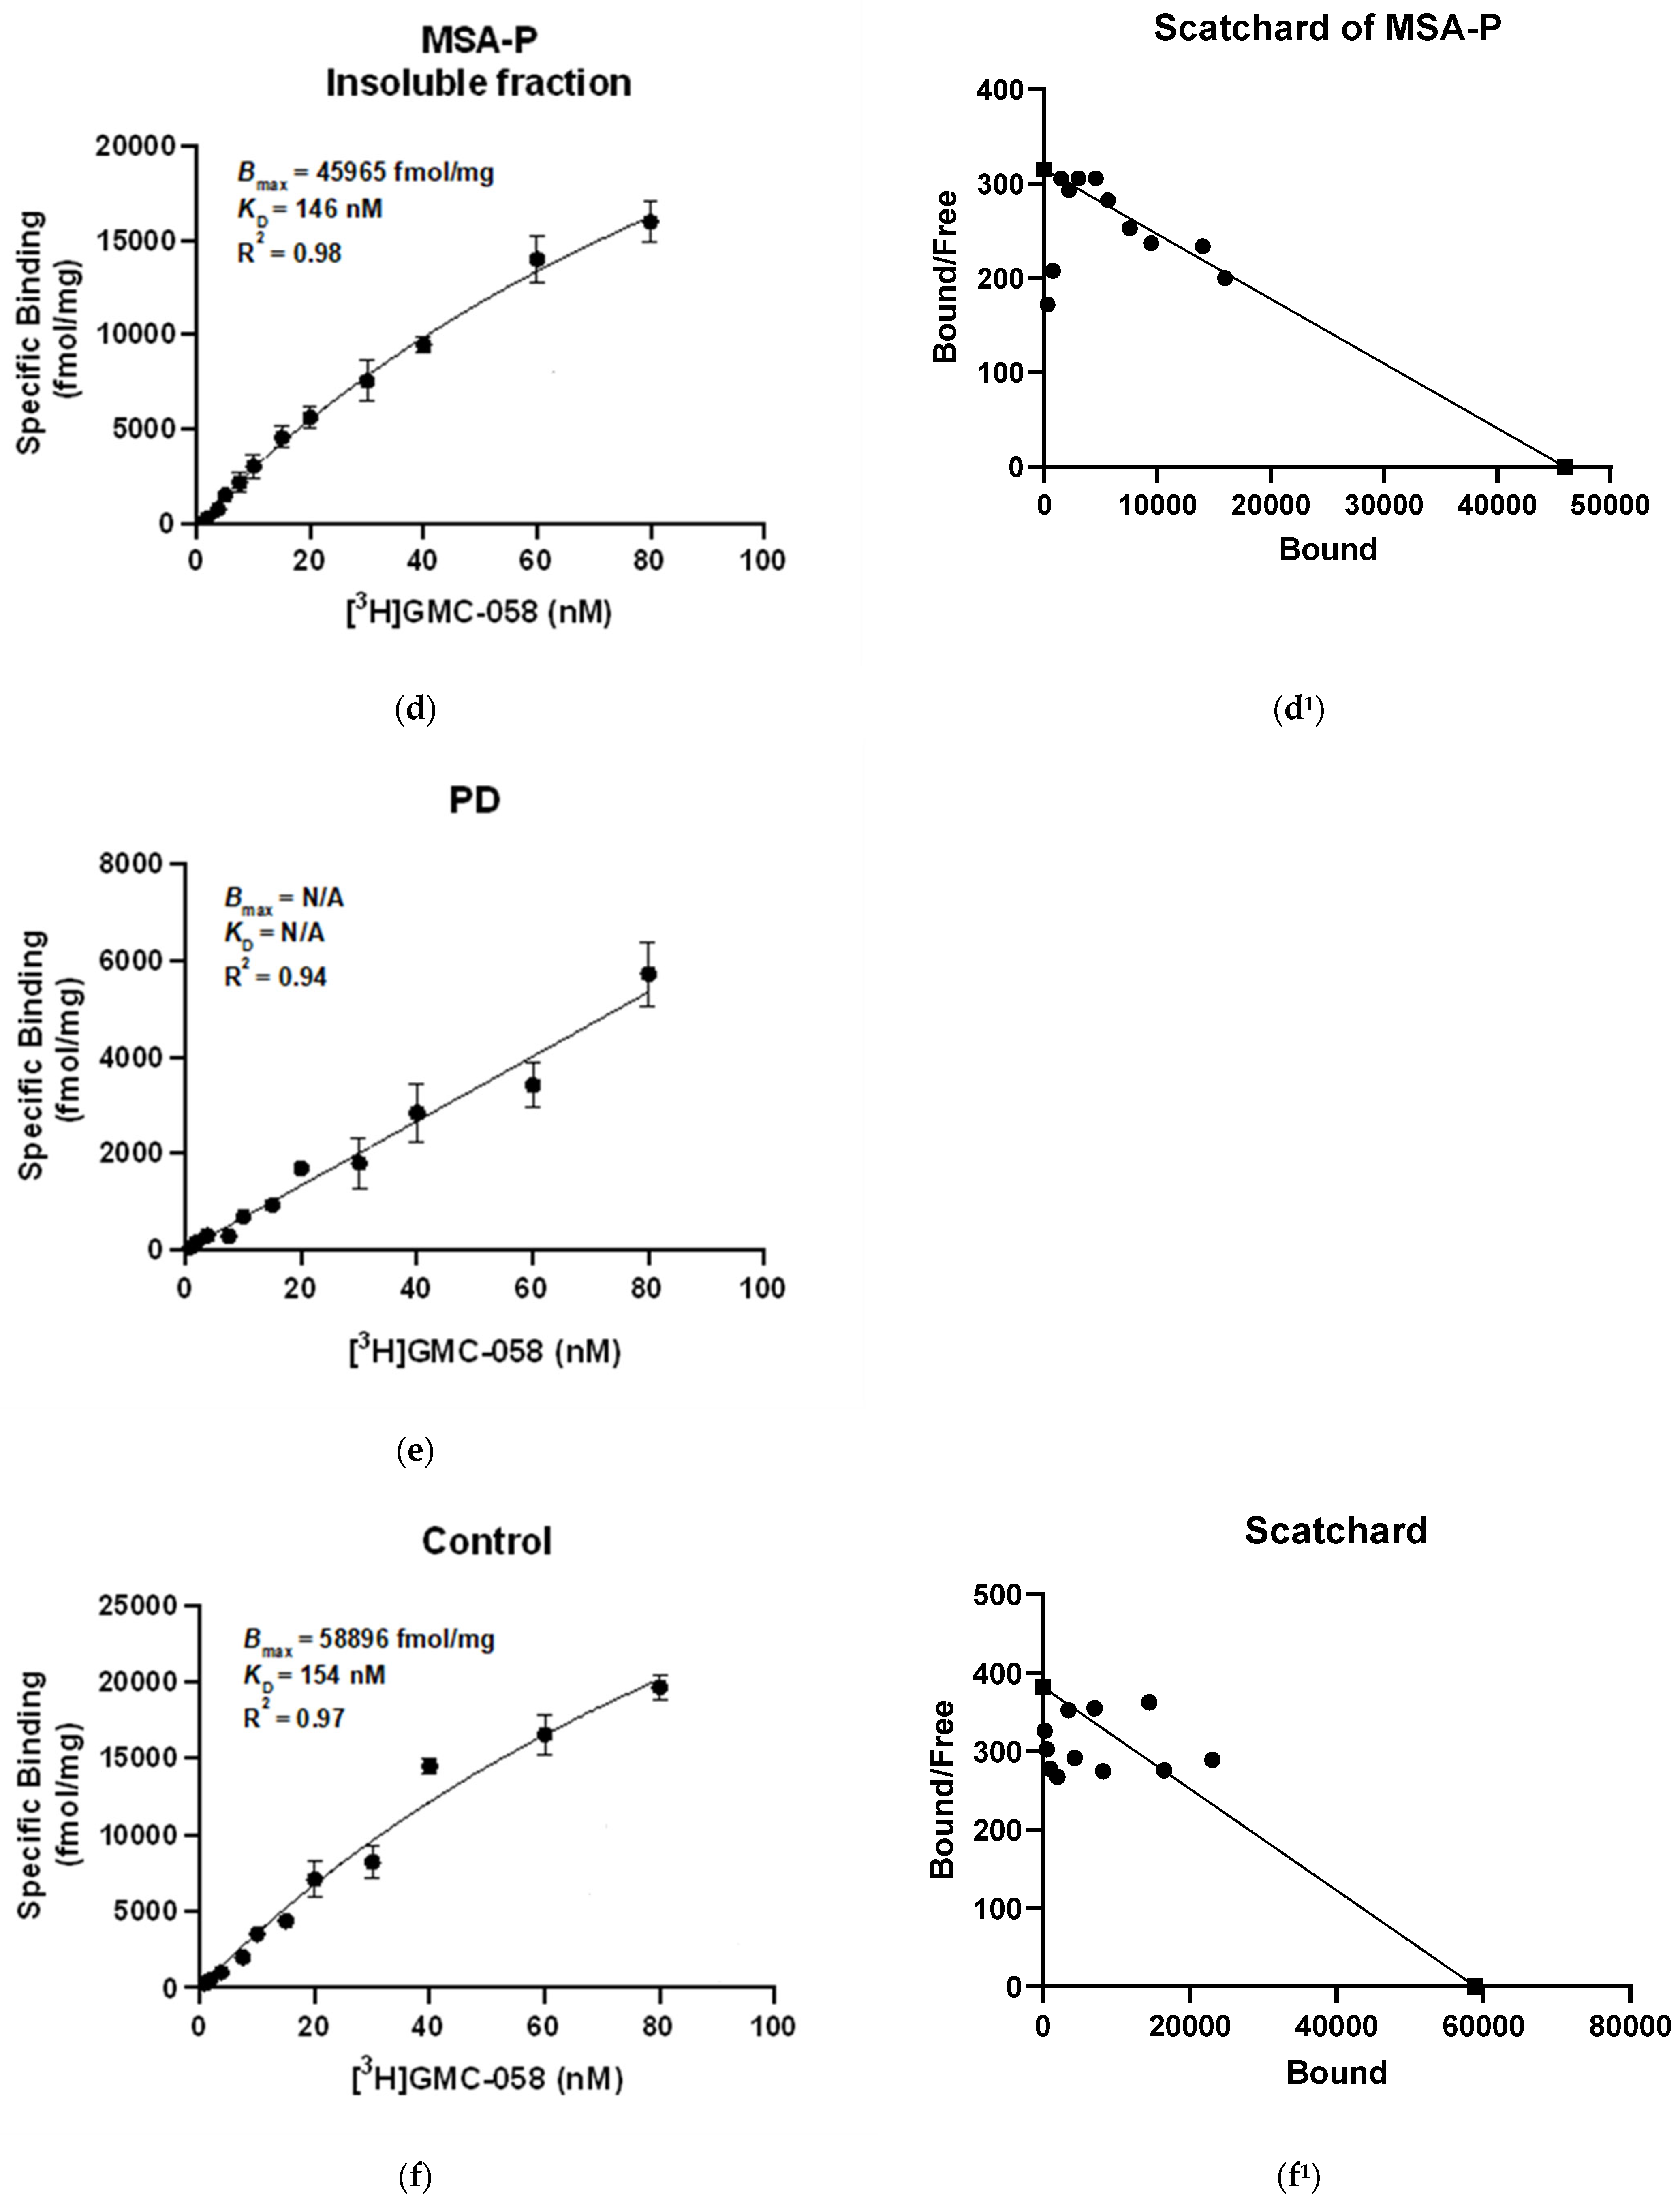
3.1.3. In Vitro Saturation Binding Assays with [3H]GMC-058 in Brain Homogenates
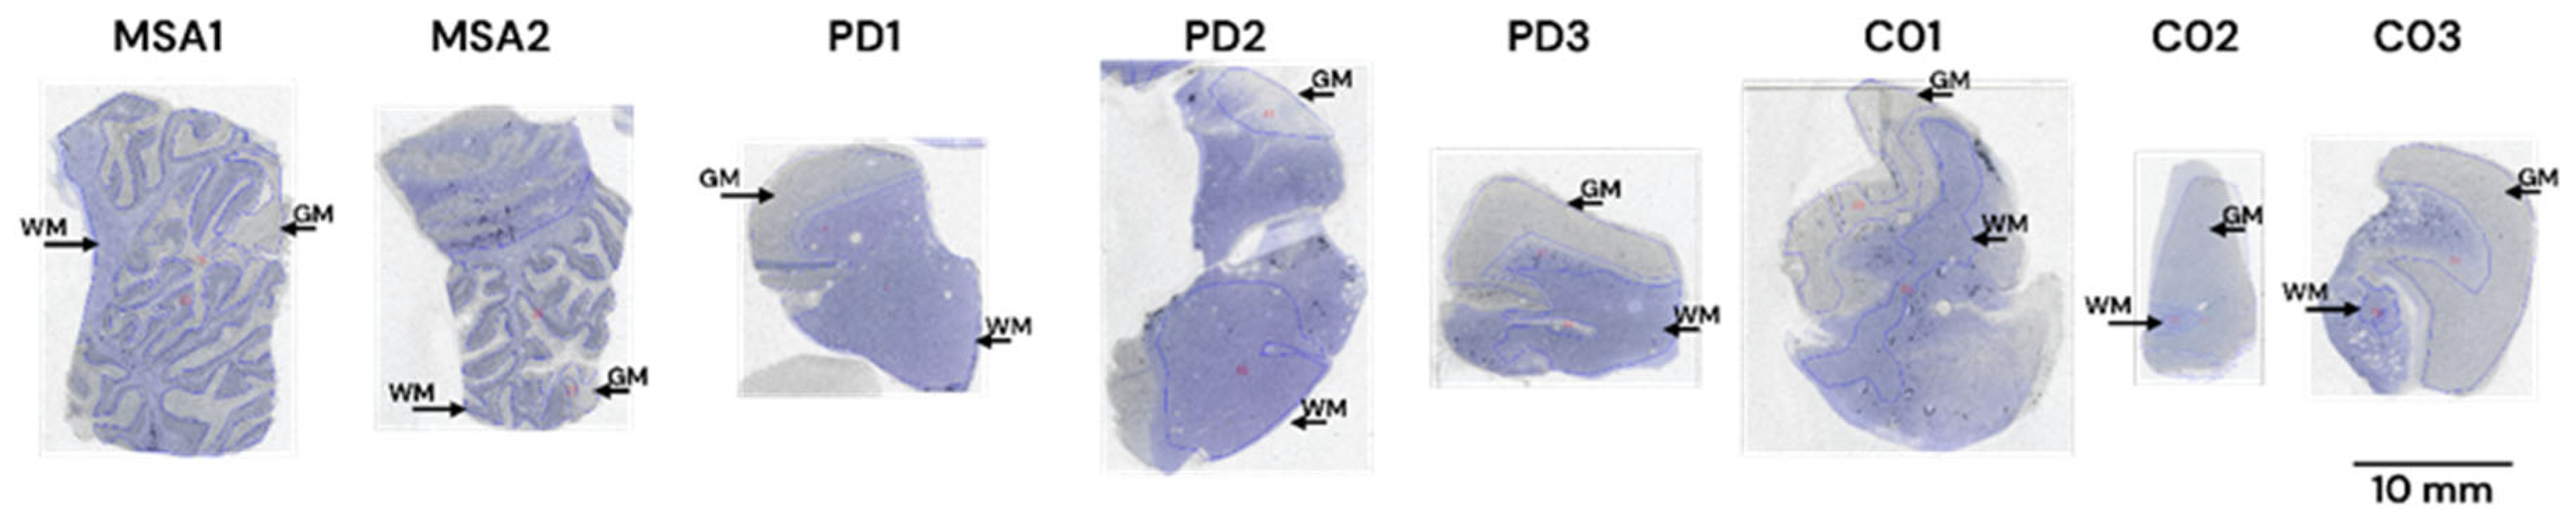
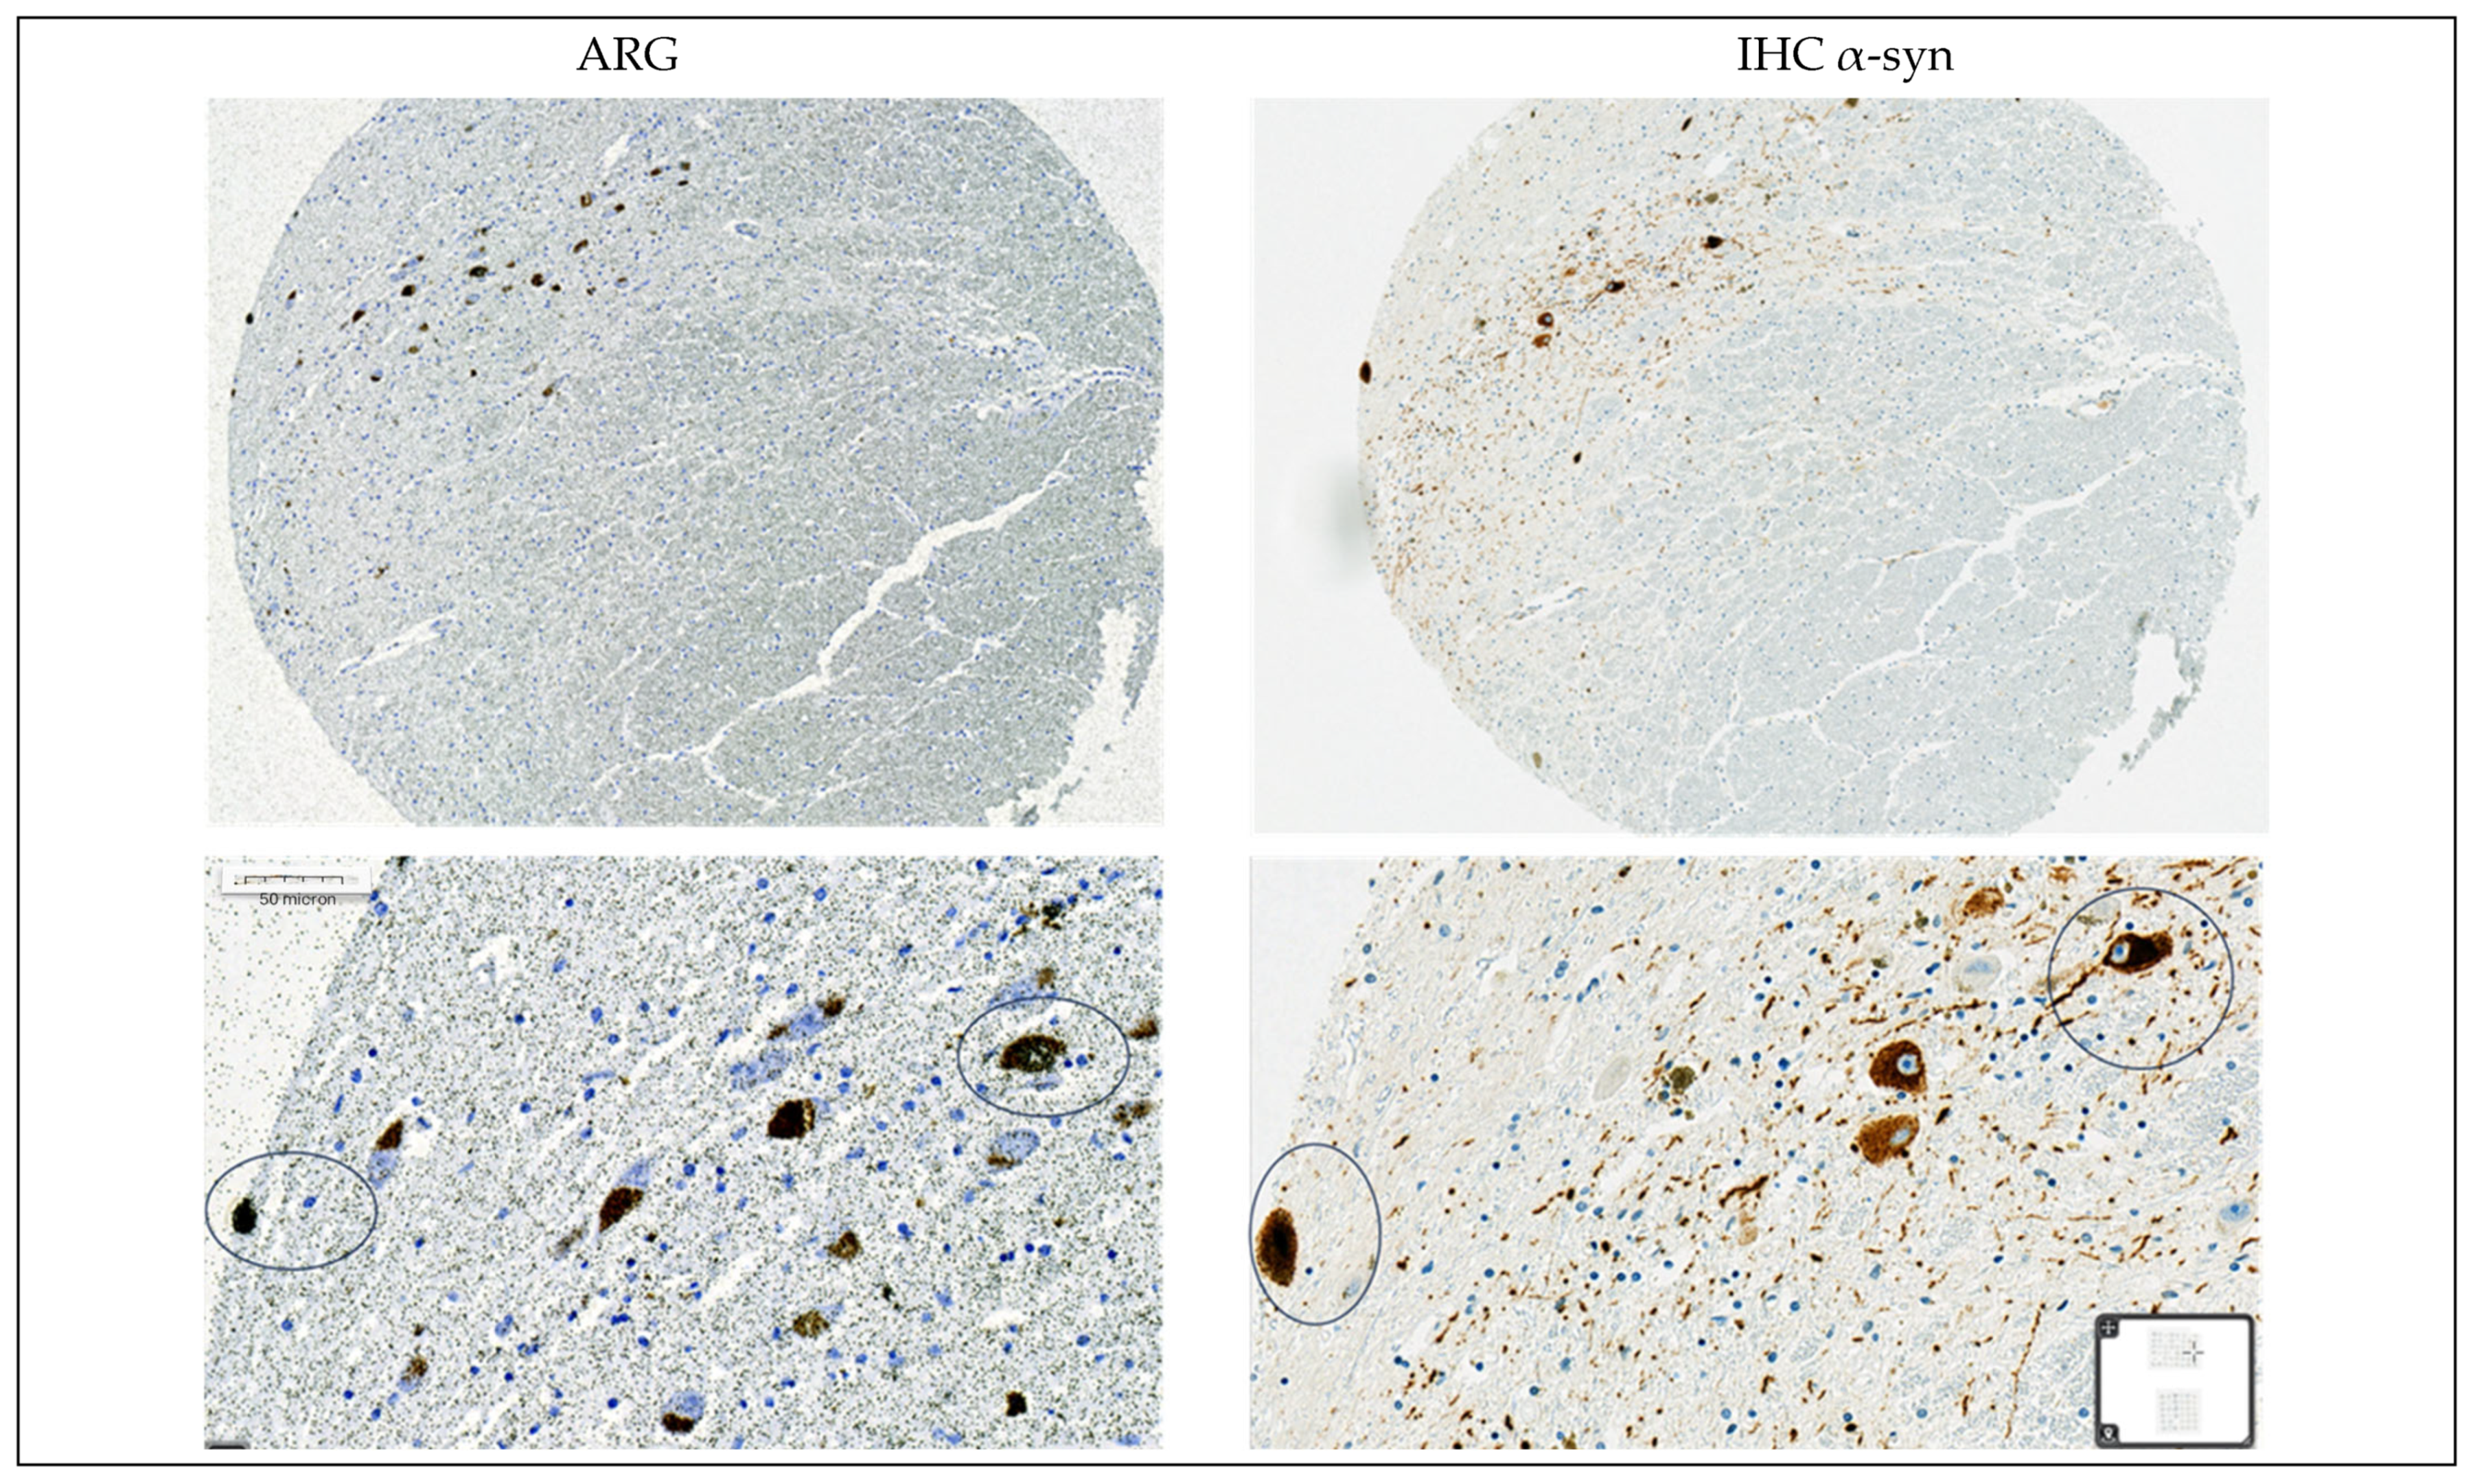
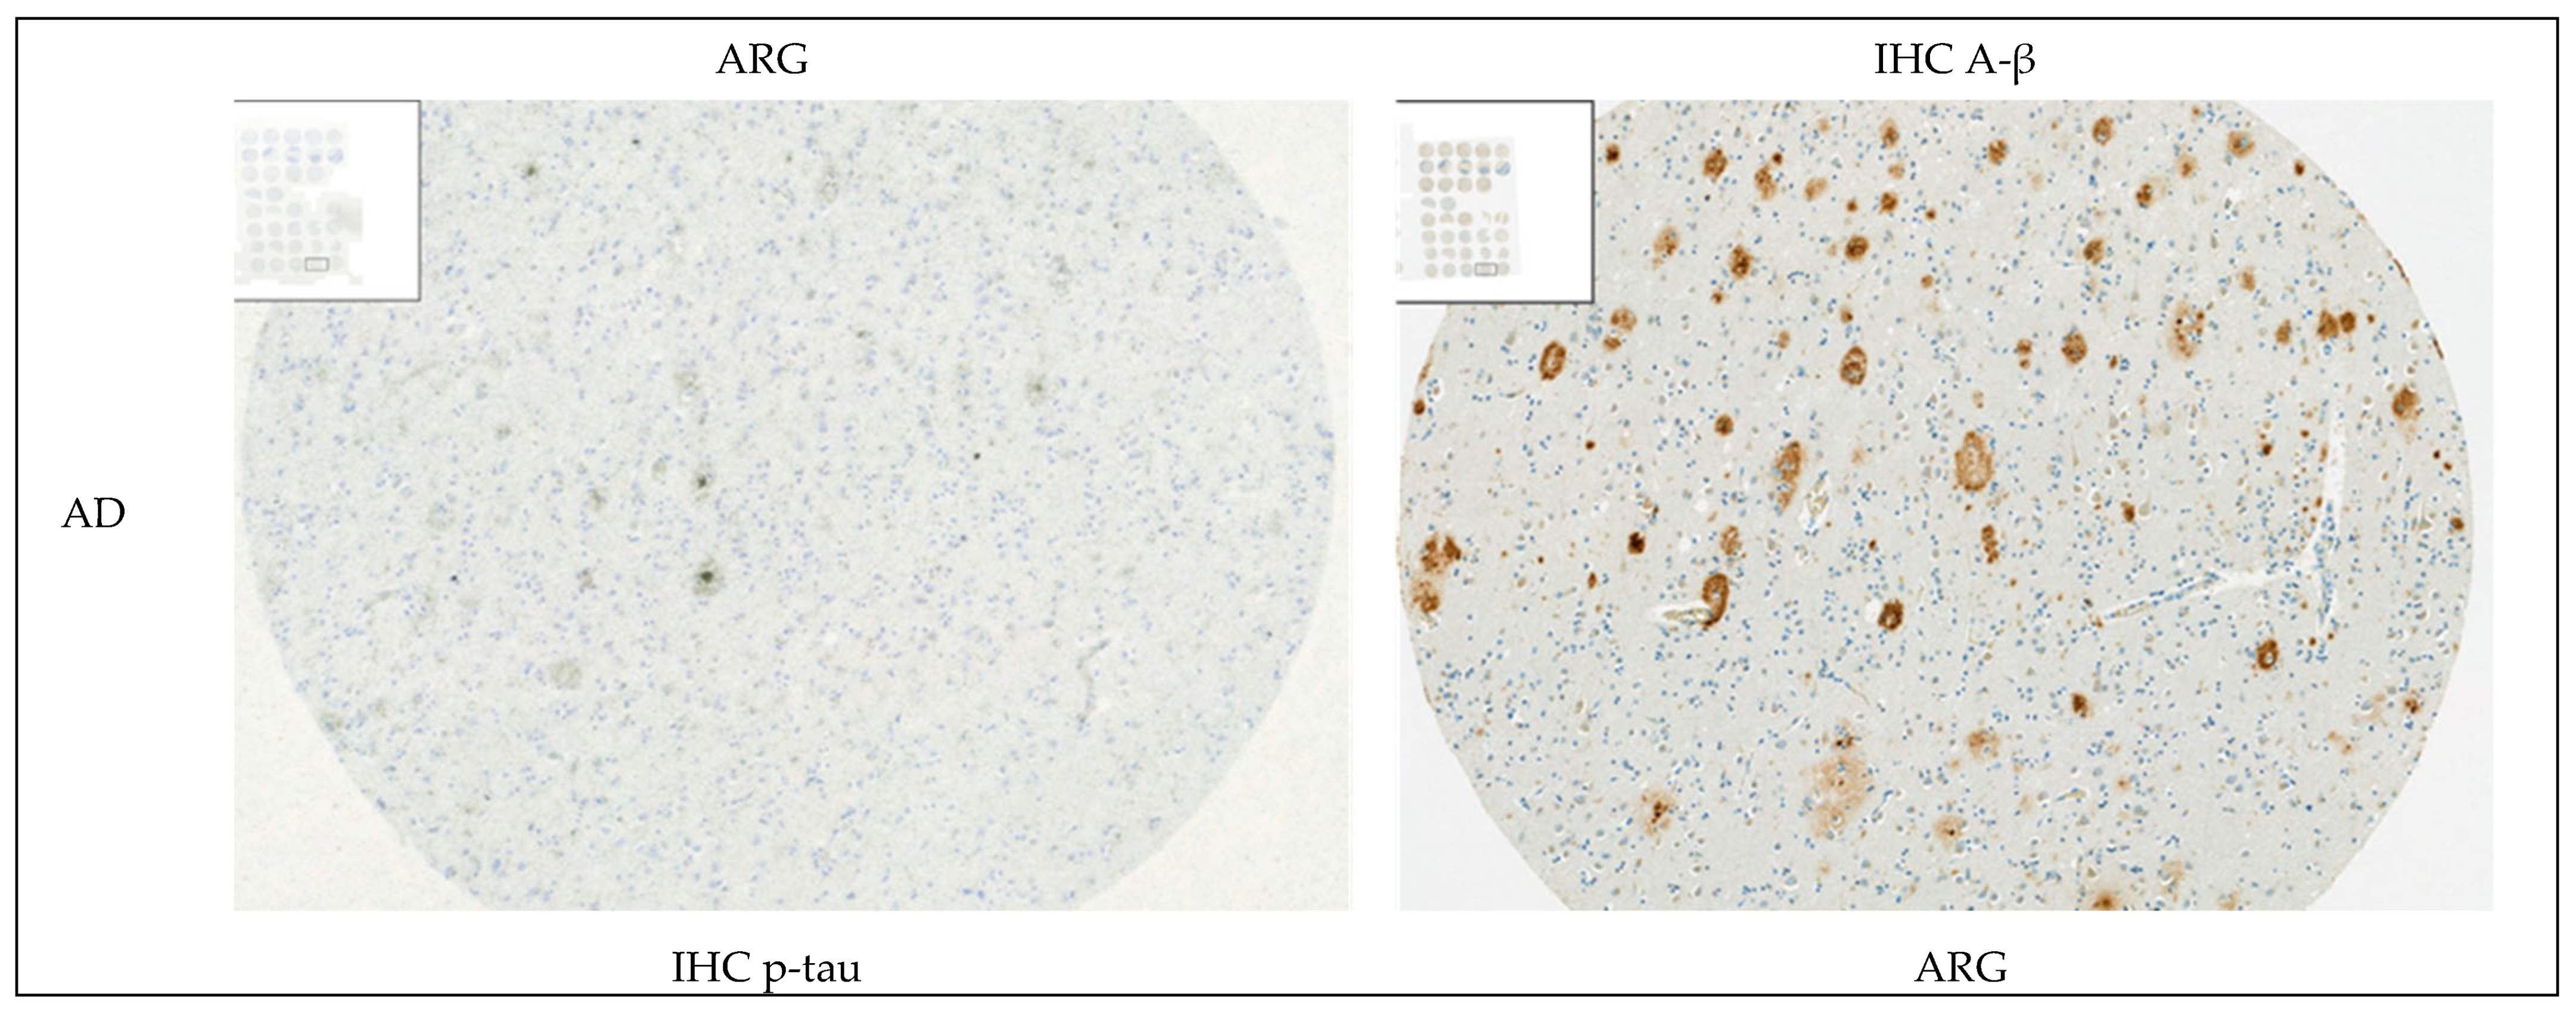
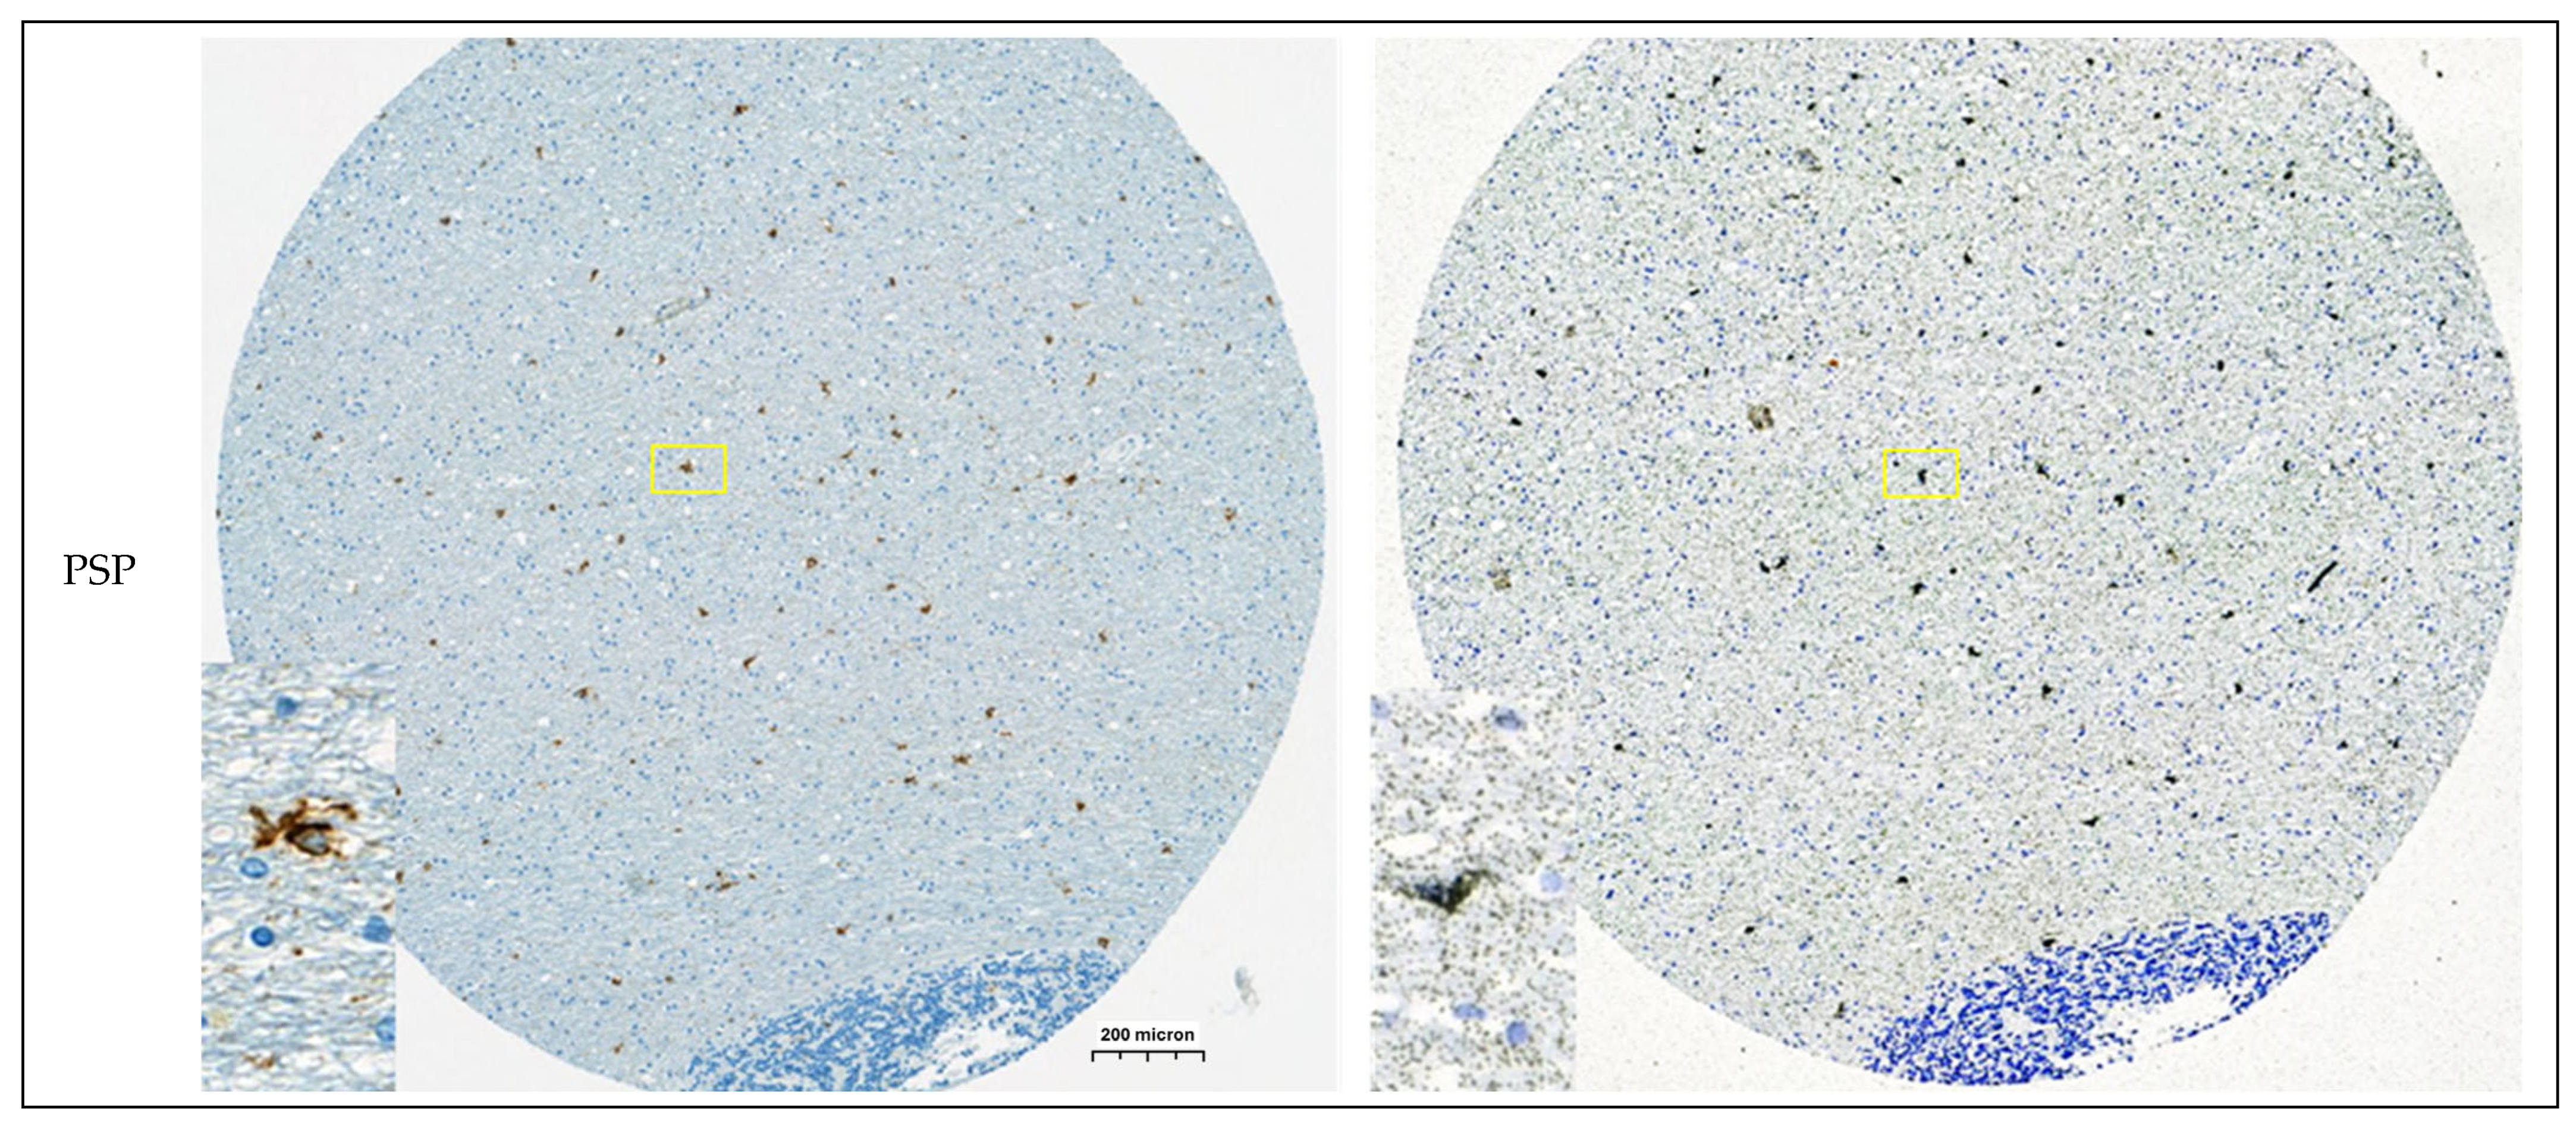
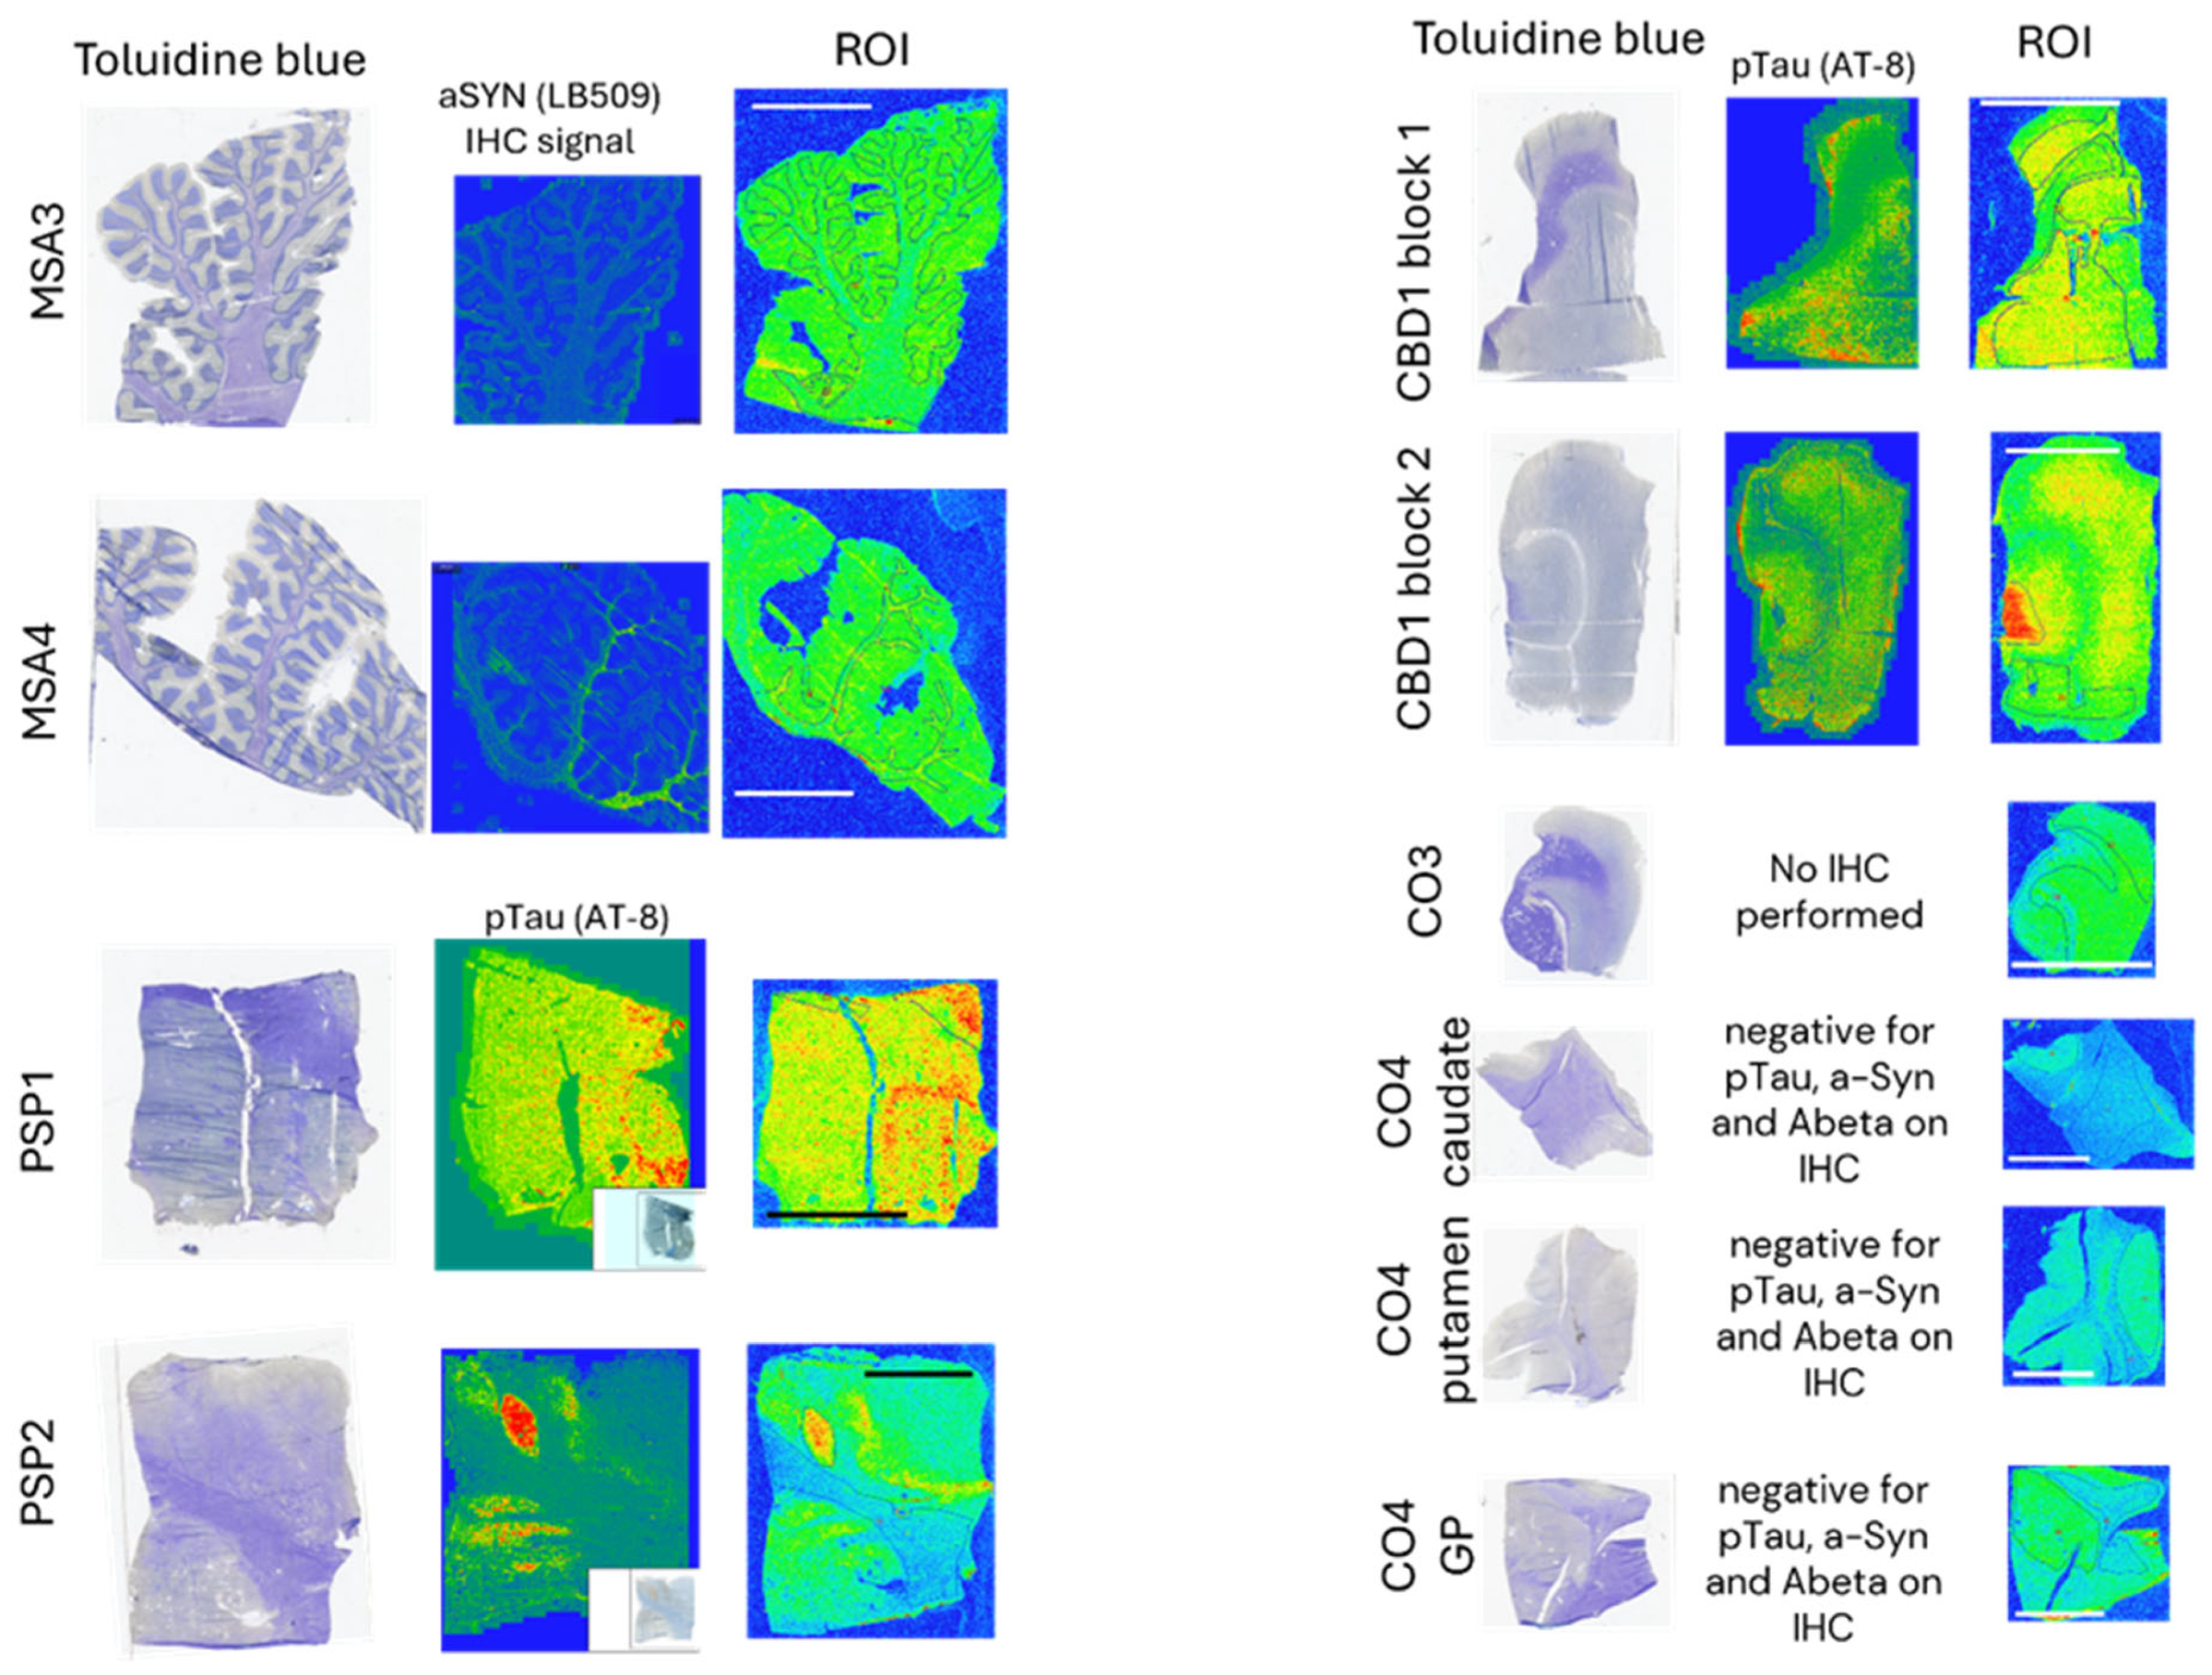
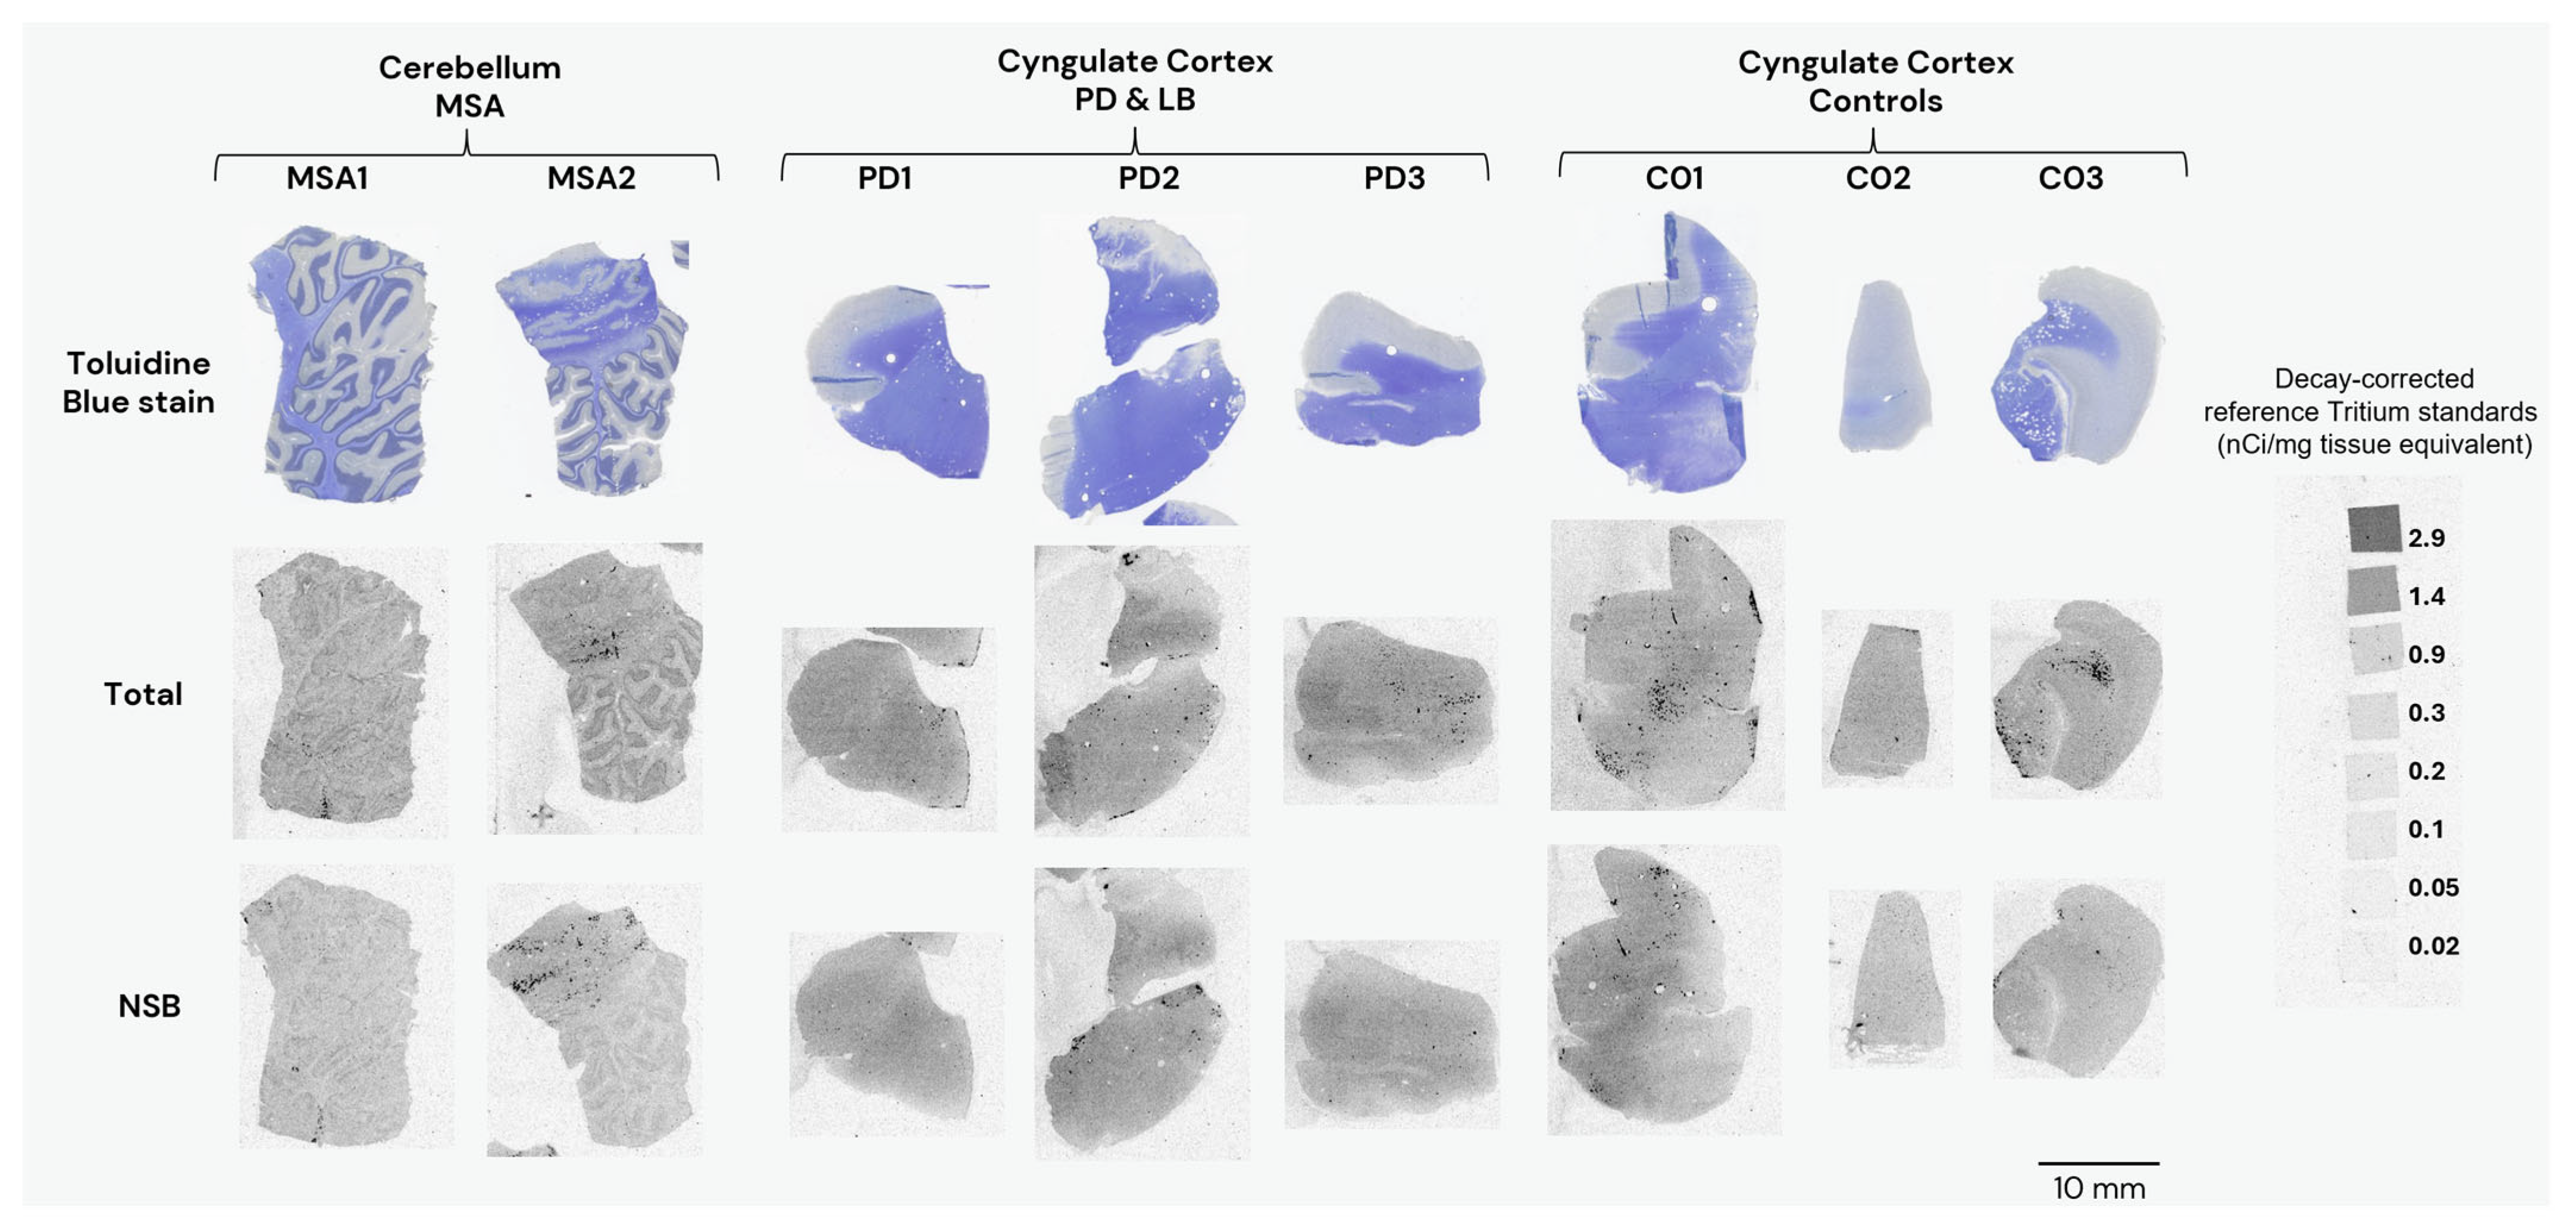
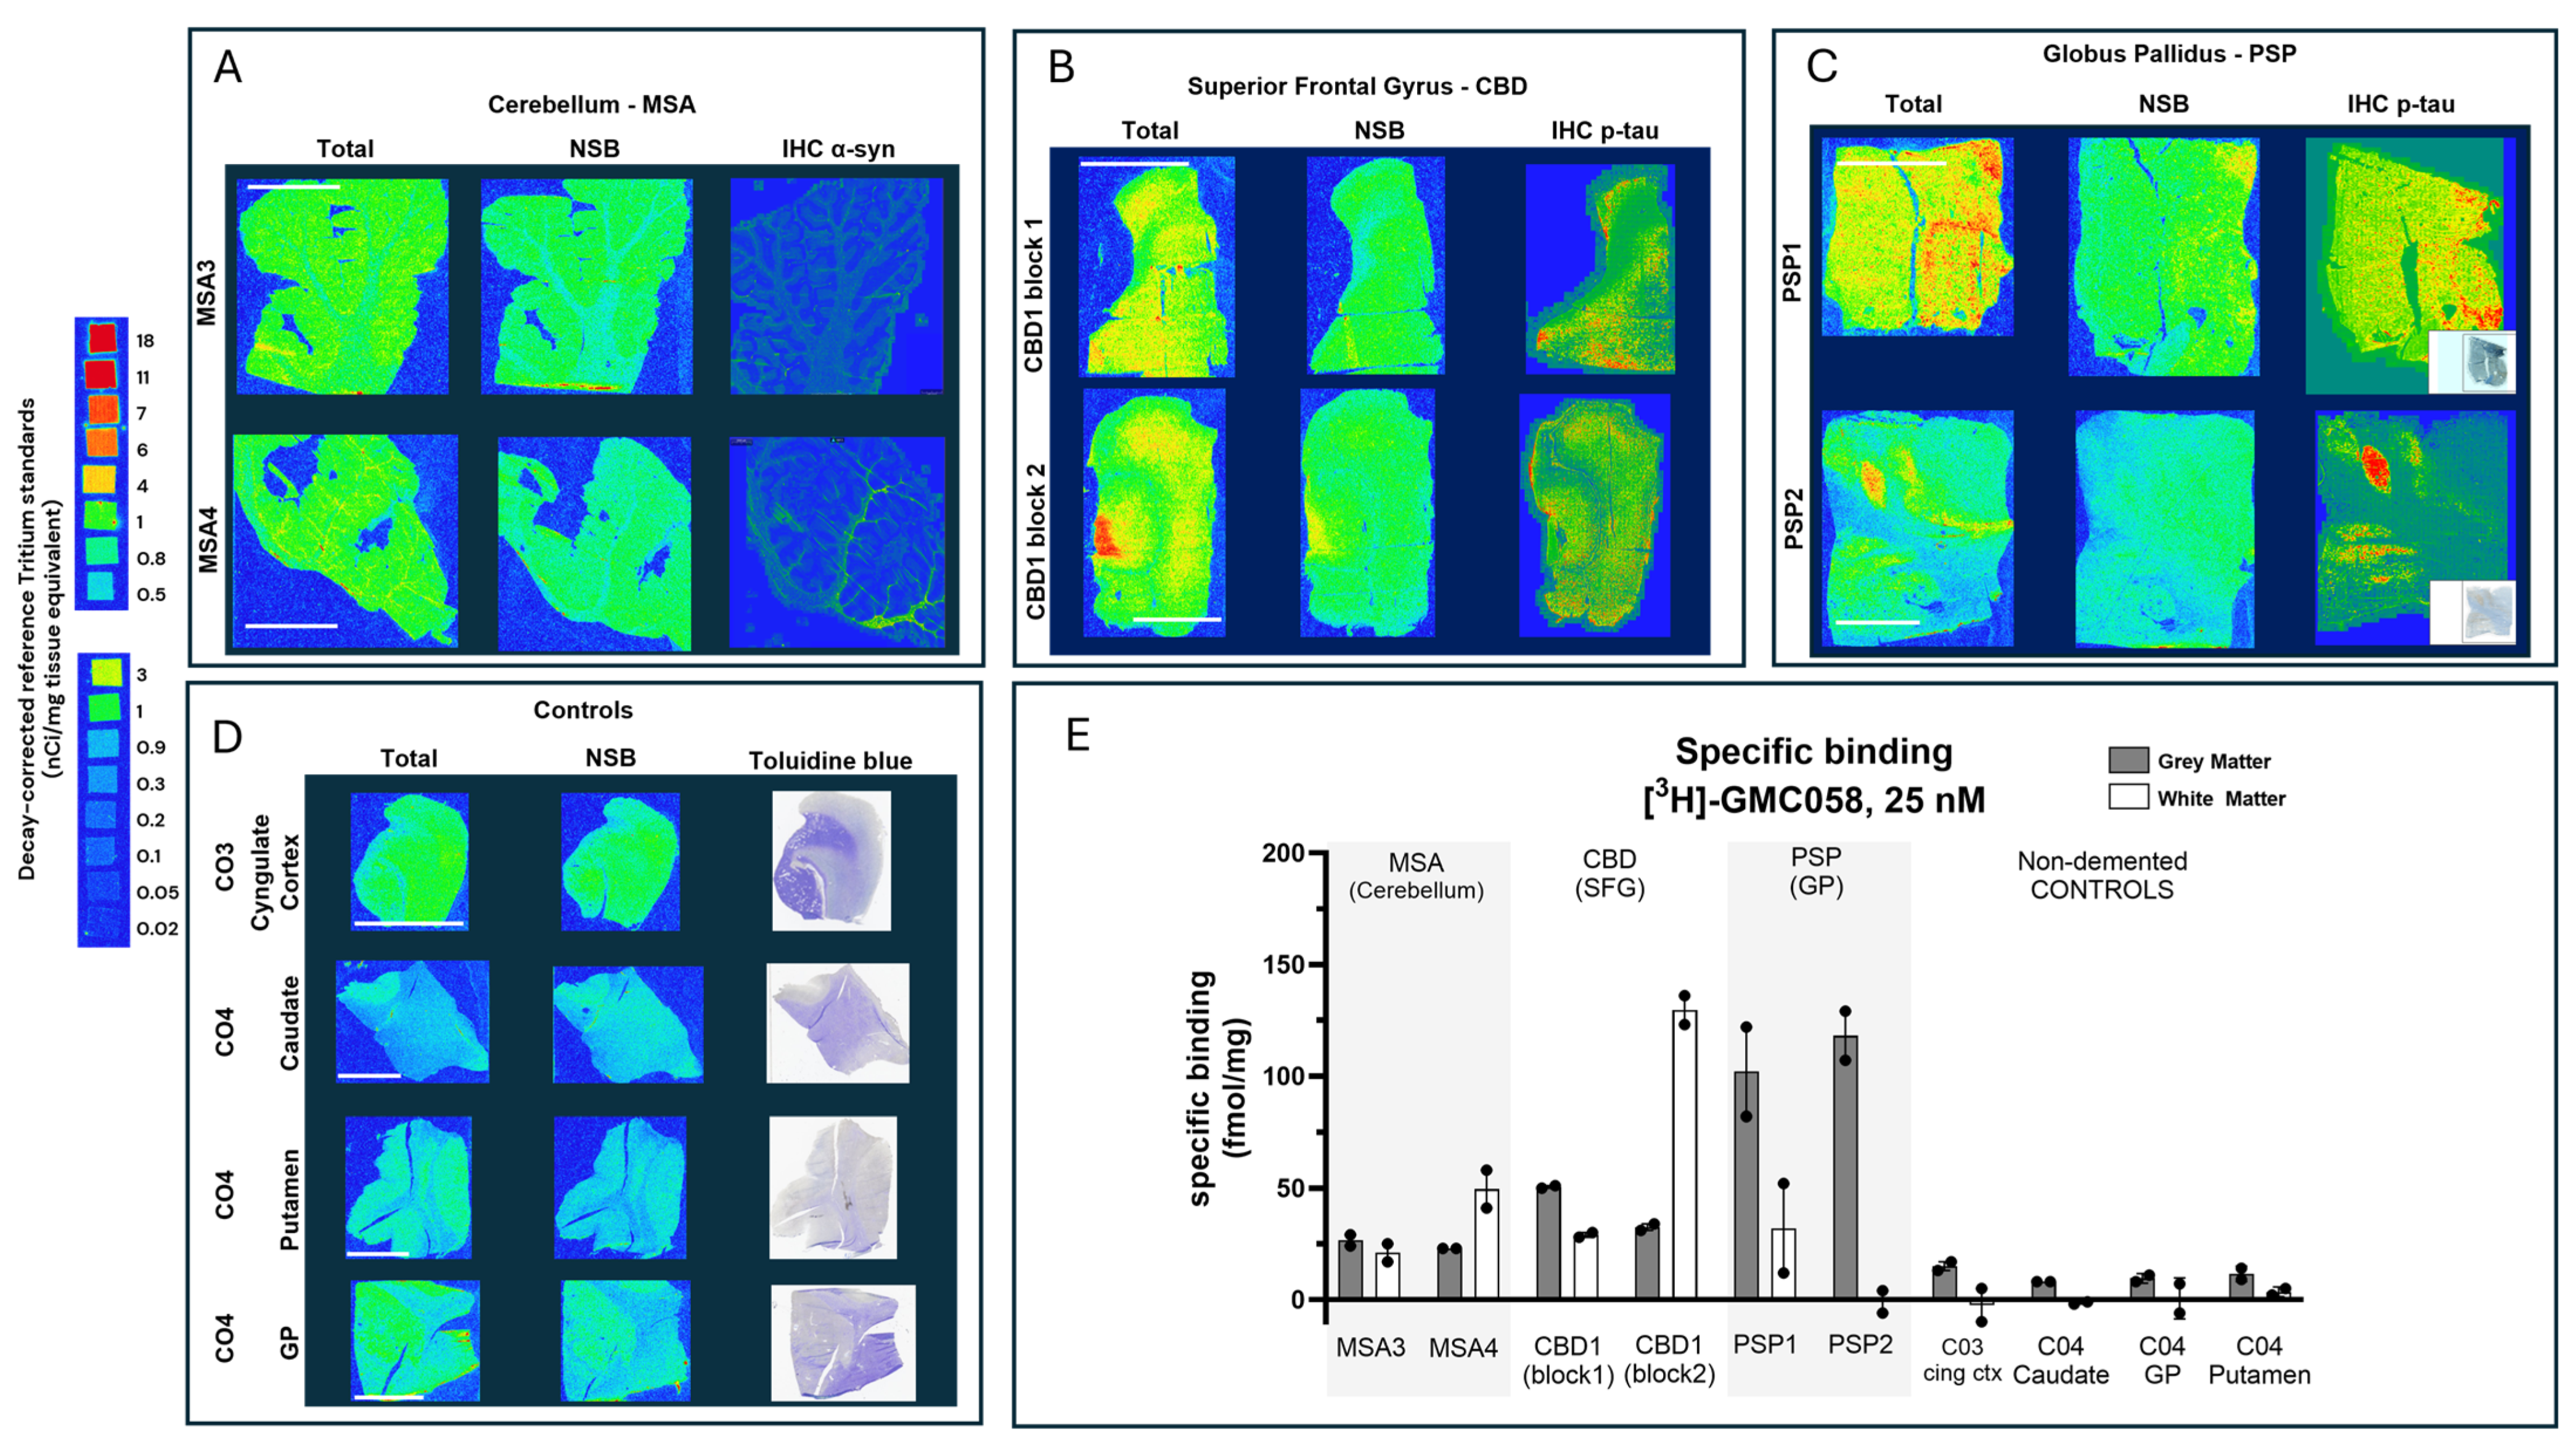
3.1.4. Autoradiography Experiments with [3H]GMC-058
4. Discussion
5. Conclusions
Author Contributions
Funding
Institutional Review Board Statement
Informed Consent Statement
Data Availability Statement
Acknowledgments
Conflicts of Interest
Abbreviations
| Aβ | amyloid beta |
| AD | Alzheimer’s disease |
| ARG | autoradiography |
| α-syn | α-synuclein |
| CAA | cerebral amyloid angiopathy |
| CBD | corticobasal degeneration |
| DLB | dementia with Lewy bodies |
| IHC | immunohistochemistry |
| LBD | Lewy-body disease |
| MSA | multiple-system atrophy |
| PD | Parkinson’s disease |
| PSP | progressive supranuclear palsy |
| TMA | tissue microarray |
Appendix A

| Case n. | Diagnosis | Age | Sex | PMI (h) | Brain Region | Aβ/pTau/α-syn * |
|---|---|---|---|---|---|---|
| S11/010 | Parkinson’s disease | 82 | M | 6.1 | Cingulate gyrus | −/+/+++ |
| S10/47 | Lewy-body disease | 76 | M | 6.3 | Hippocampus | +++/+++/+++ |
| S14/013 | Lewy-body disease | 68 | F | 4.6 | Hippocampus | +/+++/+++ |
| S13/054 | Dementia with Lewy bodies | 91 | F | 4.7 | Inferior parietal gyrus | +++/+/+++ |
| Multiple-system atrophy | 66 | M | 4.9 | Cerebellum | −/−/+++ | |
| S10/134 | Multiple-system atrophy | 65 | M | 4.75 | Cerebellum | −/−/+++ |
| S95/120 | Multiple-system atrophy | 69 | F | 4.5 | Cerebellum | −/−/+++ |
| S11/074 | Corticobasal degeneration | 63 | M | 6.5 | Superior frontal gyrus | −/+++/− |
| S98/105 | Corticobasal degeneration | 72 | M | 5.3 | Thalamus and subthalamic nucleus | −/+++/− |
| S11/085 | Corticobasal degeneration | 65 | F | 6 | Thalamus | −/+++/− |
| S13/064 | Progressive supranuclear palsy | 70 | M | 6.8 | Cerebellum | −/+++/− |
| S12/004 | Progressive supranuclear palsy | 65 | F | 5.8 | Cerebellum | −/+++/− |
| S12/083 | Cerebral amyloid angiopathy | 79 | M | 9.75 | Hippocampus | +++/+++/− |
| S98/071 | Cerebral amyloid angiopathy | 79 | M | 9.75 | Cerebellum | +++/−/− |
| S98/071 | Cerebral amyloid angiopathy | 79 | M | 9.75 | Parietal cortex | +++/+/+ |
| S98/071 | Non-dementia control | 78 | F | 7.17 | Cingulate gyrus | −/−/− |
| S14/029 | Non-dementia control | 51 | F | 7.7 | Cingulate gyrus | −/−/− |
| S94/325 | Non-dementia control | 63 | F | 6.4 | Cingulate gyrus | −/−/− |
| S95/258 | Non-dementia control | 56 | M | 5.4 | Cingulate gyrus | −/−/− |
| S98/235 | Non-dementia control | 56 | M | 5.4 | Medial temporal gyrus | −/−/− |
| S98/235 | Non-dementia control | 56 | M | 5.4 | Superior frontal gyrus | −/−/− |
| S98/235 | Alzheimer’s disease | 85 | M | 4.6 | Inferior frontal gyrus | +++/+++ |
| M05/340 | Alzheimer’s disease | 67 | F | 5.8 | Hippocampus | +++/+++ |
| M05/332 | Alzheimer’s disease | 88 | F | 5.2 | Hippocampus | +++/+++ |
| M05/331 | Alzheimer’s disease | 84 | F | 5.9 | Hippocampus | +++/+++ |
| M05/327 | Parkinson’s disease | 98 | M | 5.7 | Substantia nigra | −/+/+++ |
| S09/252 | Parkinson’s disease | 78 | M | 5.8 | Substantia nigra | −/+/+++ |
| S13/059 | Parkinson’s disease | 86 | M | 4.2 | Substantia nigra | +/−/+++ |
| S13/077 | Parkinson’s disease | 57 | M | 6.6 | Substantia nigra | −/−/+++ |
| S17/055 | Parkinson’s disease | 87 | F | 7.9 | Substantia nigra | −/−/+++ |
| S17/056 | Parkinson’s disease | 90 | F | 5.3 | Substantia nigra | −/+/+++ |
| S17/101 | Parkinson’s disease | 85 | F | 5.2 | Substantia nigra | +/+/+++ |
| S17/162 | Parkinson’s disease | 82 | M | 6.1 | Cingulate gyrus | Aβ/pTau/α-syn * |
| Diagnosis | Sex(M/F) | Age (years) | PMT (h) | ApoE | A | B | C | Region Sampled |
|---|---|---|---|---|---|---|---|---|
| AD | F | 88 | 4 | 34 | 3 | 3 | 3 | MFG |
| AD | F | 67 | 3 | 34 | 3 | 3 | 3 | MFG |
| AD | F | 81 | 8 | 34 | 3 | 3 | 3 | MFG |
| AD | M | 61 | 6 | 33 | 3 | 3 | 3 | MFG |
| AD | M | 62 | 3 | 33 | 3 | 3 | 3 | MFG |
| AD | M | 84 | 7 | 44 | 3 | 3 | 3 | MFG |
| Control | M | 44 | 14.2 | n/a | 0 | 0 | 0 | prefrontal, occipital, temporal, parietal. |
| Diagnosis | Sex(M/F) | Age (years) | PMT (h) | Abeta Pathology: | Tau Pathology: Specific Tau Lesions | Region Sampled |
|---|---|---|---|---|---|---|
| PSP | M | 63 | 4.4 | n/a | Neuronal and glial inclusions, tufted astrocytes | L-SFG |
| PSP | F | 70 | 7.2 | n/a | Neuronal and glial inclusions, tufted astrocytes | L-SFG |
| PSP | M | 68 | 10.1 | n/a | Neuronal and glial inclusions, tufted astrocytes | R-SFG |
| CBD | M | 68 | 7.4 | 0 | Neuronal and glial inclusions, astrocytic plaques | R-M/IFG(A) |
| CBD | F | 70 | 7.4 | 0 | Neuronal and glial inclusions, astrocytic plaques | R-M/IFG(A) |
| CBD | F | 63 | 5.0 | 0 | Neuronal and glial inclusions, astrocytic plaques | R-M/IFG(A) |
| Diagnosis | Sex(M/F) | Age (years) | PMT | LB Stage |
|---|---|---|---|---|
| PD | M | 81 | 2.5 | lll. Brainstem/Limbic |
| PDD | M | 70 | 1.83 | lll. Brainstem/Limbic |
| PDD | M | 75 | 2.25 | lV. Neocortical |
| PD | M | 75 | 2.33 | lV. Neocortical |
| MSA-P | F | 57 | 32 | n/a. |
| MSA-P | M | 58 | 12 | n/a |
| Structure | Name | Molecular Weight | XLogP | α-syn (Ki, nM) | Aβ (Ki, nM) | Tau-NFT (Ki, nM) |
|---|---|---|---|---|---|---|
 | GMC013_FR-1 | 397.5 | 3.37 | 25.5 | 63 | 151 |
 | GMC015 | 413.5 | 3.26 | 28.3 | 294 | 761 |
 | GMC021 | 442.3 | 2.63 | 22.2 | 889 | 2510 |
 | GMC023 | 427.5 | 2.86 | 21.2 | 151 | 44 |
 | GMC024 | 427.5 | 2.86 | 25.3 | 81 | 68 |
 | GMC025 | 427.5 | 2.86 | 29.7 | 141 | 50 |
 | GMC044 | 411.5 | 3.32 | 25.2 | 3440 | 692 |
 | GMC045 | 402.5 | 3.15 | 24.7 | 412 | 239 |
 | GMC058 | 367.5 | 3.49 | 22.5 | 1490 | 1320 |
 | GMC070 | 403.5 | 2.64 | 6.8 | 64 | 90 |
 | GMC071 | 428.5 | 2.36 | 14.2 | 8180 | 86 |
 | GMC073 | 445.5 | 3.37 | 8.0 | 2630 | 248 |
 | GMC079 | 420.5 | 3.24 | 23.9 | 404 | 2510 |
 | GMC086 | 444.5 | 3.87 | 15.2 | 809 | 26 |
 | GMC095 | 438.5 | 2.98 | 14.5 | 2630 | 2510 |
 | GMC096 | 442.5 | 4.13 | 6.5 | 51 | 2510 |
 | GMC098 | 442.5 | 4.13 | 9.7 | 226 | 805 |
| [3H]GMC-058 | [3H]GMC-073 | [3H]GMC-098 | ||||||||||
|---|---|---|---|---|---|---|---|---|---|---|---|---|
| 25 nM | 50 nM | 10 nM | 20 nM | 10 nM | 20 nM | |||||||
| Total | NSB | Total | NSB | Total | NSB | Total | NSB | Total | NSB | Total | NSB | |
| Average (fmol/mg) ± SEM | 57.6 ± 1.8 | 37.6 ± 3.8 | 114.1 ± 9.3 | 74.6 ± 4.1 | 664.6 ± 24.3 | 346.9 ± 14.5 | 1870 ± 100.2 | 1022 ± 45 | 2705 ± 62.2 | 1878 ± 74.1 | 5146 ± 386.2 | 2336 ± 48.5 |
| Total minus NSB (fmol/mg) | 20 | 40 | 318 | 848 | 827 | 2810 | ||||||
| Binding in fmol/mg | |||||
|---|---|---|---|---|---|
| Condition | Cases | ROI | Total | NSB (5 µM GMC044) | Total Minus NSB |
| Non-dementia control (cingulate gyrus) | C01 | GM | 56.8 | 60.3 | −3.5 |
| WM | 56.9 | 59.8 | −2.9 | ||
| C02 | GM | 44.3 | 24.6 | 19.8 | |
| WM | 45.3 | 31.8 | 13.6 | ||
| C03 | GM | 45.3 | 28.6 | 16.7 | |
| WM | 48.7 | 39.0 | 9.7 | ||
| MSA (cerebellum) | MSA1 | GM | 46.9 | 27.4 | 19.5 |
| WM | 50.1 | 33.3 | 16.8 | ||
| MSA2 | GM | 30.3 | 19.9 | 10.3 | |
| WM | 52.5 | 27.7 | 24.8 | ||
| PD (cingulate gyrus) | PD1 | GM | 55.6 | 42.3 | 13.3 |
| WM | 52.5 | 50.6 | 1.9 | ||
| PD2 | GM | 16.2 | 17.1 | −0.9 | |
| WM | 55.4 | 53.7 | 1.6 | ||
| PD3 | GM | 59.3 | 42.0 | 17.2 | |
| WM | 55.4 | 47.1 | 8.3 |
| Specific Binding (fmol/mg Tissue Equivalent) | ||||
|---|---|---|---|---|
| Region | ||||
| Pathology | Case | Regions | WM | GM |
| MSA | MSA3 | Cerebellum | 21 | 26 |
| MSA4 | 49 | 23 | ||
| CBD | CBD1 block 1 | SFG | 29 | 50 |
| CBD1 block 2 | 130 | 32 | ||
| PSP | PSP1 | GP | 32 | 102 |
| PSP2 | −1 | 118 | ||
| NDE | C03 | Cingulate cortex | −2 | 15 |
| C04 | Caudate | −1 | 8 | |
| C04 | Globus Pallidus | 0 | 10 | |
| Co4 | Putamen | 4 | 12 | |
Appendix B


References
- McCann, H.; Stevens, C.H.; Cartwright, H.; Halliday, G.M. α-Synucleinopathy phenotypes. Parkinsonism Relat. Disord. 2014, 20 (Suppl. S1), S62–S67. [Google Scholar] [CrossRef] [PubMed]
- Höglinger, G.U.; Adler, C.H.; Berg, D.; Klein, C.; Outeiro, T.F.; Poewe, W.; Postuma, R.; Stoessl, A.J.; Lang, A.E. A biological classification of Parkinson’s disease: The SynNeurGe research diagnostic criteria. Lancet Neurol. 2024, 23, 191–204, ISSN 1474-4422. [Google Scholar] [CrossRef] [PubMed]
- Papp, M.I.; Kahn, J.E.; Lantos, P.L. Glial cytoplasmic inclusions in the CNS of patients with multiple system atrophy (striatonigral degeneration, olivopontocerebellar atrophy and Shy-Drager syndrome. J. Neurol. Sci. 1989, 94, 79–100. [Google Scholar] [CrossRef] [PubMed]
- Smith, R.; Capotosti, F.; Schain, M.; Ohlsson, T.; Vokali, E.; Molette, J.; Touilloux, T.; Hliva, V.; Dimitrakopoulos, I.K.; Puschmann, A.; et al. The α-synuclein PET tracer [18F] ACI-12589 distinguishes multiple system atrophy from other neurodegenerative diseases. Nat. Commun. 2023, 14, 6750. [Google Scholar] [CrossRef]
- Matsuoka, K.; Ono, M.; Takado, Y.; Hirata, K.; Endo, H.; Ohfusa, T.; Kojima, T.; Yamamoto, T.; Onishi, T.; Orihara, A.; et al. High-Contrast Imaging of α-Synuclein Pathologies in Living Patients with Multiple System Atrophy. Mov. Disord. 2022, 37, 2159–2161. [Google Scholar] [CrossRef] [PubMed]
- Endo, H.; Ono, M.; Takado, Y.; Matsuoka, K.; Takahashi, M.; Tagai, K.; Kataoka, Y.; Hirata, K.; Takahata, K.; Seki, C.; et al. Imaging α-synuclein pathologies in animal models and patients with Parkinson’s and related diseases. Neuron 2024, 112, 2540–2557. [Google Scholar] [CrossRef] [PubMed]
- Bousset, L.; Pieri, L.; Ruiz-Arlandis, G.; Gath, J.; Jensen, P.H.; Habenstein, B.; Madiona, K.; Olieric, V.; Böckmann, A.; Meier, B.H.; et al. Structural and functional characterization of two alpha-synuclein strains. Nat. Commun. 2013, 4, 2575. [Google Scholar] [CrossRef]
- Gruber, C.C.; Oberdorfer, G.; Voss, C.V.; Kremsner, J.M.; Kappe, C.O.; Kroutil, W. An Algorithm for the Deconvolution of Mass Spectroscopic Patterns in Isotope Labeling Studies. Evaluation for the Hydrogen-Deuterium Exchange Reaction in Ketones. J. Org. Chem. 2007, 72, 5778–5783. [Google Scholar] [CrossRef]
- Hostetler, E.D.; Walji, A.M.; Zeng, Z.; Miller, P.; Bennacef, I.; Salinas, C.; Connolly, B.; Gantert, L.; Haley, H.; Holahan, M.; et al. Preclinical characterization of 18F-MK-6240, a promising positron emission tomography (PET) tracer for in vivo quantification of human neurofibrillary tangles (NFTs). J. Nucl. Med. 2016, 57, 1599–1606. [Google Scholar] [CrossRef]
- Klunk, W.E.; Wang, Y.; Huang, G.F.; Debnath, M.L.; Holt, D.P.; Shao, L.; Hamilton, R.L.; Ikonomovic, M.D.; DeKosky, S.T.; Mathis, C.A. The binding of 2-(4′-methylaminophenyl)benzothiazole to postmortem brain homogenates is dominated by the amyloid component. J. Neurosci. 2003, 23, 2086–2092. [Google Scholar] [CrossRef]
- Zhang, W.; Arteaga, J.; Cashion, D.K.; Chen, G.; Gangadharmath, U.; Gomez, L.F.; Kasi, D.; Lam, C.; Liang, Q.; Liu, C.; et al. A highly selective and specific PET tracer for imaging of tau pathologies. J. Alzheimers Dis. 2012, 31, 601–612. [Google Scholar] [CrossRef] [PubMed]
- Bagchi, D.P.; Yu, L.; Perlmutter, J.S.; Xu, J.; Mach, R.H.; Tu, Z.; Kotzbauer, P.T. Binding of the radioligand SIL23 to α-synuclein fibrils in Parkinson disease brain tissue establishes feasibility and screening approaches for developing a Parkinson disease imaging agent. PLoS ONE 2013, 8, e55031. [Google Scholar] [CrossRef] [PubMed] [PubMed Central]
- Stehouwer, J.S.; Huang, G.; Guarino, D.S.; Debnath, M.L.; Polu, A.; Geib, S.J.; Lopresti, B.; Ikonomovic, M.D.; Mason, N.; Mach, R.H.; et al. Structure-Activity Relationships and Evaluation of 2-(Heteroaryl-cycloalkyl)-1H-indoles as Tauopathy Positron Emission Tomography Radiotracers. J. Med. Chem. 2025, 68, 6462–6492. [Google Scholar] [CrossRef] [PubMed] [PubMed Central]
- Miranda-Azpiazu, P.; Svedberg, M.; Higuchi, M.; Ono, M.; Jia, Z.; Sunnemark, D.; Elmore, C.S.; Schou, M.; Varrone, A. Identification and in vitro characterization of C05-01, a PBB3 derivative with improved affinity for alpha-synuclein. Brain Res. 2020, 1749, 147131. [Google Scholar] [CrossRef] [PubMed]
- Lund, H.; Cowburn, R.F.; Gustafsson, E.; Strömberg, K.; Svensson, A.; Dahllund, L.; Malinowsky, D.; Sunnemark, D. TTBK1 in Alzheimer’s Disease Brain. Brain Pathol. 2012, 23, 378–389. [Google Scholar] [CrossRef]
- Aguero, C.; Dhaynaut, M.; Amaral, A.C.; Moon, S.-H.; Neelamegam, R.; Scapellato, M.; Carazo-Casas, C.; Kumar, S.; El Fakhri, G.; Johnson, K.; et al. Head-to-head comparison of [18F]-Flortaucipir, [18F]-MK-6240 and [18F]-PI-2620 postmortem binding across the spectrum of neurodegenerative diseases. Acta Neuropathol. 2024, 147, 25. [Google Scholar] [CrossRef] [PubMed] [PubMed Central]
- Mueller, A.; Bullich, S.; Barret, O.; Madonia, J.; Berndt, M.; Papin, C.; Perrotin, A.; Koglin, N.; Kroth, H.; Pfeifer, A.; et al. Tau PET imaging with 18F-PI-2620 in Patients with Alzheimer Disease and Healthy Controls: A First-in-Humans Study. J. Nucl. Med. 2020, 61, 911–919. [Google Scholar] [CrossRef] [PubMed] [PubMed Central]
- Tagai, K.; Ono, M.; Kubota, M.; Kitamura, S.; Takahata, K.; Seki, C.; Takado, Y.; Shinotoh, H.; Sano, Y.; Yamamoto, Y.; et al. High-Contrast In Vivo Imaging of Tau Pathologies in Alzheimer’s and Non-Alzheimer’s Disease Tauopathies. Neuron 2021, 109, 42–58.e8. [Google Scholar] [CrossRef] [PubMed]
- Brendel, M.; Barthel, H.; Van Eimeren, T.; Marek, K.; Beyer, L.; Song, M.; Palleis, C.; Gehmeyr, M.; Fietzek, U.; Respondek, G.; et al. Assessment of 18F-PI-2620 as a Biomarker in Progressive Supranuclear Palsy. JAMA Neurol. 2020, 77, 1408–1419, Erratum in JAMA Neurol. 2020, 77, 1453. [Google Scholar] [CrossRef] [PubMed] [PubMed Central]
- Li, L.; Liu, F.; Li, M.; Lu, J.; Sun, Y.; Liang, X.; Bao, W.; Chen, Q.; Li, X.; Zhou, X.; et al. Clinical utility of 18F-APN-1607 tau PET imaging in patients with progressive supranuclear palsy. Mov. Disord. 2021, 36, 2314–2323. [Google Scholar] [CrossRef]
- Lindberg, A.; Murrell, E.; Tong, J.; Mason, N.S.; Sohn, D.; Sandell, J.; Ström, P.; Stehouwer, J.S.; Lopresti, B.J.; Viklund, J.; et al. Ligand-based design of [18F]OXD-2314 for PET imaging in non-Alzheimer’s disease tauopathies. Nat. Commun. 2024, 15, 5109. [Google Scholar] [CrossRef] [PubMed] [PubMed Central]
- Kim, H.Y.; Chia, W.K.; Hsieh, C.-J.; Saturnino Guarino, D.; Graham, T.J.A.; Lengyel-Zhand, Z.; Schneider, M.; Tomita, C.; Lougee, M.G.; Kim, H.J.; et al. A Novel Brain PET Radiotracer for Imaging Alpha Synuclein Fibrils in Multiple System Atrophy. J. Med. Chem. 2023, 66, 12185–12202. [Google Scholar] [CrossRef] [PubMed]
- Shriver, D.F.; Drezdzon, M.A. The Manipulation of Air-Sensitive Compounds; John Wiley and Sons, Inc.: New York, NY, USA, 1986; p. 104. ISBN 978-0-471-86773-9. [Google Scholar]


| Radioligand | IC50 or KD | Synucleinopathies Evaluated ** | ||
|---|---|---|---|---|
| α-syn | Aβ | pTau | ||
| [18F]ACI-12589 | 33.5 ± 17.4 nM (sporadic PD); 28 nM (MSA) | 317 nM (AD) | PD ***, MSA (+), DLB | |
| [18F]SPAL-T-06 | 2.5 nM (MSA) | Not reported | MSA (+) | |
| [18F]C05-05 | IC50 *: 1.5 nM (DLB); | IC50 * in AD tissue: 12.9 nM | PD/DLB (+) and MSA (+) | |
| Case n. | Diagnosis | Age | Sex | PMI (h) | Brain Region |
|---|---|---|---|---|---|
| PD1 | Parkinson’s disease | 69 | M | 7 | Cingulate gyrus |
| PD2 | Parkinson’s disease | 77 | M | 5 | Cingulate gyrus |
| PD3 | Parkinson’s disease | 75 | M | 6 | Cingulate gyrus |
| LBV1 | Lewy-bodies variant | 83 | M | 5 | Cingulate gyrus |
| LBV2 | Lewy-bodies variant | 54 | M | 5 | Cingulate gyrus |
| MSA1 | Multi-system atrophy | 66 | M | 5 | Cerebellum |
| MSA2 | Multi-system atrophy | 69 | F | 5 | Cerebellum |
| CBD1 | Corticobasal degeneration | 58 | F | 7 | Superior frontal gyrus |
| C01 | Non-dementia control | 81 | F | 4 | Cingulate gyrus |
| C02 | Non-dementia control | 51 | M | 8 | Cingulate gyrus |
| C03 | Non-dementia control | 79 | F | 11 | Cingulate gyrus |
| Case n. | Diagnosis | Age | Sex | PMI (h) | Brain Region |
|---|---|---|---|---|---|
| MSA3 | Multiple-system atrophy | 58 | F | 10 | Cerebellum |
| MSA4 | Multiple-system atrophy—cerebellar form | 52 | M | 33 | Cerebellum |
| PSP1 | Progressive supranuclear palsy | 66 | M | 8 | Globus pallidus |
| PSP2 | Progressive supranuclear palsy | 77 | F | 11 | Globus pallidus |
| C04 | Control | 68 | M | 7.5 | Caudate, putamen and globus pallidus |
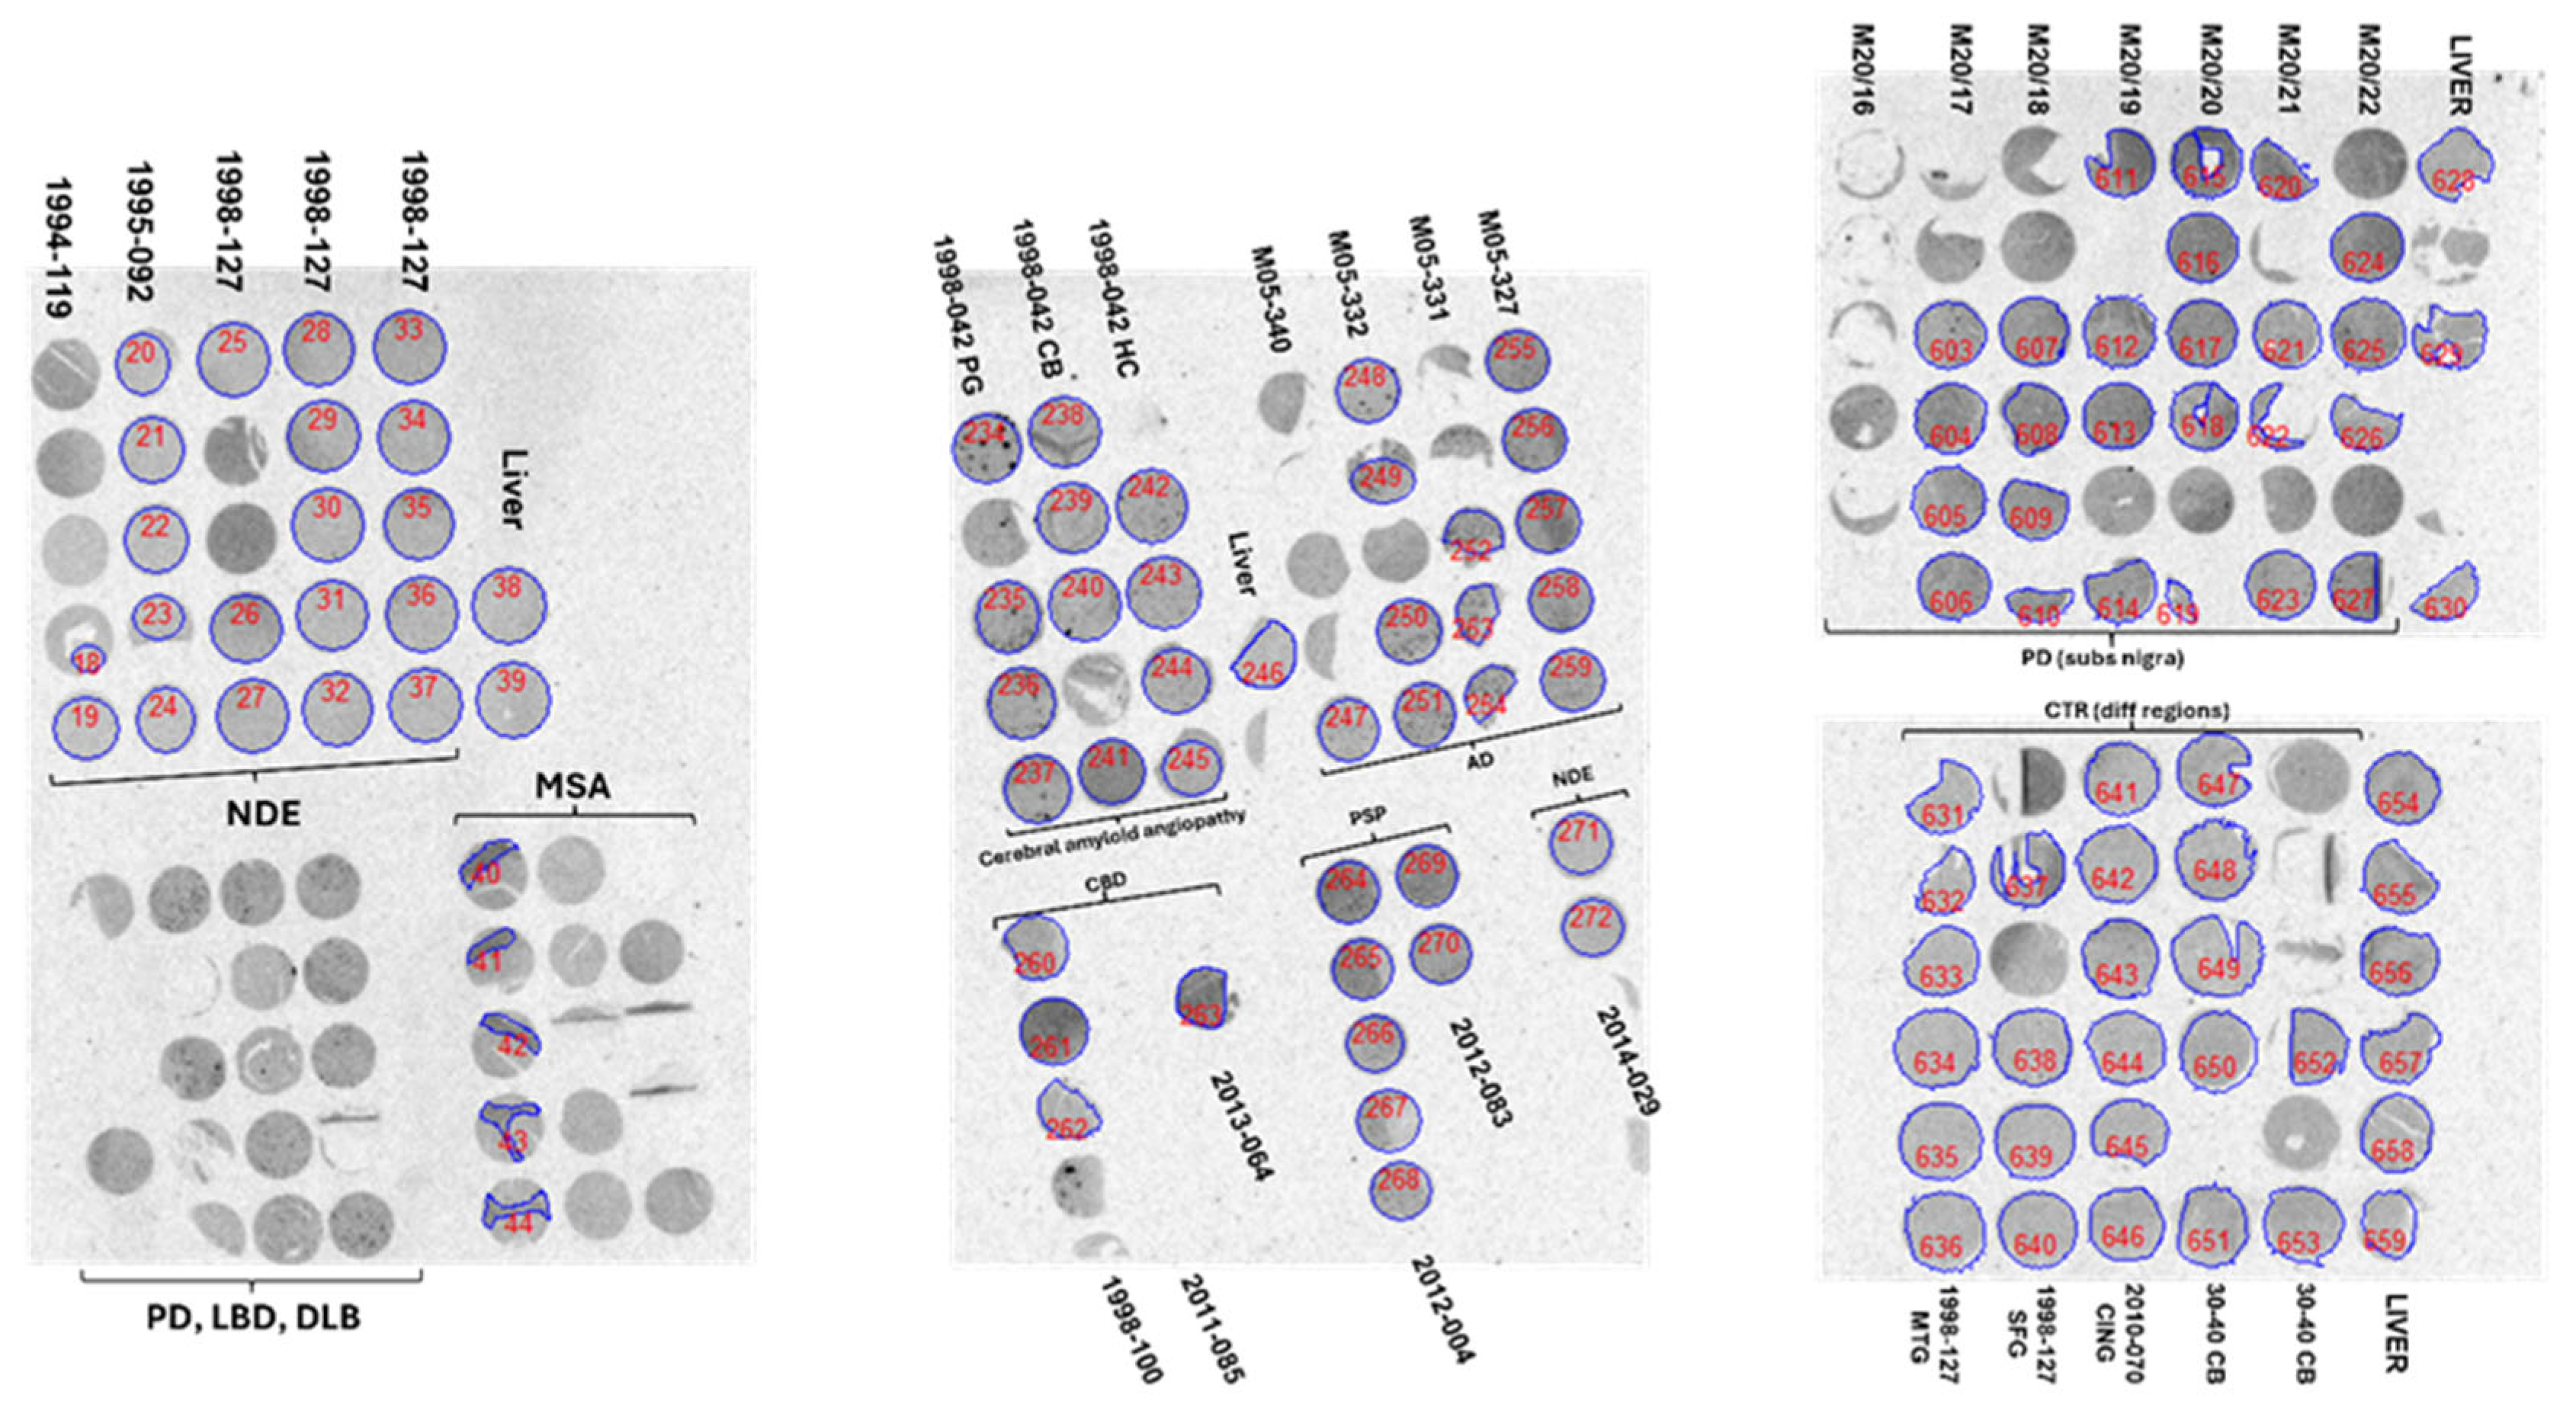
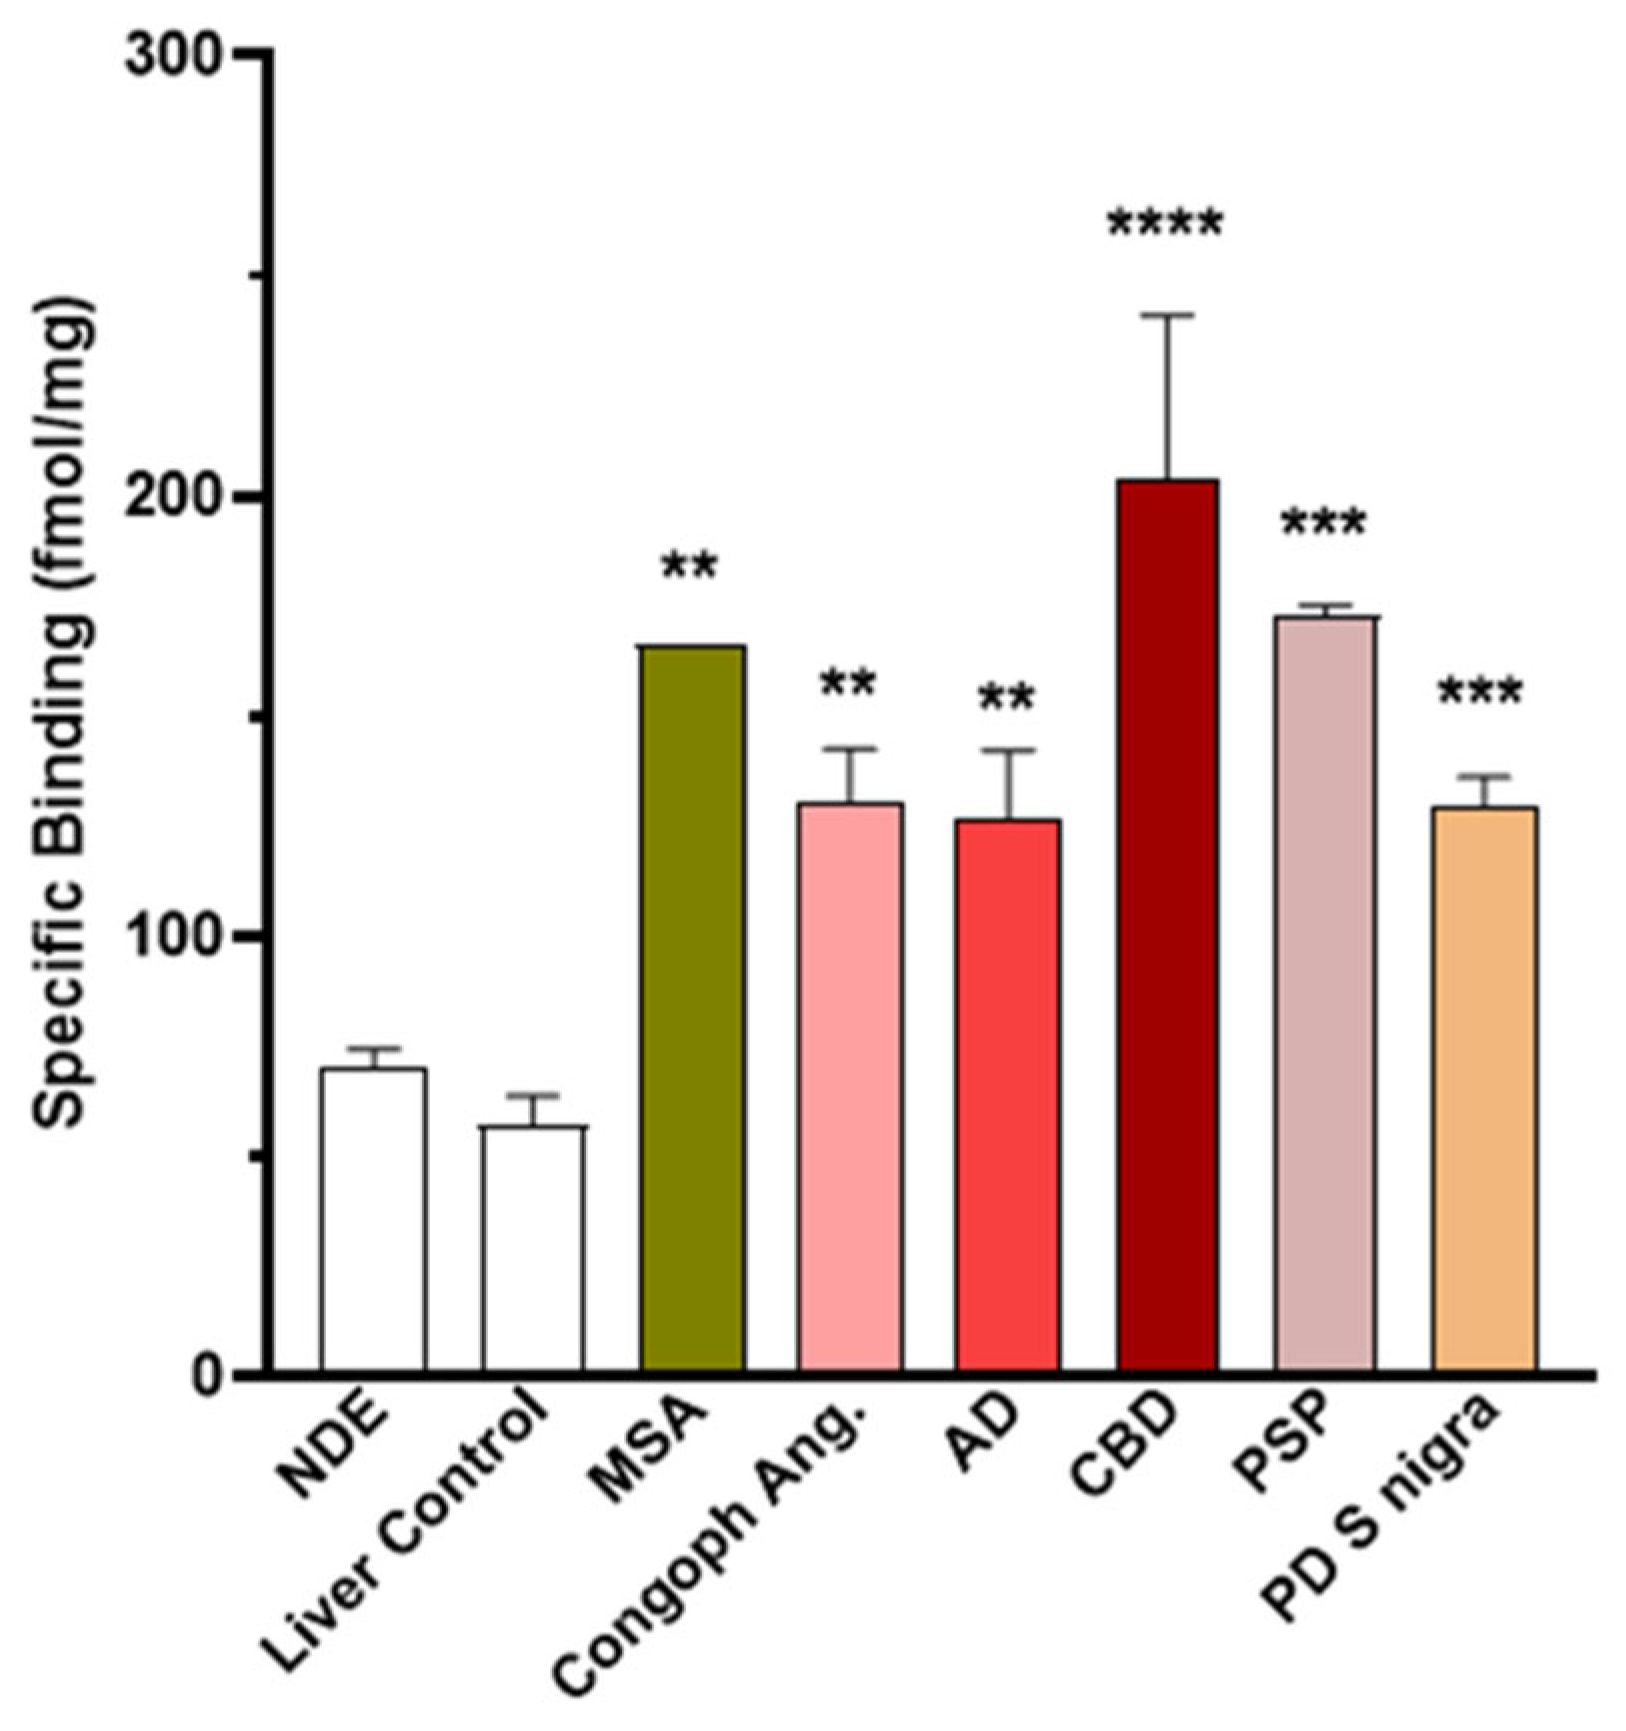
| TMAs | NDE | Liver Control | MSA | CAA | AD | CBD | PSP | PD |
|---|---|---|---|---|---|---|---|---|
| N= | 8 | 4 | 1 | 3 | 4 | 2 | 2 | 6 |
| Mean (±SEM) | 70 | 57 | 166 ** | 131 ** | 127 ** | 204 *** | 173 *** | 129 *** |
| (4) | (7) | (19) † | (12) | (15) | (38) | (2) | (7) |
Disclaimer/Publisher’s Note: The statements, opinions and data contained in all publications are solely those of the individual author(s) and contributor(s) and not of MDPI and/or the editor(s). MDPI and/or the editor(s) disclaim responsibility for any injury to people or property resulting from any ideas, methods, instructions or products referred to in the content. |
© 2025 by the authors. Licensee MDPI, Basel, Switzerland. This article is an open access article distributed under the terms and conditions of the Creative Commons Attribution (CC BY) license (https://creativecommons.org/licenses/by/4.0/).
Share and Cite
Varrone, A.; Sousa, V.C.; Mugnaini, M.; Biesinger, S.; Nordvall, G.; Kingston, L.; Guzzetti, I.; Elmore, C.S.; Sunnemark, D.; Saturnino Guarino, D.; et al. Development and In Vitro Characterization of [3H]GMC-058 as Radioligand for Imaging Parkinsonian-Related Proteinopathies. Cells 2025, 14, 869. https://doi.org/10.3390/cells14120869
Varrone A, Sousa VC, Mugnaini M, Biesinger S, Nordvall G, Kingston L, Guzzetti I, Elmore CS, Sunnemark D, Saturnino Guarino D, et al. Development and In Vitro Characterization of [3H]GMC-058 as Radioligand for Imaging Parkinsonian-Related Proteinopathies. Cells. 2025; 14(12):869. https://doi.org/10.3390/cells14120869
Chicago/Turabian StyleVarrone, Andrea, Vasco C. Sousa, Manolo Mugnaini, Sandra Biesinger, Gunnar Nordvall, Lee Kingston, Ileana Guzzetti, Charles S. Elmore, Dan Sunnemark, Dinahlee Saturnino Guarino, and et al. 2025. "Development and In Vitro Characterization of [3H]GMC-058 as Radioligand for Imaging Parkinsonian-Related Proteinopathies" Cells 14, no. 12: 869. https://doi.org/10.3390/cells14120869
APA StyleVarrone, A., Sousa, V. C., Mugnaini, M., Biesinger, S., Nordvall, G., Kingston, L., Guzzetti, I., Elmore, C. S., Sunnemark, D., Saturnino Guarino, D., Finnema, S. J., & Schou, M. (2025). Development and In Vitro Characterization of [3H]GMC-058 as Radioligand for Imaging Parkinsonian-Related Proteinopathies. Cells, 14(12), 869. https://doi.org/10.3390/cells14120869