

Proteoglycan SPOCK1 as a Poor Prognostic Marker Promotes Malignant Progression of Clear Cell Renal Cell Carcinoma via Triggering the Snail/Slug-MMP-2 Axis-Mediated Epithelial-to-Mesenchymal Transition


 ,
,  ,
,
Abstract
1. Introduction
2. Materials and Methods
2.1. Materials
2.2. Cell Lines and Cell Culture
2.3. Bioinformatics Analysis
2.4. Immunohistochemical (IHC) Staining
2.5. Cell Extract Preparation and Western Blot Analysis
2.6. Transwell Migration and Invasion Assays
2.7. Lentiviral Production and Infection of ccRCC Cells
2.8. Cell Viability and Colony-Formation Assays
2.9. Gene Set Enrichment Analysis (GSEA)
2.10. Transient Transfection of DNA
2.11. Gelatin Zymography
2.12. MMP-2 Promoter-Driven Luciferase Assays
2.13. Real-Time Reverse-Transcription Quantitative Polymerase Chain Reaction (RT-qPCR)
2.14. In Vivo Orthotopic ccRCC Xenograft Model
2.15. Statistical Analysis
3. Results
3.1. SPOCK1 Transcripts and Protein Were Significantly Higher in ccRCC Tumor Tissues and Were Correlated with Advanced Stages, Larger Tumor Sizes, Tumor Metastases, and Poor Patient Prognoses
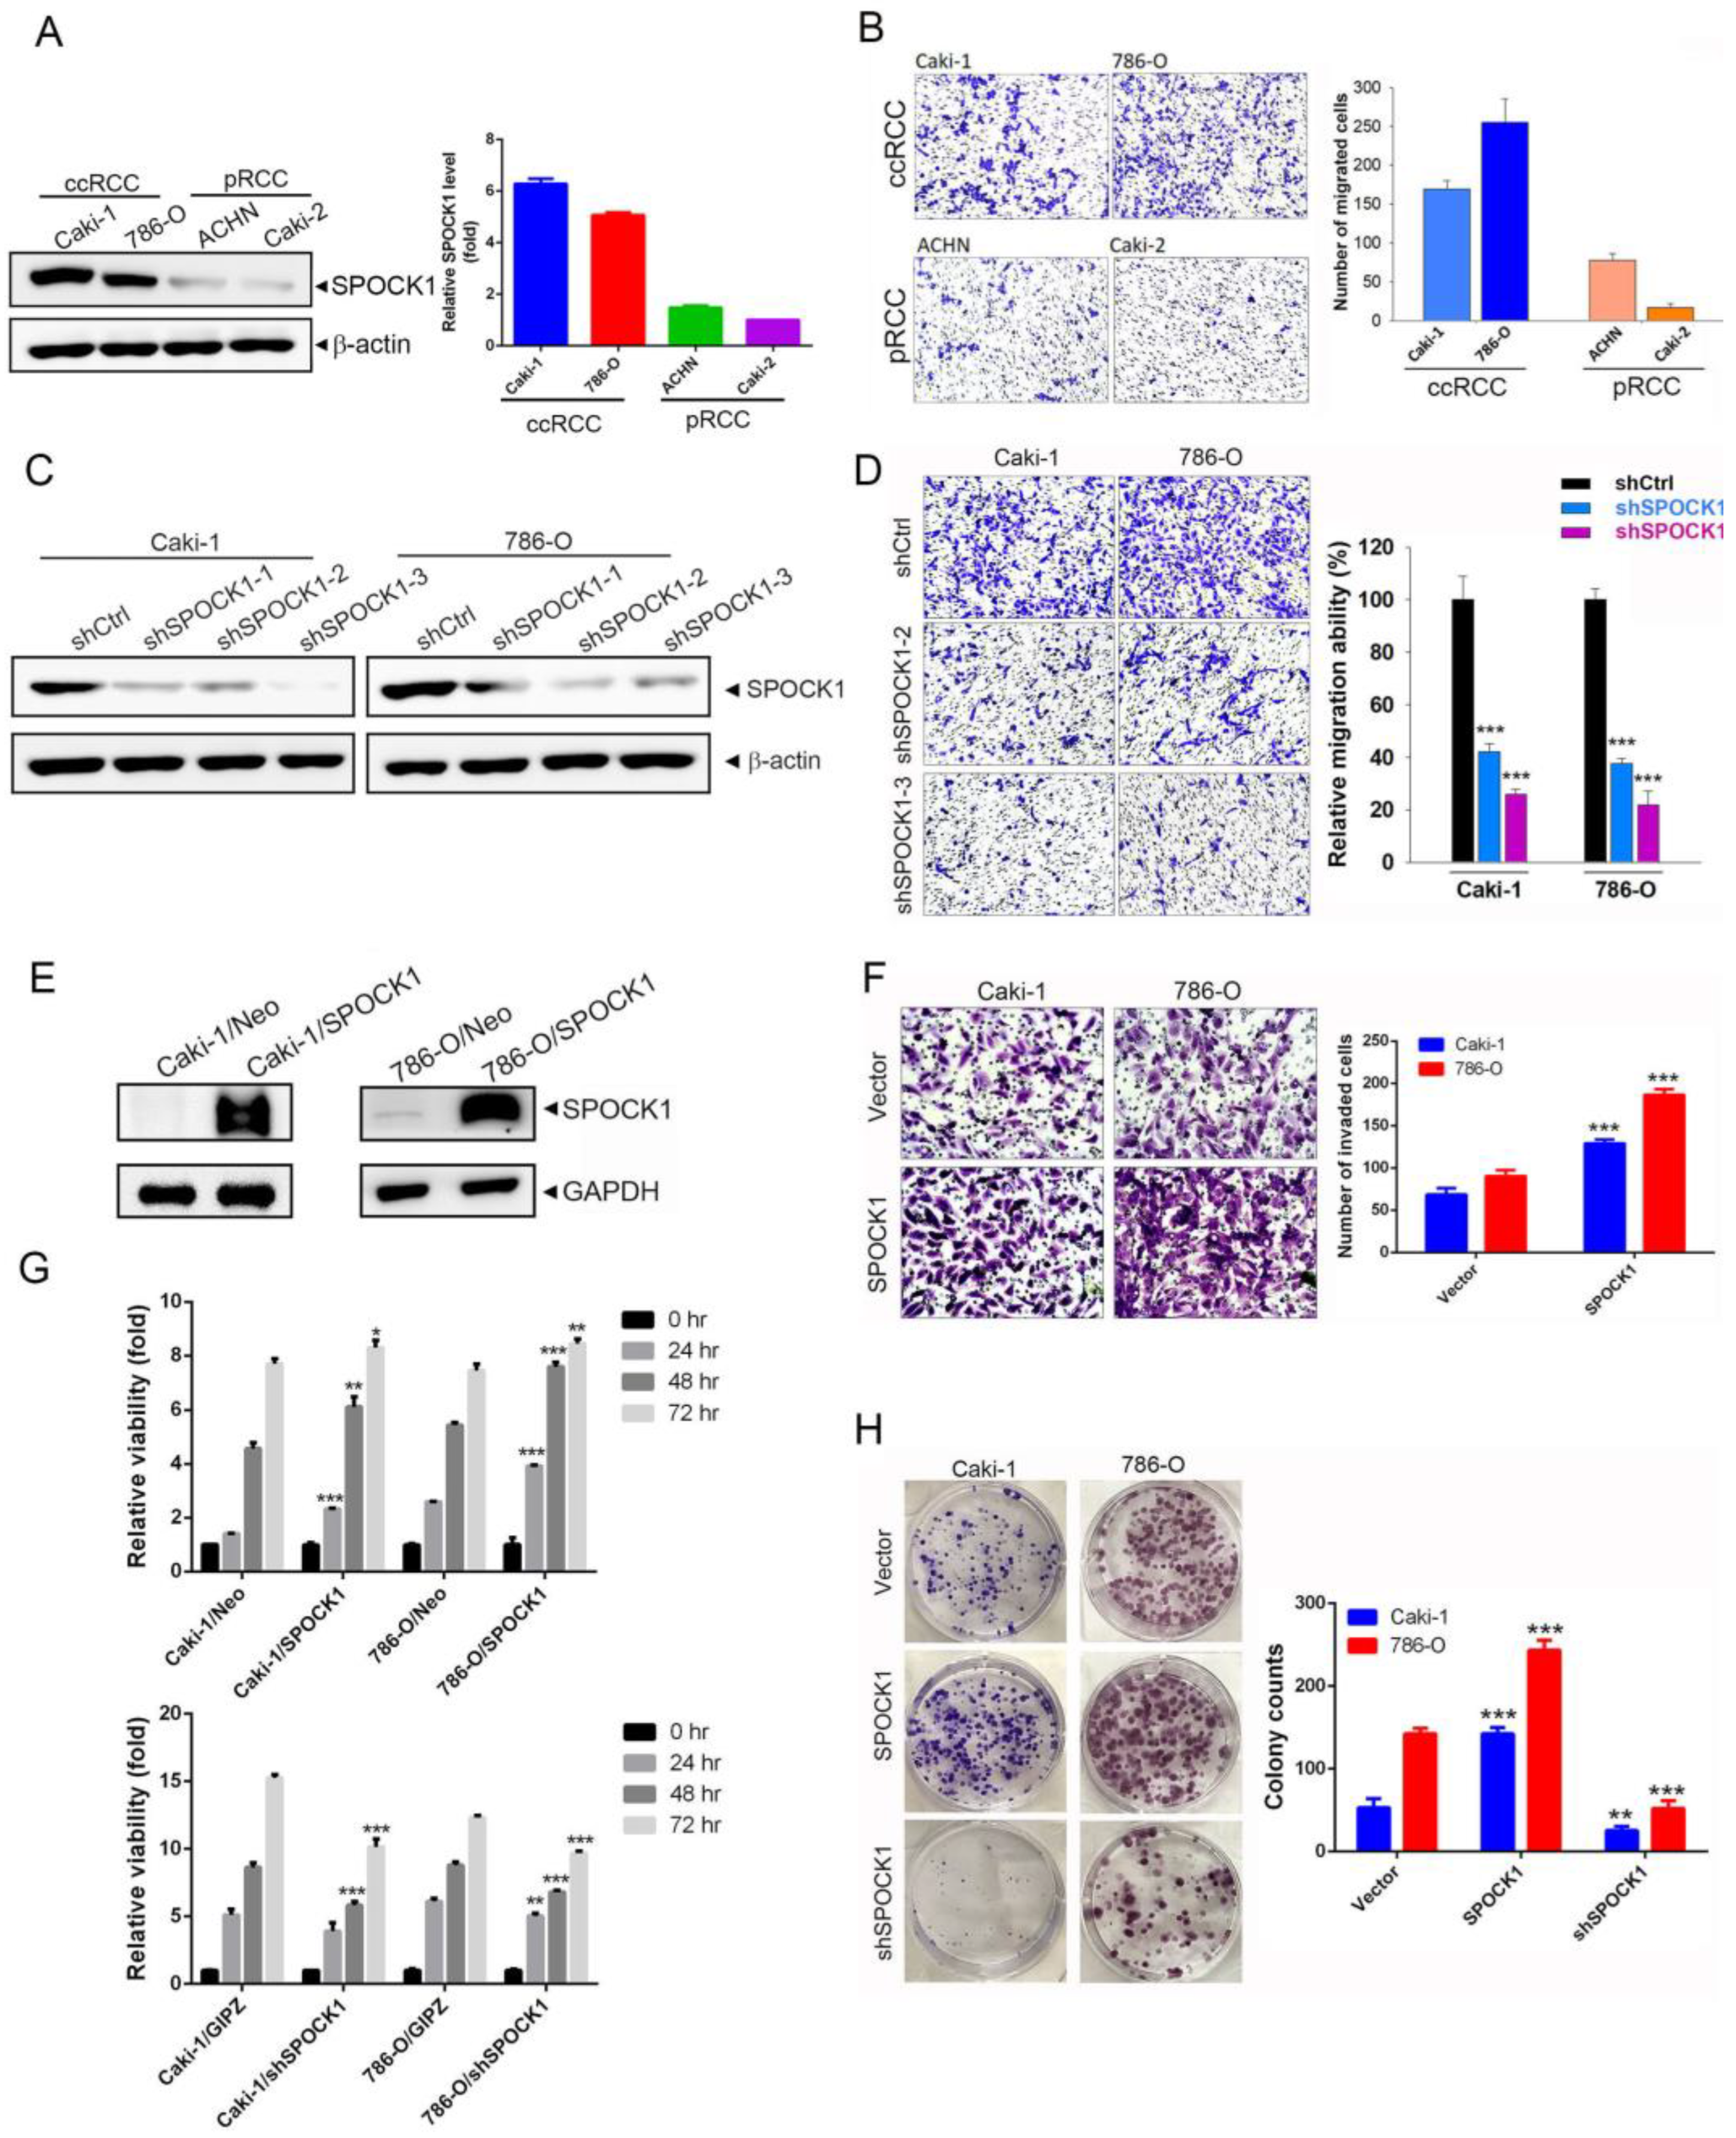
3.2. SPOCK1 Expression Modulates the Proliferation, Clonogenicity, and Migratory and Invasive Abilities of ccRCC Cells
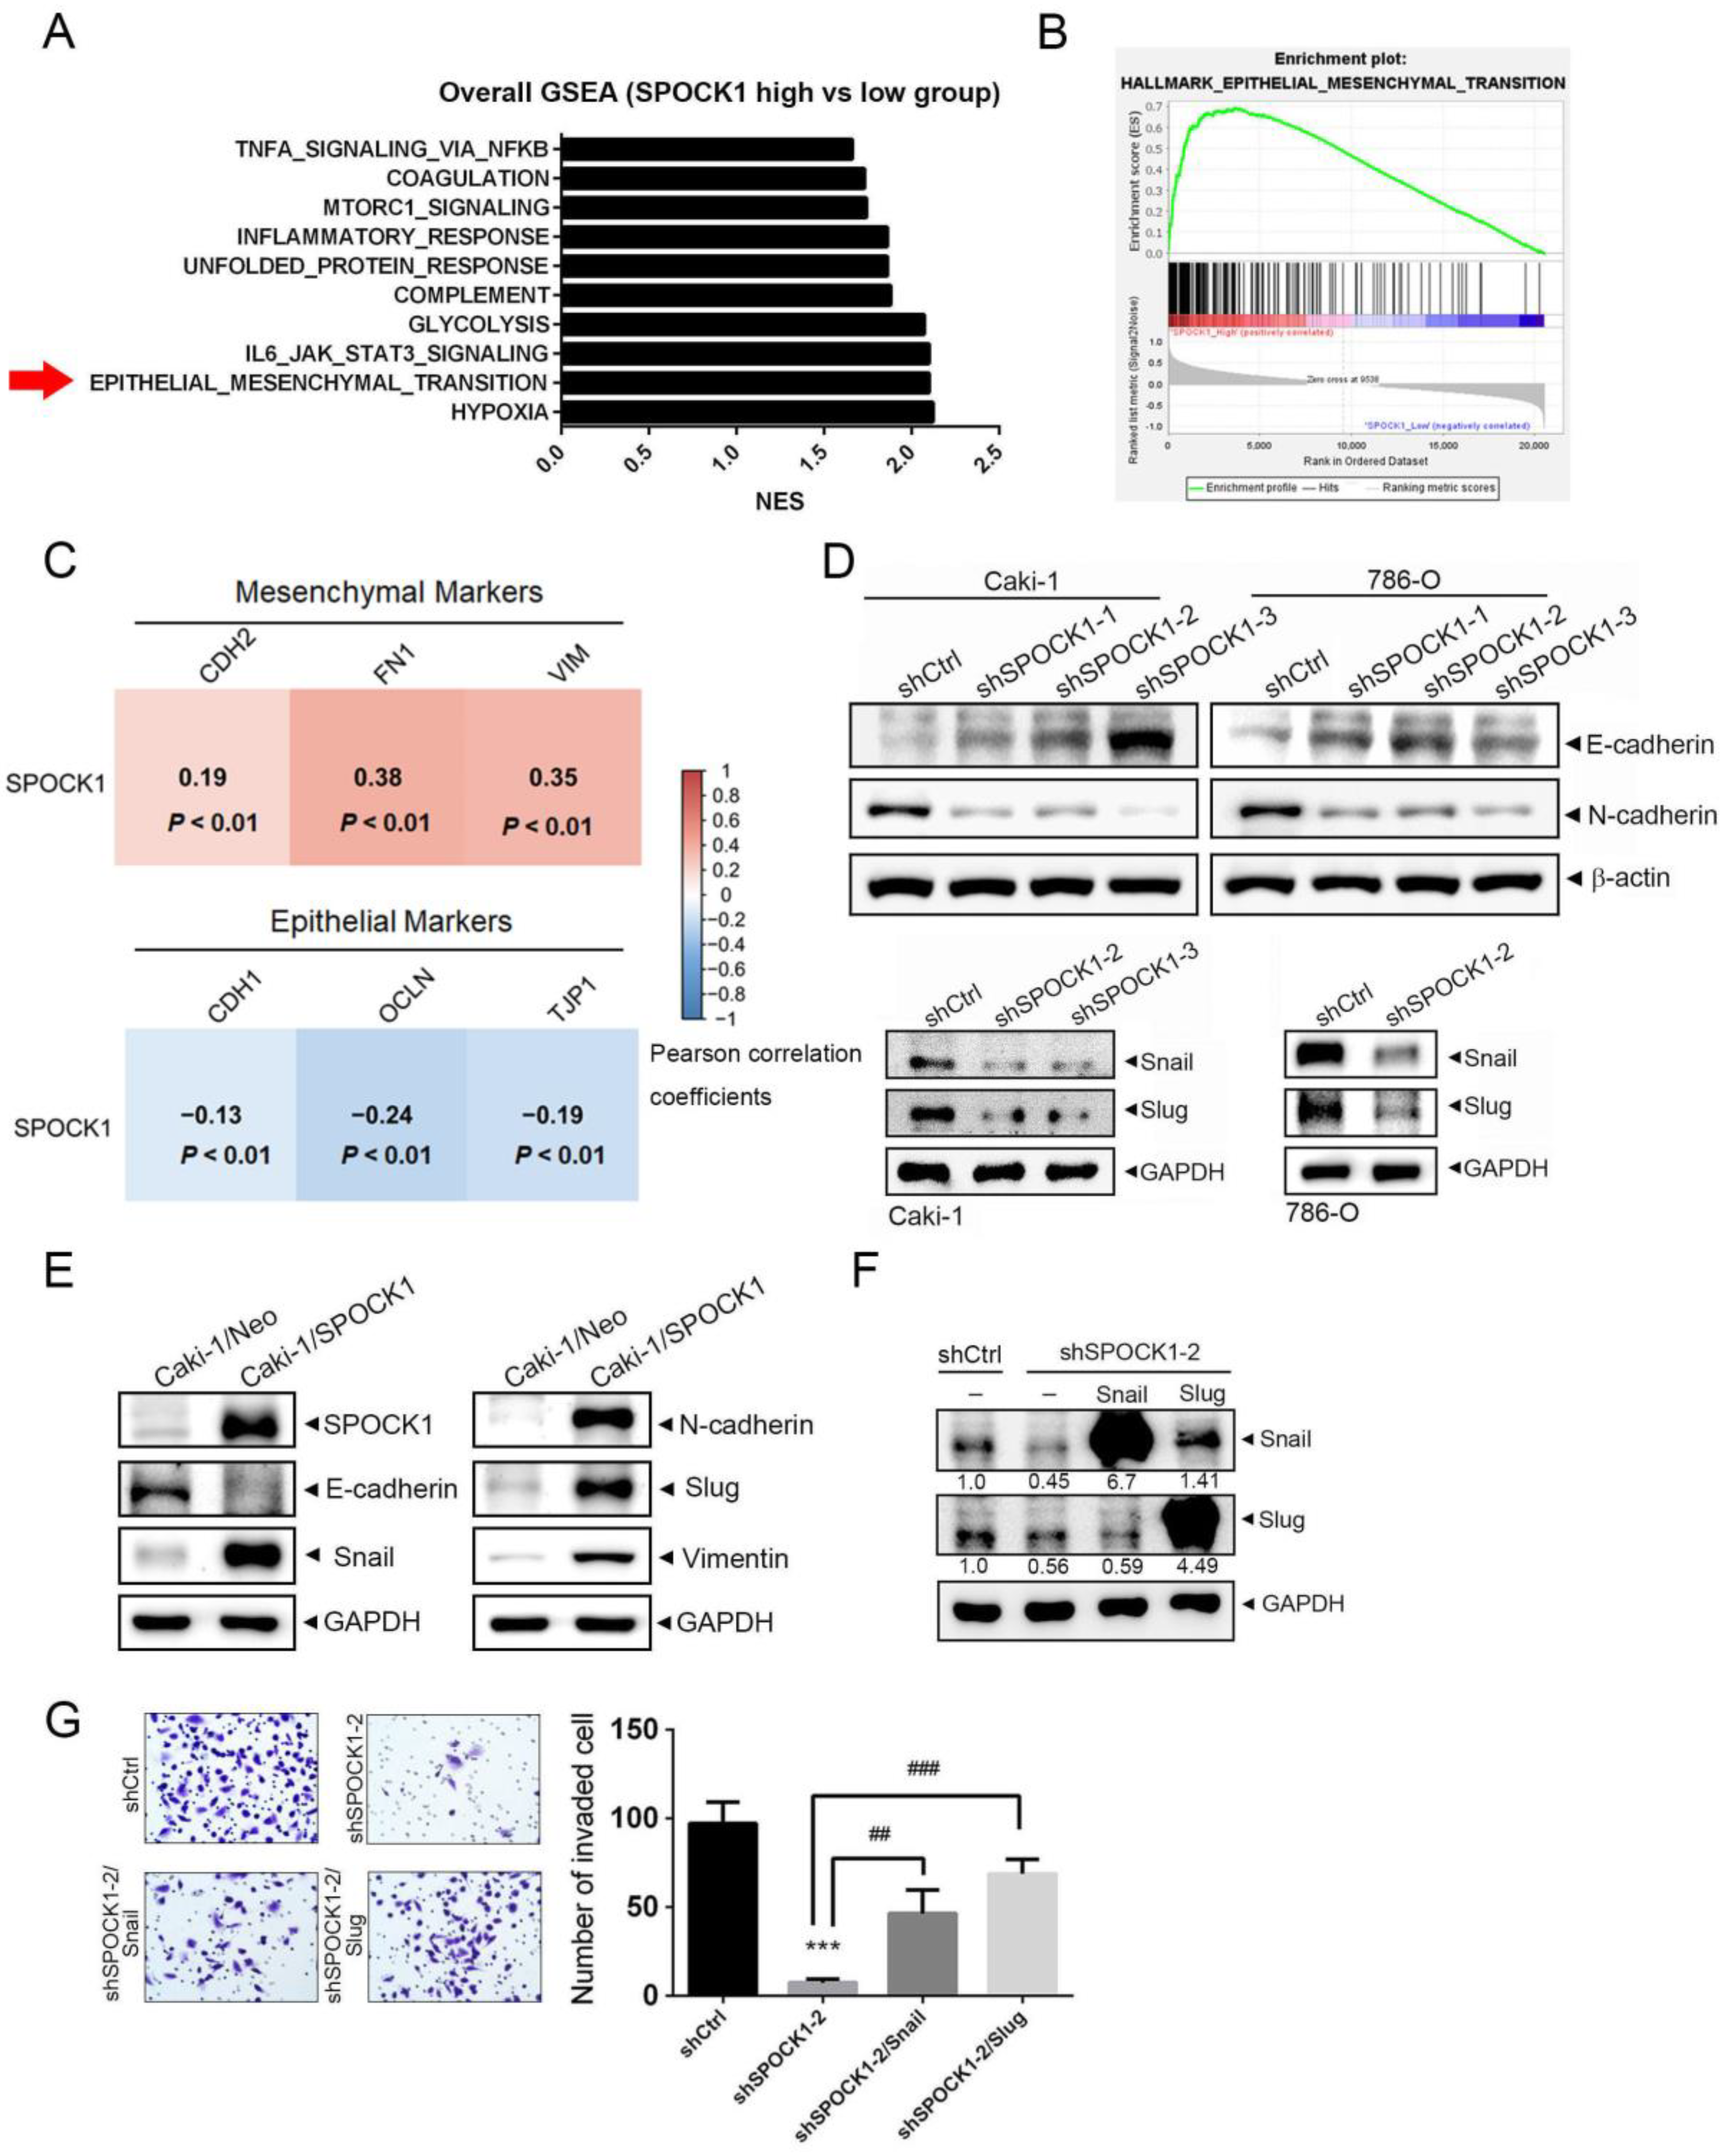
3.3. GSEA Reveals the EMT to Be Positively Associated with SPOCK1
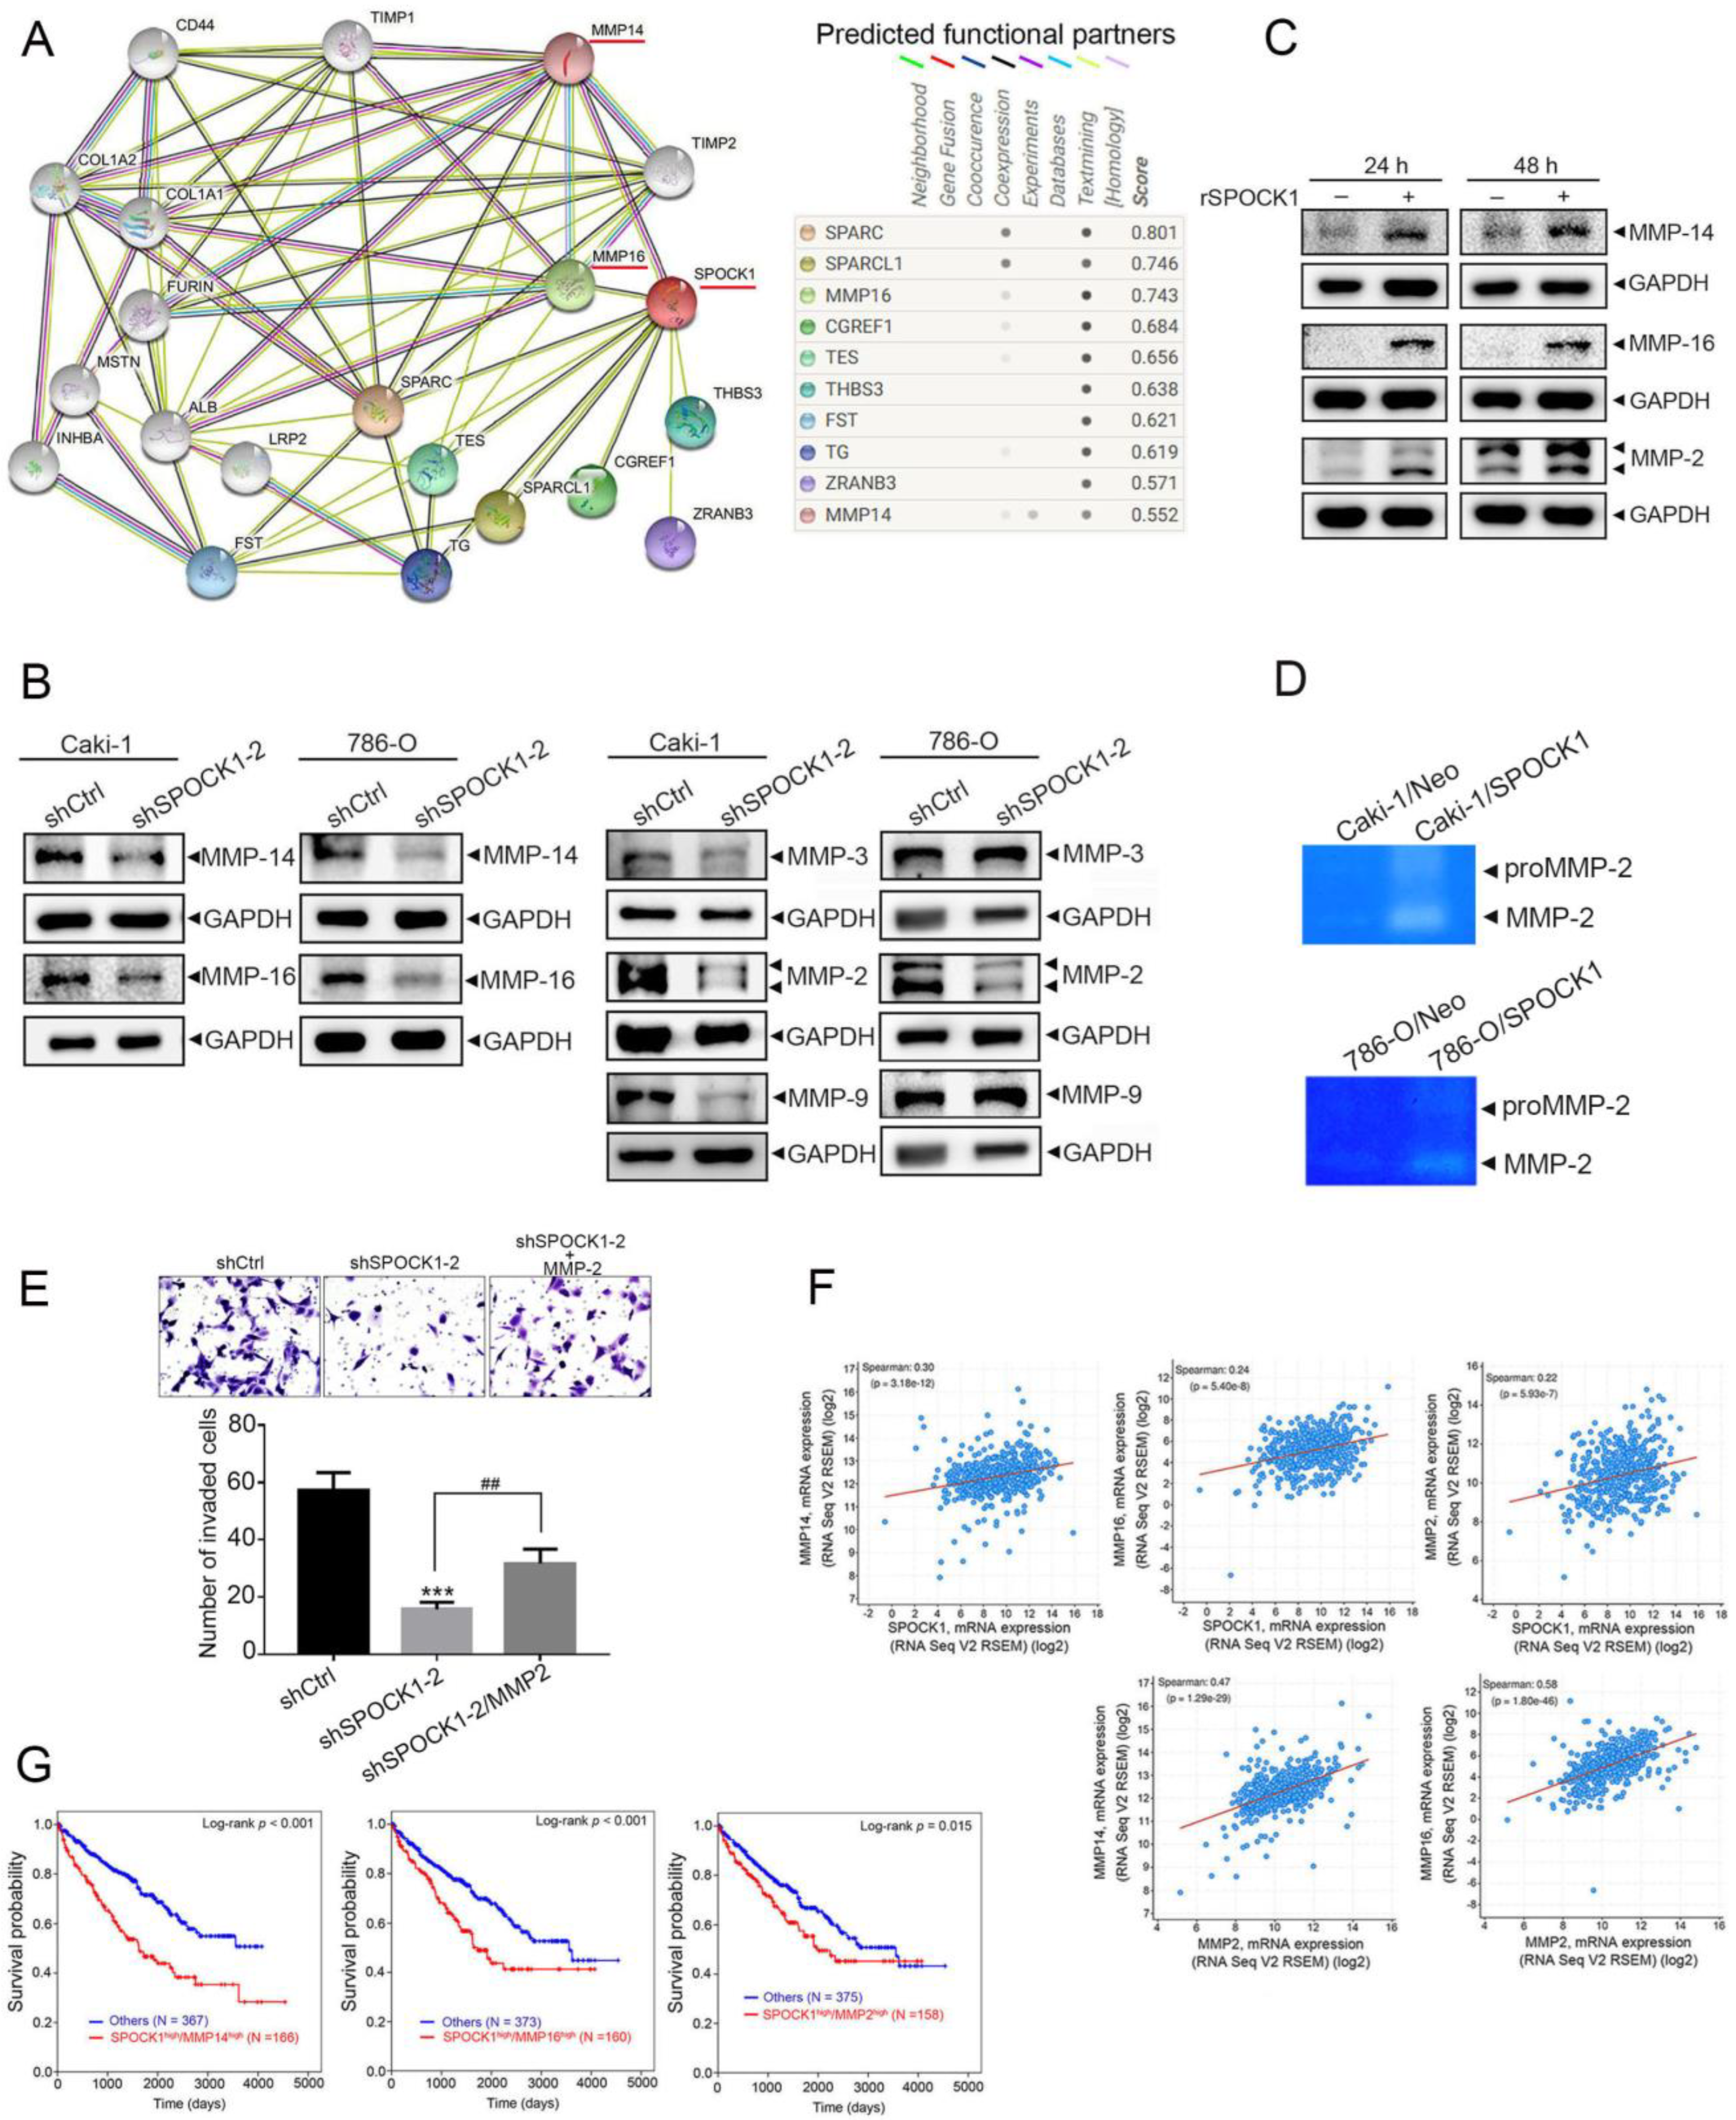
3.4. SPOCK1 Regulates ECM Remodeling via MMP-14/MMP-16-Mediated MMP-2 Activation and Expression
3.5. Crosstalk between MMP-2 and the Snail Family Is Involved in the Process of SPOCK1-Mediated EMT
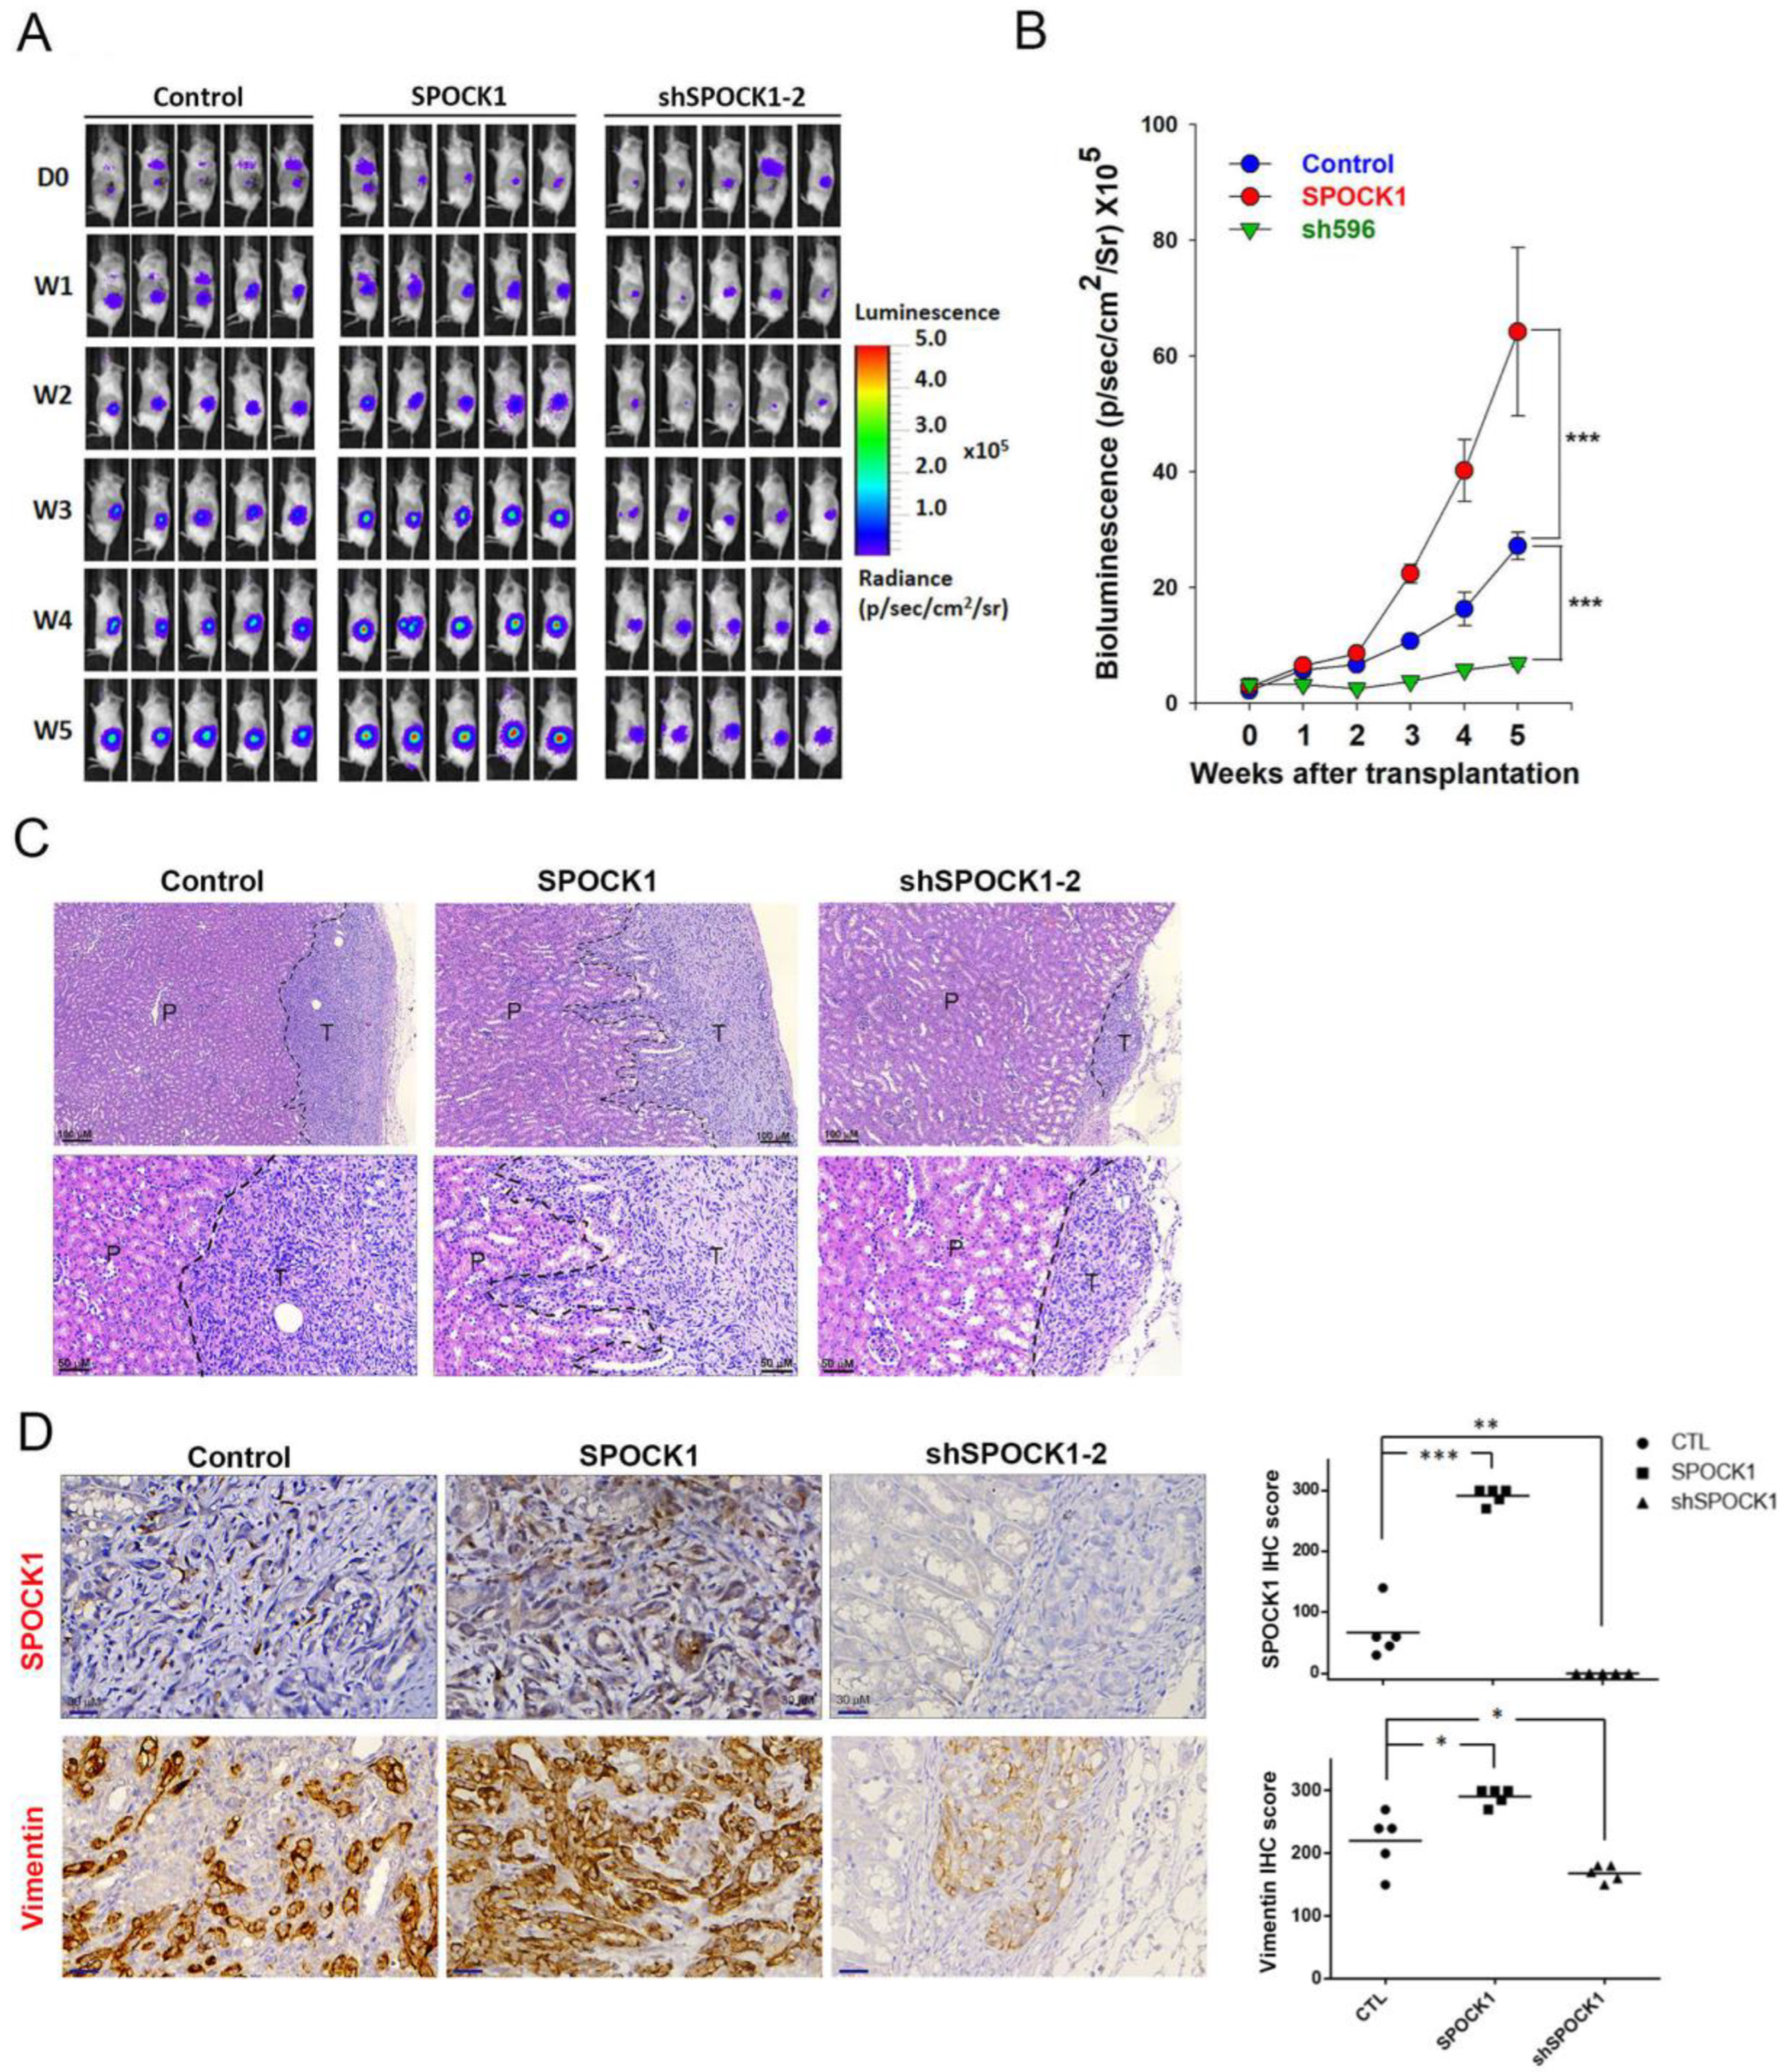
3.6. SPOCK1 Promotes Tumorigenicity and the Invasive Ability of ccRCC Cells in an Orthotopic Mouse Model
4. Discussion
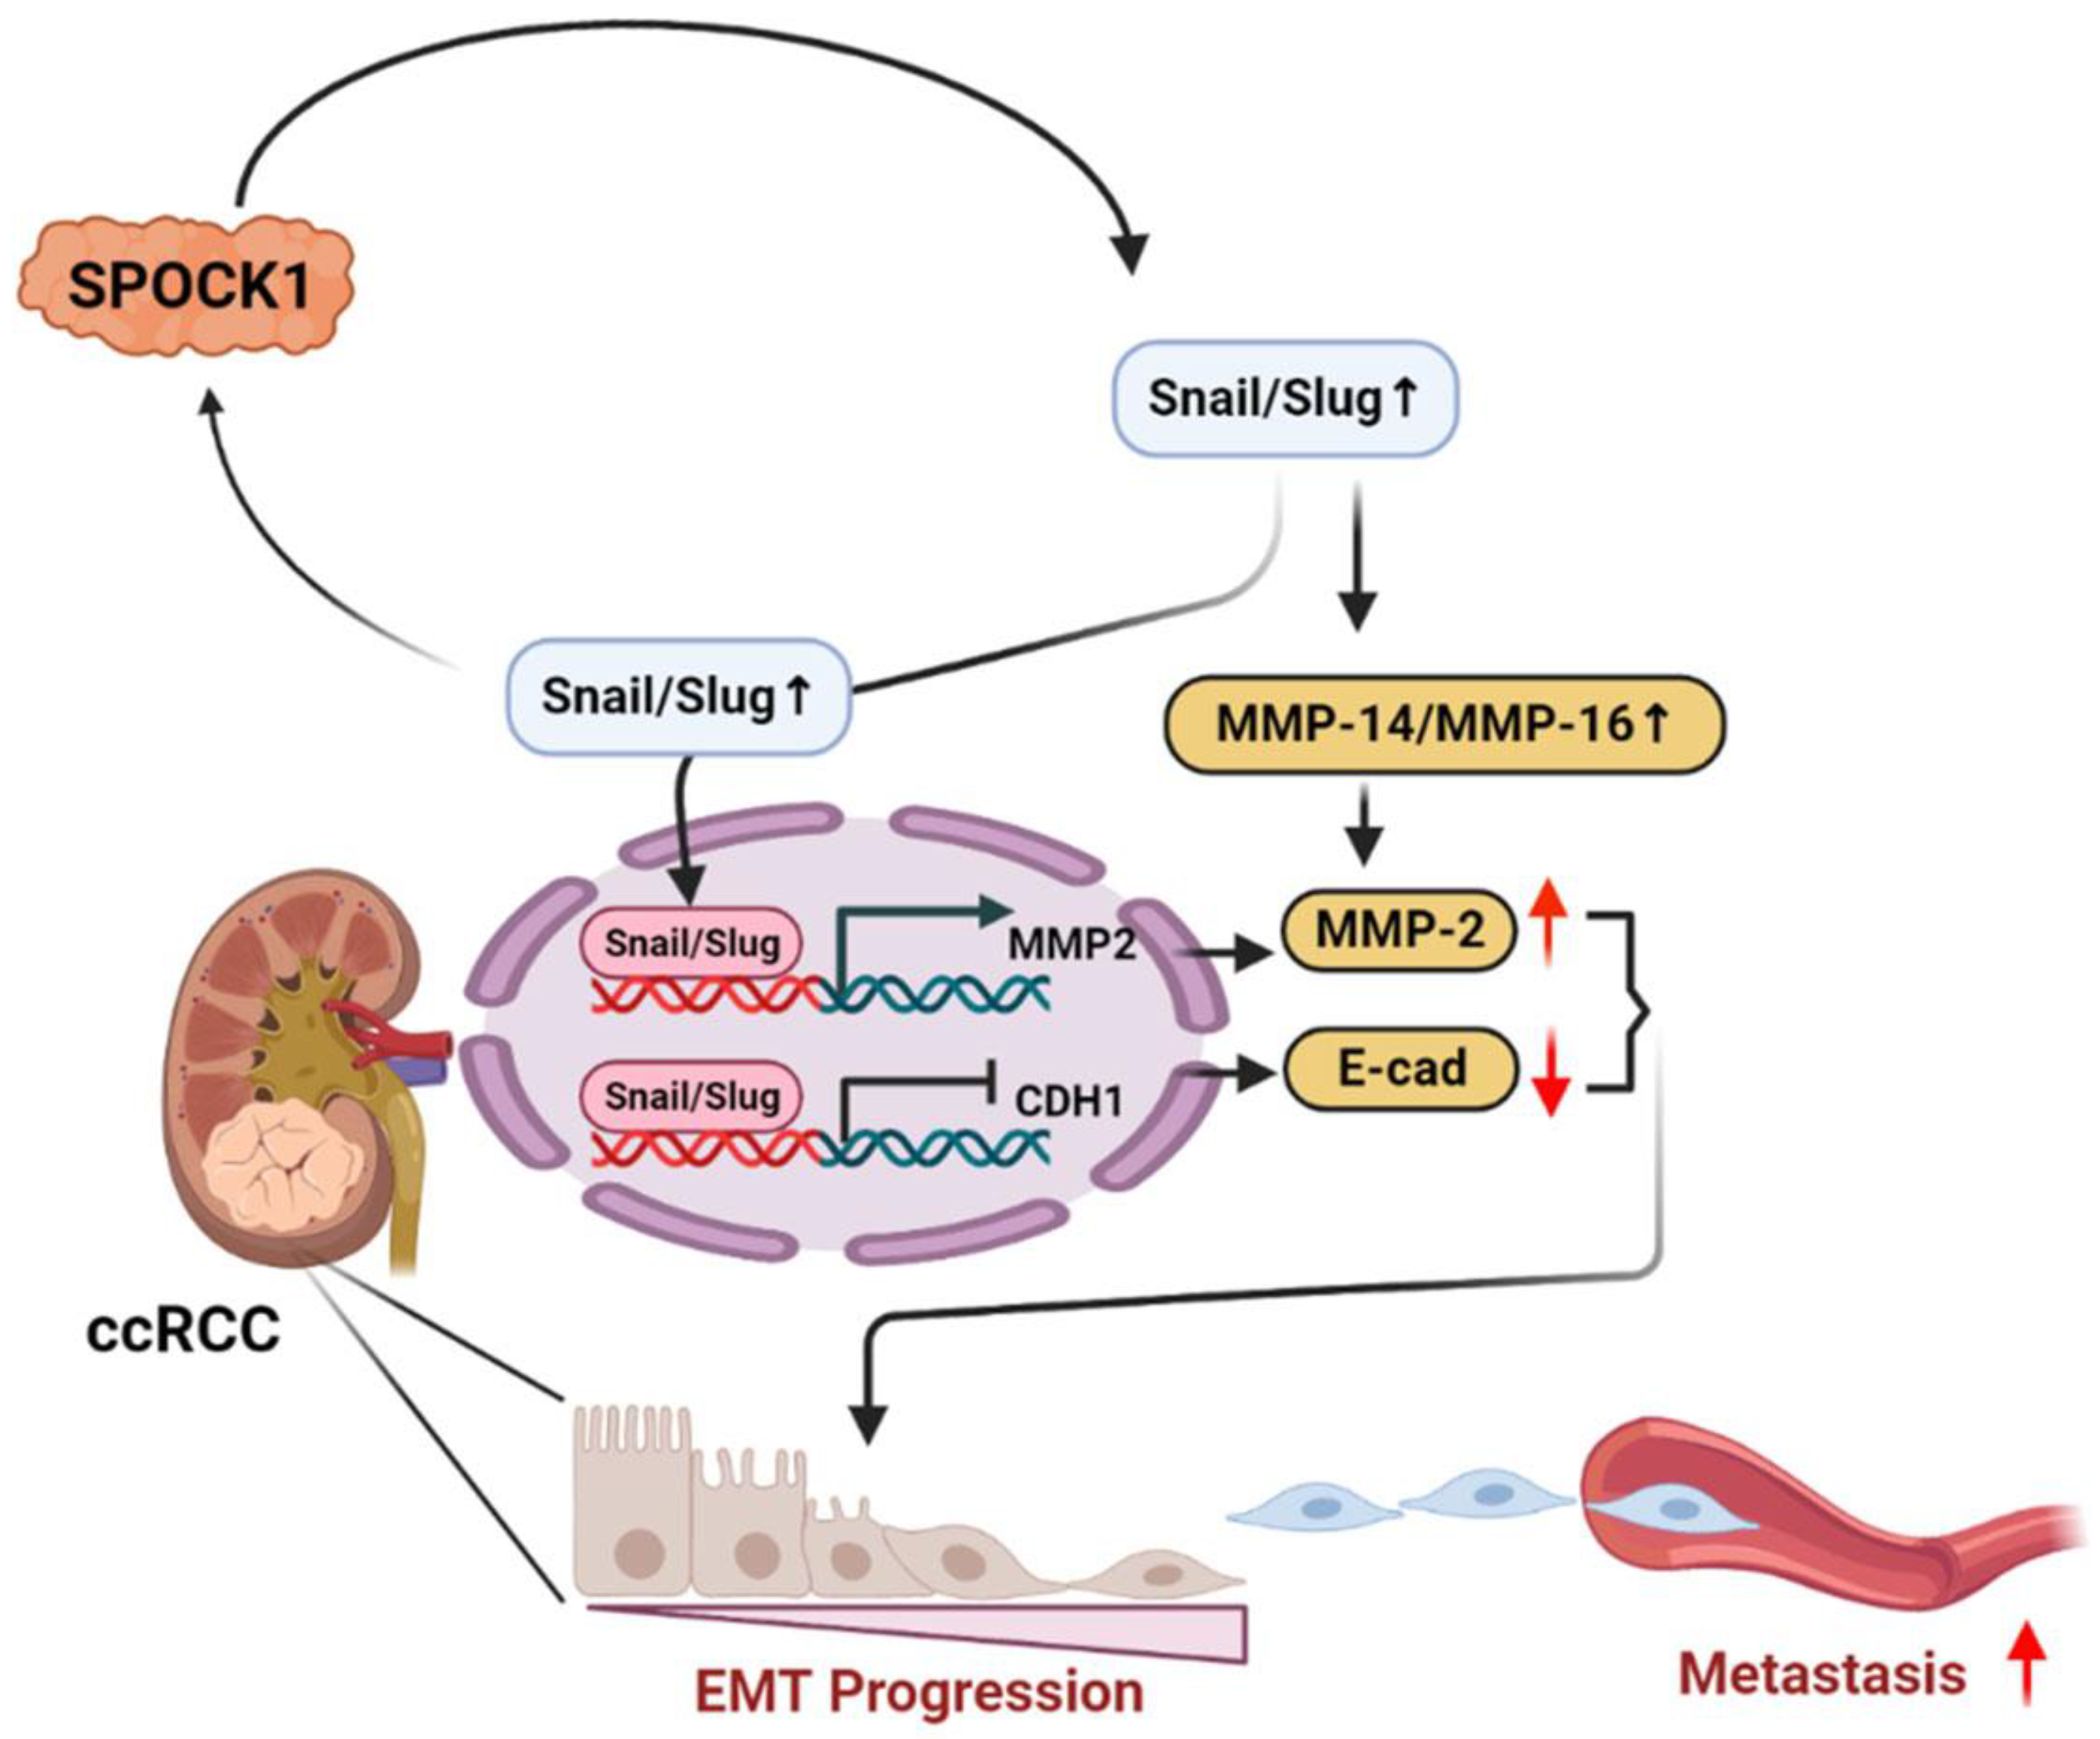
5. Conclusions
Supplementary Materials
Author Contributions
Funding
Institutional Review Board Statement
Informed Consent Statement
Data Availability Statement
Conflicts of Interest
References
- Siegel, R.L.; Miller, K.D.; Jemal, A. Cancer statistics, 2016. CA Cancer J. Clin. 2016, 66, 7–30. [Google Scholar] [CrossRef] [PubMed]
- Clark, P.E. The role of VHL in clear-cell renal cell carcinoma and its relation to targeted therapy. Kidney Int. 2009, 76, 939–945. [Google Scholar] [CrossRef] [PubMed]
- Casuscelli, J.; Becerra, M.F.; Manley, B.J.; Zabor, E.C.; Reznik, E.; Redzematovic, A.; Arcila, M.E.; Tennenbaum, D.M.; Ghanaat, M.; Kashan, M.; et al. Characterization and Impact of TERT Promoter Region Mutations on Clinical Outcome in Renal Cell Carcinoma. Eur. Urol. Focus 2019, 5, 642–649. [Google Scholar] [CrossRef] [PubMed]
- Courtney, K.D.; Choueiri, T.K. Updates on novel therapies for metastatic renal cell carcinoma. Ther. Adv. Med. Oncol. 2010, 2, 209–219. [Google Scholar] [CrossRef]
- Zhong, Y.; Lu, Y.T.; Sun, Y.; Shi, Z.H.; Li, N.G.; Tang, Y.P.; Duan, J.A. Recent opportunities in matrix metalloproteinase inhibitor drug design for cancer. Expert Opin. Drug Discov. 2018, 13, 75–87. [Google Scholar] [CrossRef]
- Kallakury, B.V.; Karikehalli, S.; Haholu, A.; Sheehan, C.E.; Azumi, N.; Ross, J.S. Increased expression of matrix metalloproteinases 2 and 9 and tissue inhibitors of metalloproteinases 1 and 2 correlate with poor prognostic variables in renal cell carcinoma. Clin. Cancer Res. 2001, 7, 3113–3119. [Google Scholar]
- Kugler, A.; Hemmerlein, B.; Thelen, P.; Kallerhoff, M.; Radzun, H.J.; Ringert, R.H. Expression of metalloproteinase 2 and 9 and their inhibitors in renal cell carcinoma. J. Urol. 1998, 160, 1914–1918. [Google Scholar] [CrossRef]
- Abdel-Wahed, M.M.; Asaad, N.Y.; Aleskandarany, M. Expression of matrix metalloproteinase-2 in renal cell carcinoma. J. Egypt. Natl. Cancer Inst. 2004, 16, 168–177. [Google Scholar]
- Landolt, L.; Eikrem, Ø.; Strauss, P.; Scherer, A.; Lovett, D.H.; Beisland, C.; Finne, K.; Osman, T.; Ibrahim, M.M.; Gausdal, G.; et al. Clear Cell Renal Cell Carcinoma is linked to Epithelial-to-Mesenchymal Transition and to Fibrosis. Physiol. Rep. 2017, 5, e13305. [Google Scholar] [CrossRef] [PubMed]
- Piva, F.; Giulietti, M.; Santoni, M.; Occhipinti, G.; Scarpelli, M.; Lopez-Beltran, A.; Cheng, L.; Principato, G.; Montironi, R. Epithelial to Mesenchymal Transition in Renal Cell Carcinoma: Implications for Cancer Therapy. Mol. Diagn. Ther. 2016, 20, 111–117. [Google Scholar] [CrossRef]
- Lamouille, S.; Xu, J.; Derynck, R. Molecular mechanisms of epithelial-mesenchymal transition. Nat. Rev. Mol. Cell Biol. 2014, 15, 178–196. [Google Scholar] [CrossRef] [PubMed]
- Mahimkar, R.; Alfonso-Jaume, M.A.; Cape, L.M.; Dahiya, R.; Lovett, D.H. Graded activation of the MEK1/MT1-MMP axis determines renal epithelial cell tumor phenotype. Carcinogenesis 2011, 32, 1806–1814. [Google Scholar] [CrossRef] [PubMed]
- Bradshaw, A.D. Diverse biological functions of the SPARC family of proteins. Int. J. Biochem. Cell Biol. 2012, 44, 480–488. [Google Scholar] [CrossRef] [PubMed]
- Tai, I.T.; Tang, M.J. SPARC in cancer biology: Its role in cancer progression and potential for therapy. Drug Resist. Updates 2008, 11, 231–246. [Google Scholar] [CrossRef]
- Chien, M.H.; Lin, Y.W.; Wen, Y.C.; Yang, Y.C.; Hsiao, M.; Chang, J.L.; Huang, H.C.; Lee, W.J. Targeting the SPOCK1-snail/slug axis-mediated epithelial-to-mesenchymal transition by apigenin contributes to repression of prostate cancer metastasis. J. Exp. Clin. Cancer Res. 2019, 38, 246. [Google Scholar] [CrossRef] [PubMed]
- Zhang, J.; Zhi, X.; Shi, S.; Tao, R.; Chen, P.; Sun, S.; Bian, L.; Xu, Z.; Ma, L. SPOCK1 is up-regulated and promotes tumor growth via the PI3K/AKT signaling pathway in colorectal cancer. Biochem. Biophys. Res. Commun. 2017, 482, 870–876. [Google Scholar] [CrossRef] [PubMed]
- Chen, D.; Zhou, H.; Liu, G.; Zhao, Y.; Cao, G.; Liu, Q. SPOCK1 promotes the invasion and metastasis of gastric cancer through Slug-induced epithelial-mesenchymal transition. J. Cell Mol. Med. 2018, 22, 797–807. [Google Scholar] [CrossRef] [PubMed]
- Li, J.; Ke, J.; Fang, J.; Chen, J.P. A potential prognostic marker and therapeutic target: SPOCK1 promotes the proliferation, metastasis, and apoptosis of pancreatic ductal adenocarcinoma cells. J. Cell Biochem. 2020, 121, 743–754. [Google Scholar] [CrossRef] [PubMed]
- Gao, Y.; Yu, M.; Ma, M.; Zhuang, Y.; Qiu, X.; Zhao, Q.; Dai, J.; Cai, H.; Yan, X. SPOCK1 contributes to the third-generation EGFR tyrosine kinase inhibitors resistance in lung cancer. J. Cell Biochem. 2019, 120, 12566–12573. [Google Scholar] [CrossRef]
- Tseng, T.H.; Chien, M.H.; Lin, W.L.; Wen, Y.C.; Chow, J.M.; Chen, C.K.; Kuo, T.C.; Lee, W.J. Inhibition of MDA-MB-231 breast cancer cell proliferation and tumor growth by apigenin through induction of G2/M arrest and histone H3 acetylation-mediated p21(WAF1/CIP1) expression. Environ. Toxicol. 2017, 32, 434–444. [Google Scholar] [CrossRef]
- Chang, J.H.; Lai, S.L.; Chen, W.S.; Hung, W.Y.; Chow, J.M.; Hsiao, M.; Lee, W.J.; Chien, M.H. Quercetin suppresses the metastatic ability of lung cancer through inhibiting Snail-dependent Akt activation and Snail-independent ADAM9 expression pathways. Biochim. Biophys. Acta. Mol. Cell Res. 2017, 1864, 1746–1758. [Google Scholar] [CrossRef] [PubMed]
- Liberzon, A.; Birger, C.; Thorvaldsdóttir, H.; Ghandi, M.; Mesirov, J.P.; Tamayo, P. The Molecular Signatures Database (MSigDB) hallmark gene set collection. Cell Syst. 2015, 1, 417–425. [Google Scholar] [CrossRef] [PubMed]
- Yang, S.F.; Lee, W.J.; Tan, P.; Tang, C.H.; Hsiao, M.; Hsieh, F.K.; Chien, M.H. Upregulation of miR-328 and inhibition of CREB-DNA-binding activity are critical for resveratrol-mediated suppression of matrix metalloproteinase-2 and subsequ ent metastatic ability in human osteosarcomas. Oncotarget 2015, 6, 2736–2753. [Google Scholar] [CrossRef] [PubMed]
- Lin, Y.W.; Lee, L.M.; Lee, W.J.; Chu, C.Y.; Tan, P.; Yang, Y.C.; Chen, W.Y.; Yang, S.F.; Hsiao, M.; Chien, M.H. Melatonin inhibits MMP-9 transactivation and renal cell carcinoma metastasis by suppressing Akt-MAPKs pathway and NF-κB DNA-binding activity. J. Pineal Res. 2016, 60, 277–290. [Google Scholar] [CrossRef] [PubMed]
- Shu, Y.J.; Weng, H.; Ye, Y.Y.; Hu, Y.P.; Bao, R.F.; Cao, Y.; Wang, X.A.; Zhang, F.; Xiang, S.S.; Li, H.F.; et al. SPOCK1 as a potential cancer prognostic marker promotes the proliferation and metastasis of gallbladder cancer cells by activating the PI3K/AKT pathway. Mol. Cancer 2015, 14, 12. [Google Scholar] [CrossRef]
- Zhao, P.; Guan, H.T.; Dai, Z.J.; Ma, Y.G.; Liu, X.X.; Wang, X.J. Knockdown of SPOCK1 Inhibits the Proliferation and Invasion in Colorectal Cancer Cells by Suppressing the PI3K/Akt Pathway. Oncol. Res. 2016, 24, 437–445. [Google Scholar] [CrossRef]
- Ye, Z.; Chen, J.; Hu, X.; Yang, S.; Xuan, Z.; Lu, X.; Zhao, Q. SPOCK1: A multi-domain proteoglycan at the crossroads of extracellular matrix remodeling and cancer development. Am. J. Cancer Res. 2020, 10, 3127–3137. [Google Scholar]
- Seomun, Y.; Kim, J.T.; Joo, C.K. MMP-14 mediated MMP-9 expression is involved in TGF-beta1-induced keratinocyte migration. J. Cell Biochem. 2008, 104, 934–941. [Google Scholar] [CrossRef]
- Tsunezuka, Y.; Kinoh, H.; Takino, T.; Watanabe, Y.; Okada, Y.; Shinagawa, A.; Sato, H.; Seiki, M. Expression of membrane-type matrix metalloproteinase 1 (MT1-MMP) in tumor cells enhances pulmonary metastasis in an experimental metastasis assay. Cancer Res. 1996, 56, 5678–5683. [Google Scholar] [PubMed]
- Scheau, C.; Badarau, I.A.; Costache, R.; Caruntu, C.; Mihai, G.L.; Didilescu, A.C.; Constantin, C.; Neagu, M. The Role of Matrix Metalloproteinases in the Epithelial-Mesenchymal Transition of Hepatocellular Carcinoma. Anal. Cell. Pathol. Amst. 2019, 2019, 9423907. [Google Scholar] [CrossRef]
- Itoh, Y. Membrane-type matrix metalloproteinases: Their functions and regulations. Matrix Biol. 2015, 44–46, 207–223. [Google Scholar] [CrossRef] [PubMed]
- Miyoshi, A.; Kitajima, Y.; Sumi, K.; Sato, K.; Hagiwara, A.; Koga, Y.; Miyazaki, K. Snail and SIP1 increase cancer invasion by upregulating MMP family in hepatocellular carcinoma cells. Br. J. Cancer 2004, 90, 1265–1273. [Google Scholar] [CrossRef] [PubMed]
- Wu, W.S.; You, R.I.; Cheng, C.C.; Lee, M.C.; Lin, T.Y.; Hu, C.T. Snail collaborates with EGR-1 and SP-1 to directly activate transcription of MMP 9 and ZEB1. Sci. Rep. 2017, 7, 17753. [Google Scholar] [CrossRef] [PubMed]
- Yang, J.; Yang, Q.; Yu, J.; Li, X.; Yu, S.; Zhang, X. SPOCK1 promotes the proliferation, migration and invasion of glioma cells through PI3K/AKT and Wnt/β-catenin signaling pathways. Oncol. Rep. 2016, 35, 3566–3576. [Google Scholar] [CrossRef]
- Su, C.; Lv, Y.; Lu, W.; Yu, Z.; Ye, Y.; Guo, B.; Liu, D.; Yan, H.; Li, T.; Zhang, Q.; et al. Single-Cell RNA Sequencing in Multiple Pathologic Types of Renal Cell Carcinoma Revealed Novel Potential Tumor-Specific Markers. Front. Oncol. 2021, 11, 719564. [Google Scholar] [CrossRef]
- Sun, L.R.; Li, S.Y.; Guo, Q.S.; Zhou, W.; Zhang, H.M. SPOCK1 Involvement in Epithelial-to-Mesenchymal Transition: A New Target in Cancer Therapy? Cancer Manag. Res. 2020, 12, 3561–3569. [Google Scholar] [CrossRef]
- Julien, S.; Puig, I.; Caretti, E.; Bonaventure, J.; Nelles, L.; van Roy, F.; Dargemont, C.; de Herreros, A.G.; Bellacosa, A.; Larue, L. Activation of NF-κB by Akt upregulates Snail expression and induces epithelium mesenchyme transition. Oncogene 2007, 26, 7445–7456. [Google Scholar] [CrossRef]
- Liu, Z.C.; Wang, H.S.; Zhang, G.; Liu, H.; Chen, X.H.; Zhang, F.; Chen, D.Y.; Cai, S.H.; Du, J. AKT/GSK-3β regulates stability and transcription of snail which is crucial for bFGF-induced epithelial-mesenchymal transition of prostate cancer cells. Biochim. Biophys. Acta 2014, 1840, 3096–3105. [Google Scholar] [CrossRef]
- Wei, W.; Ma, X.D.; Jiang, G.M.; Shi, B.; Zhong, W.; Sun, C.L.; Zhao, L.; Hou, Y.J.; Wang, H. The AKT/GSK3-Mediated Slug Expression Contributes to Oxaliplatin Resistance in Colorectal Cancer via Upregulation of ERCC1. Oncol. Res. 2020, 28, 423–438. [Google Scholar] [CrossRef]
- Escrivà, M.; Peiró, S.; Herranz, N.; Villagrasa, P.; Dave, N.; Montserrat-Sentís, B.; Murray, S.A.; Francí, C.; Gridley, T.; Virtanen, I.; et al. Repression of PTEN phosphatase by Snail1 transcriptional factor during gamma radiation-induced apoptosis. Mol. Cell. Biol. 2008, 28, 1528–1540. [Google Scholar] [CrossRef]
- Uygur, B.; Abramo, K.; Leikina, E.; Vary, C.; Liaw, L.; Wu, W.S. SLUG is a direct transcriptional repressor of PTEN tumor suppressor. Prostate 2015, 75, 907–916. [Google Scholar] [CrossRef] [PubMed]
- Tester, A.M.; Ruangpanit, N.; Anderson, R.L.; Thompson, E.W. MMP-9 secretion and MMP-2 activation distinguish invasive and metastatic sublines of a mouse mammary carcinoma system showing epithelial-mesenchymal transition traits. Clin. Exp. Metastasis 2000, 18, 553–560. [Google Scholar] [CrossRef] [PubMed]
- Pang, L.; Li, Q.; Li, S.; He, J.; Cao, W.; Lan, J.; Sun, B.; Zou, H.; Wang, C.; Liu, R.; et al. Membrane type 1-matrix metalloproteinase induces epithelial-to-mesenchymal transition in esophageal squamous cell carcinoma: Observations from clinical and in vitro analyses. Sci. Rep. 2016, 6, 22179. [Google Scholar] [CrossRef]
- Shen, Z.; Wang, X.; Yu, X.; Zhang, Y.; Qin, L. MMP16 promotes tumor metastasis and indicates poor prognosis in hepatocellular carcinoma. Oncotarget 2017, 8, 72197–72204. [Google Scholar] [CrossRef] [PubMed]
- Chen, Q.; Yao, Y.T.; Xu, H.; Chen, Y.B.; Gu, M.; Cai, Z.K.; Wang, Z. SPOCK1 promotes tumor growth and metastasis in human prostate cancer. Drug Des. Dev. Ther. 2016, 10, 2311–2321. [Google Scholar]
- Li, Y.; Chen, L.; Chan, T.H.; Liu, M.; Kong, K.L.; Qiu, J.L.; Li, Y.; Yuan, Y.F.; Guan, X.Y. SPOCK1 is regulated by CHD1L and blocks apoptosis and promotes HCC cell invasiveness and metastasis in mice. Gastroenterology 2013, 144, 179–191.e174. [Google Scholar] [CrossRef]
- Prokop, J.W.; Liu, Y.; Milsted, A.; Peng, H.; Rauscher, F.J., 3rd. A method for in silico identification of SNAIL/SLUG DNA binding potentials to the E-box sequence using molecular dynamics and evolutionary conserved amino acids. J. Mol. Model 2013, 19, 3463–3469. [Google Scholar] [CrossRef]
- Jin, H.; Yu, Y.; Zhang, T.; Zhou, X.; Zhou, J.; Jia, L.; Wu, Y.; Zhou, B.P.; Feng, Y. Snail is critical for tumor growth and metastasis of ovarian carcinoma. Int. J. Cancer 2010, 126, 2102–2111. [Google Scholar] [CrossRef]
- Qiao, B.; Johnson, N.W.; Gao, J. Epithelial-mesenchymal transition in oral squamous cell carcinoma triggered by transforming growth factor-beta1 is Snail family-dependent and correlates with matrix metalloproteinase-2 and -9 expressions. Int. J. Oncol. 2010, 37, 663–668. [Google Scholar]


| Variable | Comparison | HR (95% CI) | p Value |
|---|---|---|---|
| Cox univariate analysis (OS) | |||
| Age | <61 years; ≥61 years | 1.771 (1.305~2.405) | <0.001 * |
| Gender | Female; male | 0.949 (0.698~1.292) | 0.741 |
| Stage | I/II; III/IV | 3.833 (2.795~5.255) | <0.001 * |
| Tumorsize | T1/2; T3/4 | 3.151 (2.329~4.262) | <0.001 * |
| Nstatus | N0; N1 | 0.912 (0.785~1.059) | 0.227 |
| Mstatus | M0; M1 | 2.143 (1.706~2.692) | <0.001 * |
| SPOCK1 | Low; high | 1.630 (1.202~2.211) | 0.002 * |
| Cox multivariate analysis (OS) | |||
| Age | <61 years; ≥61 years | 1.693 (1.238~2.315) | 0.001 * |
| Stage | I/II; III/IV | 3.626 (1.916~6.863) | <0.001 * |
| Tumorsize | T1/2; T3/4 | 0.785 (0.431~1.428) | 0.427 |
| Mstatus | M0; M1 | 1.809 (1.365~2.398) | <0.001 * |
| SPOCK1 | Low; high | 1.372 (1.003~1.876) | 0.048 * |
| Variable | Comparison | HR (95% CI) | p Value |
|---|---|---|---|
| Cox univariate analysis (DFS) | |||
| Age | <61 years; ≥61 years | 1.222 (0.441~3.386) | 0.7 |
| Gender | Female; male | 2.208 (0.702~6.940) | 0.175 |
| Stage | I/II; III/IV | 3.440 (1.235~9.583) | 0.018 * |
| Tumorsize | T1/2; T3/4 | 3.401 (1.222~9.471) | 0.019 * |
| Nstatus | N0; N1 | 1.071 (0.634~1.808) | 0.798 |
| Mstatus | M0; M1 | 0.198 (0.003~15.515) | 0.128 |
| SPOCK1 | Low; high | 3.610 (1.146~11.367) | 0.028 * |
| Cox multivariate analysis (DFS) | |||
| Stage | I/II; III/IV | 2.377 (0.815~6.934) | 0.113 |
| Tumorsize | T1/2; T3/4 | NA | NA |
| SPOCK1 | Low; high | 2.922 (0.862~9.909) | 0.085 |
Disclaimer/Publisher’s Note: The statements, opinions and data contained in all publications are solely those of the individual author(s) and contributor(s) and not of MDPI and/or the editor(s). MDPI and/or the editor(s) disclaim responsibility for any injury to people or property resulting from any ideas, methods, instructions or products referred to in the content. |
© 2023 by the authors. Licensee MDPI, Basel, Switzerland. This article is an open access article distributed under the terms and conditions of the Creative Commons Attribution (CC BY) license (https://creativecommons.org/licenses/by/4.0/).
Share and Cite
Lin, Y.-W.; Wen, Y.-C.; Hsiao, C.-H.; Lai, F.-R.; Yang, S.-F.; Yang, Y.-C.; Ho, K.-H.; Hsieh, F.-K.; Hsiao, M.; Lee, W.-J.; et al. Proteoglycan SPOCK1 as a Poor Prognostic Marker Promotes Malignant Progression of Clear Cell Renal Cell Carcinoma via Triggering the Snail/Slug-MMP-2 Axis-Mediated Epithelial-to-Mesenchymal Transition. Cells 2023, 12, 352. https://doi.org/10.3390/cells12030352
Lin Y-W, Wen Y-C, Hsiao C-H, Lai F-R, Yang S-F, Yang Y-C, Ho K-H, Hsieh F-K, Hsiao M, Lee W-J, et al. Proteoglycan SPOCK1 as a Poor Prognostic Marker Promotes Malignant Progression of Clear Cell Renal Cell Carcinoma via Triggering the Snail/Slug-MMP-2 Axis-Mediated Epithelial-to-Mesenchymal Transition. Cells. 2023; 12(3):352. https://doi.org/10.3390/cells12030352
Chicago/Turabian StyleLin, Yung-Wei, Yu-Ching Wen, Chi-Hao Hsiao, Feng-Ru Lai, Shun-Fa Yang, Yi-Chieh Yang, Kuo-Hao Ho, Feng-Koo Hsieh, Michael Hsiao, Wei-Jiunn Lee, and et al. 2023. "Proteoglycan SPOCK1 as a Poor Prognostic Marker Promotes Malignant Progression of Clear Cell Renal Cell Carcinoma via Triggering the Snail/Slug-MMP-2 Axis-Mediated Epithelial-to-Mesenchymal Transition" Cells 12, no. 3: 352. https://doi.org/10.3390/cells12030352
APA StyleLin, Y.-W., Wen, Y.-C., Hsiao, C.-H., Lai, F.-R., Yang, S.-F., Yang, Y.-C., Ho, K.-H., Hsieh, F.-K., Hsiao, M., Lee, W.-J., & Chien, M.-H. (2023). Proteoglycan SPOCK1 as a Poor Prognostic Marker Promotes Malignant Progression of Clear Cell Renal Cell Carcinoma via Triggering the Snail/Slug-MMP-2 Axis-Mediated Epithelial-to-Mesenchymal Transition. Cells, 12(3), 352. https://doi.org/10.3390/cells12030352