

Modulation of E-Cadherin Function through the AmotL2 Isoforms Promotes Ameboid Cell Invasion

 , ,
, ,  , , and
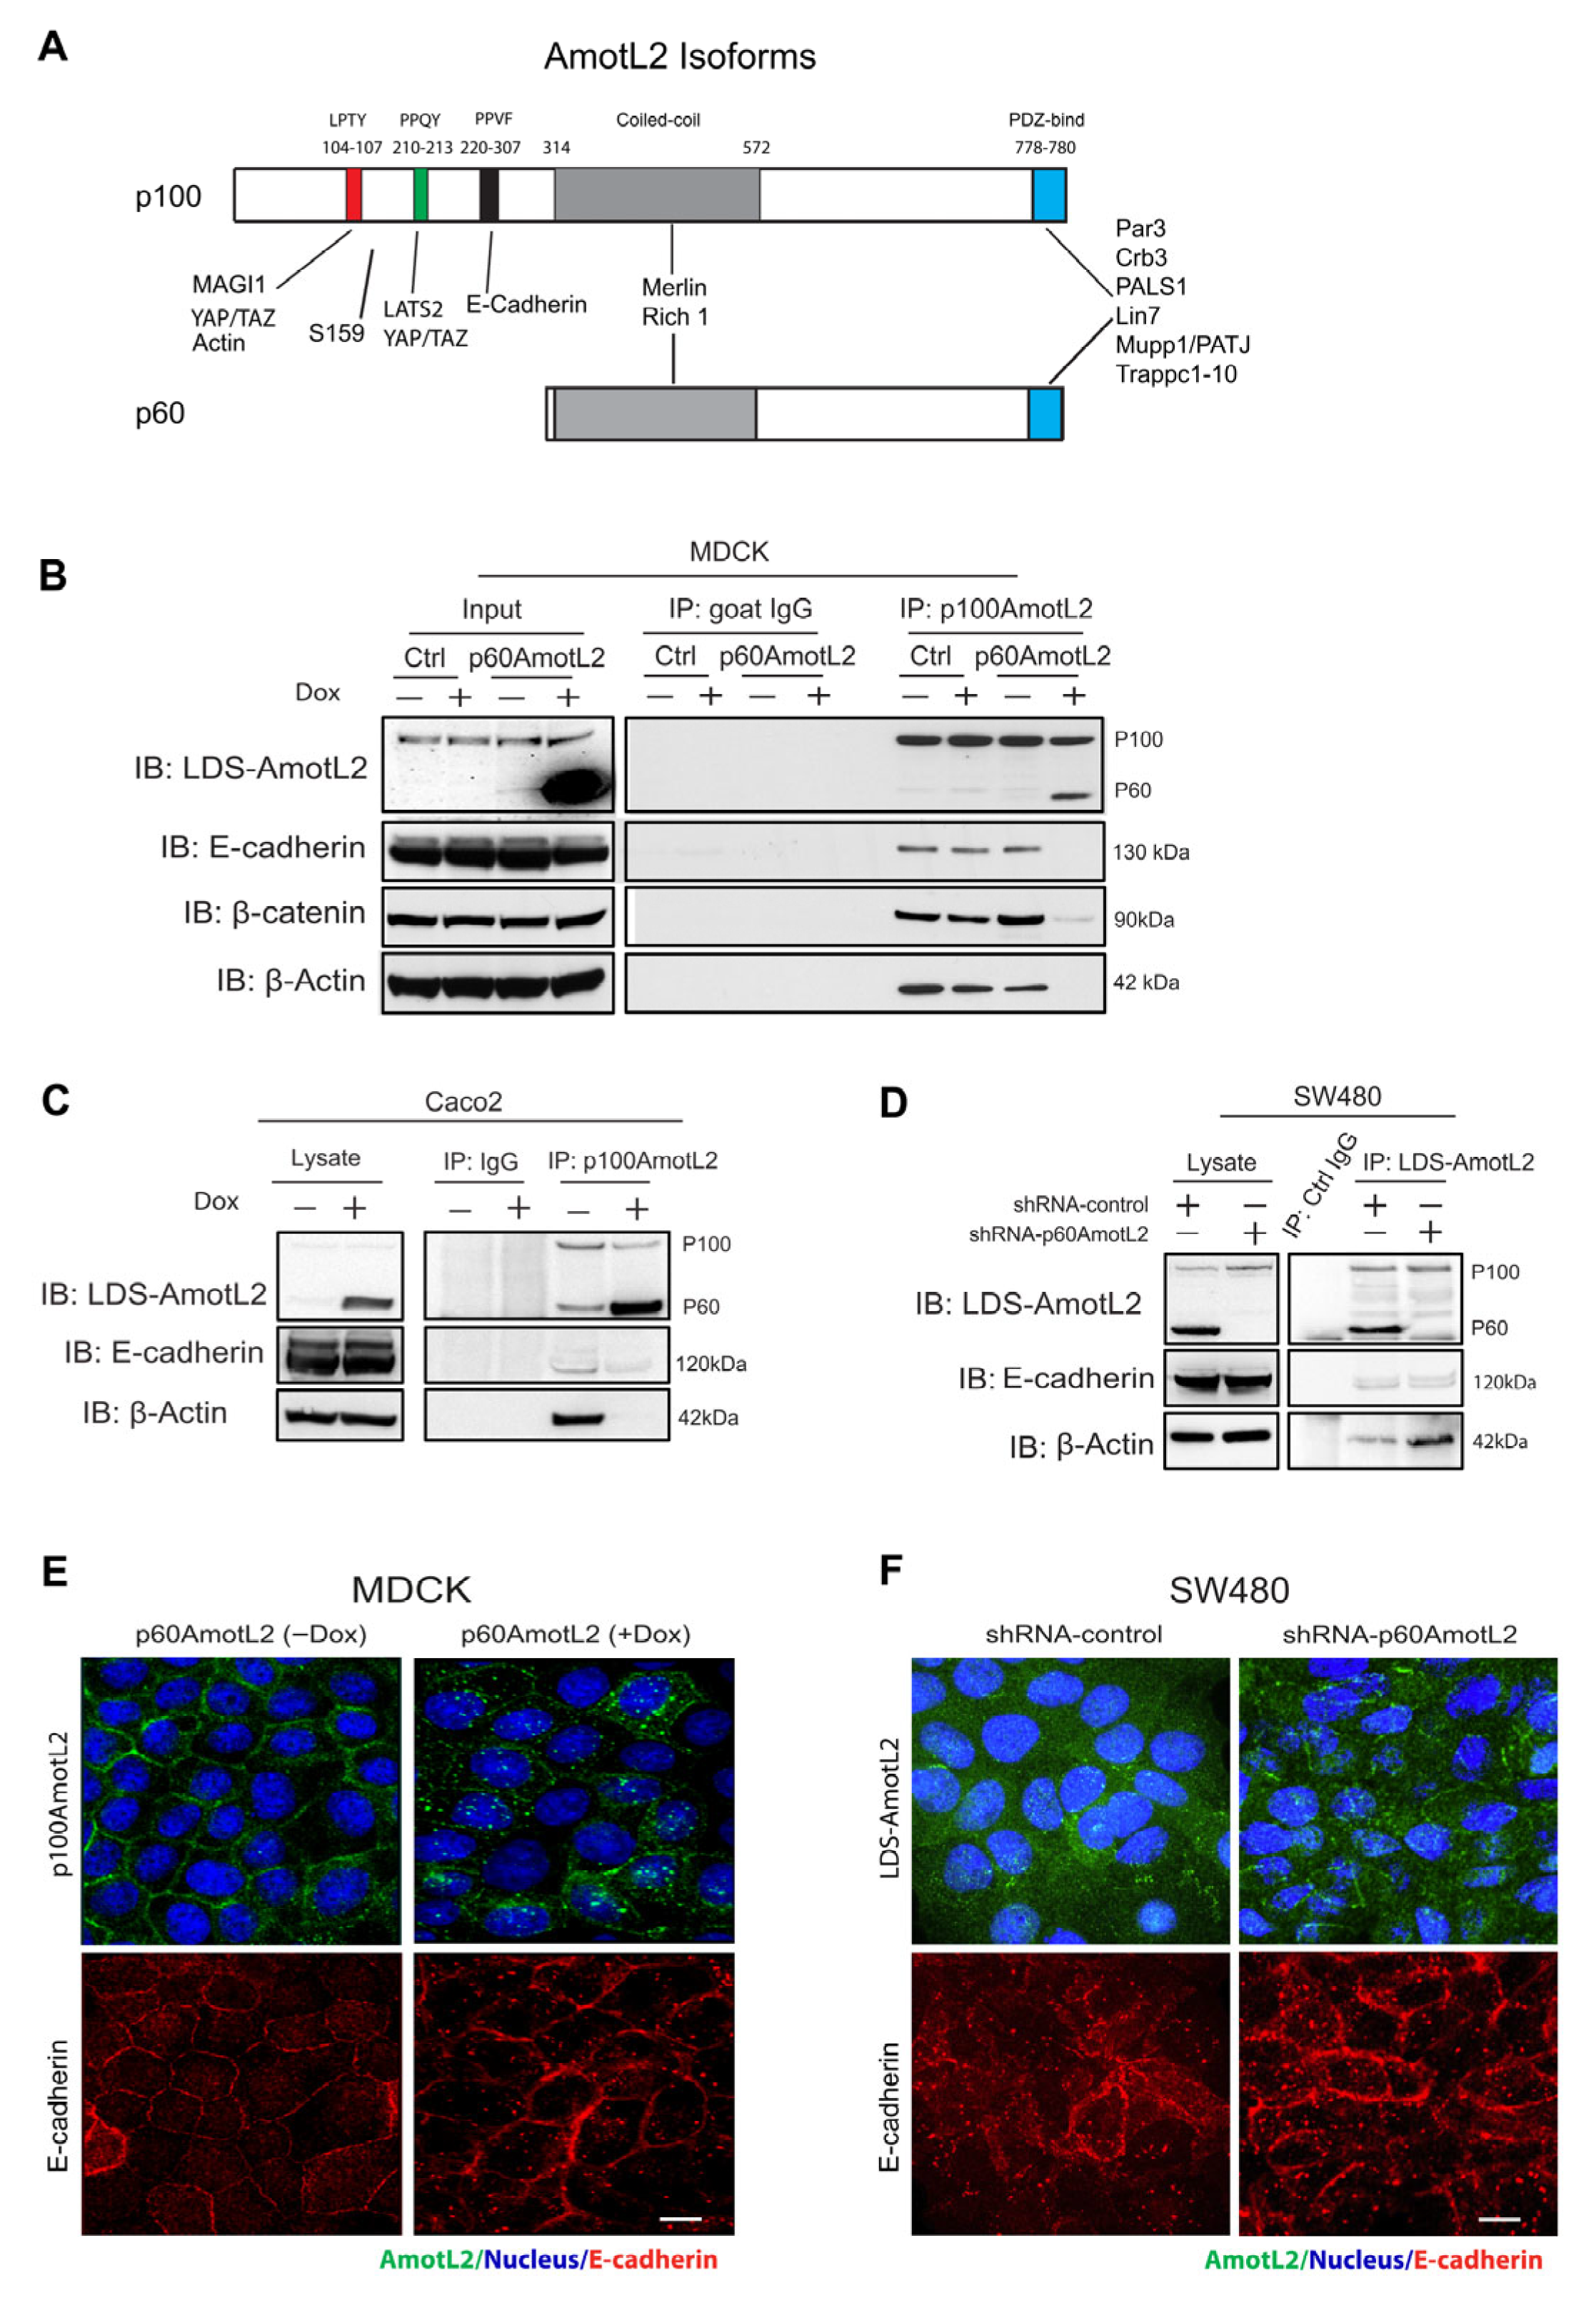
Abstract
1. Introduction
2. Results
2.1. The Expression of p60AmotL2 Results in the Sequestration of p100AmotL2 into Intracellular Vesicles
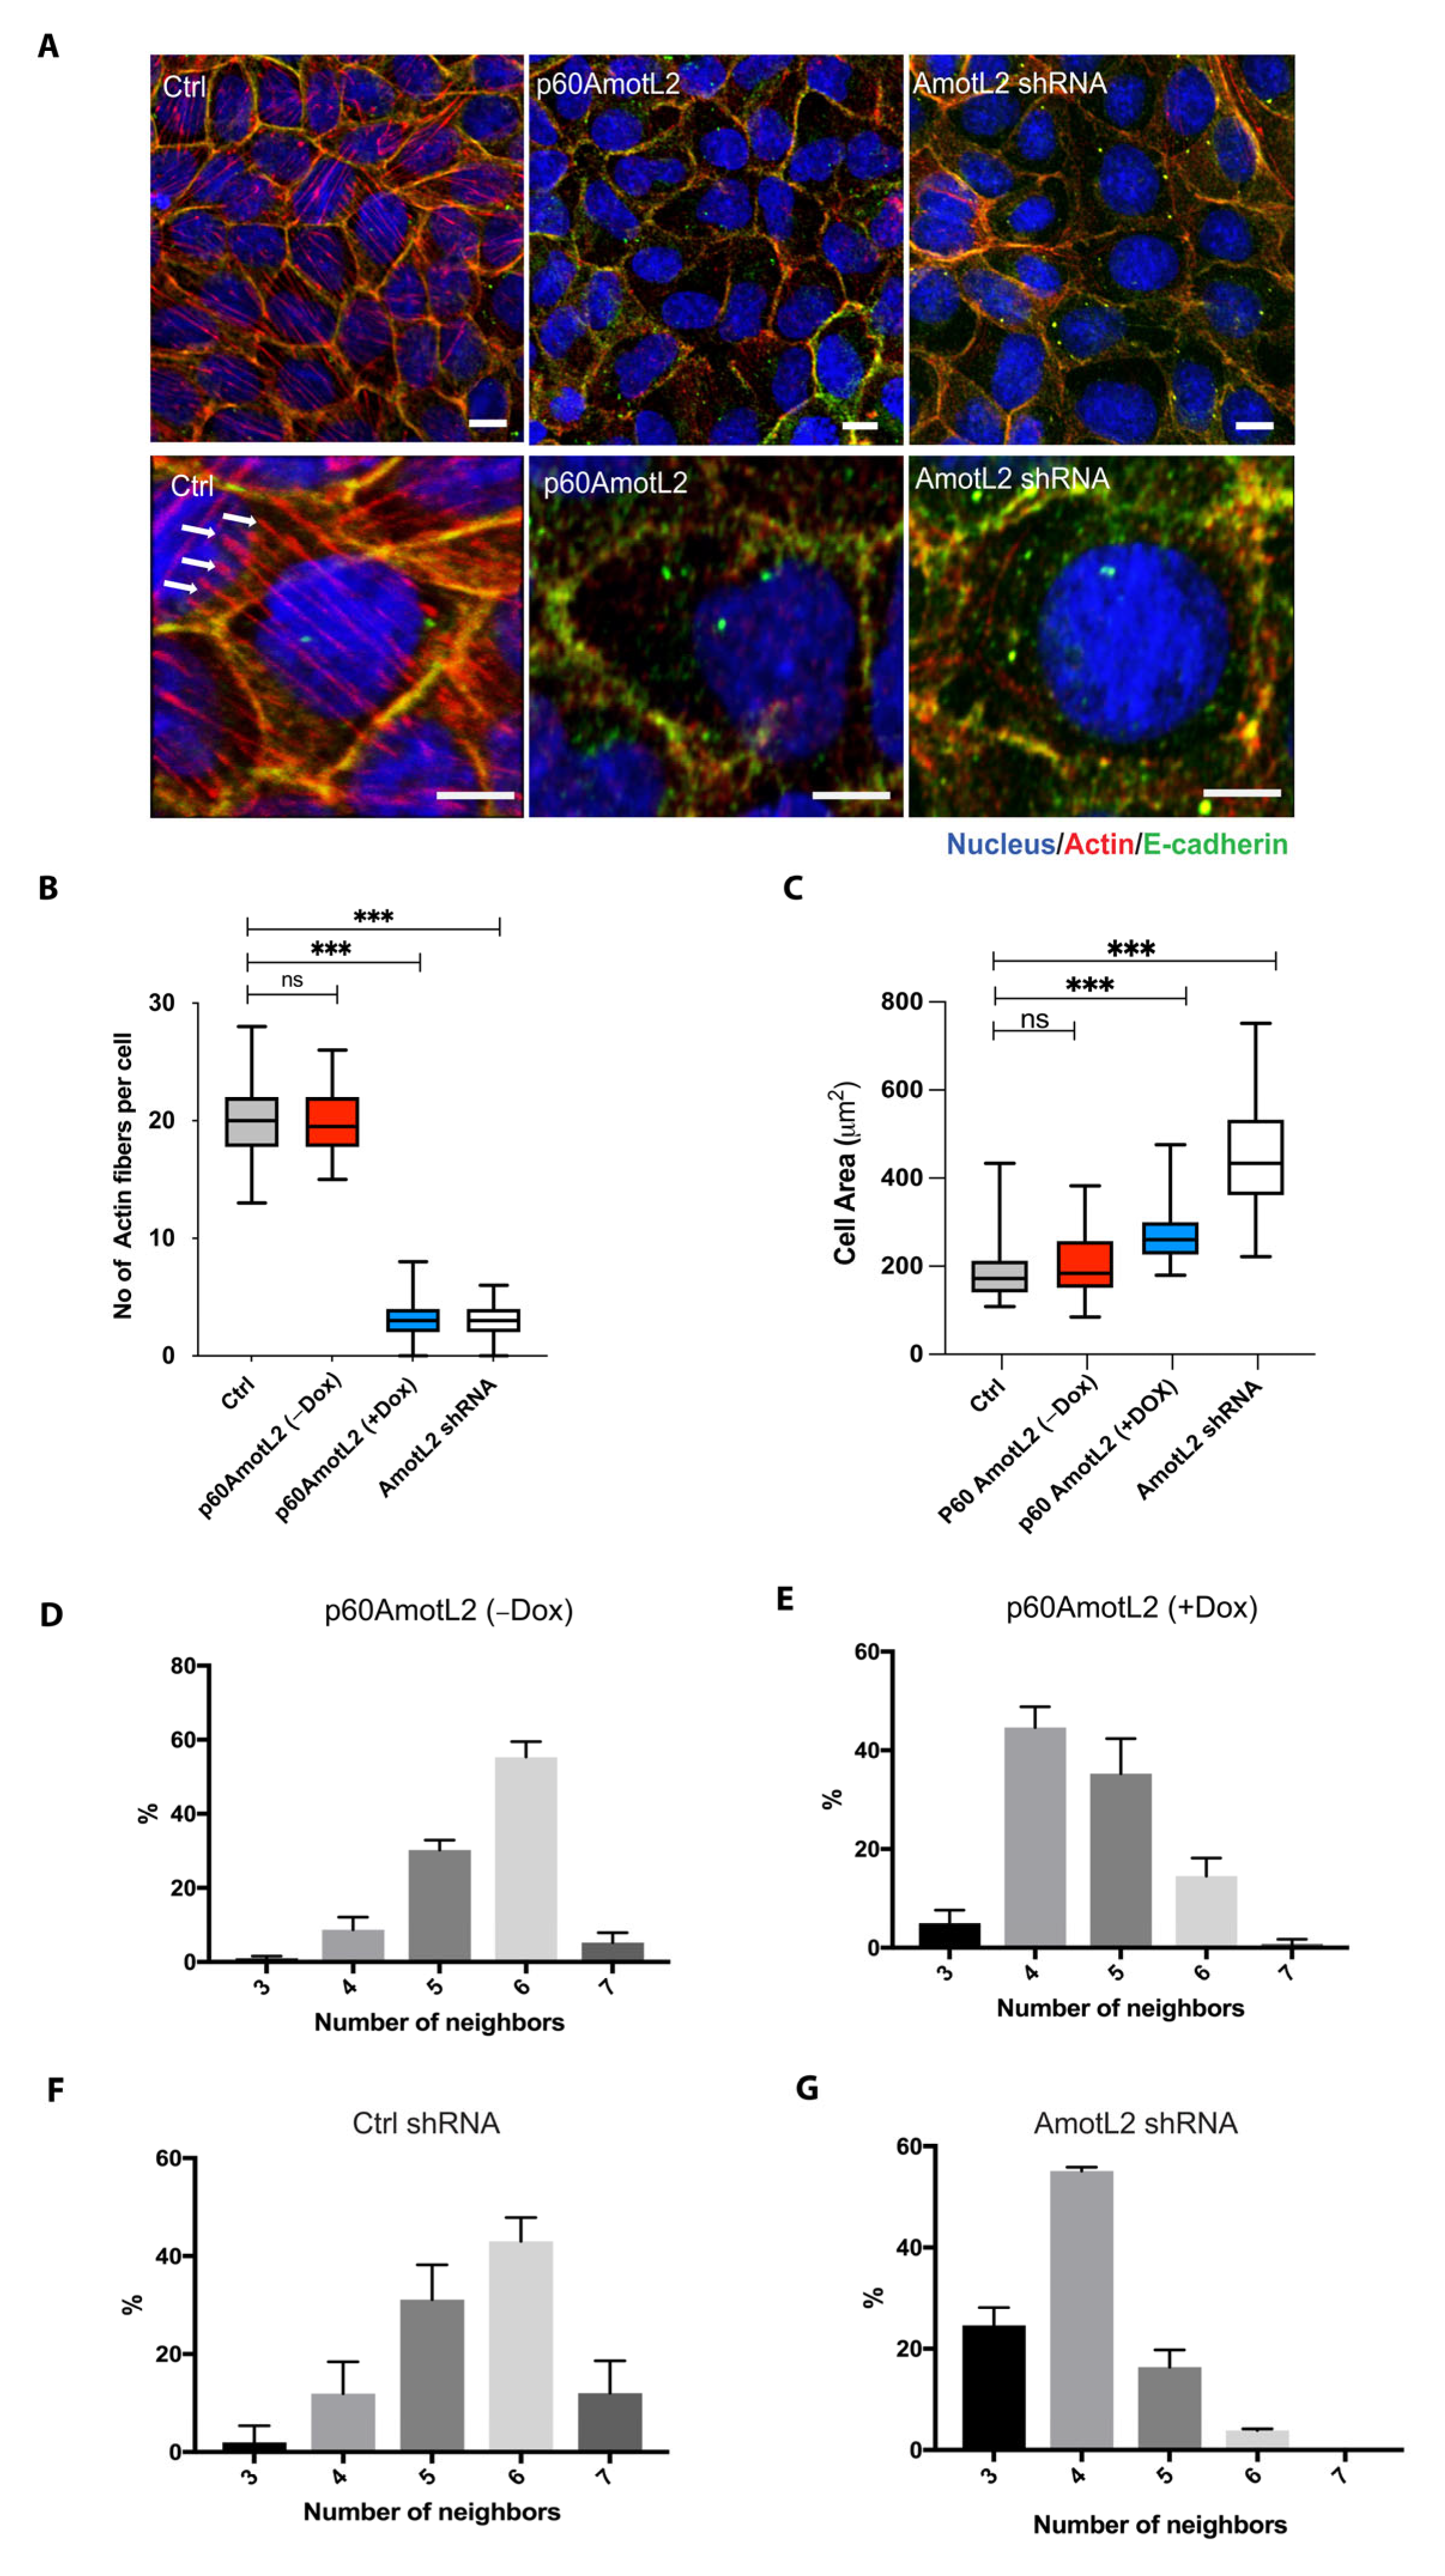
2.2. p60AmotL2 Mirrors the Effect of p100AmotL2 Depletion
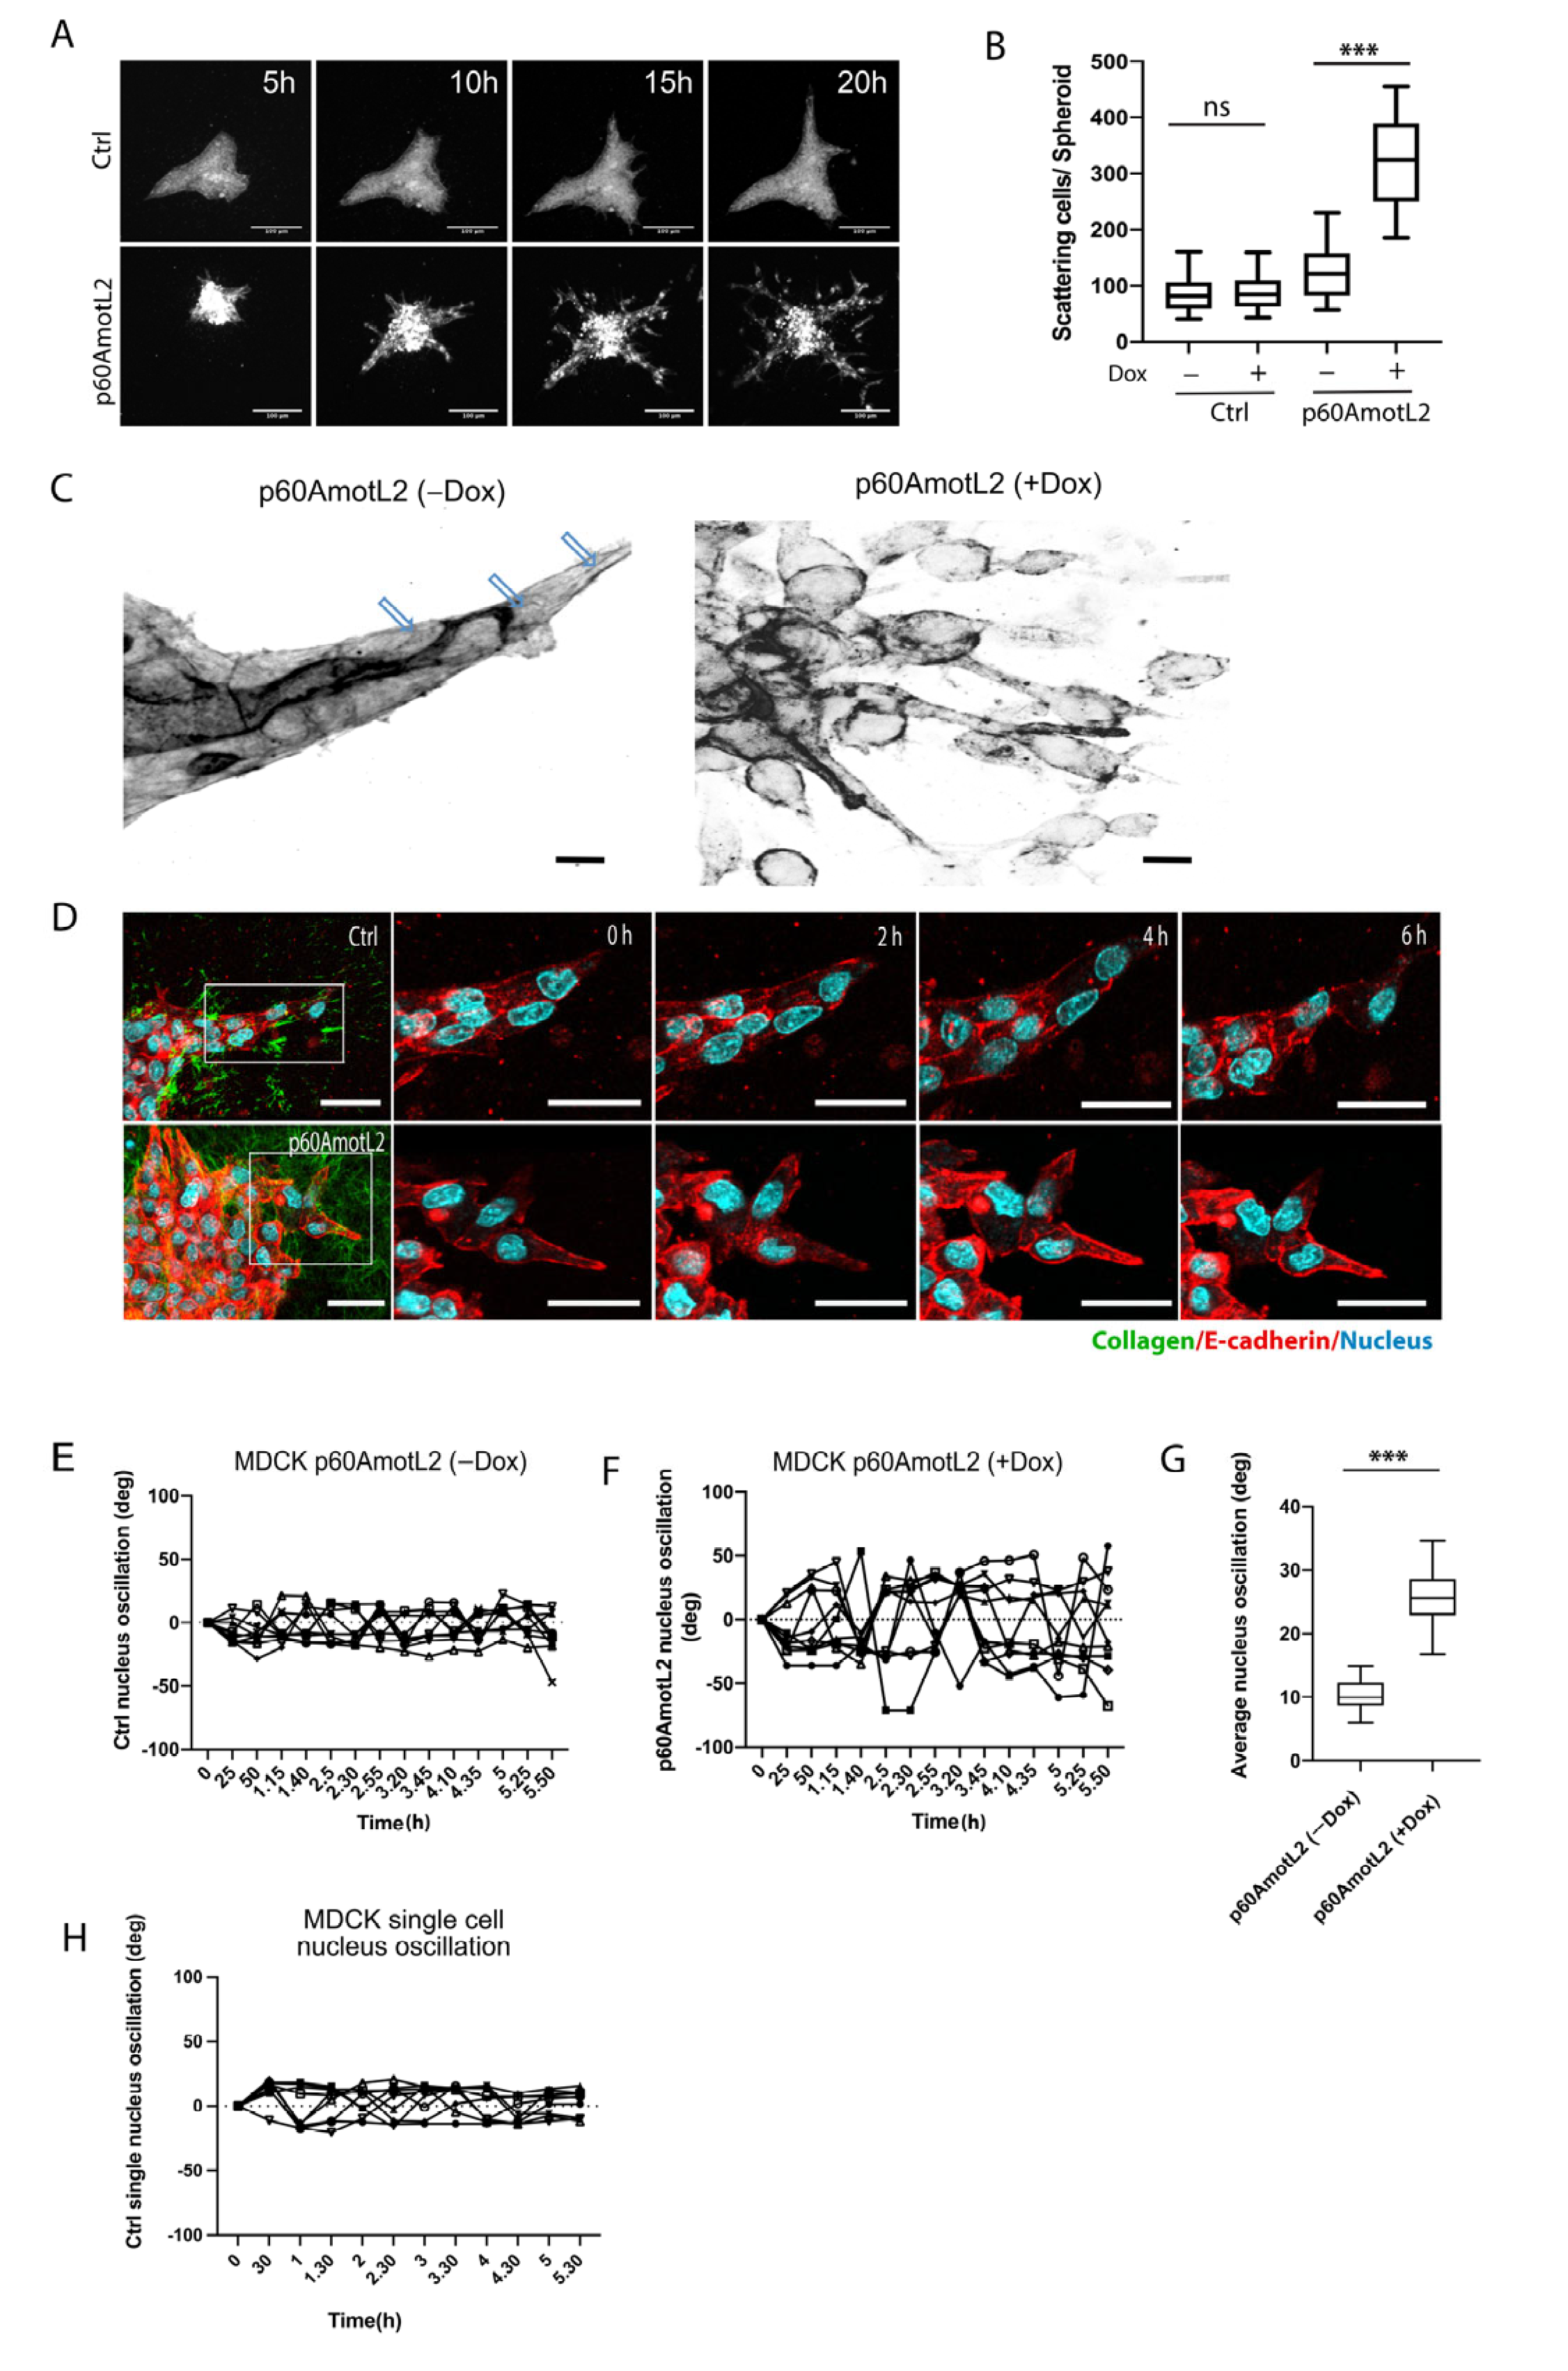
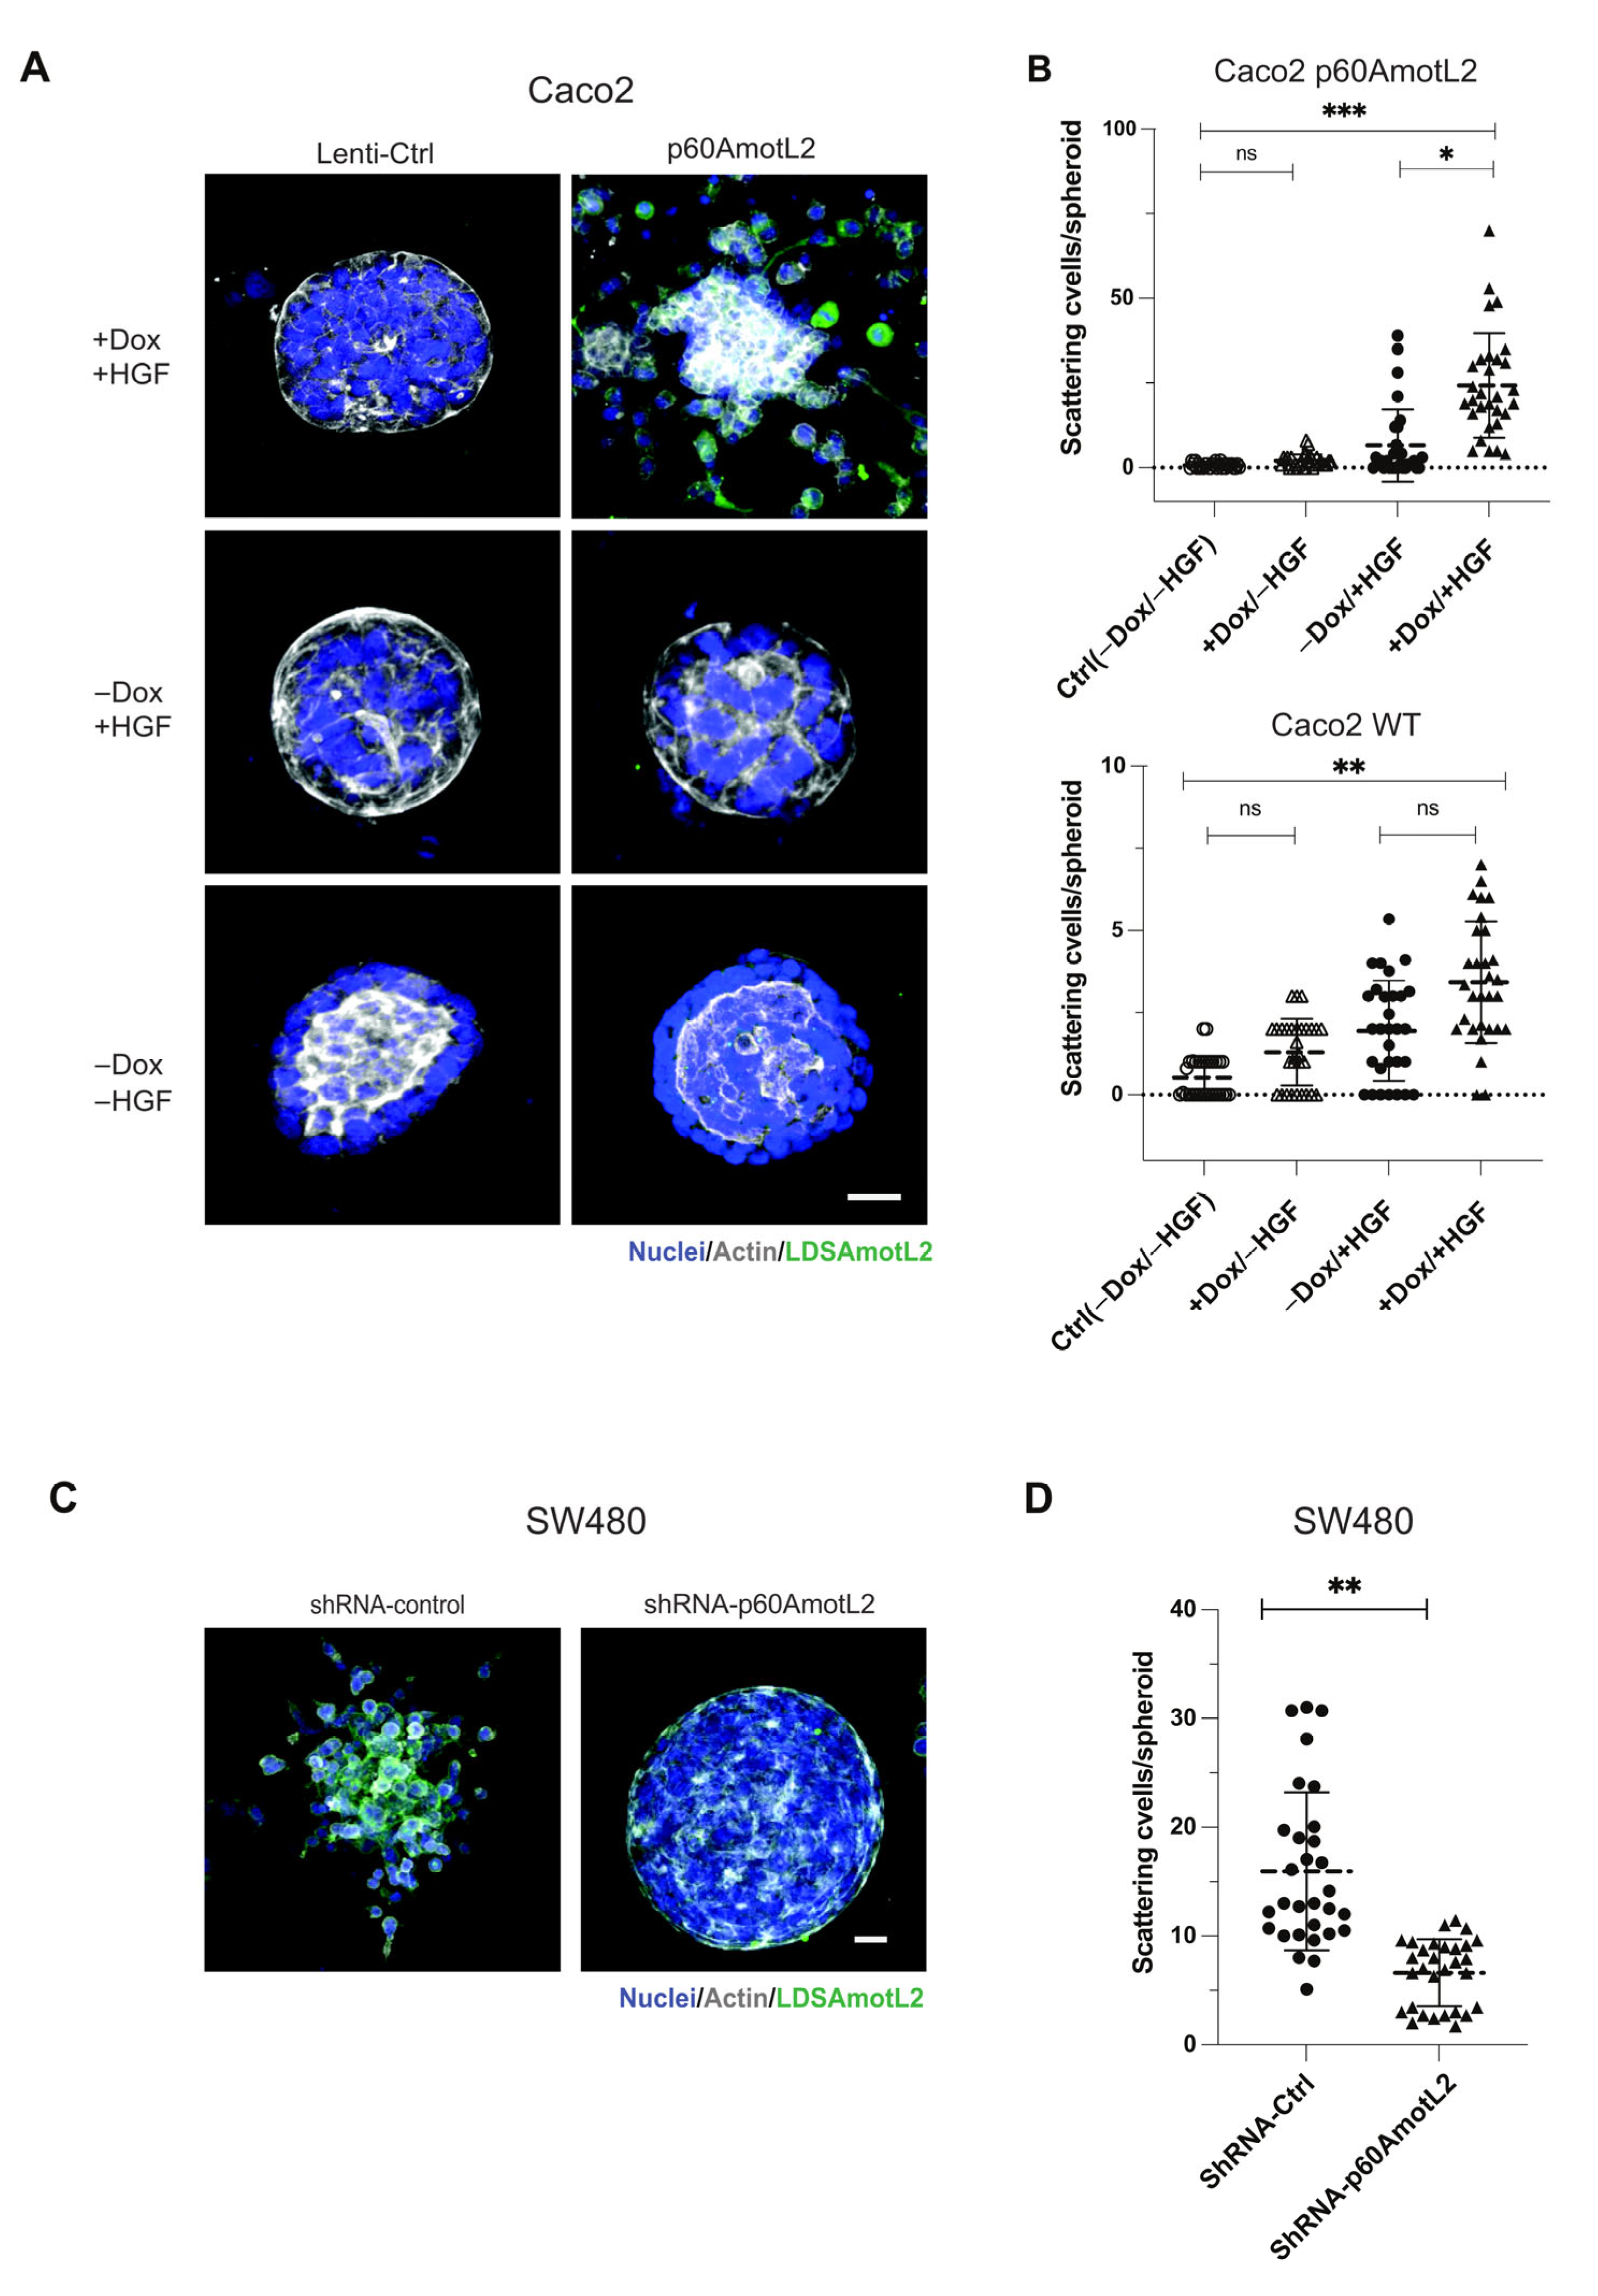
2.3. p60AmotL2 Induces Single Cell Invasion in 3D Collagen
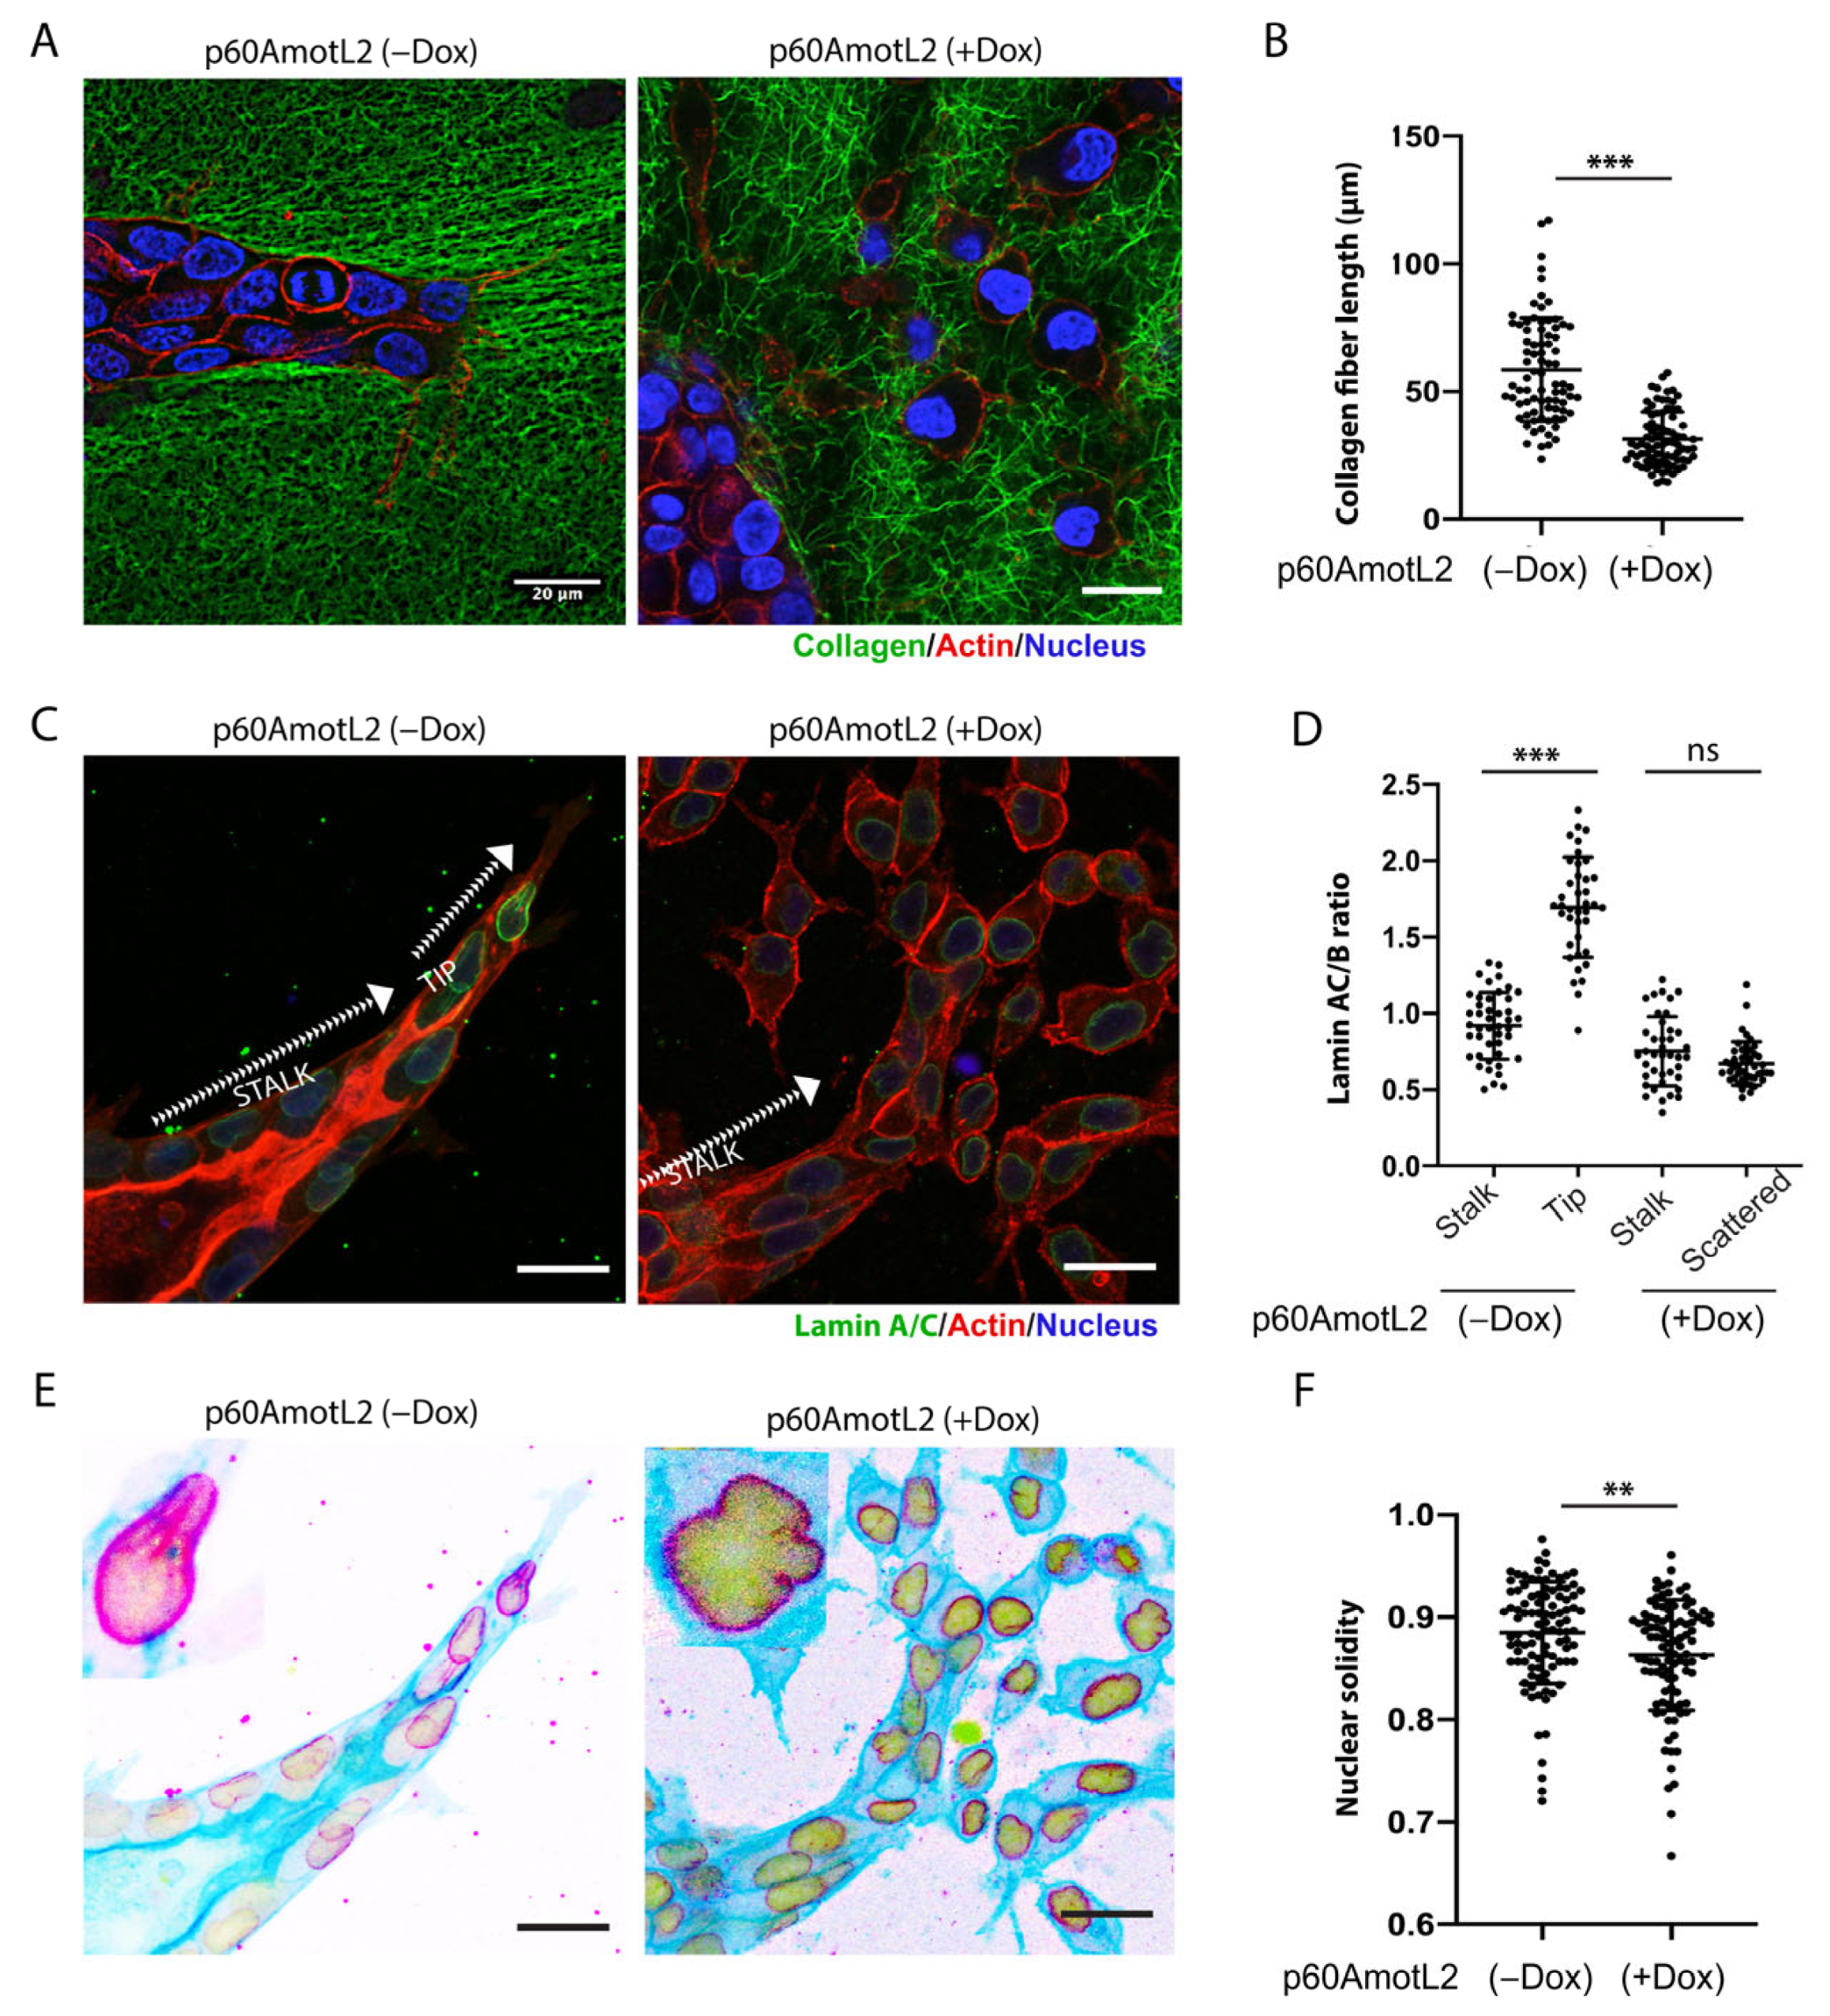
2.4. p60AmotL2 Negatively Affects Collagen Fiber Tension during 3-D Migration
2.5. p60AmotL2 Affects the Integrity of the Nuclear Membrane
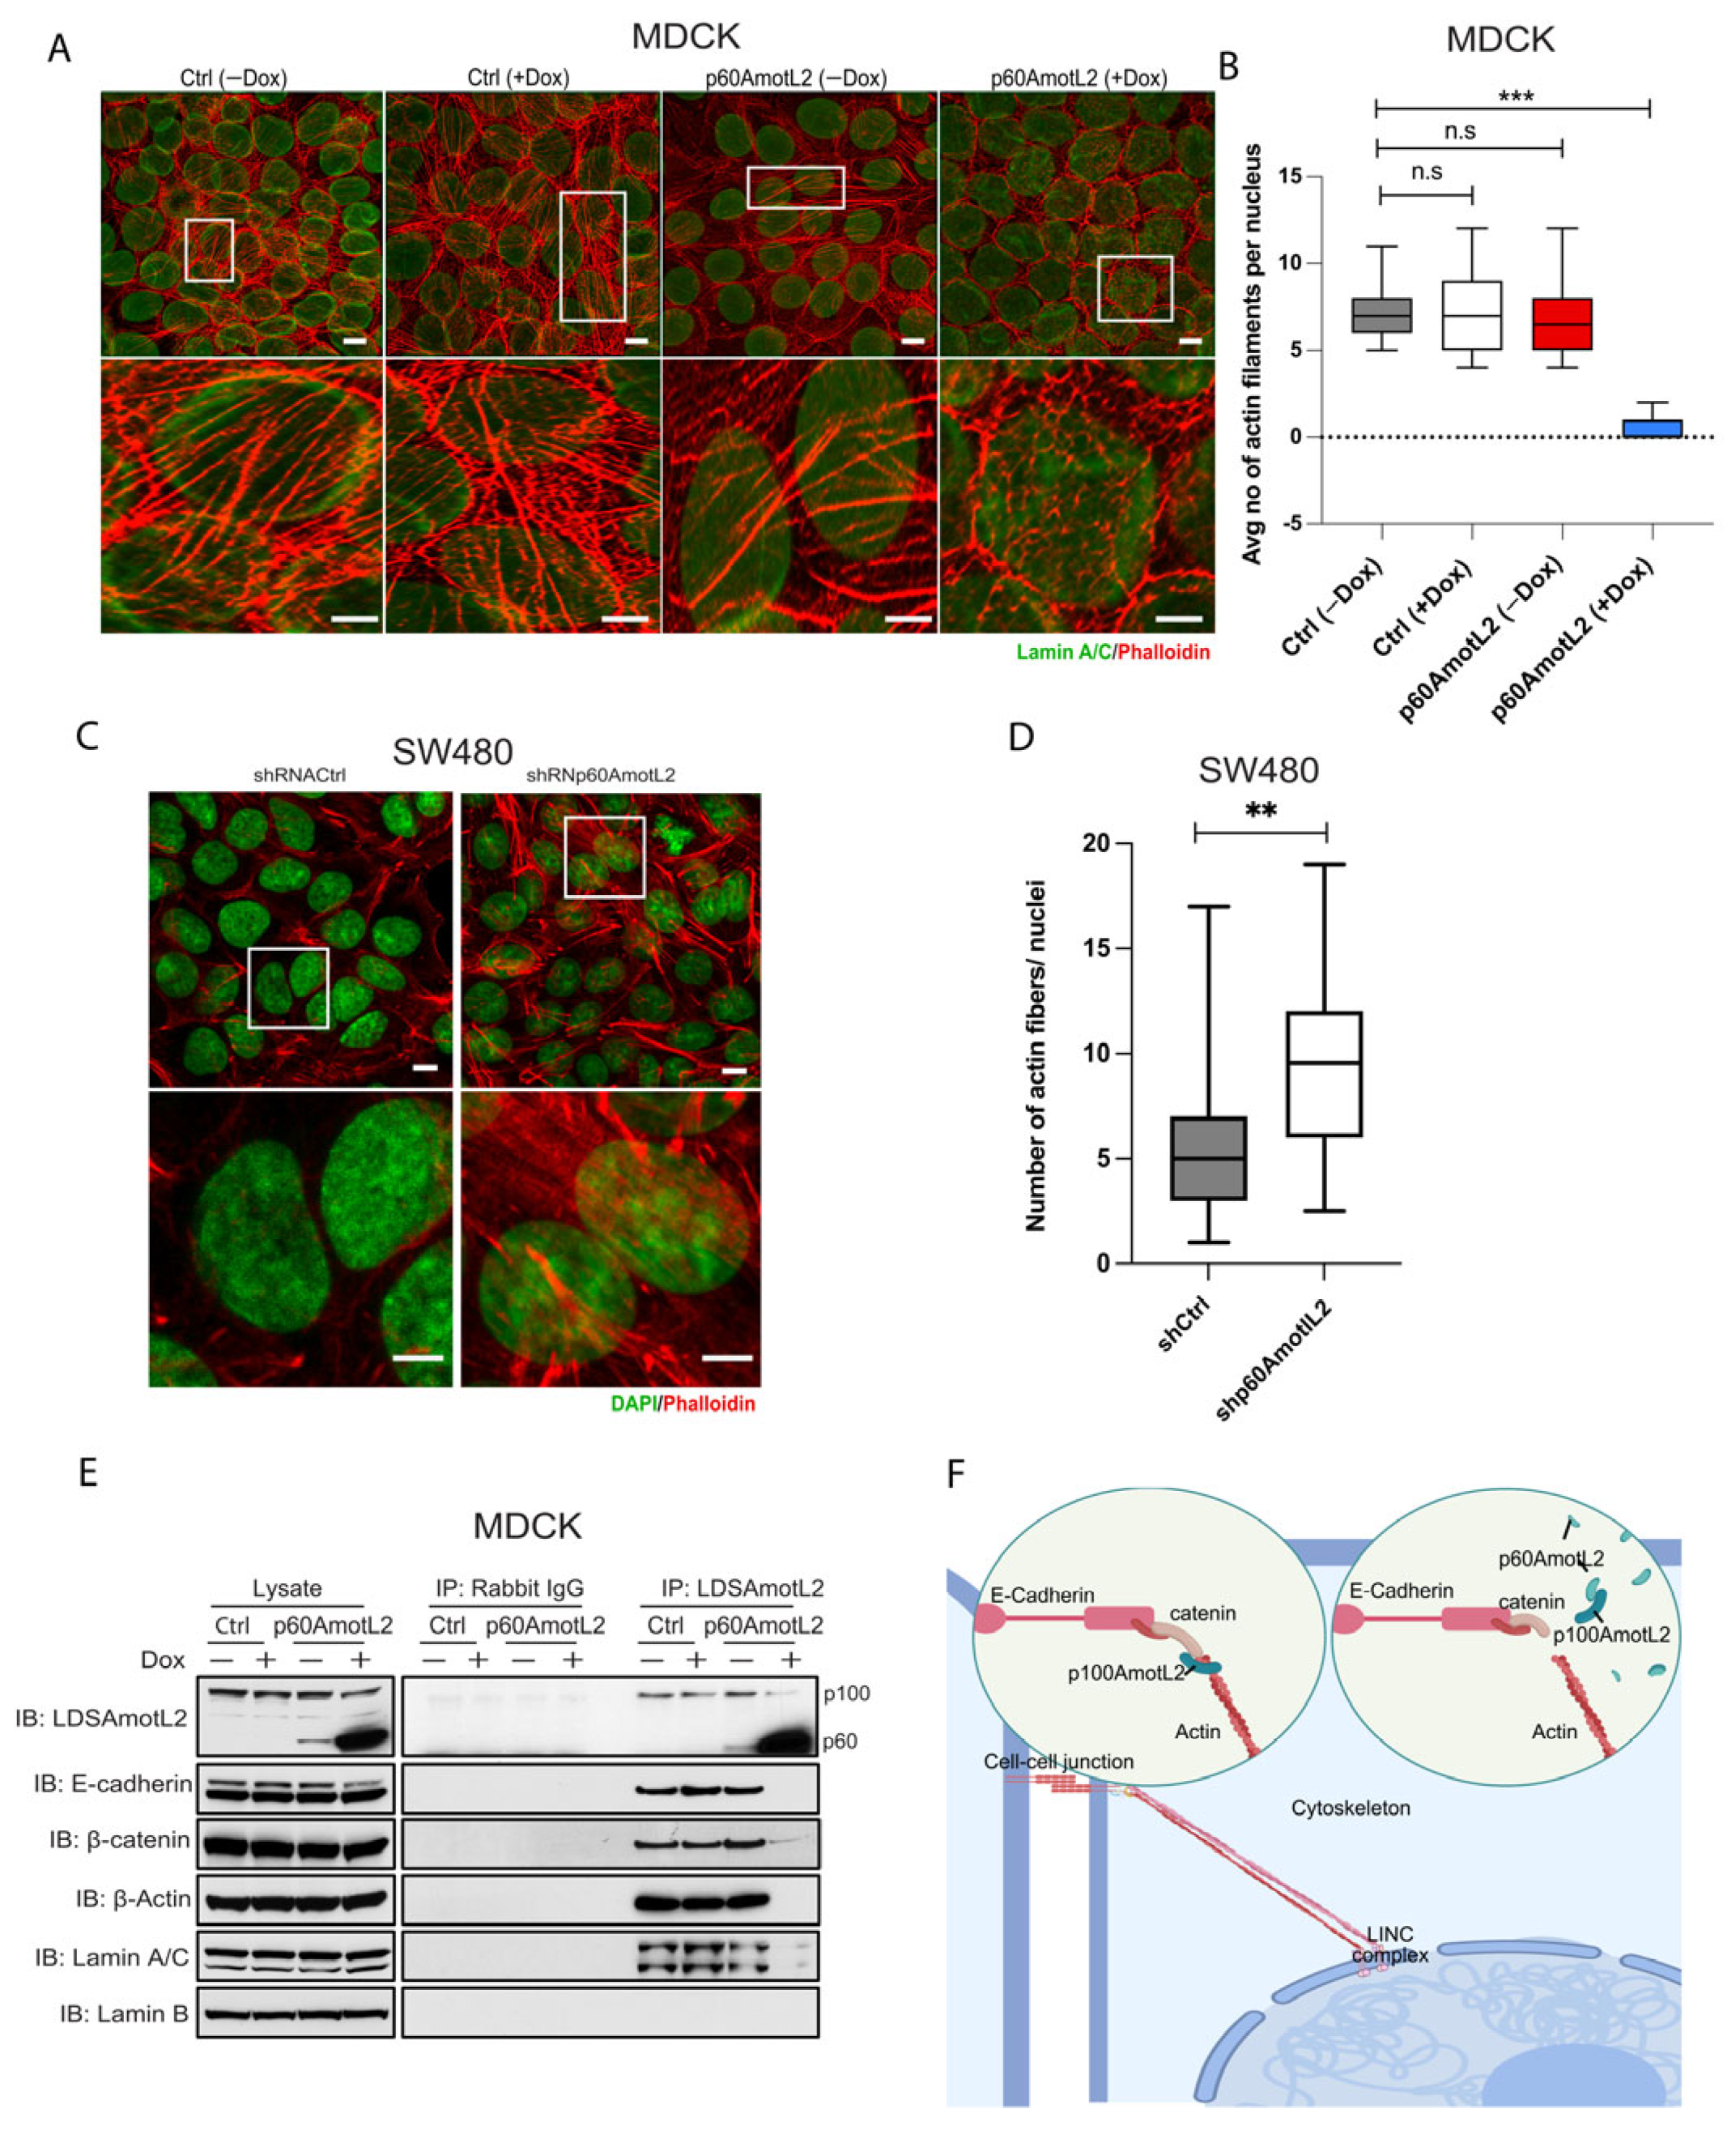
2.6. p60AmotL2 Detaches Radial Actin Filaments from the Nuclear Lamina
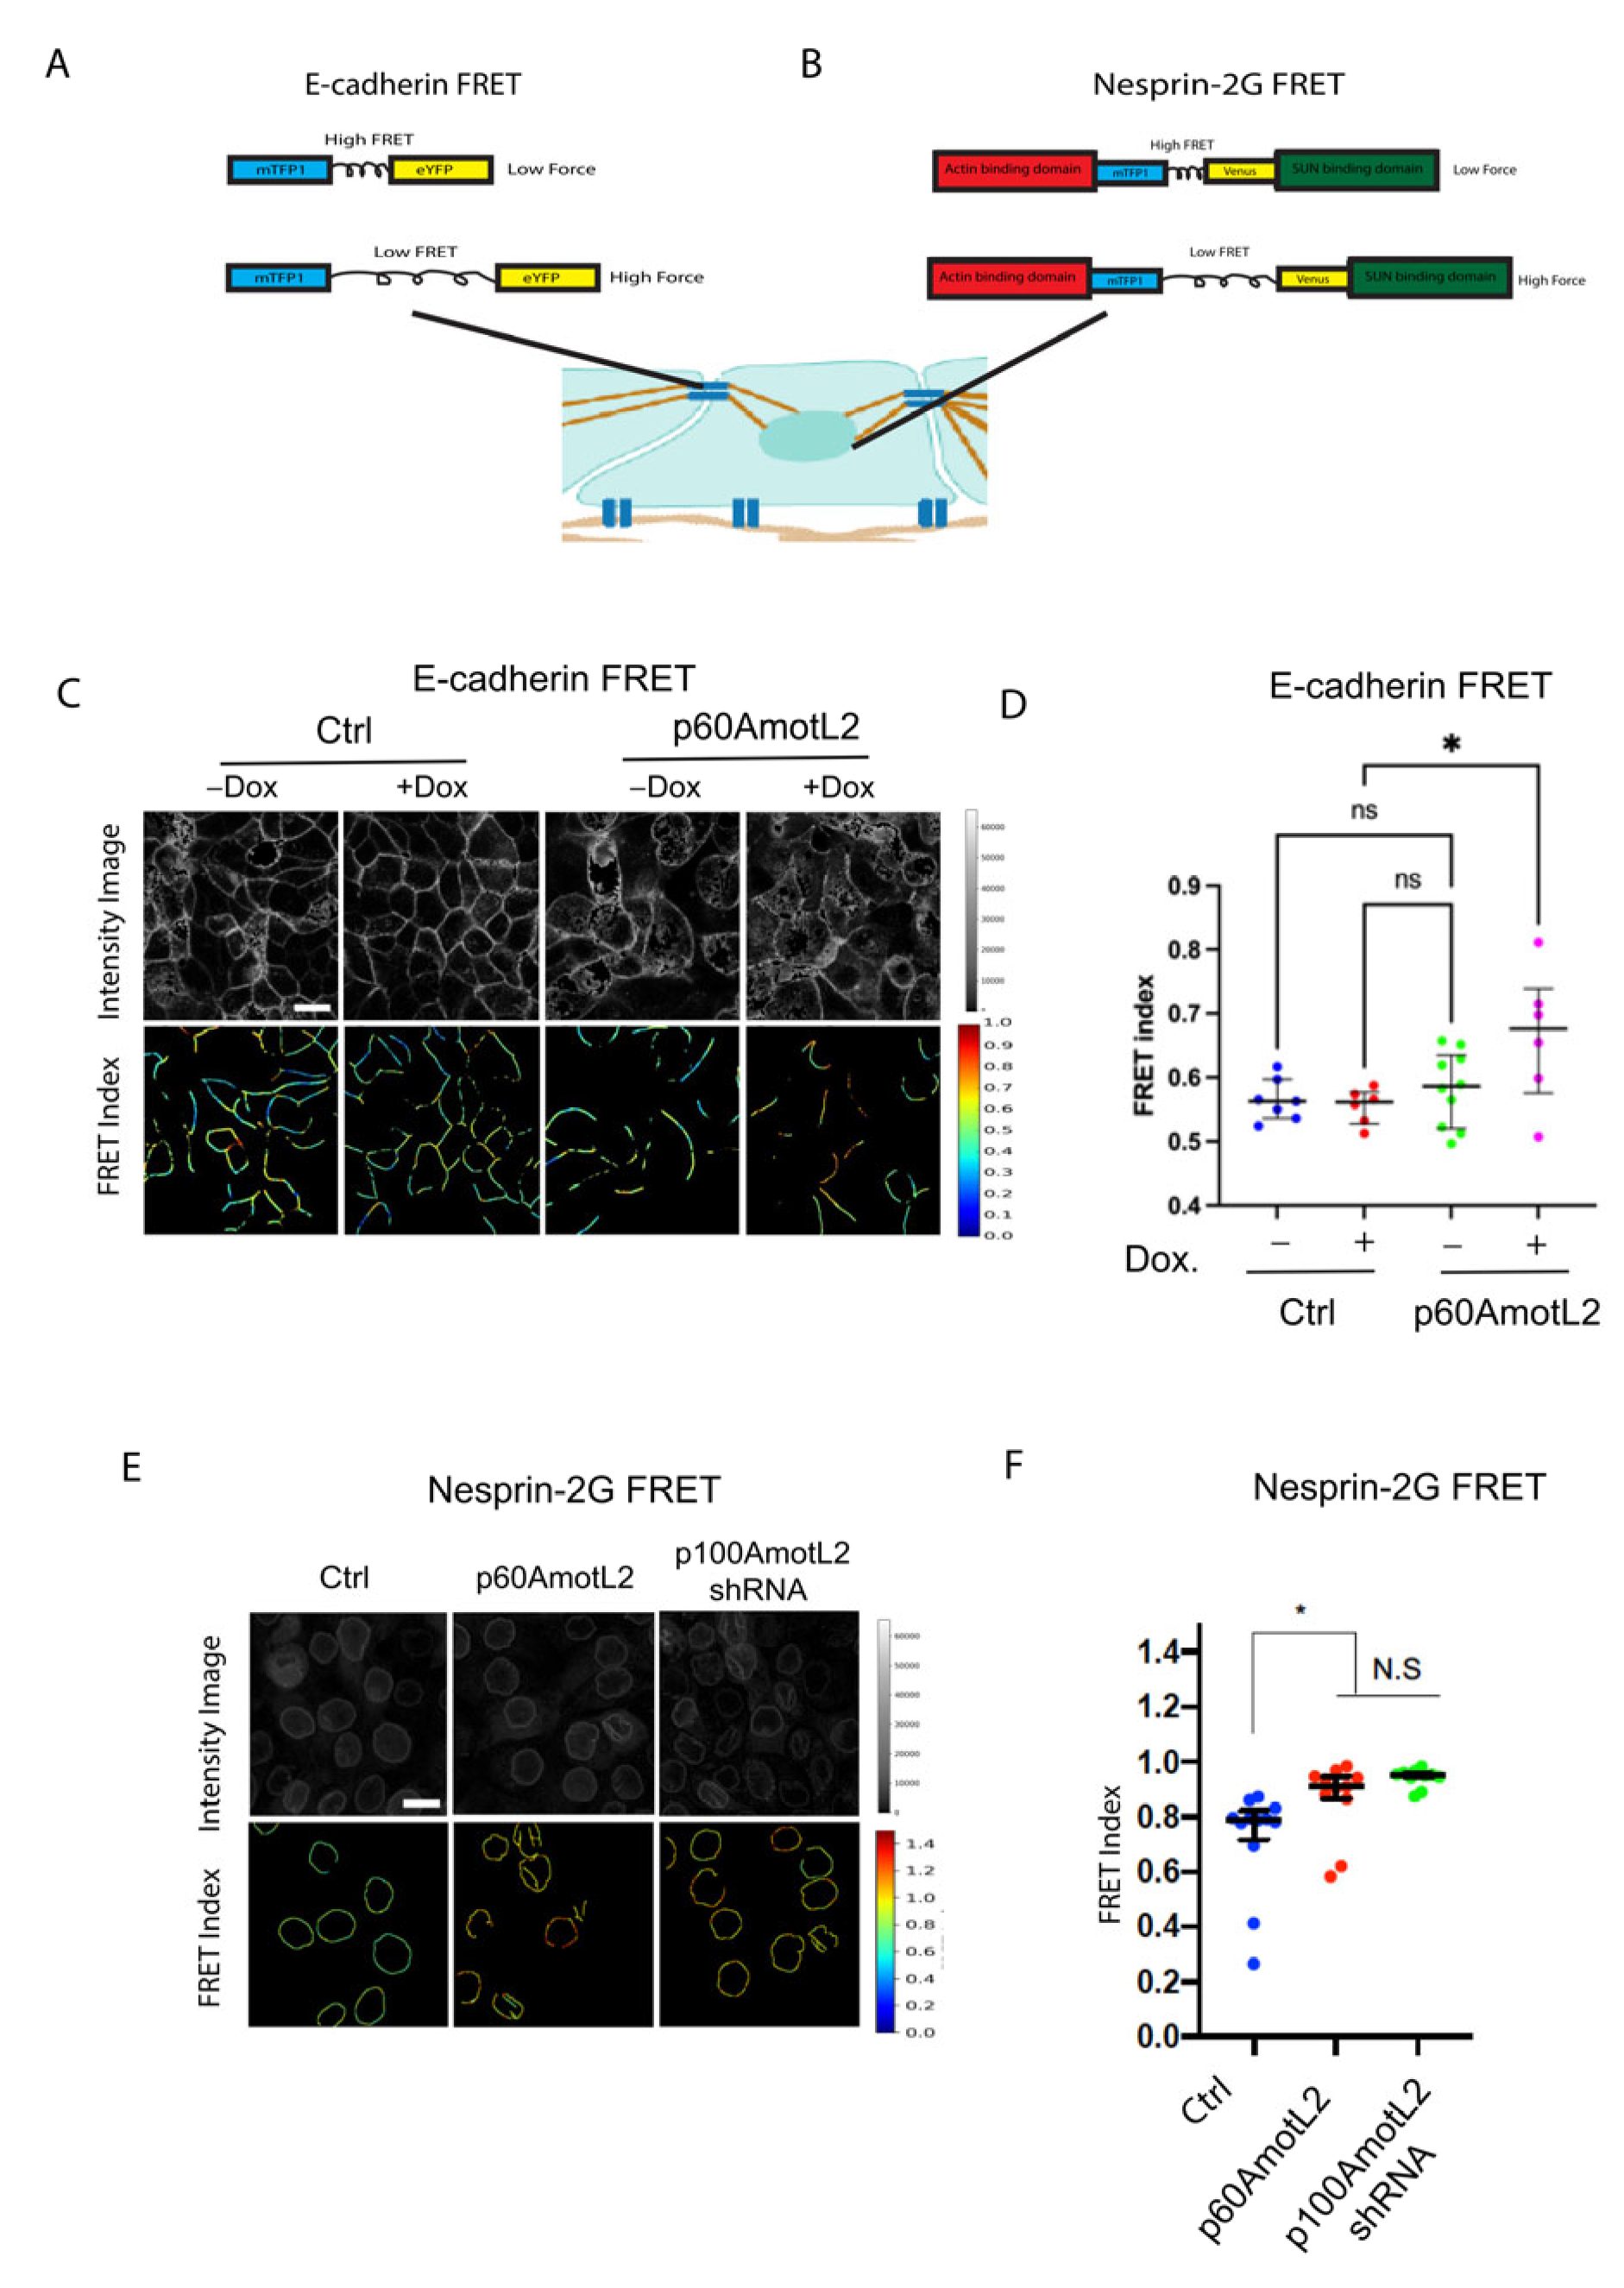
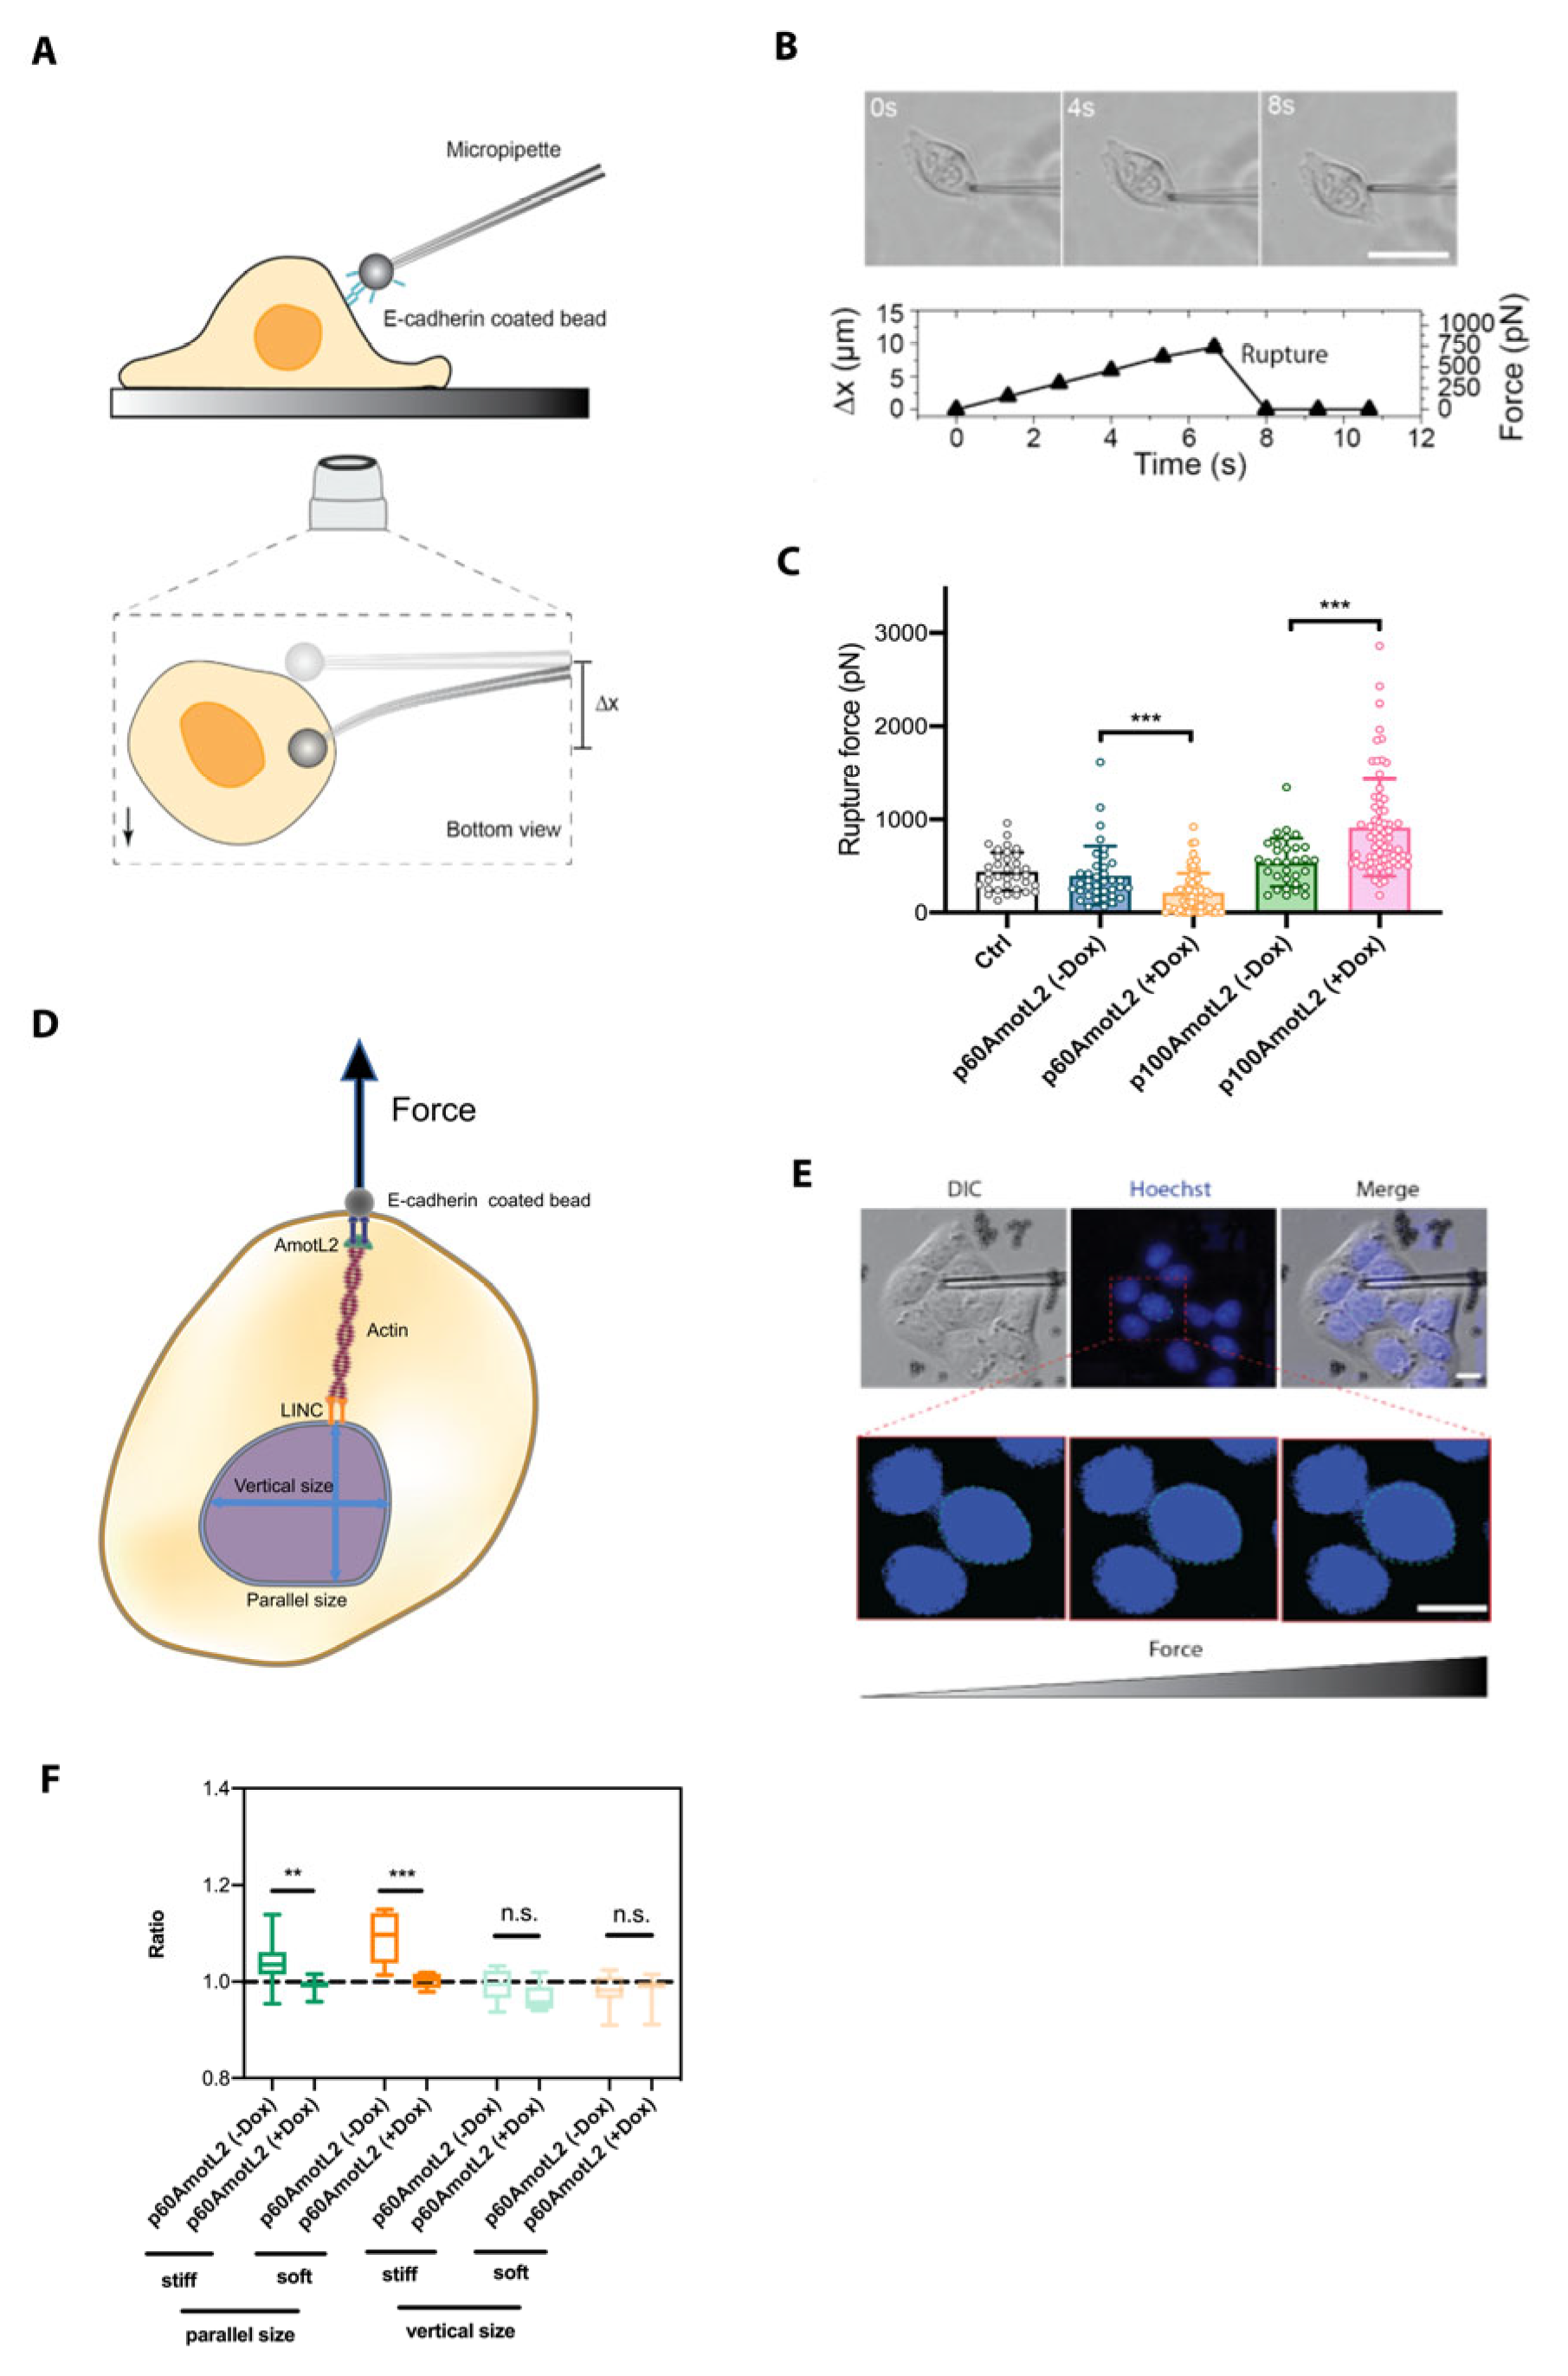
2.7. p60AmotL2 Impedes Force Transmission from Cell–Cell Junctions to the Nuclear Lamina
2.8. p60AmotL2 Modifies the Physical Properties of the Nuclear Membrane
2.9. p60AmotL2 Hinders the Transmission of Force from Cell–Cell Junctions to the Nuclear Lamina
3. Discussion
4. Material and Methods
4.1. Antibodies
4.2. Cell Culture
4.3. Western Blot (WB)
4.4. Co-Immunoprecipitation (co-IP)
4.5. Immunofluorescence Staining
4.6. Three-Dimensional (3-D) Cultures in Collagen Gels
4.7. Immunofluorescence Staining of 3-D Gels
4.8. Live Cell Imaging
4.9. Analysis of Nuclear Oscillation
4.10. Analysis of Lamin A/C to Lamin B Ratio
4.11. Analysis of Nuclear Solidity
4.12. Image Processing Using Super-Resolution Radial Fluctuations (SRRF)
4.13. FRET Imaging
4.14. Micropipette Force Probe (MFP)
4.14.1. Preparation of Microbeads and Micropipette
4.14.2. Adhesion Force Measurement
4.14.3. Micropipette Calibration
4.14.4. Nucleus Displacement
4.15. Atomic Force Microscope (AFM)
4.16. Transwell Migration Assay
4.17. Statistics
Supplementary Materials
Author Contributions
Funding
Institutional Review Board Statement
Informed Consent Statement
Data Availability Statement
Acknowledgments
Conflicts of Interest
References
- Gumbiner, B.M. Regulation of cadherin-mediated adhesion in morphogenesis. Nat. Rev. Mol. Cell. Biol. 2005, 6, 622–634. [Google Scholar] [CrossRef] [PubMed]
- Guillot, C.; Lecuit, T. Mechanics of epithelial tissue homeostasis and morphogenesis. Science 2013, 340, 1185–1189. [Google Scholar] [CrossRef]
- Iskratsch, T.; Wolfenson, H.; Sheetz, M.P. Appreciating force and shape—The rise of mechanotransduction in cell biology. Nat. Rev. Mol. Cell. Biol. 2014, 15, 825–833. [Google Scholar] [CrossRef]
- Yap, A.S.; Duszyc, K.; Viasnoff, V. Mechanosensing and Mechanotransduction at Cell-Cell Junctions. Cold Spring Harb. Perspect. Biol. 2018, 10, a028761. [Google Scholar] [CrossRef]
- Angulo-Urarte, A.; van der Wal, T.; Huveneers, S. Cell-cell junctions as sensors and transducers of mechanical forces. Biochim. Biophys. Acta Biomembr. 2020, 1862, 183316. [Google Scholar] [CrossRef] [PubMed]
- Budnar, S.; Yap, A.S. A mechanobiological perspective on cadherins and the actin-myosin cytoskeleton. F1000Prime Rep. 2013, 5, 35. [Google Scholar] [CrossRef]
- Takeichi, M. Dynamic contacts: Rearranging adherens junctions to drive epithelial remodelling. Nat. Rev. Mol. Cell. Biol. 2014, 15, 397–410. [Google Scholar] [CrossRef]
- Mehlen, P.; Puisieux, A. Metastasis: A question of life or death. Nat. Rev. Cancer 2006, 6, 449–458. [Google Scholar] [CrossRef] [PubMed]
- Chaffer, C.L.; Weinberg, R.A. A perspective on cancer cell metastasis. Science 2011, 331, 1559–1564. [Google Scholar] [CrossRef]
- Seyfried, T.N.; Huysentruyt, L.C. On the origin of cancer metastasis. Crit. Rev. Oncog. 2013, 18, 43–73. [Google Scholar] [CrossRef] [PubMed]
- Alix-Panabières, C.; Mader, S.; Pantel, K. Epithelial-mesenchymal plasticity in circulating tumor cells. J. Mol. Med. 2017, 95, 133–142. [Google Scholar] [CrossRef]
- Nieto, M.A. The ins and outs of the epithelial to mesenchymal transition in health and disease. Annu. Rev. Cell. Dev. Biol. 2011, 27, 347–376. [Google Scholar] [CrossRef] [PubMed]
- Lamouille, S.; Xu, J.; Derynck, R. Molecular mechanisms of epithelial-mesenchymal transition. Nat. Rev. Mol. Cell. Biol. 2014, 15, 178–196. [Google Scholar] [CrossRef] [PubMed]
- Huang, Q.Y.; Li, X.F.; Liu, S.P. E-cadherin and caveolin-1 alterations in the heart of rats having undergone chlorpromazine-induced toxicity. Mol. Med. Rep. 2012, 5, 705–709. [Google Scholar] [CrossRef]
- Serrano-Gomez, S.J.; Maziveyi, M.; Alahari, S.K. Regulation of epithelial-mesenchymal transition through epigenetic and post-translational modifications. Mol. Cancer 2016, 15, 18. [Google Scholar] [CrossRef]
- Wells, A.; Chao, Y.L.; Grahovac, J.; Wu, Q.; Lauffenburger, D.A. Epithelial and mesenchymal phenotypic switchings modulate cell motility in metastasis. Front. Biosci. (Landmark Ed) 2011, 16, 815–837. [Google Scholar] [CrossRef] [PubMed]
- Lambert, A.W.; Weinberg, R.A. Linking EMT programmes to normal and neoplastic epithelial stem cells. Nat. Rev. Cancer 2021, 21, 325–338. [Google Scholar] [CrossRef]
- Fischer, K.R.; Durrans, A.; Lee, S.; Sheng, J.; Li, F.; Wong, S.T.; Choi, H.; El Rayes, T.; Ryu, S.; Troeger, J.; et al. Epithelial-to-mesenchymal transition is not required for lung metastasis but contributes to chemoresistance. Nature 2015, 527, 472–476. [Google Scholar] [CrossRef]
- Williams, E.D.; Gao, D.; Redfern, A.; Thompson, E.W. Controversies around epithelial-mesenchymal plasticity in cancer metastasis. Nat. Rev. Cancer 2019, 19, 716–732. [Google Scholar] [CrossRef]
- Shamir, E.R.; Pappalardo, E.; Jorgens, D.M.; Coutinho, K.; Tsai, W.T.; Aziz, K.; Auer, M.; Tran, P.T.; Bader, J.S.; Ewald, A.J. Twist1-induced dissemination preserves epithelial identity and requires E-cadherin. J. Cell. Biol. 2014, 204, 839–856. [Google Scholar] [CrossRef]
- Padmanaban, V.; Krol, I.; Suhail, Y.; Szczerba, B.M.; Aceto, N.; Bader, J.S.; Ewald, A.J. E-cadherin is required for metastasis in multiple models of breast cancer. Nature 2019, 573, 439–444. [Google Scholar] [CrossRef]
- Pastushenko, I.; Brisebarre, A.; Sifrim, A.; Fioramonti, M.; Revenco, T.; Boumahdi, S.; Van Keymeulen, A.; Brown, D.; Moers, V.; Lemaire, S.; et al. Identification of the tumour transition states occurring during EMT. Nature 2018, 556, 463–468. [Google Scholar] [CrossRef]
- Pastushenko, I.; Blanpain, C. EMT Transition States during Tumor Progression and Metastasis. Trends Cell. Biol. 2019, 29, 212–226. [Google Scholar] [CrossRef] [PubMed]
- Loh, C.Y.; Chai, J.Y.; Tang, T.F.; Wong, W.F.; Sethi, G.; Shanmugam, M.K.; Chong, P.P.; Looi, C.Y. The E-Cadherin and N-Cadherin Switch in Epithelial-to-Mesenchymal Transition: Signaling, Therapeutic Implications, and Challenges. Cells 2019, 8, 1118. [Google Scholar] [CrossRef] [PubMed]
- Lu, W.; Kang, Y. Epithelial-Mesenchymal Plasticity in Cancer Progression and Metastasis. Dev. Cell. 2019, 49, 361–374. [Google Scholar] [CrossRef]
- Haerinck, J.; Goossens, S.; Berx, G. The epithelial-mesenchymal plasticity landscape: Principles of design and mechanisms of regulation. Nat. Rev. Genet. 2023. [Google Scholar] [CrossRef]
- Petrova, Y.I.; Schecterson, L.; Gumbiner, B.M. Roles for E-cadherin cell surface regulation in cancer. Mol. Biol. Cell. 2016, 27, 3233–3244. [Google Scholar] [CrossRef] [PubMed]
- Bratt, A.; Wilson, W.J.; Troyanovsky, B.; Aase, K.; Kessler, R.; Van Meir, E.G.; Holmgren, L. Angiomotin belongs to a novel protein family with conserved coiled-coil and PDZ binding domains. Gene 2002, 298, 69–77. [Google Scholar] [CrossRef]
- Moleirinho, S.; Guerrant, W.; Kissil, J.L. The Angiomotins—From discovery to function. FEBS Lett. 2014, 588, 2693–2703. [Google Scholar] [CrossRef]
- Nishimura, M.; Kakizaki, M.; Ono, Y.; Morimoto, K.; Takeuchi, M.; Inoue, Y.; Imai, T.; Takai, Y. JEAP, a novel component of tight junctions in exocrine cells. J. Biol. Chem. 2002, 277, 5583–5587. [Google Scholar] [CrossRef] [PubMed]
- Troyanovsky, B.; Levchenko, T.; Månsson, G.; Matvijenko, O.; Holmgren, L. Angiomotin: An angiostatin binding protein that regulates endothelial cell migration and tube formation. J. Cell. Biol. 2001, 152, 1247–1254. [Google Scholar] [CrossRef] [PubMed]
- Ernkvist, M.; Birot, O.; Sinha, I.; Veitonmaki, N.; Nyström, S.; Aase, K.; Holmgren, L. Differential roles of p80- and p130-angiomotin in the switch between migration and stabilization of endothelial cells. Biochim. Biophys. Acta 2008, 1783, 429–437. [Google Scholar] [CrossRef]
- Hildebrand, S.; Hultin, S.; Subramani, A.; Petropoulos, S.; Zhang, Y.; Cao, X.; Mpindi, J.; Kalloniemi, O.; Johansson, S.; Majumdar, A.; et al. The E-cadherin/AmotL2 complex organizes actin filaments required for epithelial hexagonal packing and blastocyst hatching. Sci. Rep. 2017, 7, 9540. [Google Scholar] [CrossRef] [PubMed]
- Hultin, S.; Zheng, Y.; Mojallal, M.; Vertuani, S.; Gentili, C.; Balland, M.; Milloud, R.; Belting, H.G.; Affolter, M.; Helker, C.S.; et al. AmotL2 links VE-cadherin to contractile actin fibres necessary for aortic lumen expansion. Nat. Commun. 2014, 5, 3743. [Google Scholar] [CrossRef]
- Zheng, Y.; Zhang, Y.; Barutello, G.; Chiu, K.; Arigoni, M.; Giampietro, C.; Cavallo, F.; Holmgren, L. Angiomotin like-1 is a novel component of the N-cadherin complex affecting endothelial/pericyte interaction in normal and tumor angiogenesis. Sci. Rep. 2016, 6, 30622. [Google Scholar] [CrossRef] [PubMed]
- Li, Y.; Zhou, H.; Li, F.; Chan, S.W.; Lin, Z.; Wei, Z.; Yang, Z.; Guo, F.; Lim, C.J.; Xing, W.; et al. Angiomotin binding-induced activation of Merlin/NF2 in the Hippo pathway. Cell. Res. 2015, 25, 801–817. [Google Scholar] [CrossRef]
- Sowa, M.E.; Bennett, E.J.; Gygi, S.P.; Harper, J.W. Defining the human deubiquitinating enzyme interaction landscape. Cell. 2009, 138, 389–403. [Google Scholar] [CrossRef]
- Wang, W.; Huang, J.; Chen, J. Angiomotin-like proteins associate with and negatively regulate YAP1. J. Biol. Chem. 2011, 286, 4364–4370. [Google Scholar] [CrossRef]
- Zhang, Y.; Zhang, Y.; Kameishi, S.; Barutello, G.; Zheng, Y.; Tobin, N.P.; Nicosia, J.; Hennig, K.; Chiu, D.K.; Balland, M.; et al. The Amot/integrin protein complex transmits mechanical forces required for vascular expansion. Cell. Rep. 2021, 36, 109616. [Google Scholar] [CrossRef]
- Chan, S.W.; Lim, C.J.; Guo, F.; Tan, I.; Leung, T.; Hong, W. Actin-binding and cell proliferation activities of angiomotin family members are regulated by Hippo pathway-mediated phosphorylation. J. Biol. Chem. 2013, 288, 37296–37307. [Google Scholar] [CrossRef]
- Feng, X.; Degese, M.S.; Iglesias-Bartolome, R.; Vaque, J.P.; Molinolo, A.A.; Rodrigues, M.; Zaidi, M.R.; Ksander, B.R.; Merlino, G.; Sodhi, A.; et al. Hippo-independent activation of YAP by the GNAQ uveal melanoma oncogene through a trio-regulated rho GTPase signaling circuitry. Cancer Cell. 2014, 25, 831–845. [Google Scholar] [CrossRef] [PubMed]
- Mana-Capelli, S.; Paramasivam, M.; Dutta, S.; McCollum, D. Angiomotins link F-actin architecture to Hippo pathway signaling. Mol. Biol. Cell. 2014, 25, 1676–1685. [Google Scholar] [CrossRef]
- Paramasivam, M.; Sarkeshik, A.; Yates, J.R.; Fernandes, M.J.; McCollum, D. Angiomotin family proteins are novel activators of the LATS2 kinase tumor suppressor. Mol. Biol. Cell. 2011, 22, 3725–3733. [Google Scholar] [CrossRef] [PubMed]
- Mojallal, M.; Zheng, Y.; Hultin, S.; Audebert, S.; van Harn, T.; Johnsson, P.; Lenander, C.; Fritz, N.; Mieth, C.; Corcoran, M.; et al. AmotL2 disrupts apical-basal cell polarity and promotes tumour invasion. Nat. Commun. 2014, 5, 4557. [Google Scholar] [CrossRef]
- Dupont, S.; Morsut, L.; Aragona, M.; Enzo, E.; Giulitti, S.; Cordenonsi, M.; Zanconato, F.; Le Digabel, J.; Forcato, M.; Bicciato, S.; et al. Role of YAP/TAZ in mechanotransduction. Nature 2011, 474, 179–183. [Google Scholar] [CrossRef] [PubMed]
- Dai, X.; Liu, H.; Shen, S.; Guo, X.; Yan, H.; Ji, X.; Li, L.; Huang, J.; Feng, X.H.; Zhao, B. YAP activates the Hippo pathway in a negative feedback loop. Cell. Res. 2015, 25, 1175–1178. [Google Scholar] [CrossRef]
- Grijalva, J.L.; Huizenga, M.; Mueller, K.; Rodriguez, S.; Brazzo, J.; Camargo, F.; Sadri-Vakili, G.; Vakili, K. Dynamic alterations in Hippo signaling pathway and YAP activation during liver regeneration. Am. J. Physiol. Gastrointest. Liver Physiol. 2014, 307, G196–G204. [Google Scholar] [CrossRef]
- Zhang, Y.; Zhang, Y.; Hutterer, E.; Hultin, S.; Bergman, O.; Kolbeinsdottir, S.; Jin, H.; Forteza, M.J.; Ketelhuth, D.F.J.; Roy, J.; et al. The VE-cadherin/AmotL2 mechanosensory pathway suppresses aortic inflammation and the formation of abdominal aortic aneurysms. Nat. Cardiovasc. Res. 2023, in press. [Google Scholar]
- Montesano, R.; Matsumoto, K.; Nakamura, T.; Orci, L. Identification of a fibroblast-derived epithelial morphogen as hepatocyte growth factor. Cell 1991, 67, 901–908. [Google Scholar] [CrossRef]
- Tabdanov, E.; Borghi, N.; Brochard-Wyart, F.; Dufour, S.; Thiery, J.P. Role of E-cadherin in membrane-cortex interaction probed by nanotube extrusion. Biophys. J. 2009, 96, 2457–2465. [Google Scholar] [CrossRef]
- Geudens, I.; Gerhardt, H. Coordinating cell behaviour during blood vessel formation. Development 2011, 138, 4569–4583. [Google Scholar] [CrossRef]
- Schuldt, A. Mechanotransduction: Lamin A for tension relief. Nat. Rev. Mol. Cell. Biol. 2013, 14, 610. [Google Scholar] [CrossRef]
- Lammerding, J.; Hsiao, J.; Schulze, P.C.; Kozlov, S.; Stewart, C.L.; Lee, R.T. Abnormal nuclear shape and impaired mechanotransduction in emerin-deficient cells. J. Cell. Biol. 2005, 170, 781–791. [Google Scholar] [CrossRef]
- Lekka, M.; Laidler, P.; Gil, D.; Lekki, J.; Stachura, Z.; Hrynkiewicz, A.Z. Elasticity of normal and cancerous human bladder cells studied by scanning force microscopy. Eur. Biophys. J. 1999, 28, 312–316. [Google Scholar] [CrossRef] [PubMed]
- Cano, A.; Pérez-Moreno, M.A.; Rodrigo, I.; Locascio, A.; Blanco, M.J.; del Barrio, M.G.; Portillo, F.; Nieto, M.A. The transcription factor snail controls epithelial-mesenchymal transitions by repressing E-cadherin expression. Nat. Cell. Biol. 2000, 2, 76–83. [Google Scholar] [CrossRef] [PubMed]
- Onder, T.T.; Gupta, P.B.; Mani, S.A.; Yang, J.; Lander, E.S.; Weinberg, R.A. Loss of E-cadherin promotes metastasis via multiple downstream transcriptional pathways. Cancer Res. 2008, 68, 3645–3654. [Google Scholar] [CrossRef] [PubMed]
- Fan, L.; Wang, H.; Xia, X.; Rao, Y.; Ma, X.; Ma, D.; Wu, P.; Chen, G. Loss of E-cadherin promotes prostate cancer metastasis via upregulation of metastasis-associated gene 1 expression. Oncol. Lett. 2012, 4, 1225–1233. [Google Scholar] [CrossRef]
- Mammoto, T.; Mammoto, A.; Ingber, D.E. Mechanobiology and developmental control. Annu. Rev. Cell. Dev. Biol. 2013, 29, 27–61. [Google Scholar] [CrossRef]
- Groschwitz, K.R.; Hogan, S.P. Intestinal barrier function: Molecular regulation and disease pathogenesis. J. Allergy Clin. Immunol. 2009, 124, 3–20, quiz 21–22. [Google Scholar] [CrossRef]
- Marchiando, A.M.; Shen, L.; Graham, W.V.; Weber, C.R.; Schwarz, B.T.; Austin, J.R.; Raleigh, D.R.; Guan, Y.; Watson, A.J.; Montrose, M.H.; et al. Caveolin-1-dependent occludin endocytosis is required for TNF-induced tight junction regulation in vivo. J. Cell. Biol. 2010, 189, 111–126. [Google Scholar] [CrossRef] [PubMed]
- Delgado, M.E.; Grabinger, T.; Brunner, T. Cell death at the intestinal epithelial front line. FEBS J. 2016, 283, 2701–2719. [Google Scholar] [CrossRef] [PubMed]
- Isermann, P.; Lammerding, J. Nuclear mechanics and mechanotransduction in health and disease. Curr. Biol. 2013, 23, R1113–R1121. [Google Scholar] [CrossRef] [PubMed]
- Denais, C.M.; Gilbert, R.M.; Isermann, P.; McGregor, A.L.; te Lindert, M.; Weigelin, B.; Davidson, P.M.; Friedl, P.; Wolf, K.; Lammerding, J. Nuclear envelope rupture and repair during cancer cell migration. Science 2016, 352, 353–358. [Google Scholar] [CrossRef]
- Isermann, P.; Lammerding, J. Consequences of a tight squeeze: Nuclear envelope rupture and repair. Nucleus 2017, 8, 268–274. [Google Scholar] [CrossRef] [PubMed]
- Bell, E.S.; Shah, P.; Zuela-Sopilniak, N.; Kim, D.; Varlet, A.A.; Morival, J.L.P.; McGregor, A.L.; Isermann, P.; Davidson, P.M.; Elacqua, J.J.; et al. Low lamin A levels enhance confined cell migration and metastatic capacity in breast cancer. Oncogene 2022, 41, 4211–4230. [Google Scholar] [CrossRef]
- Harada, T.; Swift, J.; Irianto, J.; Shin, J.W.; Spinler, K.R.; Athirasala, A.; Diegmiller, R.; Dingal, P.C.; Ivanovska, I.L.; Discher, D.E. Nuclear lamin stiffness is a barrier to 3D migration, but softness can limit survival. J. Cell. Biol. 2014, 204, 669–682. [Google Scholar] [CrossRef]
- Krause, M.; Yang, F.W.; Te Lindert, M.; Isermann, P.; Schepens, J.; Maas, R.J.A.; Venkataraman, C.; Lammerding, J.; Madzvamuse, A.; Hendriks, W.; et al. Cell migration through three-dimensional confining pores: Speed accelerations by deformation and recoil of the nucleus. Philos. Trans. R Soc. Lond. B Biol. Sci. 2019, 374, 20180225. [Google Scholar] [CrossRef]
- Buxboim, A.; Swift, J.; Irianto, J.; Spinler, K.R.; Dingal, P.C.; Athirasala, A.; Kao, Y.R.; Cho, S.; Harada, T.; Shin, J.W.; et al. Matrix elasticity regulates lamin-A,C phosphorylation and turnover with feedback to actomyosin. Curr. Biol. 2014, 24, 1909–1917. [Google Scholar] [CrossRef]
- Culley, S.; Tosheva, K.L.; Matos Pereira, P.; Henriques, R. SRRF: Universal live-cell super-resolution microscopy. Int. J. Biochem. Cell. Biol. 2018, 101, 74–79. [Google Scholar] [CrossRef]
- Gustafsson, N.; Culley, S.; Ashdown, G.; Owen, D.M.; Pereira, P.M.; Henriques, R. Fast live-cell conventional fluorophore nanoscopy with ImageJ through super-resolution radial fluctuations. Nat. Commun. 2016, 7, 12471. [Google Scholar] [CrossRef]
- Han, Y.; Lu, X.; Zhang, Z.; Liu, W.; Chen, Y.; Liu, X.; Hao, X.; Kuang, C. Ultra-fast, universal super-resolution radial fluctuations (SRRF) algorithm for live-cell super-resolution microscopy. Opt. Express 2019, 27, 38337–38348. [Google Scholar] [CrossRef]
- Borghi, N.; Sorokina, M.; Shcherbakova, O.G.; Weis, W.I.; Pruitt, B.L.; Nelson, W.J.; Dunn, A.R. E-cadherin is under constitutive actomyosin-generated tension that is increased at cell-cell contacts upon externally applied stretch. Proc. Natl. Acad. Sci. USA 2012, 109, 12568–12573. [Google Scholar] [CrossRef]
- Arsenovic, P.T.; Ramachandran, I.; Bathula, K.; Zhu, R.; Narang, J.D.; Noll, N.A.; Lemmon, C.A.; Gundersen, G.G.; Conway, D.E. Nesprin-2G, a Component of the Nuclear LINC Complex, Is Subject to Myosin-Dependent Tension. Biophys. J. 2016, 110, 34–43. [Google Scholar] [CrossRef]
- Poirier, M.; Eroglu, S.; Chatenay, D.; Marko, J.F. Reversible and irreversible unfolding of mitotic newt chromosomes by applied force. Mol. Biol. Cell. 2000, 11, 269–276. [Google Scholar] [CrossRef]
- Yu, M.; Yuan, X.; Lu, C.; Le, S.; Kawamura, R.; Efremov, A.K.; Zhao, Z.; Kozlov, M.M.; Sheetz, M.; Bershadsky, A.; et al. mDia1 senses both force and torque during F-actin filament polymerization. Nat. Commun. 2017, 8, 1650. [Google Scholar] [CrossRef] [PubMed]
- Palchesko, R.N.; Zhang, L.; Sun, Y.; Feinberg, A.W. Development of polydimethylsiloxane substrates with tunable elastic modulus to study cell mechanobiology in muscle and nerve. PLoS ONE 2012, 7, e51499. [Google Scholar] [CrossRef] [PubMed]
- Lekka, M. Discrimination Between Normal and Cancerous Cells Using AFM. Bionanoscience 2016, 6, 65–80. [Google Scholar] [CrossRef] [PubMed]


Disclaimer/Publisher’s Note: The statements, opinions and data contained in all publications are solely those of the individual author(s) and contributor(s) and not of MDPI and/or the editor(s). MDPI and/or the editor(s) disclaim responsibility for any injury to people or property resulting from any ideas, methods, instructions or products referred to in the content. |
© 2023 by the authors. Licensee MDPI, Basel, Switzerland. This article is an open access article distributed under the terms and conditions of the Creative Commons Attribution (CC BY) license (https://creativecommons.org/licenses/by/4.0/).
Share and Cite
Subramani, A.; Cui, W.; Zhang, Y.; Friman, T.; Zhao, Z.; Huang, W.; Fonseca, P.; Lui, W.-O.; Narayanan, V.; Bobrowska, J.; et al. Modulation of E-Cadherin Function through the AmotL2 Isoforms Promotes Ameboid Cell Invasion. Cells 2023, 12, 1682. https://doi.org/10.3390/cells12131682
Subramani A, Cui W, Zhang Y, Friman T, Zhao Z, Huang W, Fonseca P, Lui W-O, Narayanan V, Bobrowska J, et al. Modulation of E-Cadherin Function through the AmotL2 Isoforms Promotes Ameboid Cell Invasion. Cells. 2023; 12(13):1682. https://doi.org/10.3390/cells12131682
Chicago/Turabian StyleSubramani, Aravindh, Weiyingqi Cui, Yuanyuan Zhang, Tomas Friman, Zhihai Zhao, Wenmao Huang, Pedro Fonseca, Weng-Onn Lui, Vani Narayanan, Justyna Bobrowska, and et al. 2023. "Modulation of E-Cadherin Function through the AmotL2 Isoforms Promotes Ameboid Cell Invasion" Cells 12, no. 13: 1682. https://doi.org/10.3390/cells12131682
APA StyleSubramani, A., Cui, W., Zhang, Y., Friman, T., Zhao, Z., Huang, W., Fonseca, P., Lui, W.-O., Narayanan, V., Bobrowska, J., Lekka, M., Yan, J., Conway, D. E., & Holmgren, L. (2023). Modulation of E-Cadherin Function through the AmotL2 Isoforms Promotes Ameboid Cell Invasion. Cells, 12(13), 1682. https://doi.org/10.3390/cells12131682