

Proton and Carbon Ion Irradiation Changes the Process of Endochondral Ossification in an Ex Vivo Femur Organotypic Culture Model

 , and
, and 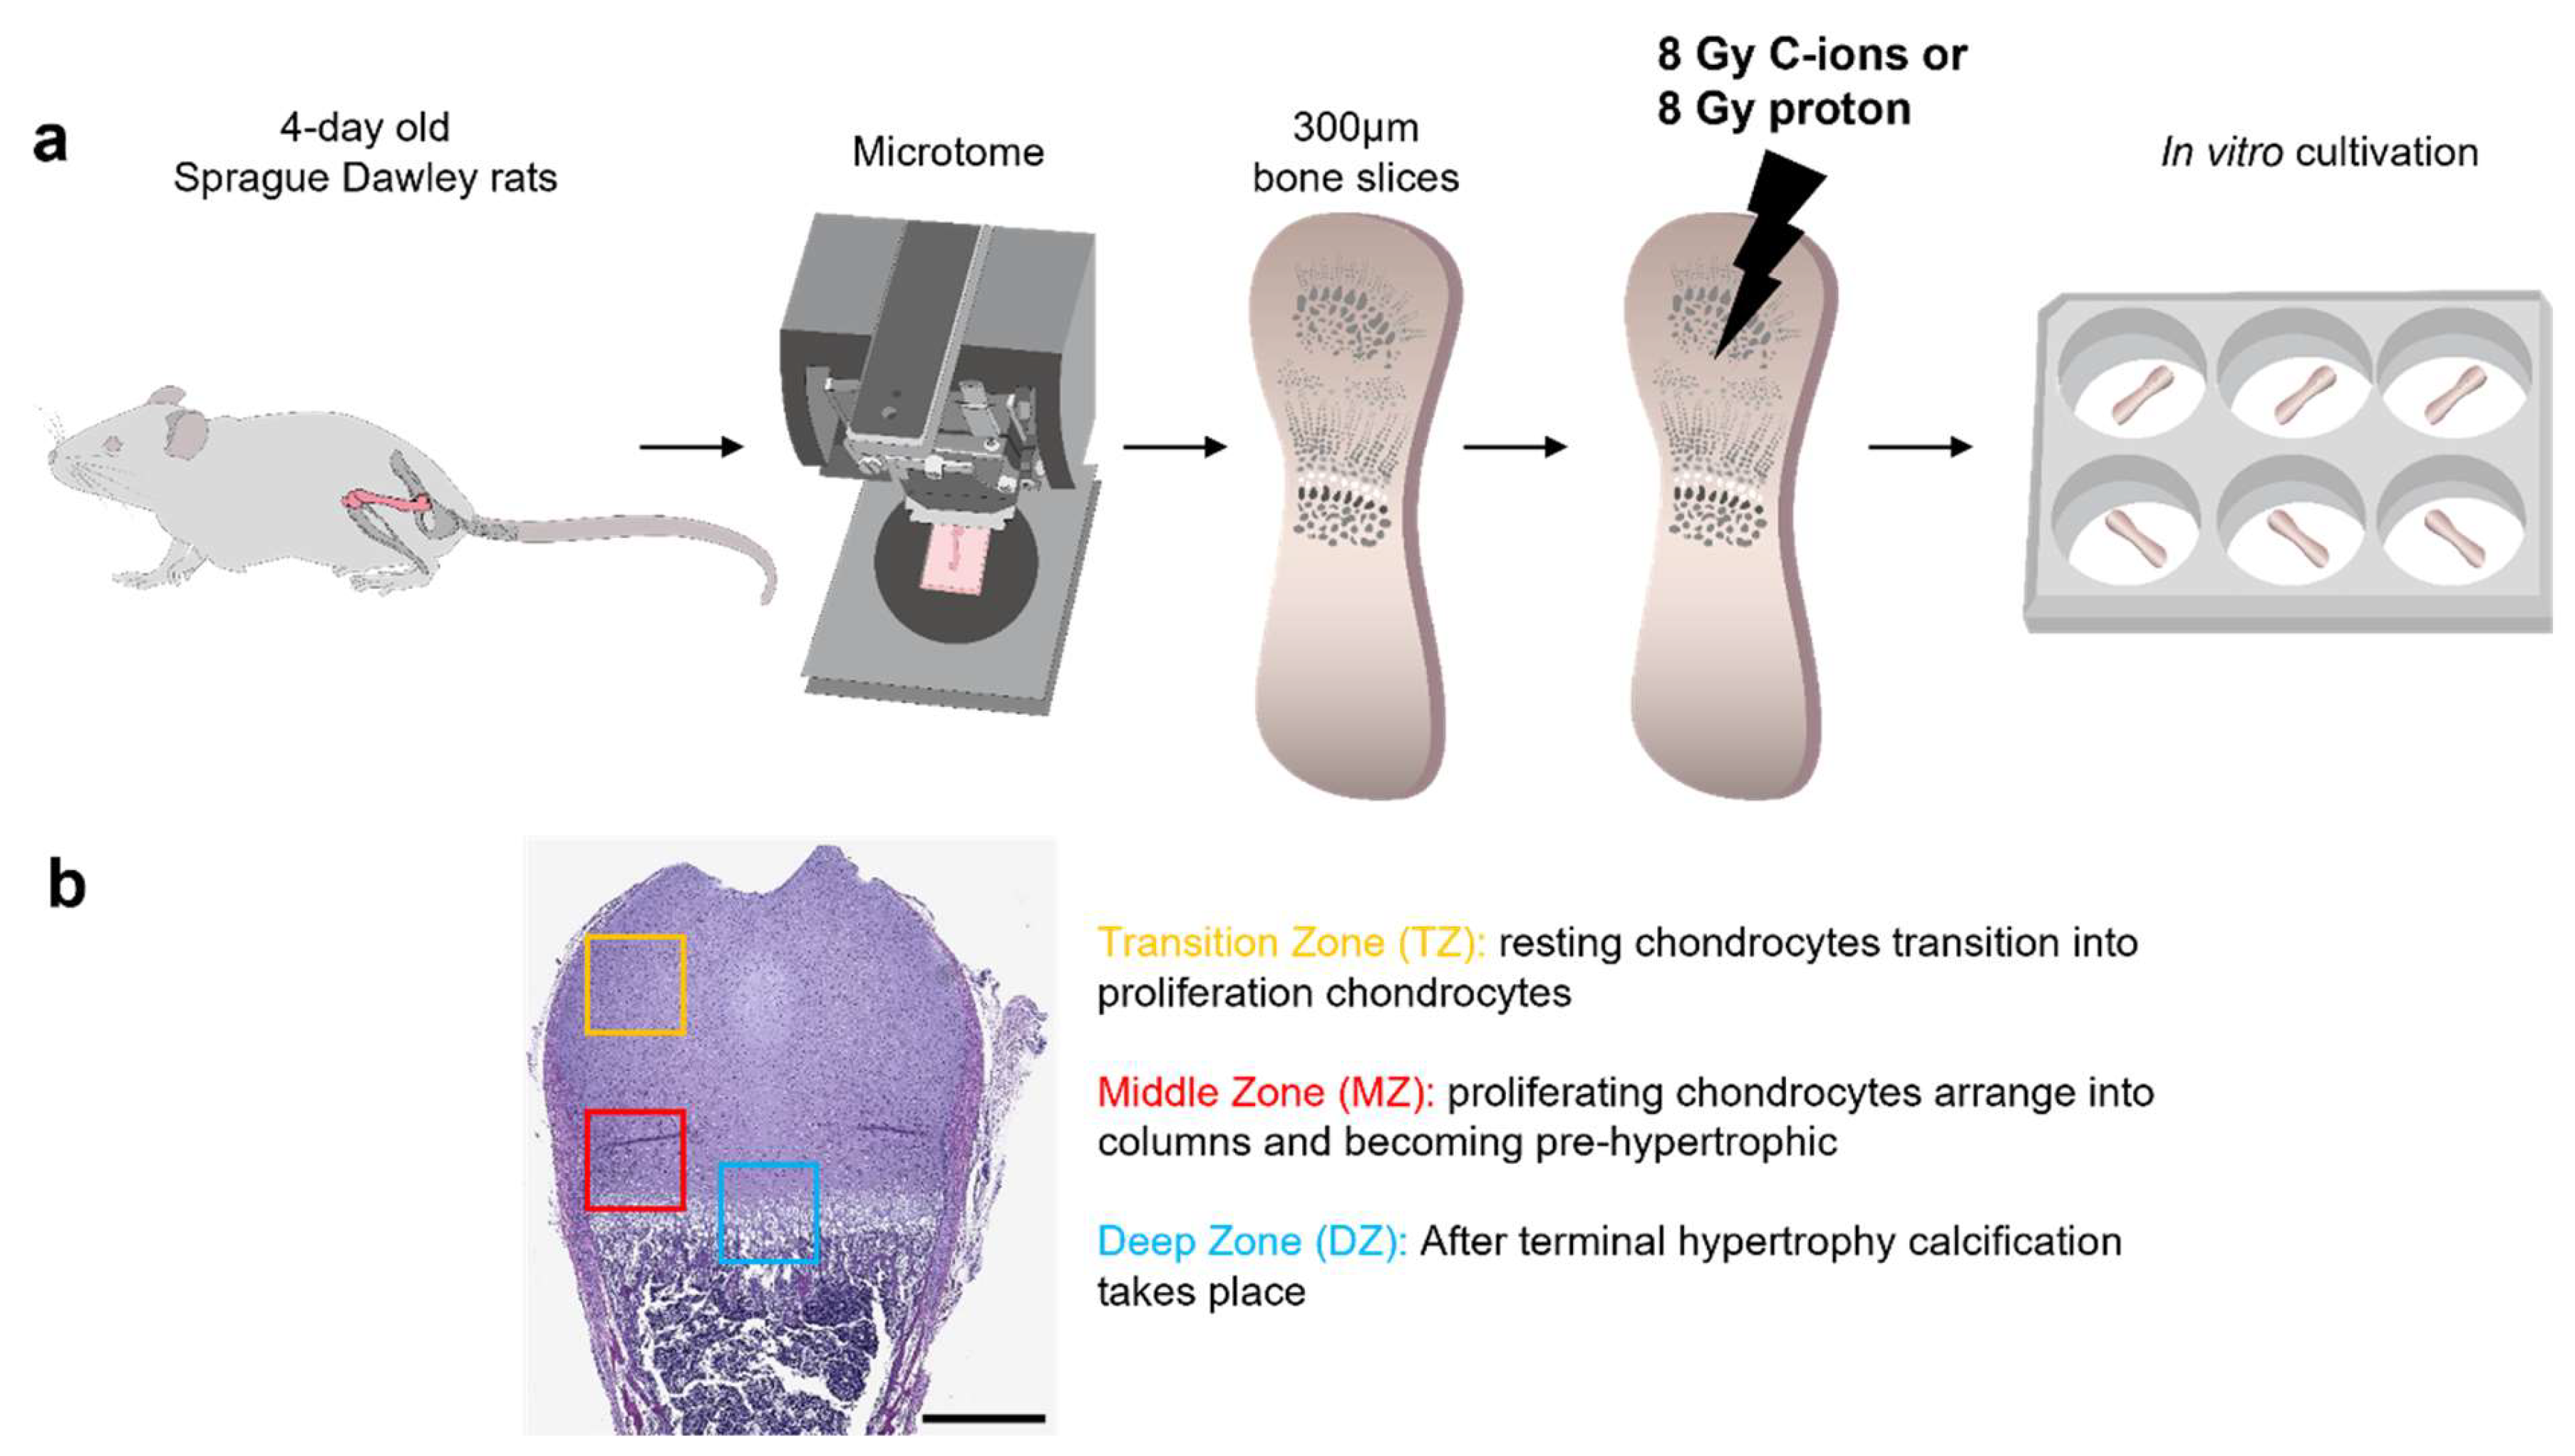
Abstract
:1. Introduction
2. Materials and Methods
2.1. Experimental Design
2.2. Preparation and Culturing of Ex Vivo Organotypic Bone Slice Culture (OTCs)
2.3. Physical Parameters of Irradiation (IR)
2.4. Tissue Processing for Histological Evaluation and Analyzes
2.5. Immunohistochemistry (IHC) Staining
2.6. RNA Preparation and Reverse Transcription Polymerase Chain Reaction (RT-PCR)
2.7. Data Presentation and Statistical Analyses
3. Results
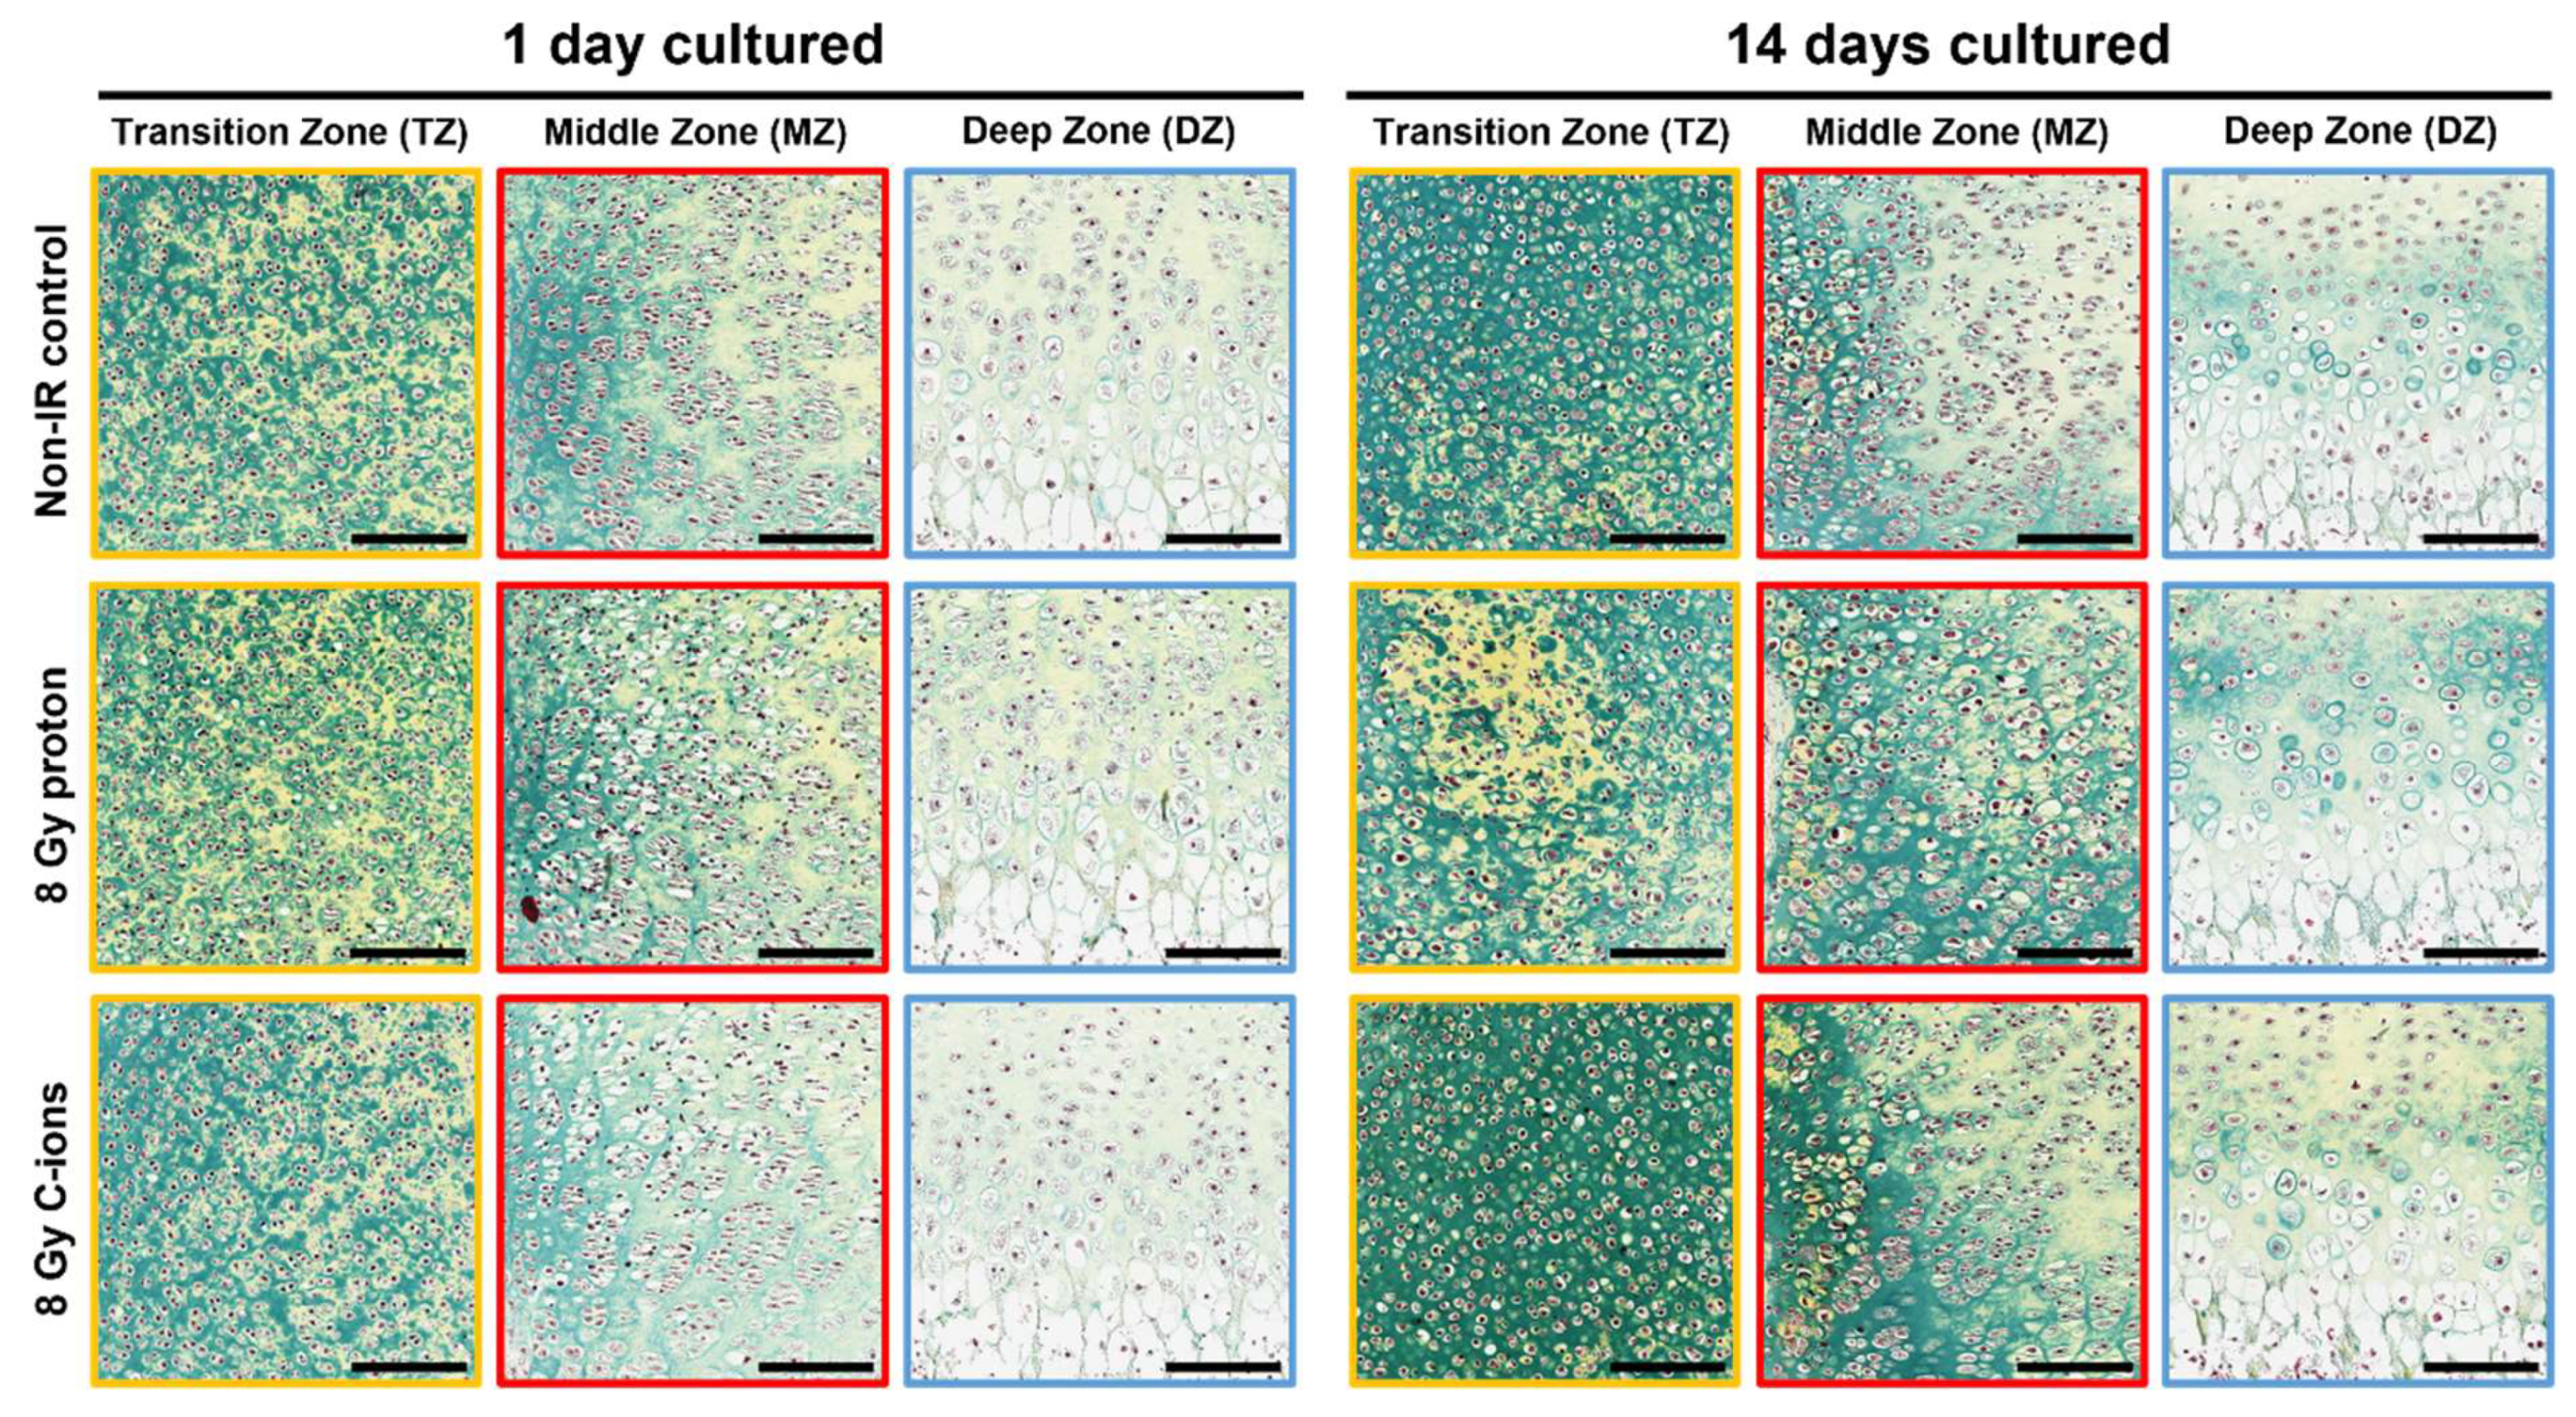
3.1. Morphological Changes on Endochondral Ossification Epiphysis after Particle Irradiation
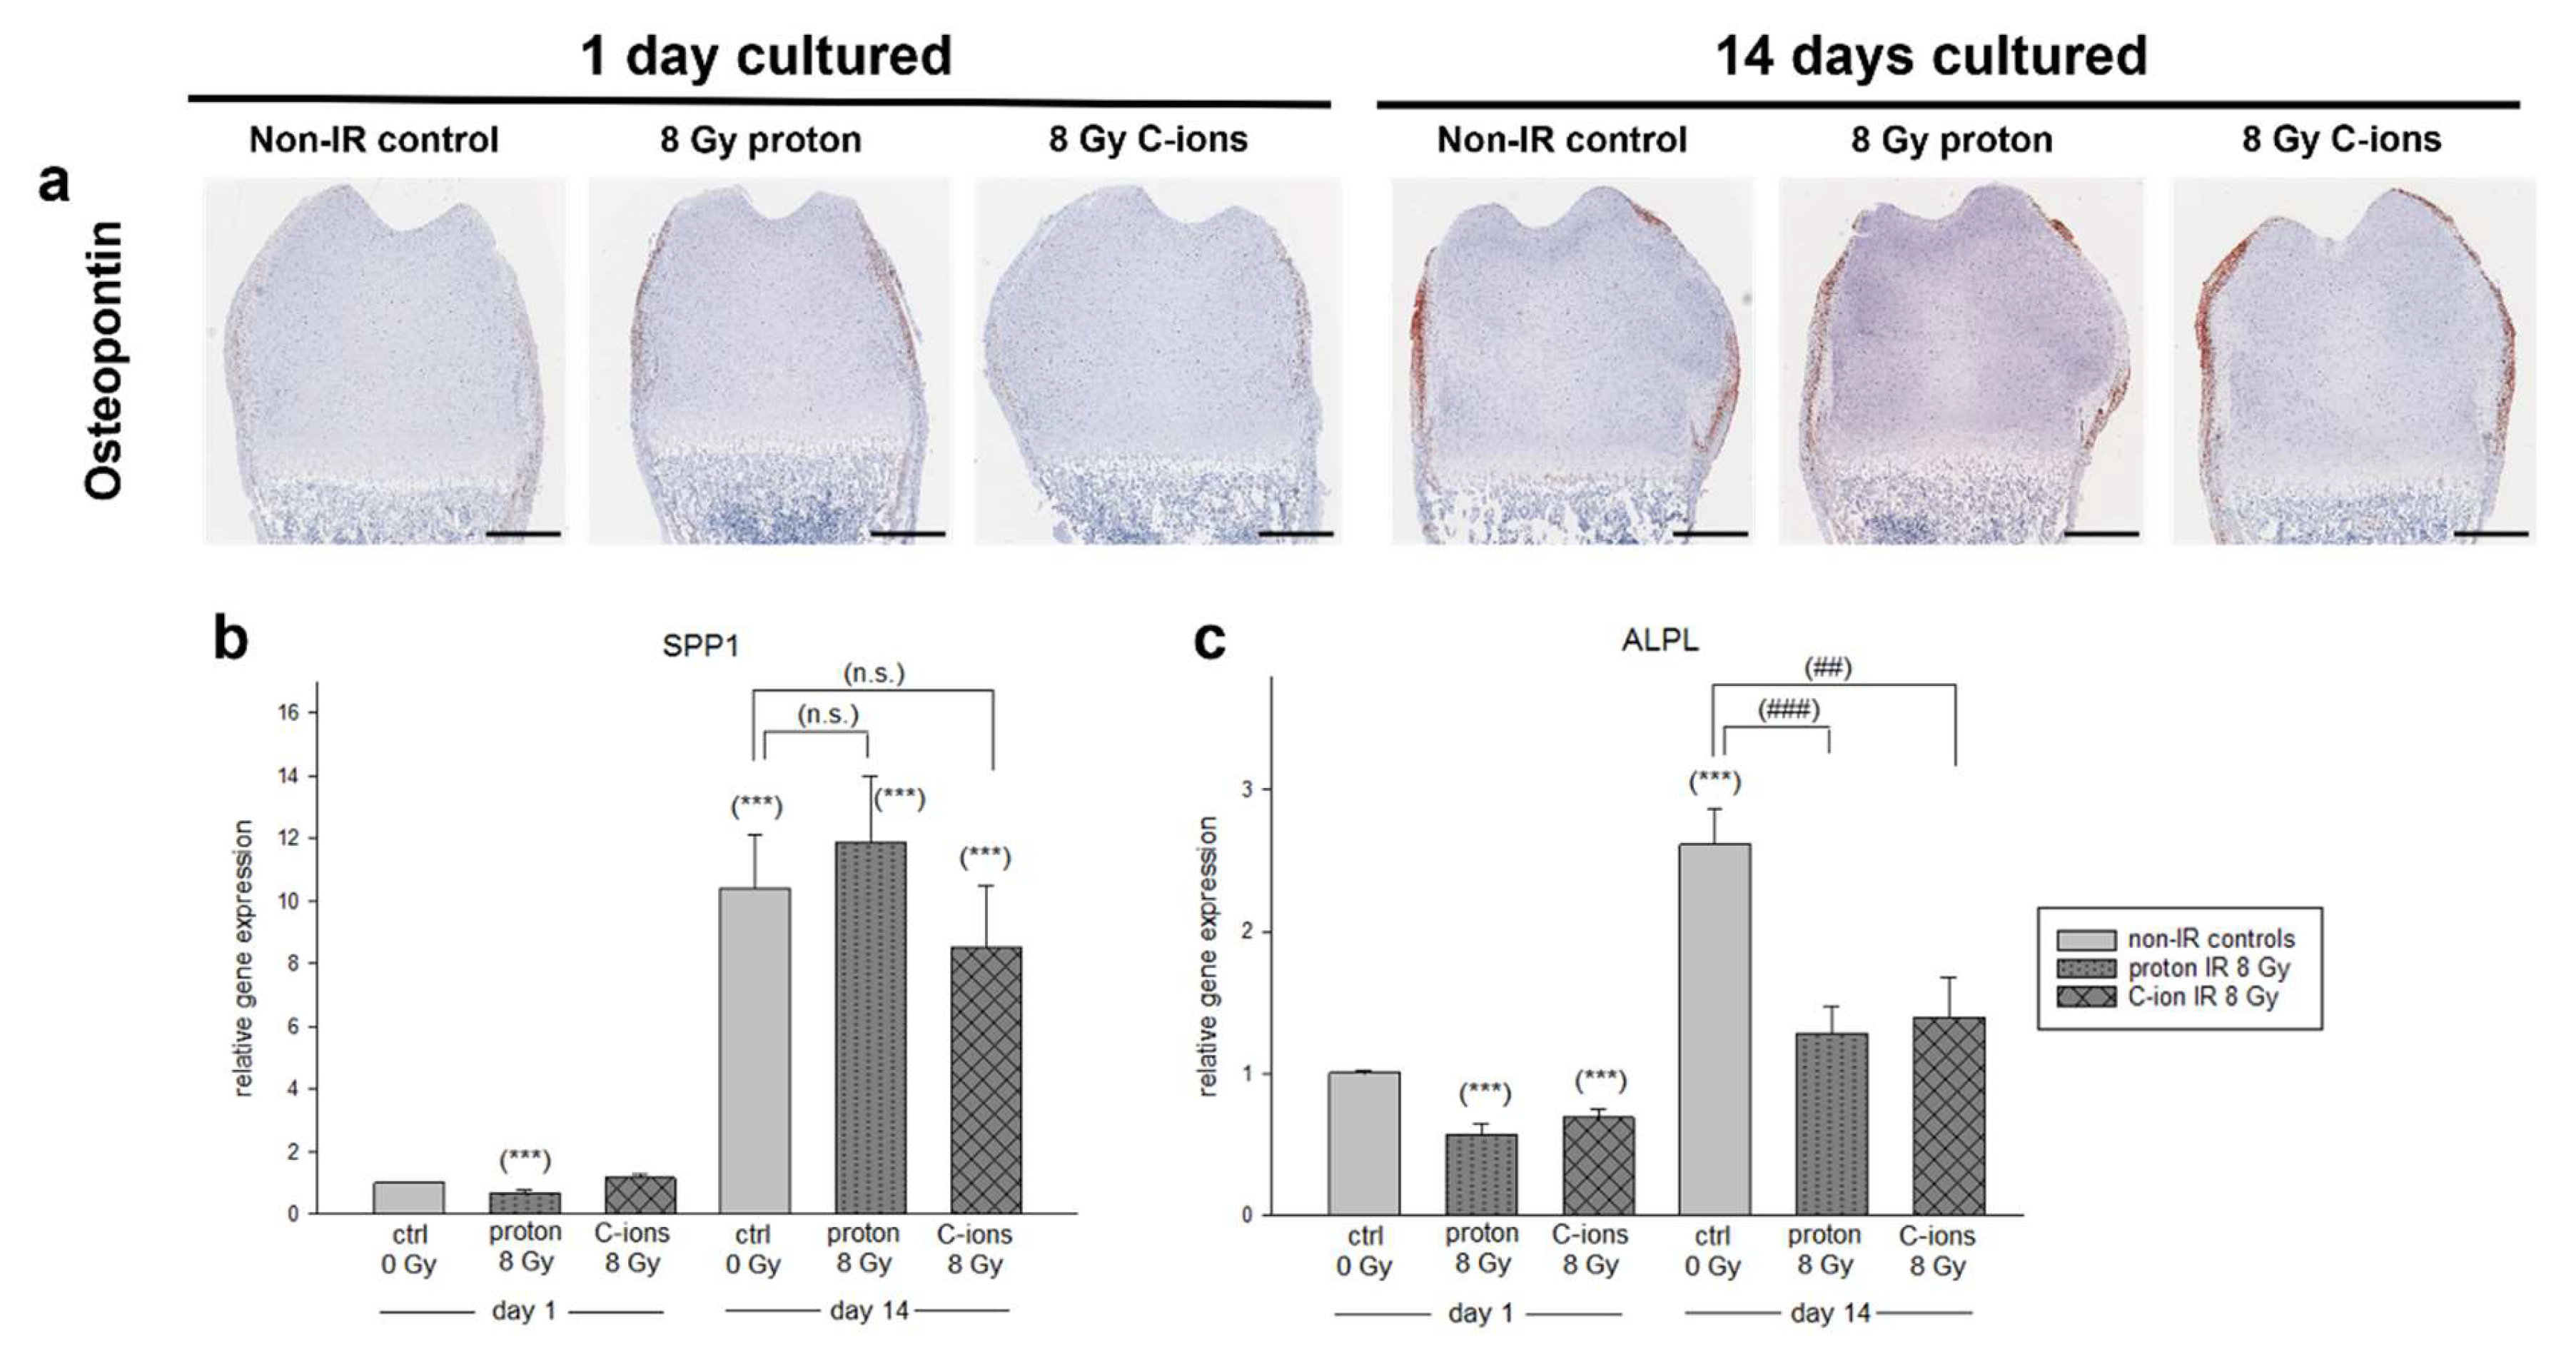
3.2. Particle Irradiation Affected Endochondral Ossification
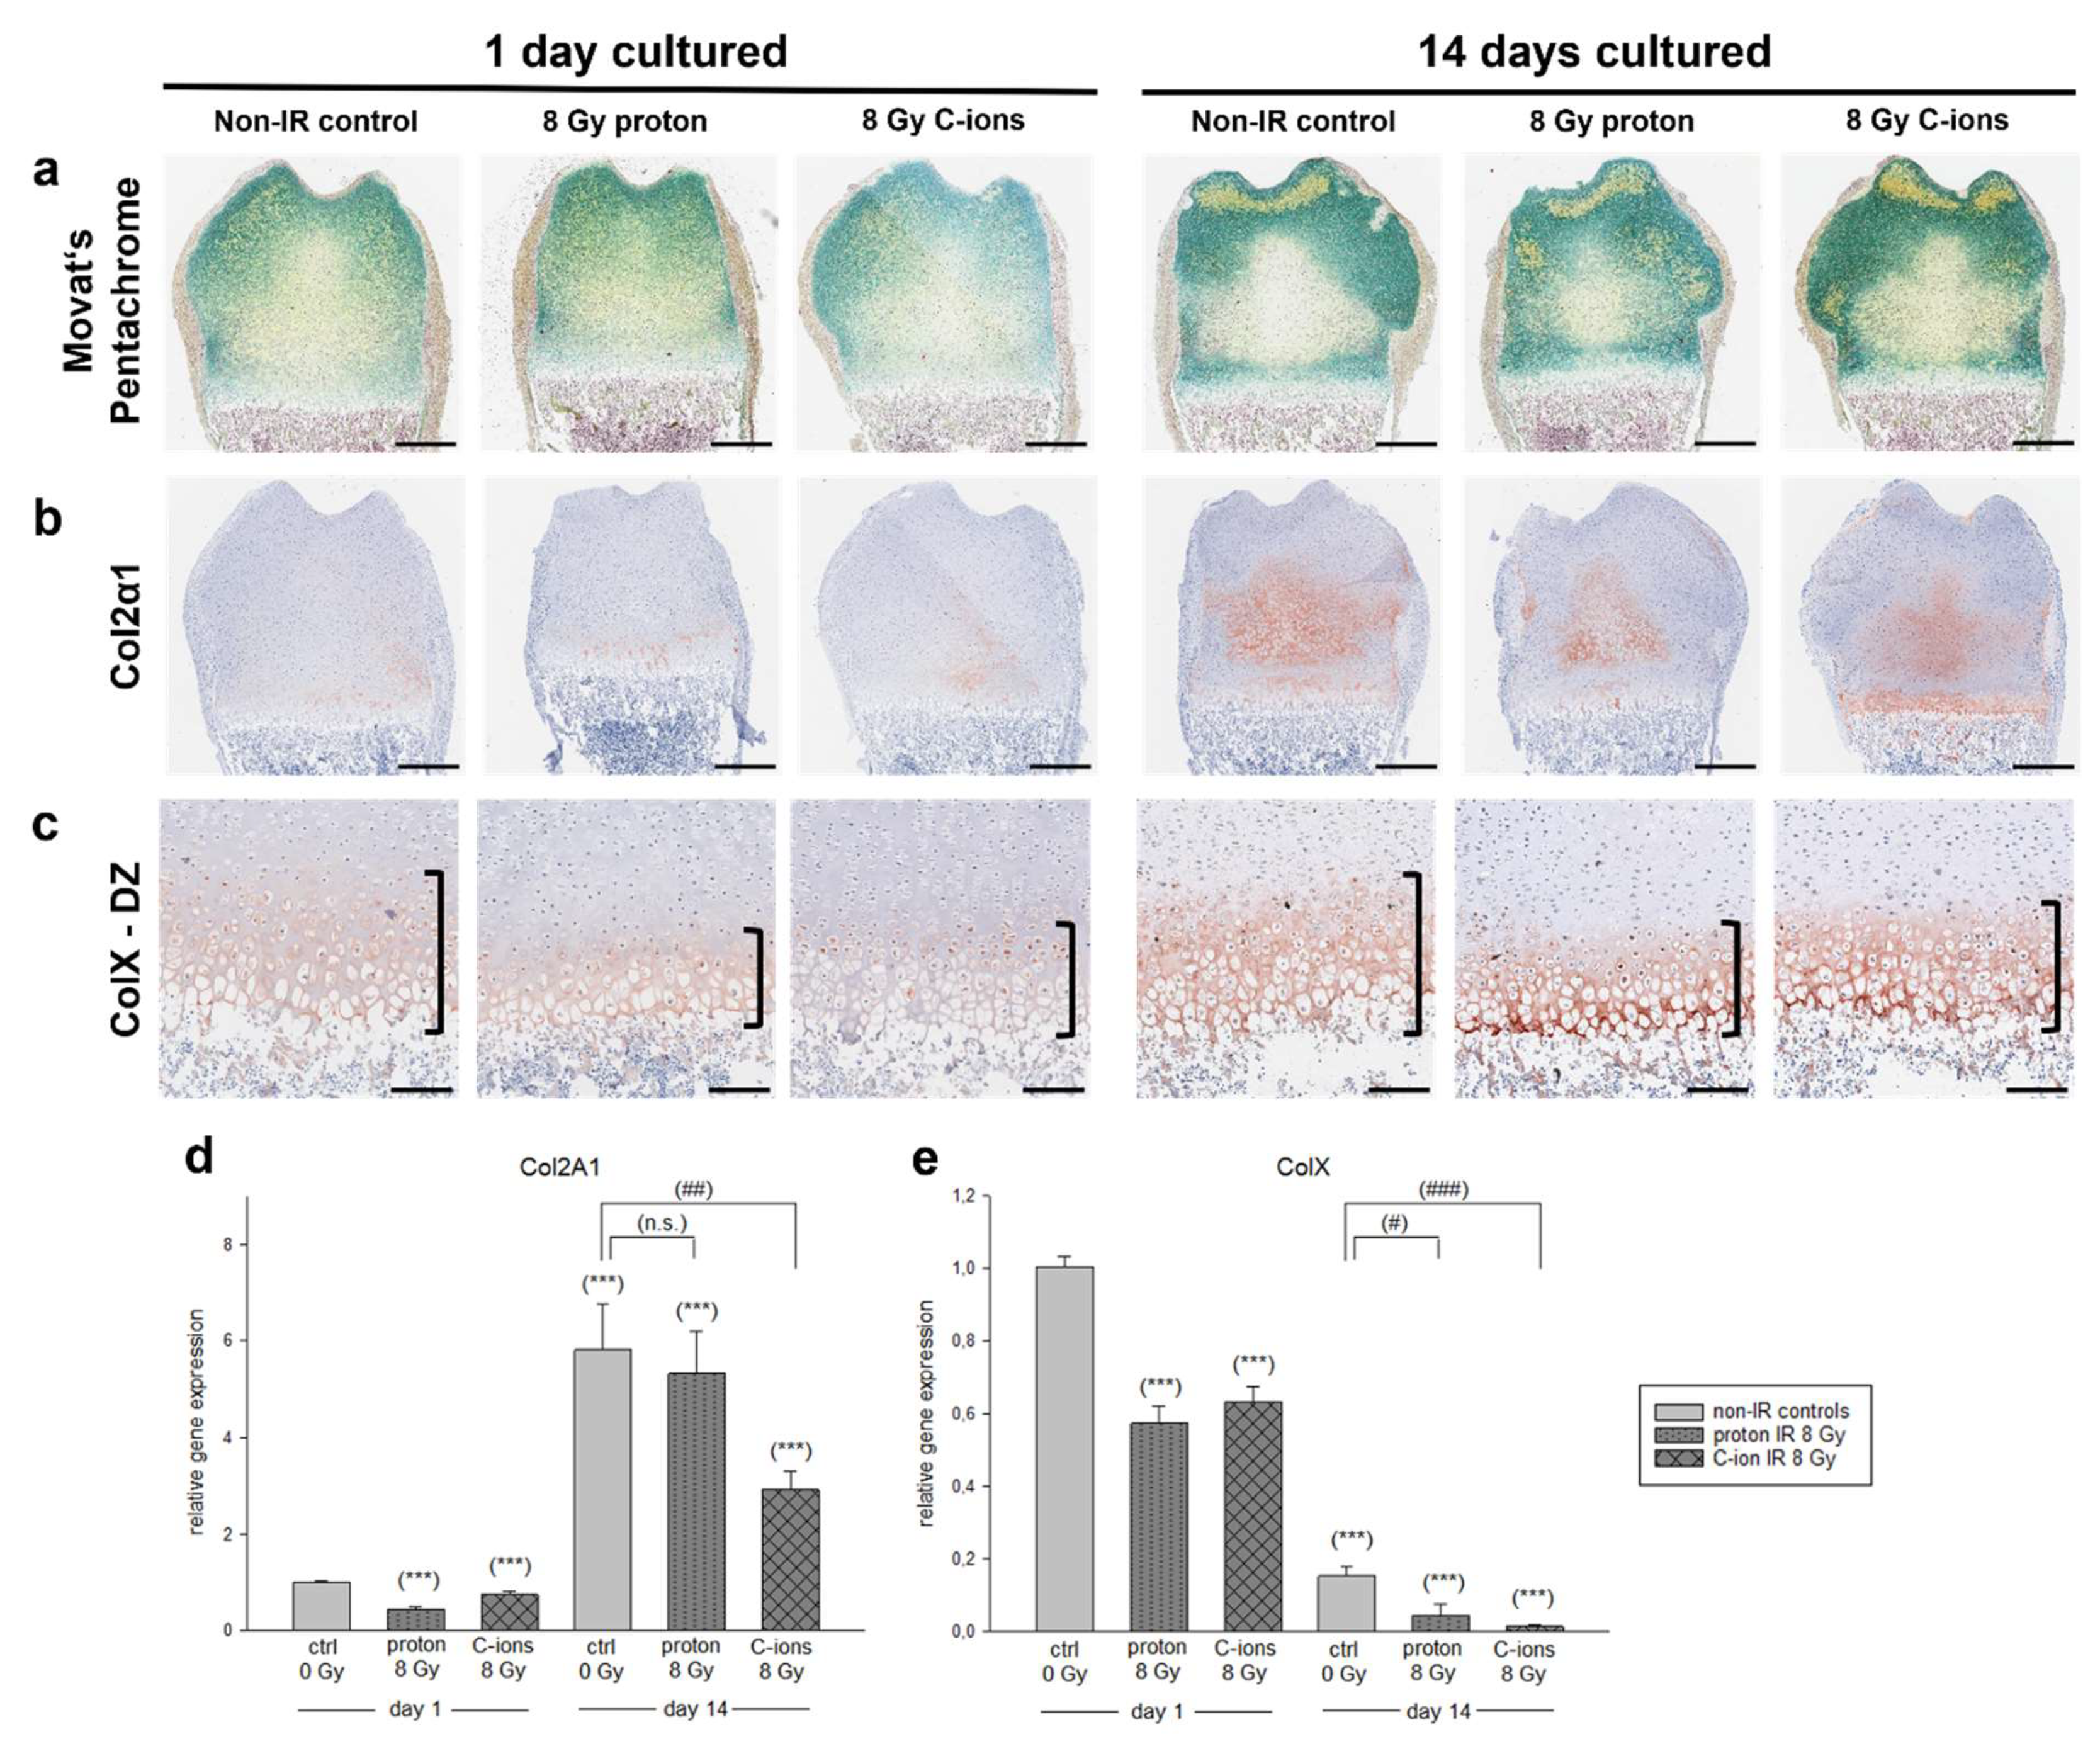
3.3. Effect of Particle Irradiation on Extracellular Matrix (ECM) Composition
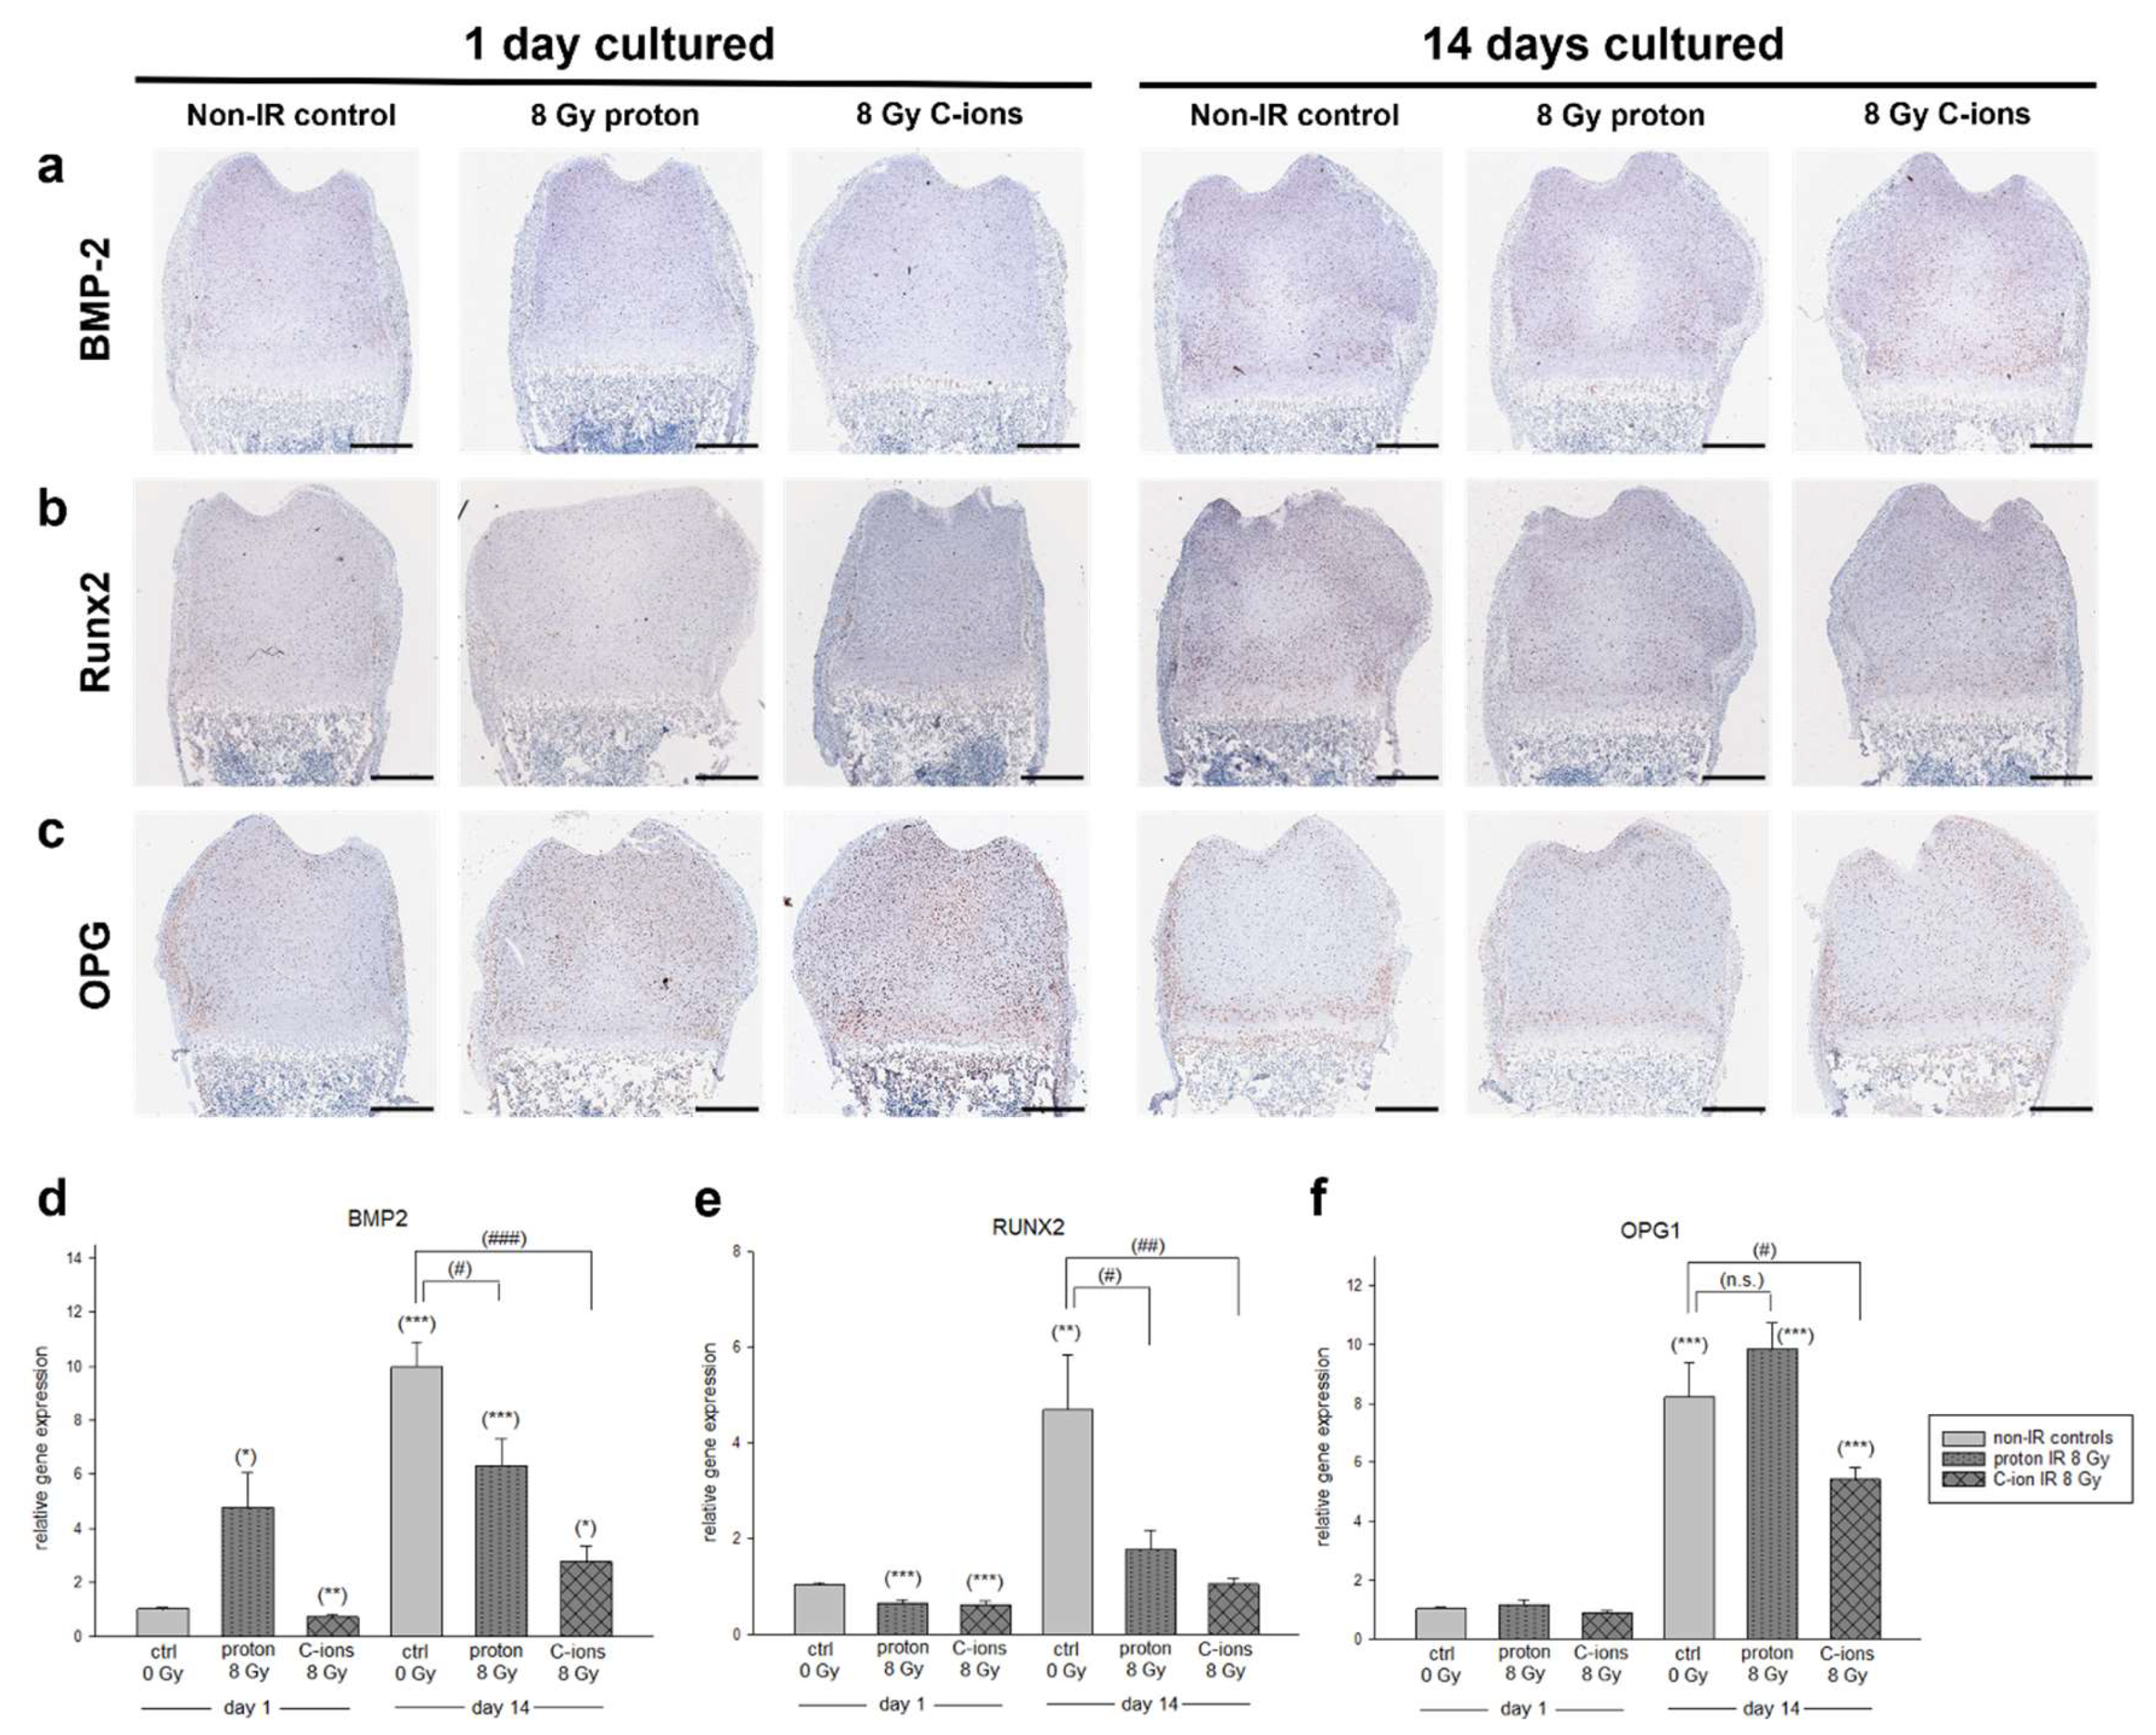
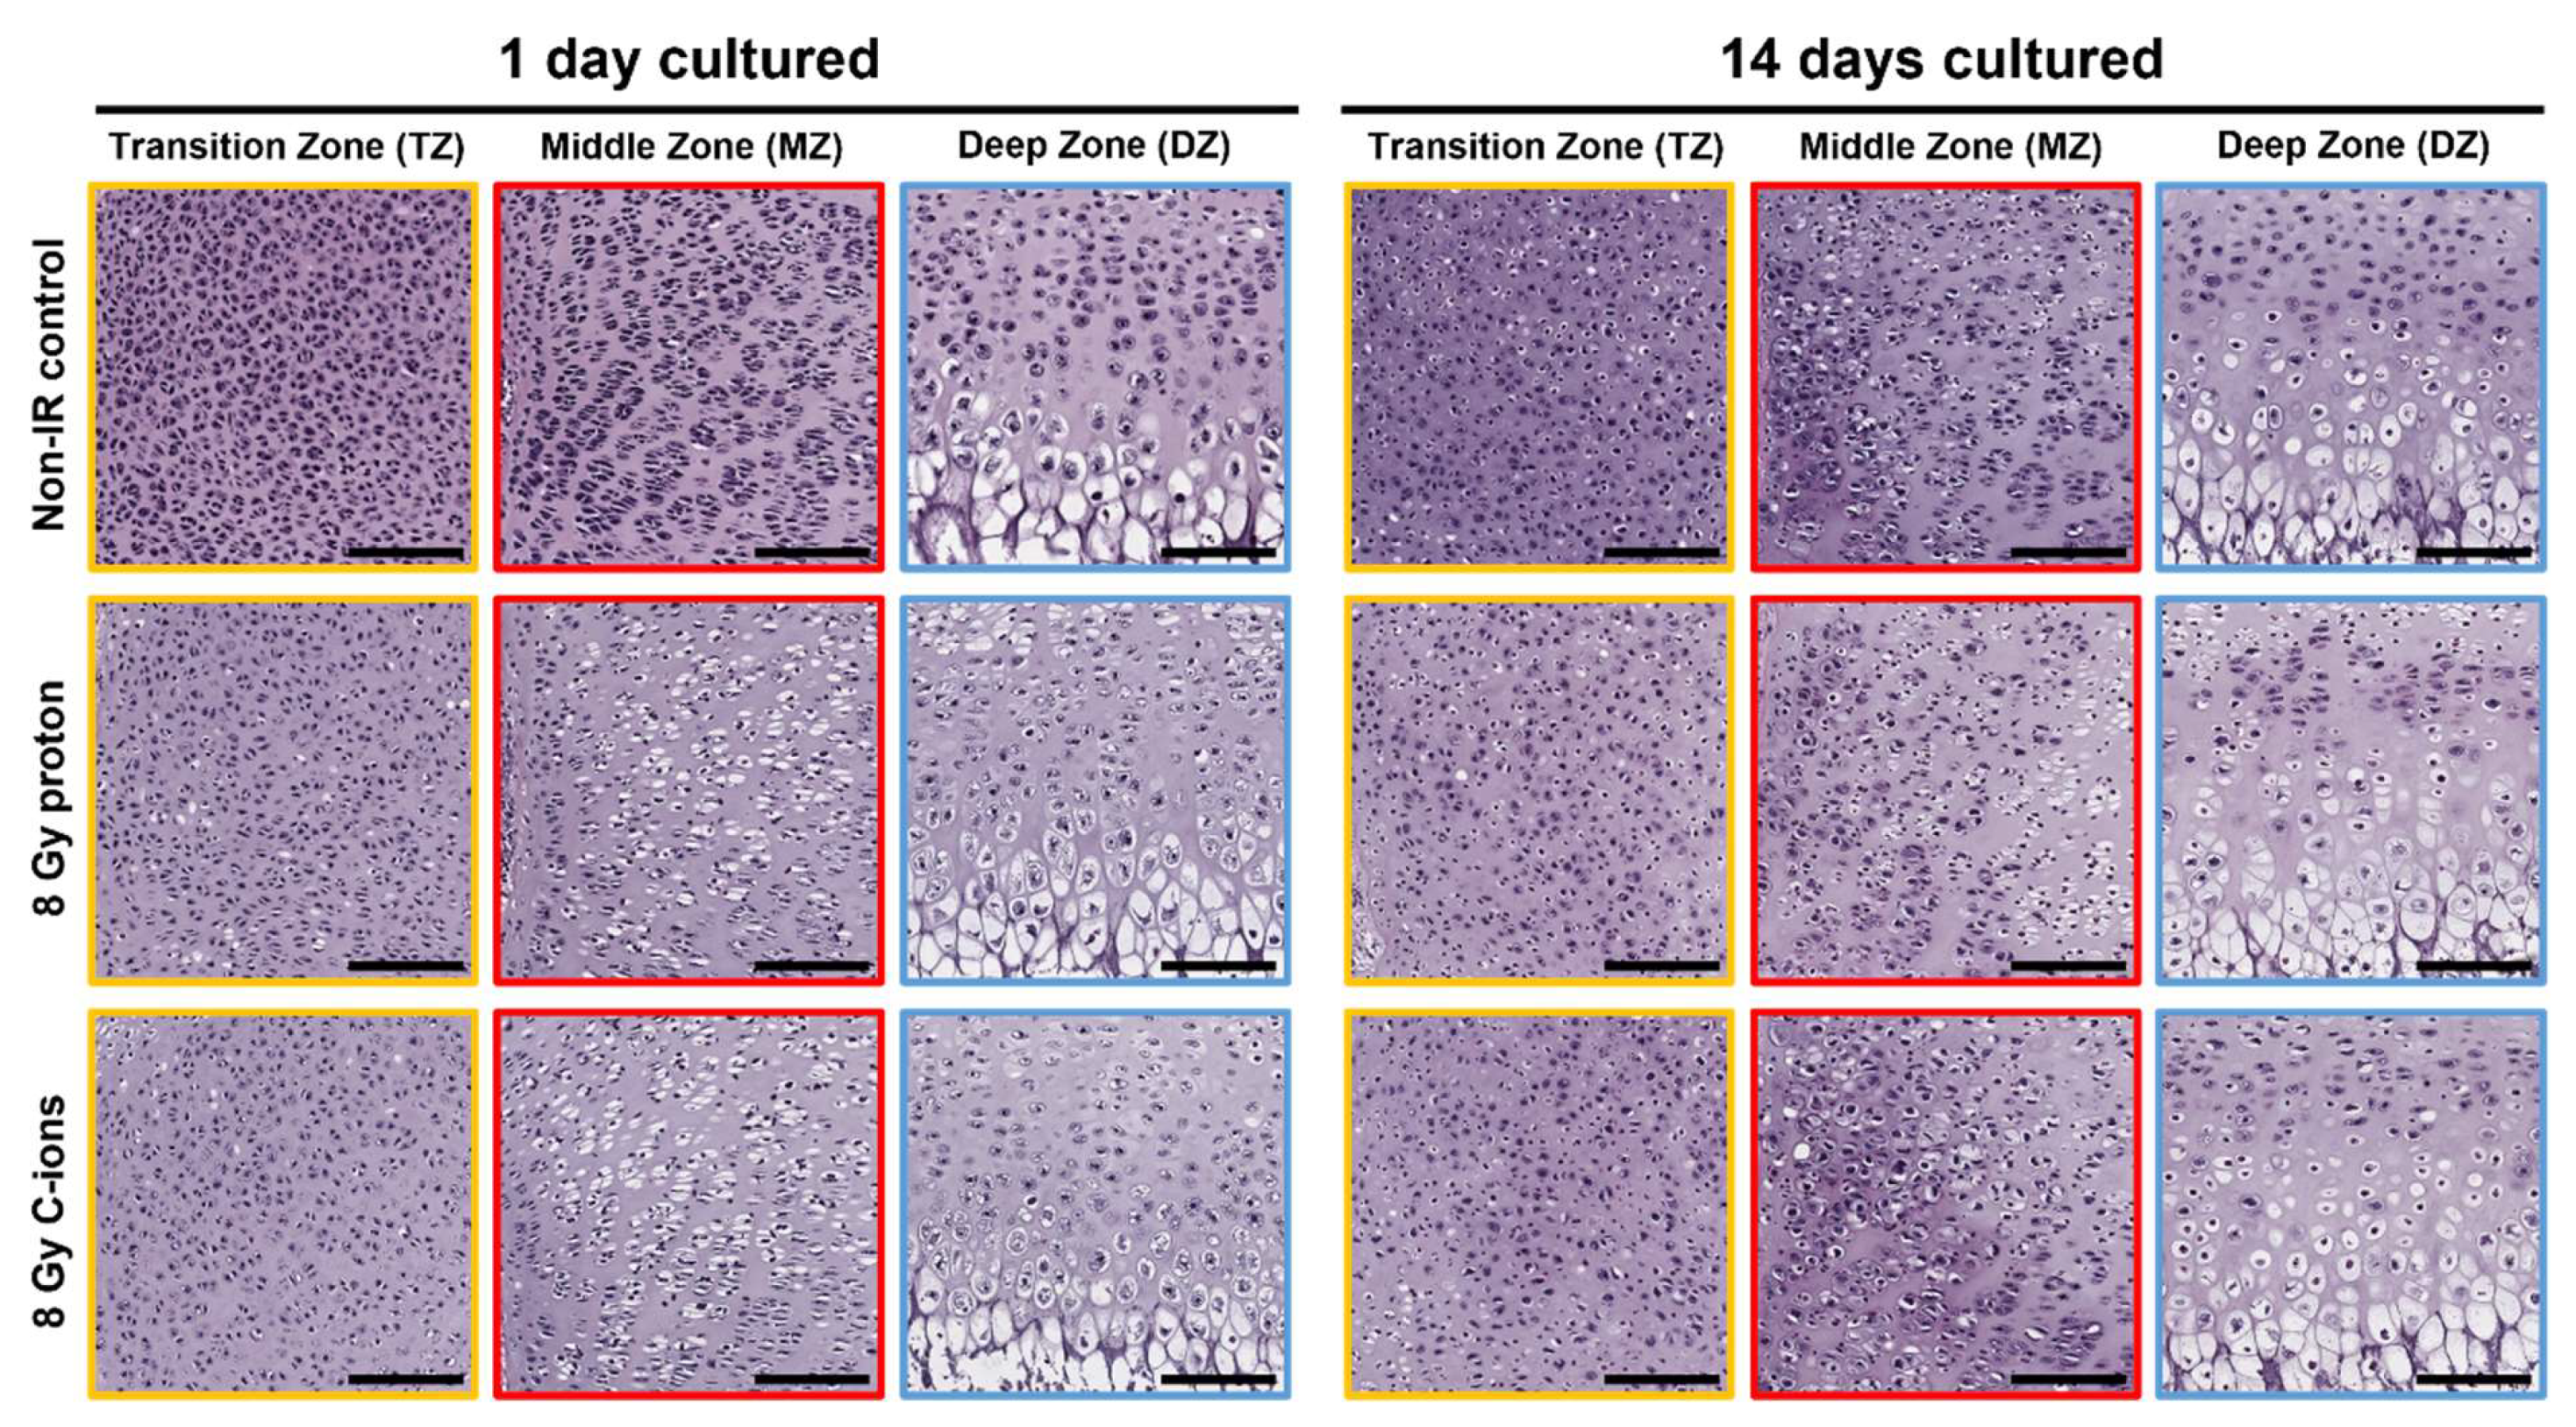
3.4. Cartilage Regeneration and Progression of Chondrocyte Maturation under the Influence of Particle Irradiation
4. Discussion
5. Conclusions
Supplementary Materials
Author Contributions
Funding
Institutional Review Board Statement
Informed Consent Statement
Data Availability Statement
Acknowledgments
Conflicts of Interest
References
- Roebuck, D.J. Skeletal complications in pediatric oncology patients. Radiographics 1999, 19, 873–885. [Google Scholar] [CrossRef]
- Mitchell, M.J.; Logan, P.M. Radiation-induced changes in bone. Radiographics 1998, 18, 1125–1136. [Google Scholar] [CrossRef] [PubMed]
- Paulino, A.C. Late effects of radiotherapy for pediatric extremity sarcomas. Int. J. Radiat. Oncol. Biol. Phys. 2004, 60, 265–274. [Google Scholar] [CrossRef] [PubMed]
- Emerzian, S.R.; Wu, T.; Vaidya, R.; Tang, S.Y.; Abergel, R.J.; Keaveny, T.M. Relative Effects of Radiation-Induced Changes in Bone Mass, Structure, and Tissue Material on Vertebral Strength in a Rat Model. Bone Miner. Res. 2023. Online ahead of print. [Google Scholar] [CrossRef] [PubMed]
- Hallett, S.A.; Ono, W.; Ono, N. Growth Plate Chondrocytes: Skeletal Development, Growth and Beyond. Int. J. Mol. Sci. 2019, 20, 6009. [Google Scholar] [CrossRef] [PubMed]
- Chen, H.; Ghori-Javed, F.Y.; Rashid, H.; Adhami, M.D.; Serra, R.; Gutierrez, S.E.; Javed, A. Runx2 regulates endochondral ossification through control of chondrocyte proliferation and differentiation. J. Bone Miner. Res. 2014, 29, 2653–2665. [Google Scholar] [CrossRef] [PubMed]
- Aigner, T.; Stöve, J. Collagens—Major component of the physiological cartilage matrix, major target of cartilage degeneration, major tool in cartilage repair. Adv. Drug Deliv. Res. 2003, 55, 1569–1593. [Google Scholar] [CrossRef]
- Linsenmayer, T.F.; Eavey, R.D.; Schmid, T.M. Type X collagen: A hypertrophic cartilage-specific molecule. Pathol. Immunopathol. Res. 1988, 7, 14–19. [Google Scholar] [CrossRef]
- Alvarez, J.; Balbín, M.; Fernández, M.; López, J.M. Collagen metabolism is markedly altered in the hypertrophic cartilage of growth plates from rats with growth impairment secondary to chronic renal failure. J. Bone Miner. Res. 2001, 16, 511–524. [Google Scholar] [CrossRef]
- Horton, J.A.; Margulies, B.S.; Strauss, J.A.; Bariteau, J.T.; Damron, T.A.; Spadaro, J.A.; Farnum, C.E. Restoration of growth plate function following radiotherapy is driven by increased proliferative and synthetic activity of expansions of chondrocytic clones. J. Orthop. Res. 2006, 24, 1945–1956. [Google Scholar] [CrossRef]
- Damron, T.A.; Margulies, B.S.; Strauss, J.A.; O’Hara, K.; Spadaro, J.A.; Farnum, C.E. Sequential histomorphometric analysis of the growth plate following irradiation with and without radioprotection. J. Bone Jt. Surg. Am. 2003, 85, 1302–1313. [Google Scholar] [CrossRef]
- Damron, T.A.; Horton, J.A.; Pritchard, M.R.; Stringer, M.T.; Margulies, B.S.; Strauss, J.A.; Spadaro, J.A.; Farnum, C.E. Histomorphometric evidence of growth plate recovery potential after fractionated radiotherapy: An in vivo model. Radiat. Res. 2008, 170, 284–291. [Google Scholar] [CrossRef]
- Guan, X.; Gao, J.; Hu, J.; Hu, W.; Yang, J.; Qiu, X.; Hu, C.; Kong, L.; Lu, J.J. The preliminary results of proton and carbon ion therapy for chordoma and chondrosarcoma of the skull base and cervical spine. Radiat. Oncol. 2019, 14, 206. [Google Scholar] [CrossRef] [PubMed]
- Grau, C.; Durante, M.; Georg, D.; Langendijk, J.A.; Weber, D.C. Particle therapy in Europe. Mol. Oncol. 2020, 14, 1492–1499. [Google Scholar] [CrossRef] [PubMed]
- Durante, M.; Debus, J. Heavy Charged Particles: Does Improved Precision and Higher Biological Effectiveness Translate to Better Outcome in Patients? Semin. Radiat. Oncol. 2018, 28, 160–167. [Google Scholar] [CrossRef]
- Srinivasaiah, S.; Musumeci, G.; Mohan, T.; Castrogiovanni, P.; Absenger-Novak, M.; Zefferer, U.; Mostofi, S.; Bonyadi Rad, E.; Grün, N.G.; Weinberg, A.M.; et al. A 300 μm Organotypic Bone Slice Culture Model for Temporal Investigation of Endochondral Osteogenesis. Tissue Eng. C 2019, 25, 197–212. [Google Scholar] [CrossRef] [PubMed]
- Hayden, P.J.; Harbell, J.W. Special review series on 3D organotypic culture models: Introduction and historical perspective. In vitro cellular & developmental biology. Animal 2021, 57, 95–103. [Google Scholar]
- Stock, M.; Georg, D.; Ableitinger, A.; Zechner, A.; Utz, A.; Mumot, M.; Kragl, G.; Hopfgartnerm, J.; Gora, J.; Böhlen, T.; et al. The technological basis for adaptive ion beam therapy at MedAustron: Status and outlook. Z. Med. Phys. 2018, 28, 196–210. [Google Scholar] [CrossRef]
- Ruangchan, S.; Knäusl, B.; Fuchs, H.; Georg, D.; Clausen, M. Experimental benchmarking of RayStation proton dose calculation algorithms inside and outside the target region in heterogeneous phantom geometries. Phys. Med. 2020, 76, 182–193. [Google Scholar] [CrossRef]
- Sun, Y.; Helmholz, H.; Willumeit-Römer, R. Multicolor Histochemical Staining for Identification of Mineralized and Non-Mineralized Musculoskeletal Tissue: Immunohistochemical and Radiological Validation in Decalcified Bone Samples. Bioengineering 2022, 9, 488. [Google Scholar] [CrossRef]
- Majeed, H.; Gupta, V. (Eds.) Adverse Effects of Radiation Therapy; StatPearls: Treasure Island, FL, USA, 2023. [Google Scholar]
- Park, S.H.; Kang, J.O. Basics of particle therapy I: Physics. Radiat. Oncol. J. 2011, 29, 135–146. [Google Scholar] [CrossRef] [PubMed]
- Kuess, P.; Böhlen, T.T.; Lechner, W.; Elia, A.; Georg, D.; Palmans, H. Lateral response heterogeneity of Bragg peak ionization chambers for narrow-beam photon and proton dosimetry. Phys. Med. Biol. 2017, 62, 9189–9206. [Google Scholar] [CrossRef] [PubMed]
- Lohberger, B.; Glänzer, D.; Eck, N.; Stasny, K.; Falkner, A.; Leithner, A.; Georg, D. The ATR Inhibitor VE-821 Enhances the Radiosensitivity and Suppresses DNA Repair Mechanisms of Human Chondrosarcoma Cells. Int. J. Mol. Sci. 2023, 24, 2315. [Google Scholar] [CrossRef] [PubMed]
- Pacheco, R.; Stock, H. Effects of radiation on bone. Curr. Osteoporos. Rep. 2013, 11, 299–304. [Google Scholar] [CrossRef] [PubMed]
- Krasin, M.J.; Constine, L.S.; Friedman, D.L.; Marks, L.B. Radiation-related treatment effects across the age spectrum: Differences and similarities or what the old and young can learn from each other. Semin. Radiat. Oncol. 2010, 20, 21–29. [Google Scholar] [CrossRef] [PubMed]
- Hartley, K.A.; Li, C.; Laningham, F.H.; Krasin, M.J.; Xiong, X.; Merchant, T.E. Vertebral body growth after craniospinal irradiation. Int. J. Radiat. Oncol. Biol. Phys. 2008, 70, 1343–1349. [Google Scholar] [CrossRef]
- Mizumoto, M.; Oshiro, Y.; Pan, H.; Wang, F.; Kaste, S.C.; Gajjar, A.; Chemaitilly, W.; Merchant, T.E. Height after photon craniospinal irradiation in pediatric patients treated for central nervous system embryonal tumors. Pediatr. Blood Cancer 2020, 67, e28617. [Google Scholar] [CrossRef]
- Margulies, B.S.; Horton, J.A.; Wang, Y.; Damron, T.A.; Allen, M.J. Effects of radiation therapy on chondrocytes in vitro. Calcif. Tissue Int. 2006, 78, 302–313. [Google Scholar] [CrossRef]
- Keller, B.; Yang, T.; Chen, Y.; Munivez, E.; Bertin, T.; Zabel, B.; Lee, B. Interaction of TGFβ and BMP signaling pathways during chondrogenesis. PLoS ONE 2011, 6, e16421. [Google Scholar] [CrossRef]
- Garrison, P.; Yue, S.; Hanson, J.; Baron, J.; Lui, J.C. Spatial regulation of bone morphogenetic proteins (BMPs) in postnatal articular and growth plate cartilage. PLoS ONE 2017, 12, e0176752. [Google Scholar] [CrossRef]
- Nilsson, O.; Parker, E.A.; Hegde, A.; Chau, M.; Barnes, K.M.; Baron, J. Gradients in bone morphogenetic protein-related gene expression across the growth plate. J. Endocrinol. 2007, 193, 75–84. [Google Scholar] [CrossRef] [PubMed]
- Chen, H.; Tan, X.N.; Hu, S.; Liu, R.Q.; Peng, L.H.; Li, Y.M.; Wu, P. Molecular Mechanisms of Chondrocyte Proliferation and Differentiation. Front. Cell Dev. Biol. 2021, 9, 664168. [Google Scholar] [CrossRef] [PubMed]
- Komori, T. Runx2, an inducer of osteoblast and chondrocyte differentiation. Histochem. Cell Biol. 2018, 149, 313–323. [Google Scholar] [CrossRef] [PubMed]
- Matsuoka, K.; Park, K.A.; Ito, M.; Ikeda, K.; Takeshita, S. Osteoclast-derived complement component 3a stimulates osteoblast differentiation. J. Bone Miner. Res. 2014, 29, 1522–1530. [Google Scholar] [CrossRef]
- Donaubauer, A.J.; Deloch, L.; Becker, I.; Fietkau, R.; Frey, B.; Gaipl, U.S. The Influence of Radiation on Bone and Bone Cells-Differential Effects on Osteoclasts and Osteoblasts. Int. J. Mol. Sci. 2020, 21, 6377. [Google Scholar] [CrossRef] [PubMed]
- Nakamura, M.; Udagawa, N.; Matsuura, S.; Mogi, M.; Nakamura, H.; Horiuchi, H.; Saito, N.; Hiraoka, B.Y.; Kobayashi, Y.; Takaoka, K.; et al. Osteoprotegerin regulates bone formation through a coupling mechanism with bone resorption. Endocrinology 2003, 144, 5441–5449. [Google Scholar] [CrossRef] [PubMed]
- Xiong, J.; Onal, M.; Jilka, R.L.; Weinstein, R.S.; Manolagas, S.C.; O’Brien, C.A. Matrix-embedded cells control osteoclast formation. Nat. Med. 2011, 17, 1235–1241. [Google Scholar] [CrossRef]
- Wang, B.; Jin, H.; Shu, B.; Mira, R.R.; Di, C. Chondrocytes-Specific Expression of Osteoprotegerin Modulates Osteoclast Formation in Metaphyseal Bone. Sci. Rep. 2015, 5, 13667. [Google Scholar] [CrossRef]
- Kearns, A.E.; Khosla, S.; Kostenuik, P.J. Receptor activator of nuclear factor kappaB ligand and osteoprotegerin regulation of bone remodeling in health and disease. Endocr. Rev. 2008, 29, 155–192. [Google Scholar] [CrossRef]
- Chandra, A.; Lin, T.; Tribble, M.B.; Zhu, J.; Altman, A.R.; Tseng, W.J.; Zhang, Y.; Akintoye, S.O.; Cengel, K.; Liu, X.S.; et al. PTH1-34 alleviates radiotherapy-induced local bone loss by improving osteoblast and osteocyte survival. Bone 2014, 67, 33–40. [Google Scholar] [CrossRef]
- Chandra, A.; Lin, T.; Zhu, J.; Tong, W.; Huo, Y.; Jia, H.; Zhang, Y.; Liu, X.S.; Cengel, K.; Xia, B.; et al. PTH1-34 blocks radiation-induced osteoblast apoptosis by enhancing DNA repair through canonical Wnt pathway. J. Biol. Chem. 2015, 290, 157–167. [Google Scholar] [CrossRef]
- Guo, C.; Li, C.; Yang, K.; Kang, H.; Xu, X.; Xu, X.; Deng, L. Increased EZH2 and decreased osteoblastogenesis during local irradiation-induced bone loss in rats. Sci. Rep. 2016, 6, 31318. [Google Scholar] [CrossRef]


Disclaimer/Publisher’s Note: The statements, opinions and data contained in all publications are solely those of the individual author(s) and contributor(s) and not of MDPI and/or the editor(s). MDPI and/or the editor(s) disclaim responsibility for any injury to people or property resulting from any ideas, methods, instructions or products referred to in the content. |
© 2023 by the authors. Licensee MDPI, Basel, Switzerland. This article is an open access article distributed under the terms and conditions of the Creative Commons Attribution (CC BY) license (https://creativecommons.org/licenses/by/4.0/).
Share and Cite
Etschmaier, V.; Glänzer, D.; Eck, N.; Schäfer, U.; Leithner, A.; Georg, D.; Lohberger, B. Proton and Carbon Ion Irradiation Changes the Process of Endochondral Ossification in an Ex Vivo Femur Organotypic Culture Model. Cells 2023, 12, 2301. https://doi.org/10.3390/cells12182301
Etschmaier V, Glänzer D, Eck N, Schäfer U, Leithner A, Georg D, Lohberger B. Proton and Carbon Ion Irradiation Changes the Process of Endochondral Ossification in an Ex Vivo Femur Organotypic Culture Model. Cells. 2023; 12(18):2301. https://doi.org/10.3390/cells12182301
Chicago/Turabian StyleEtschmaier, Vanessa, Dietmar Glänzer, Nicole Eck, Ute Schäfer, Andreas Leithner, Dietmar Georg, and Birgit Lohberger. 2023. "Proton and Carbon Ion Irradiation Changes the Process of Endochondral Ossification in an Ex Vivo Femur Organotypic Culture Model" Cells 12, no. 18: 2301. https://doi.org/10.3390/cells12182301
APA StyleEtschmaier, V., Glänzer, D., Eck, N., Schäfer, U., Leithner, A., Georg, D., & Lohberger, B. (2023). Proton and Carbon Ion Irradiation Changes the Process of Endochondral Ossification in an Ex Vivo Femur Organotypic Culture Model. Cells, 12(18), 2301. https://doi.org/10.3390/cells12182301