
Evidence of Adult Features and Functions of Hepatocytes Differentiated from Human Induced Pluripotent Stem Cells and Self-Organized as Organoids

 ,
,  , ,
, ,  , , ,
, , ,  and
and 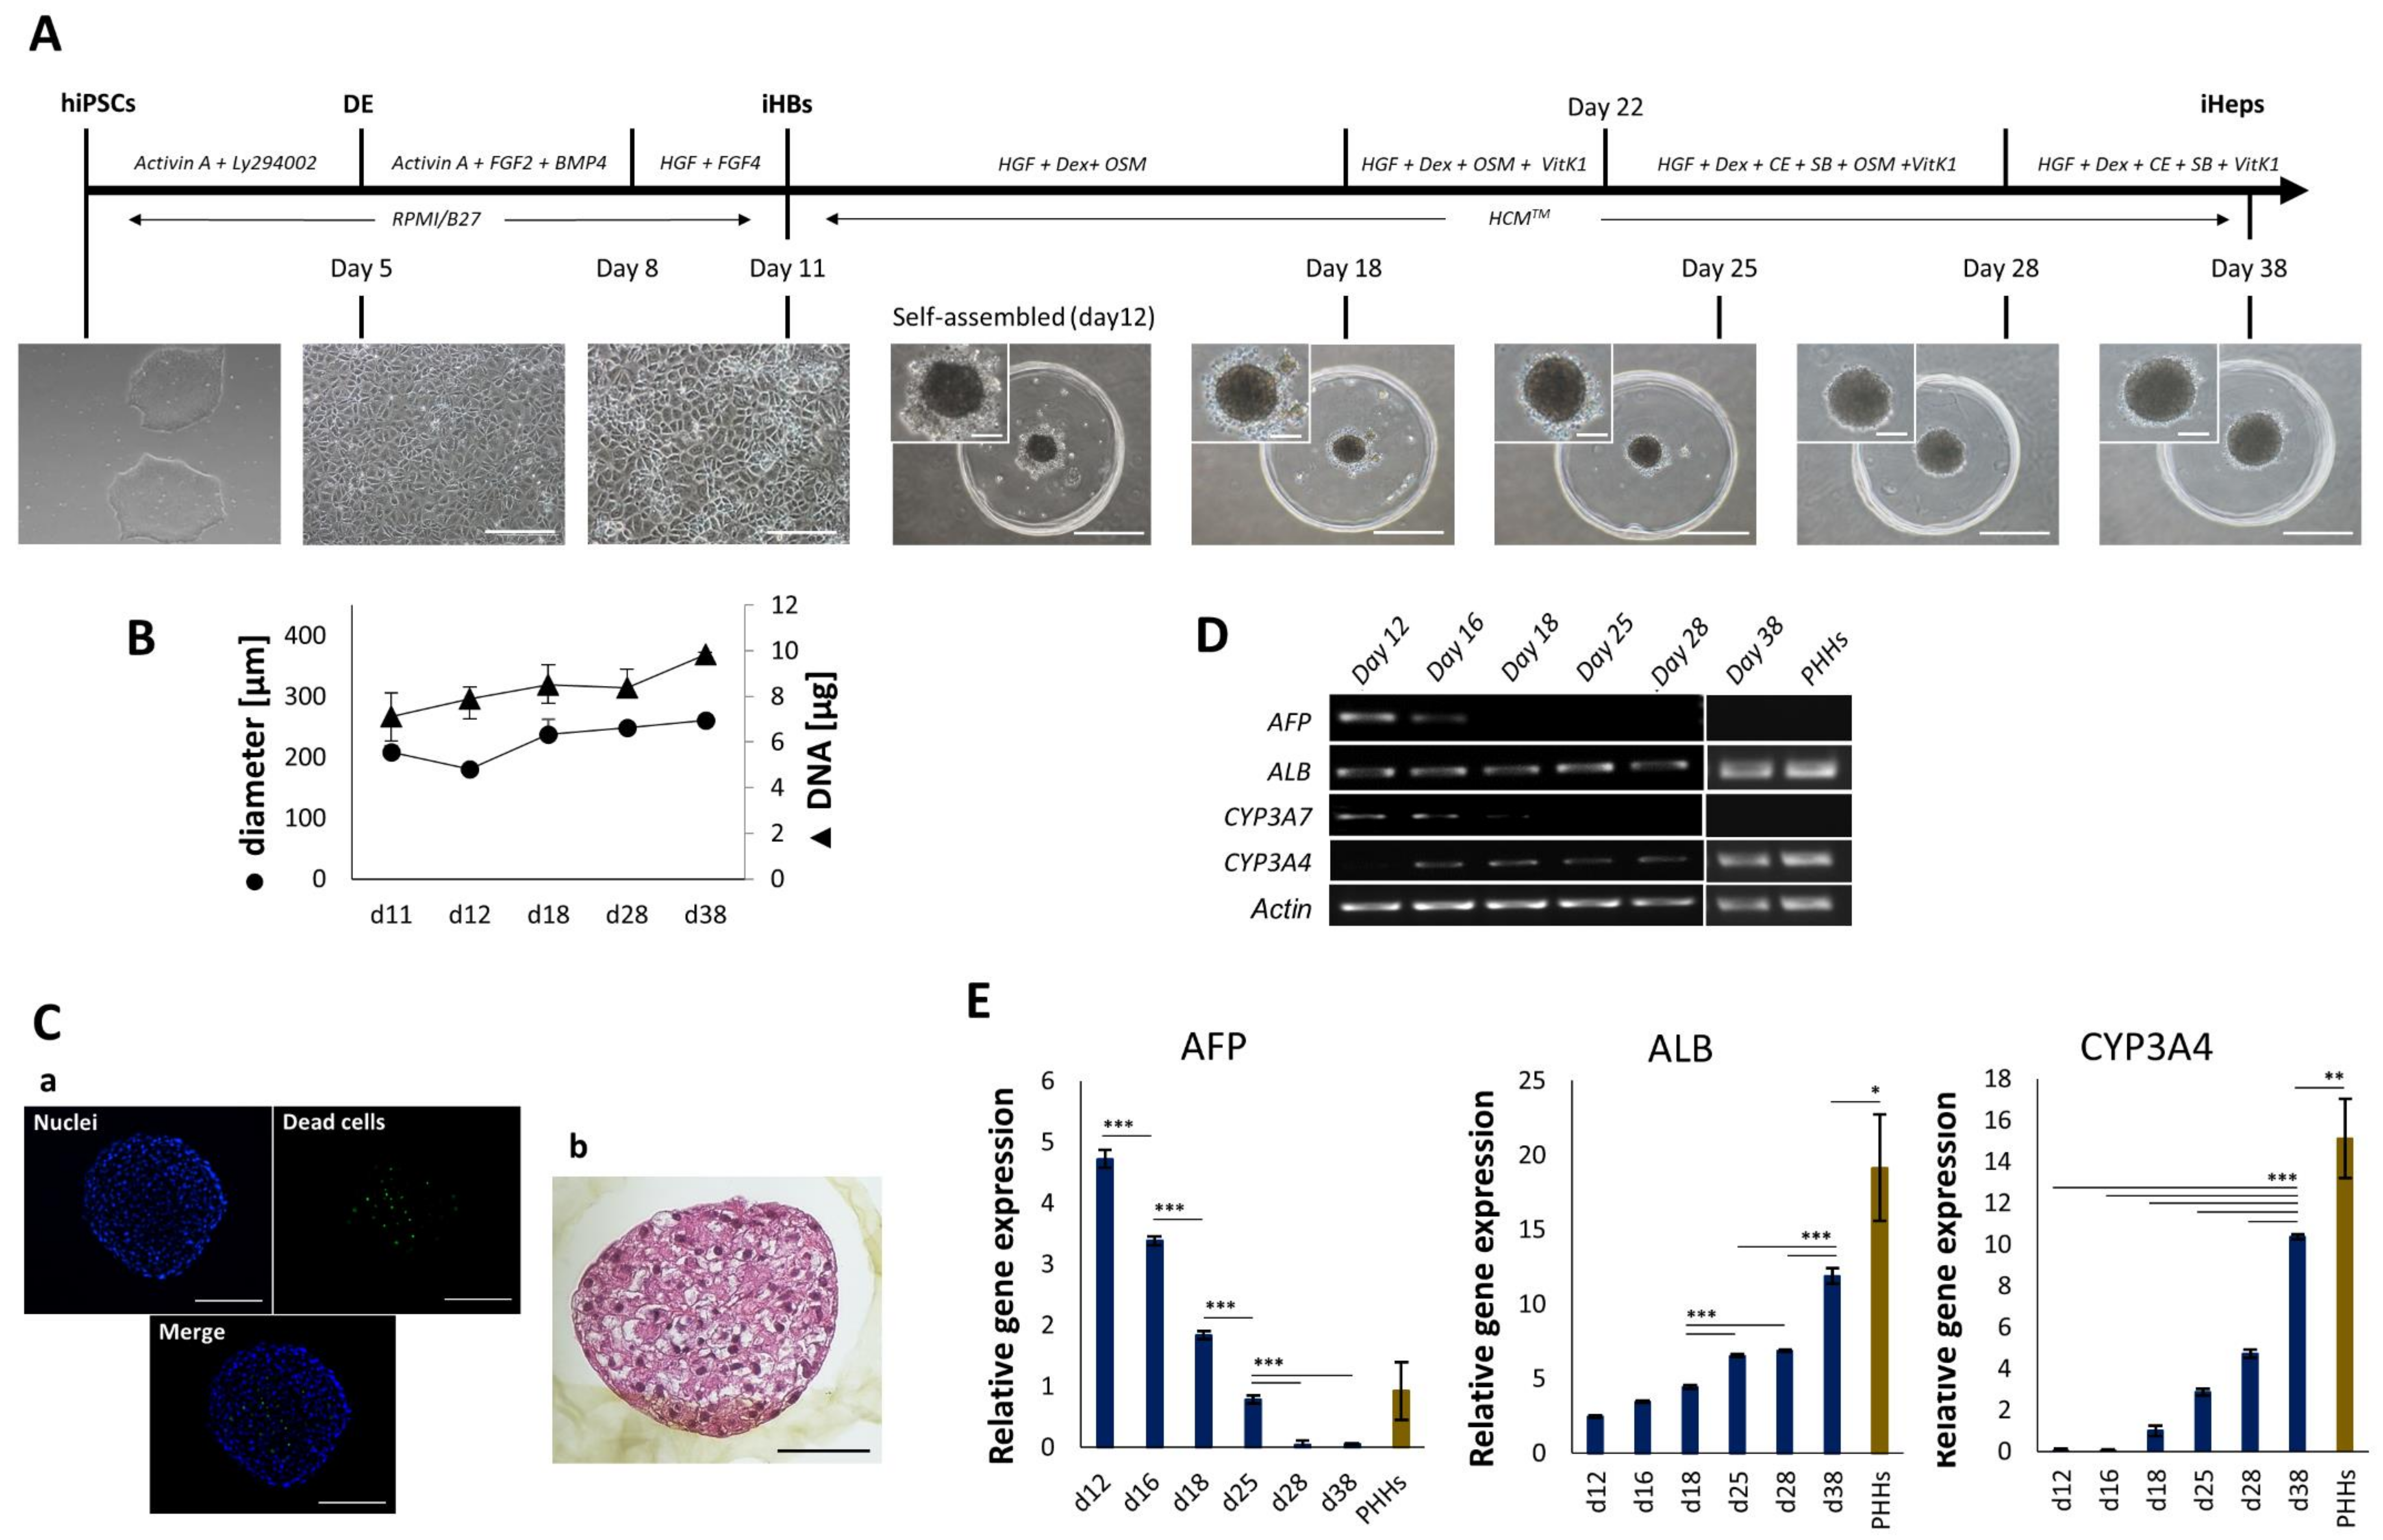
Abstract
1. Introduction
2. Materials and Methods
2.1. hiPSC-Derived Hepatocyte Organoids
2.2. In Vitro Assessment of Hepatocyte Functions
2.3. Hepatocyte Biotransformation Abilities
3. Statistics
4. Results
4.1. Generation and Characterization of iHep-Orgs
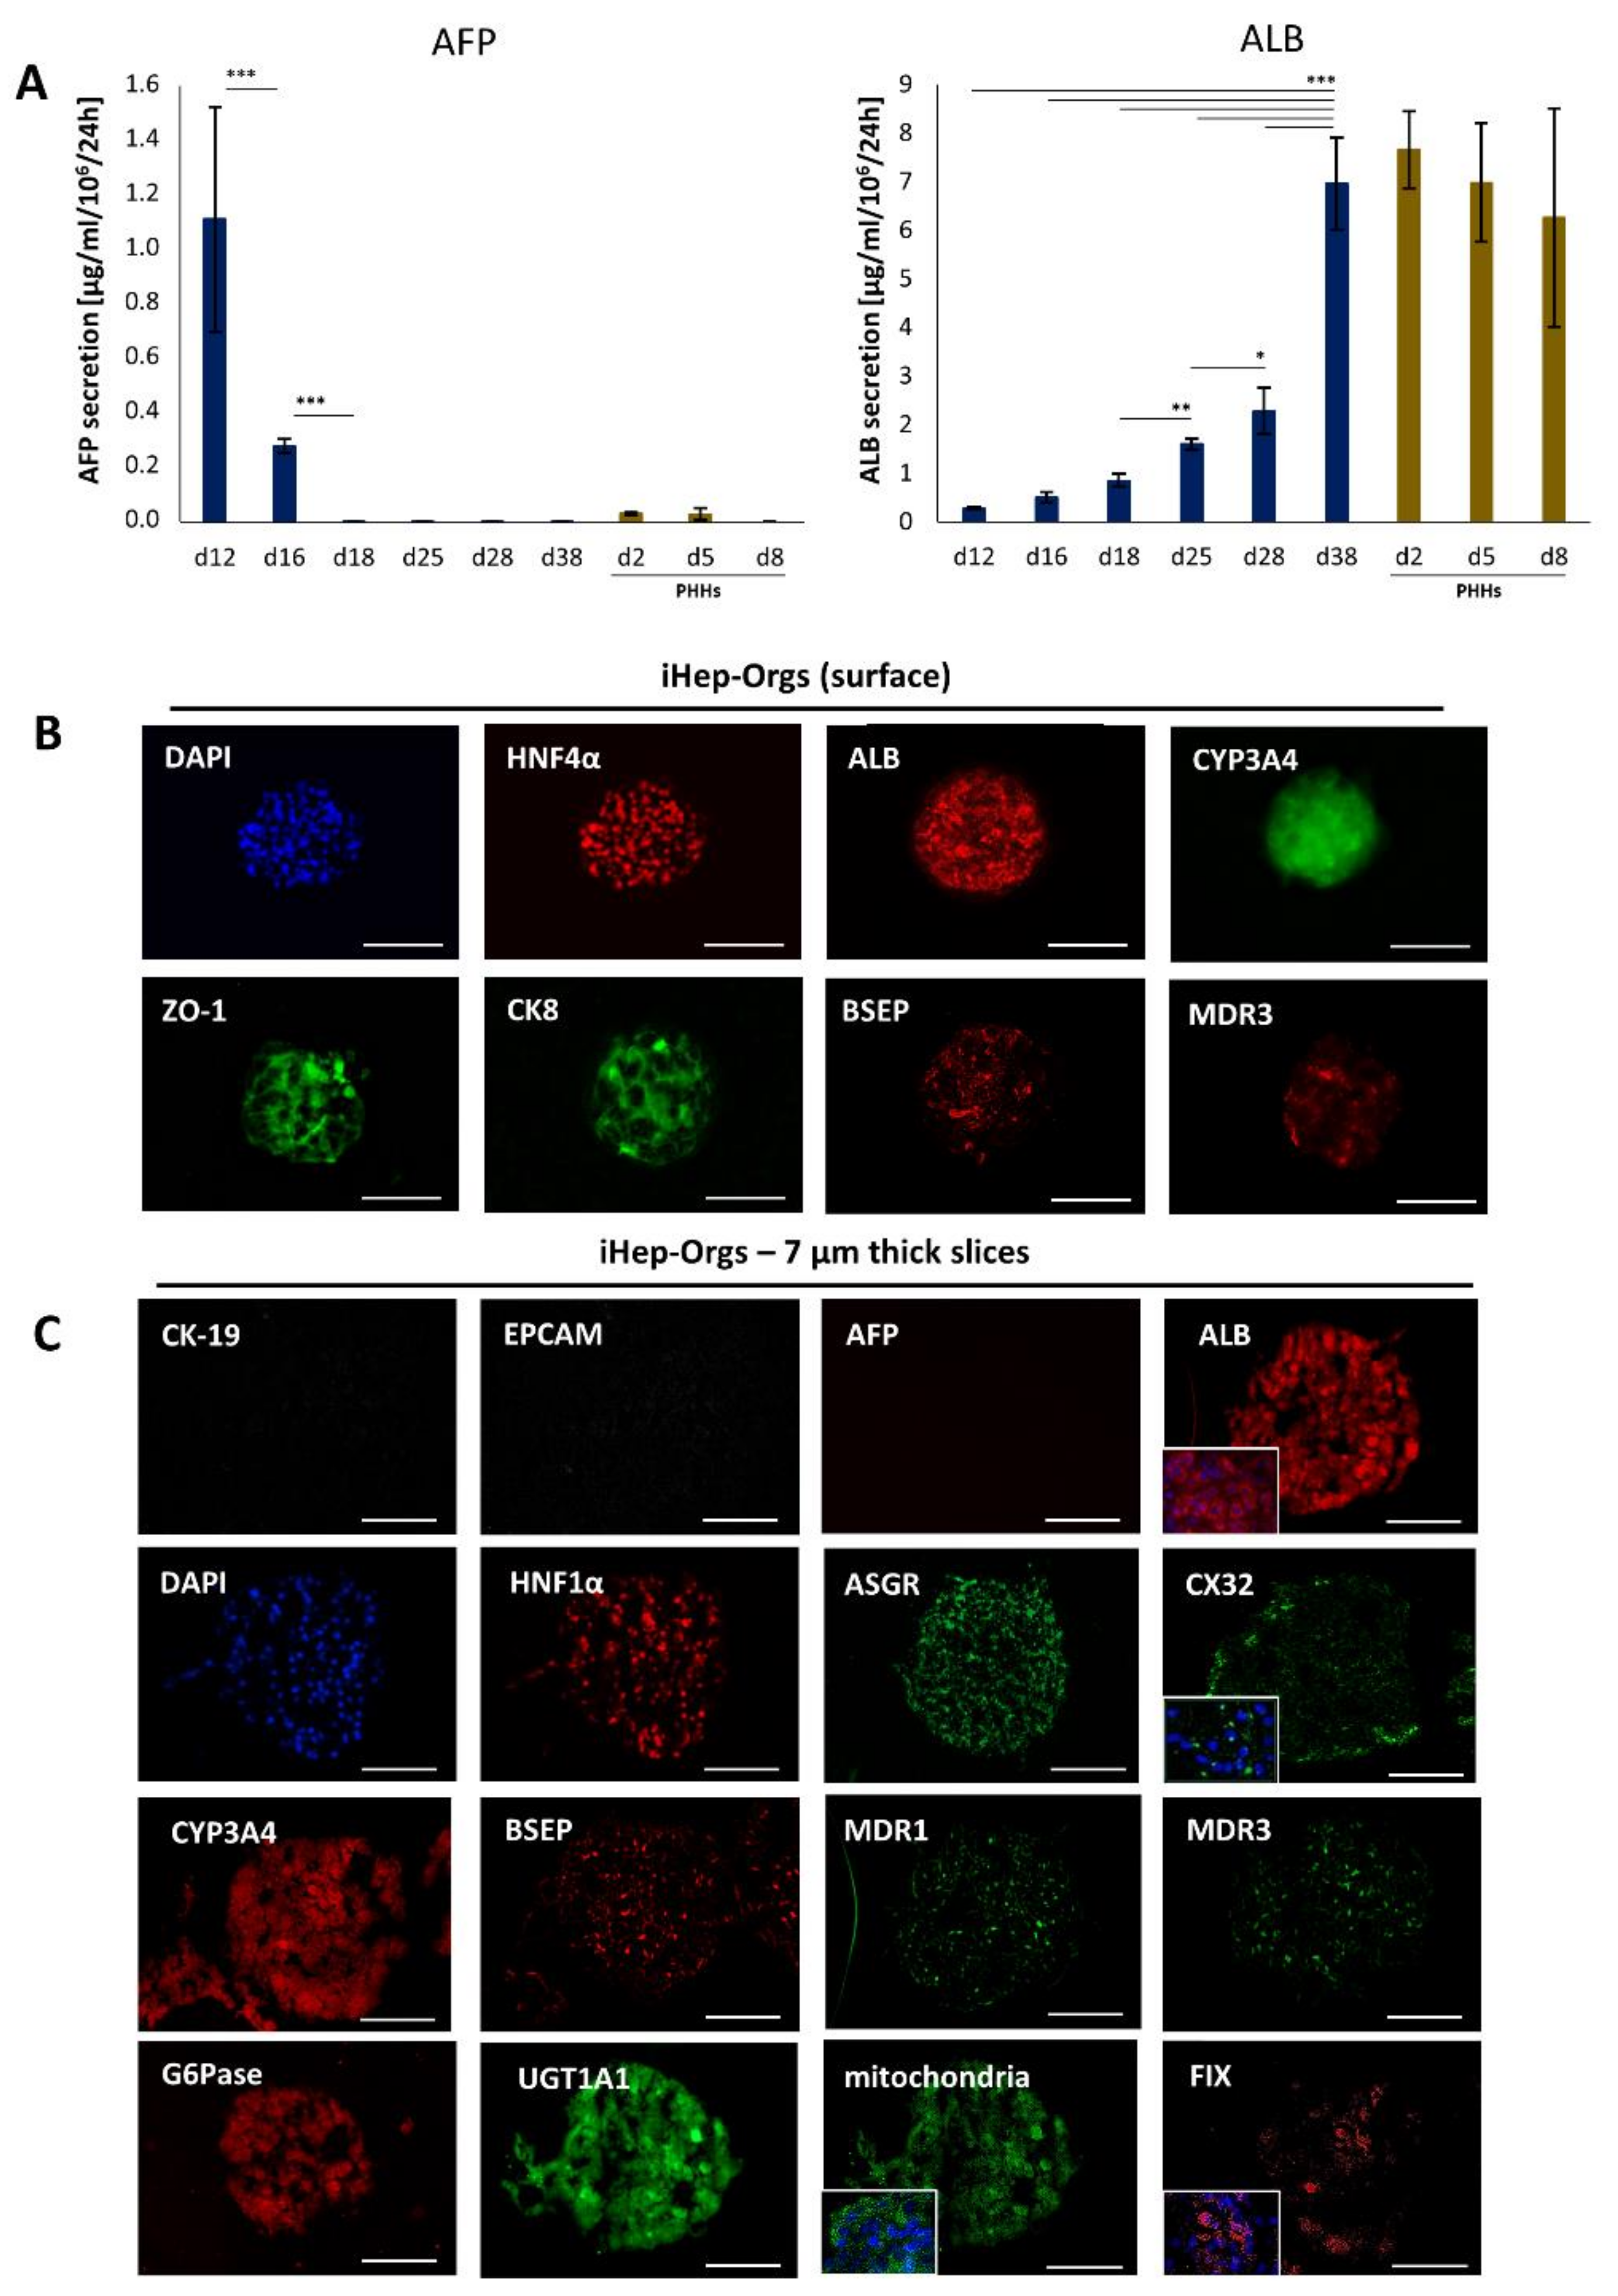
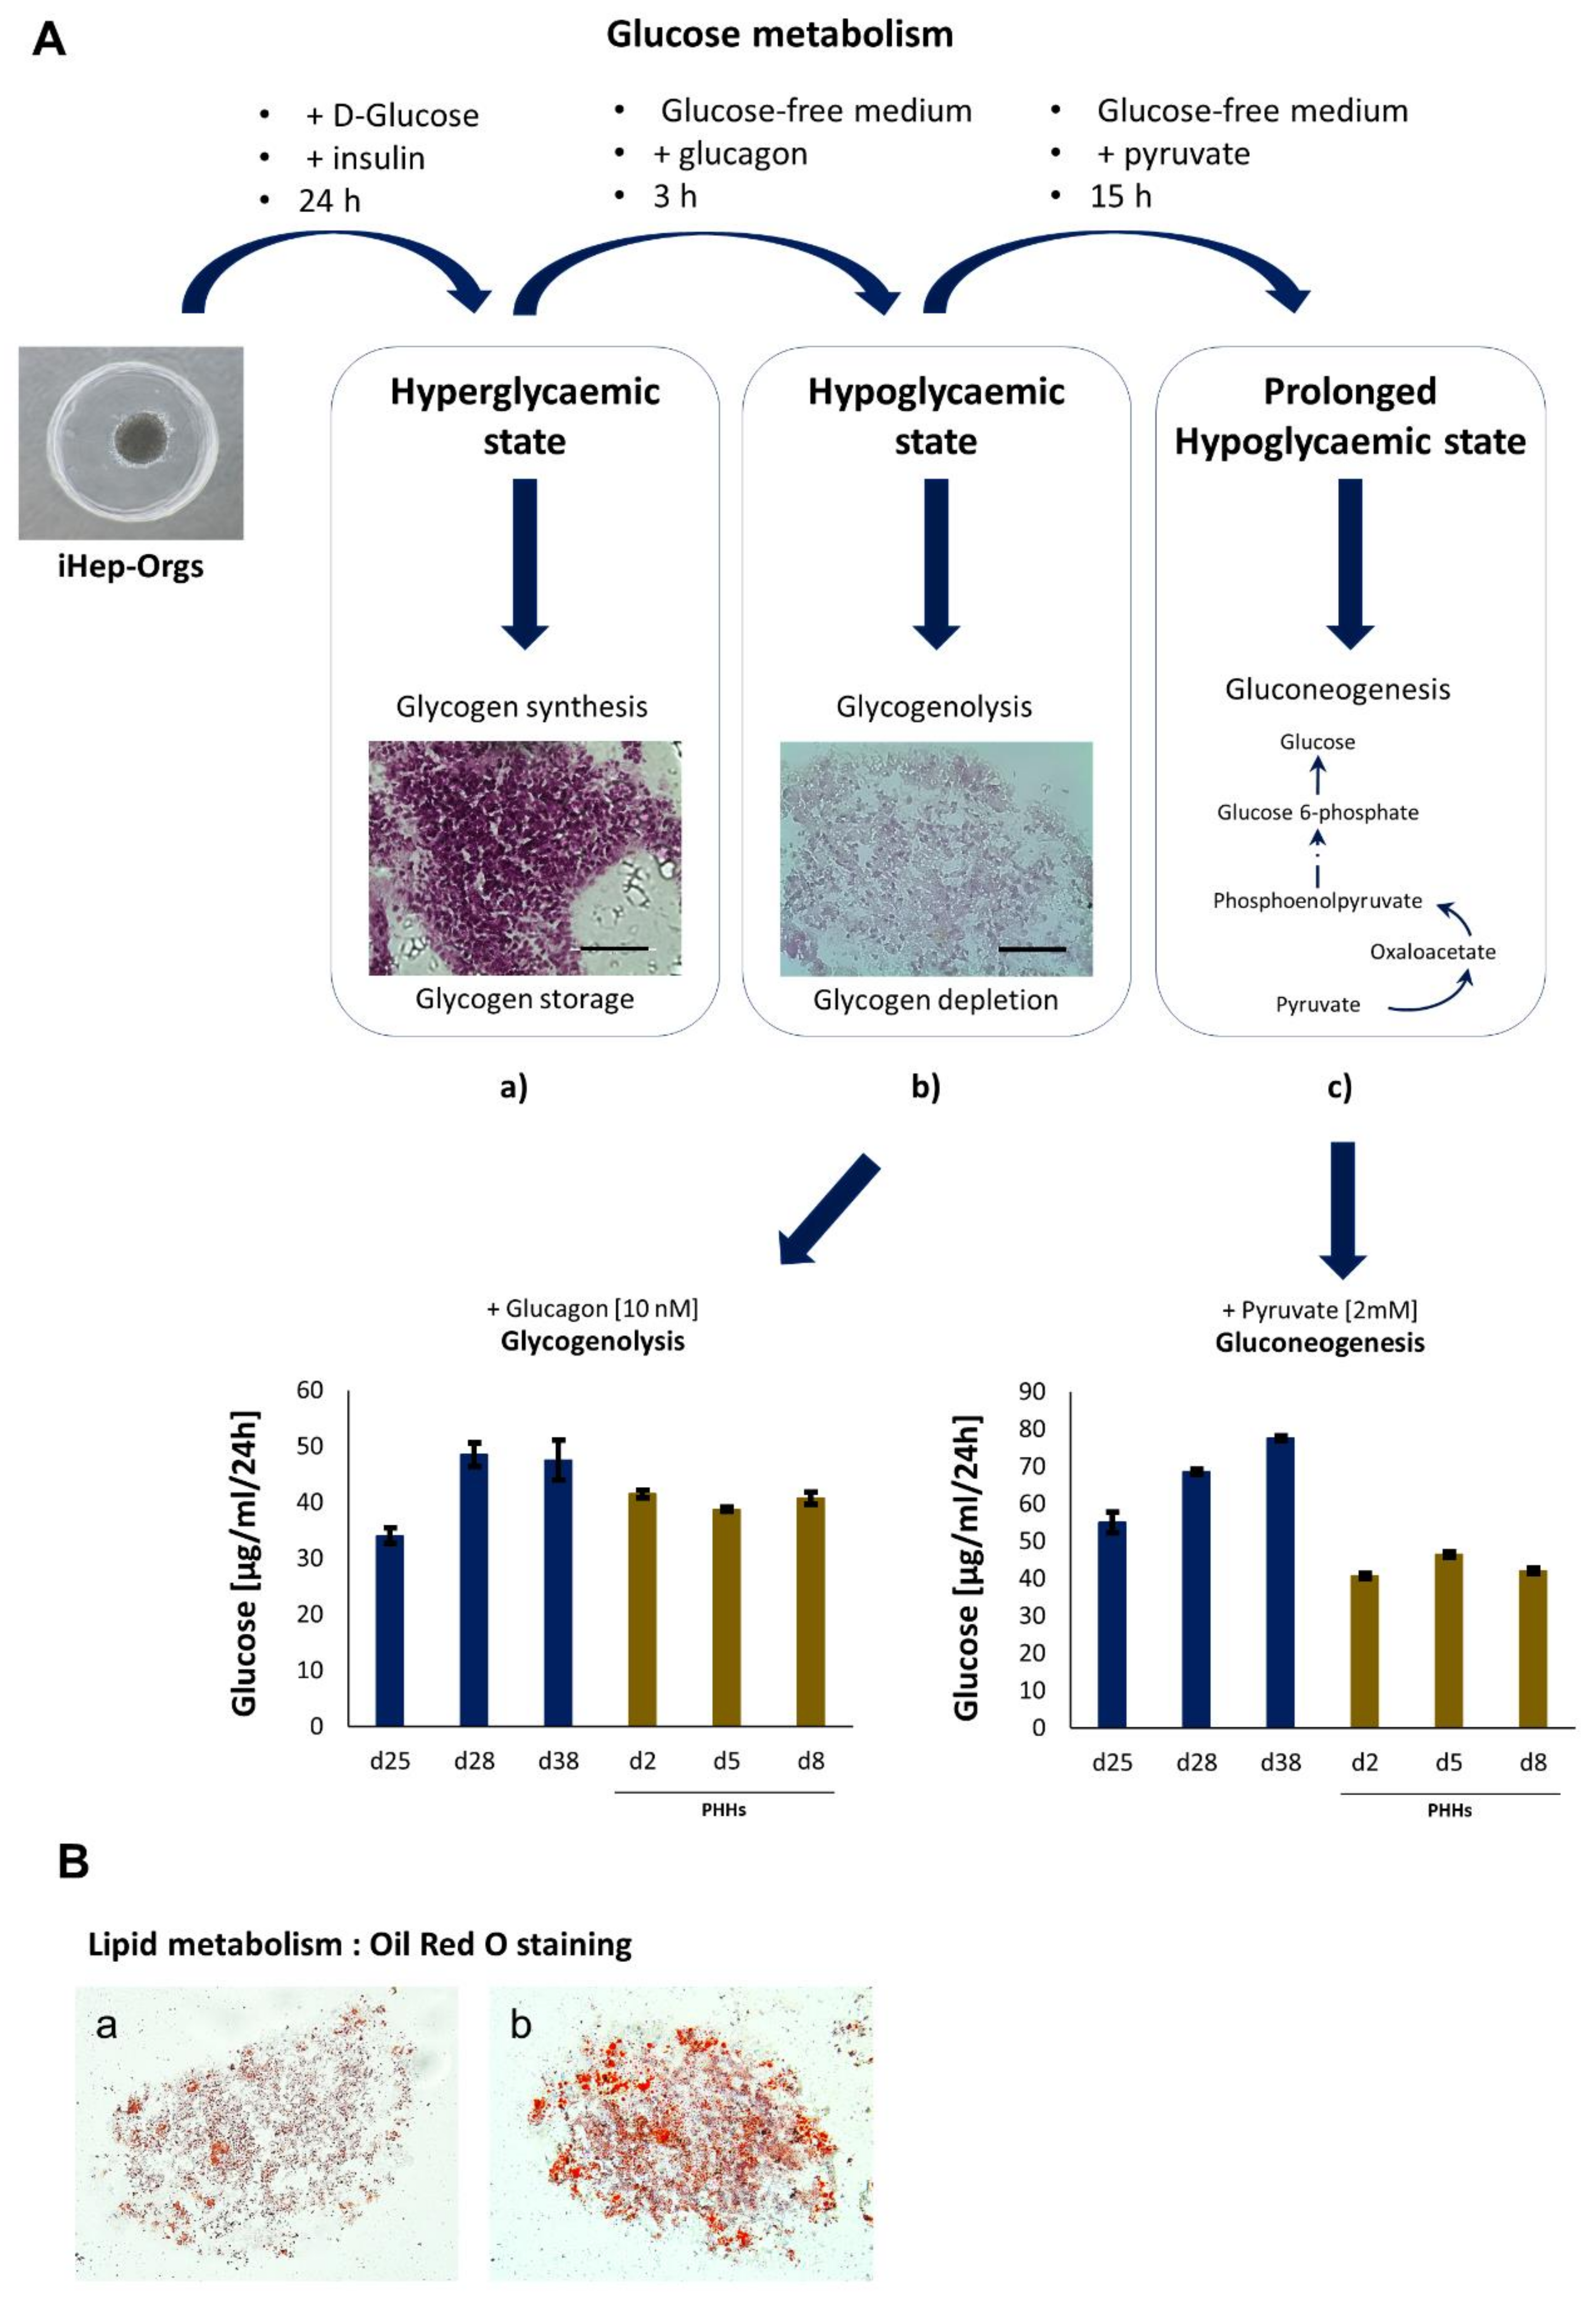
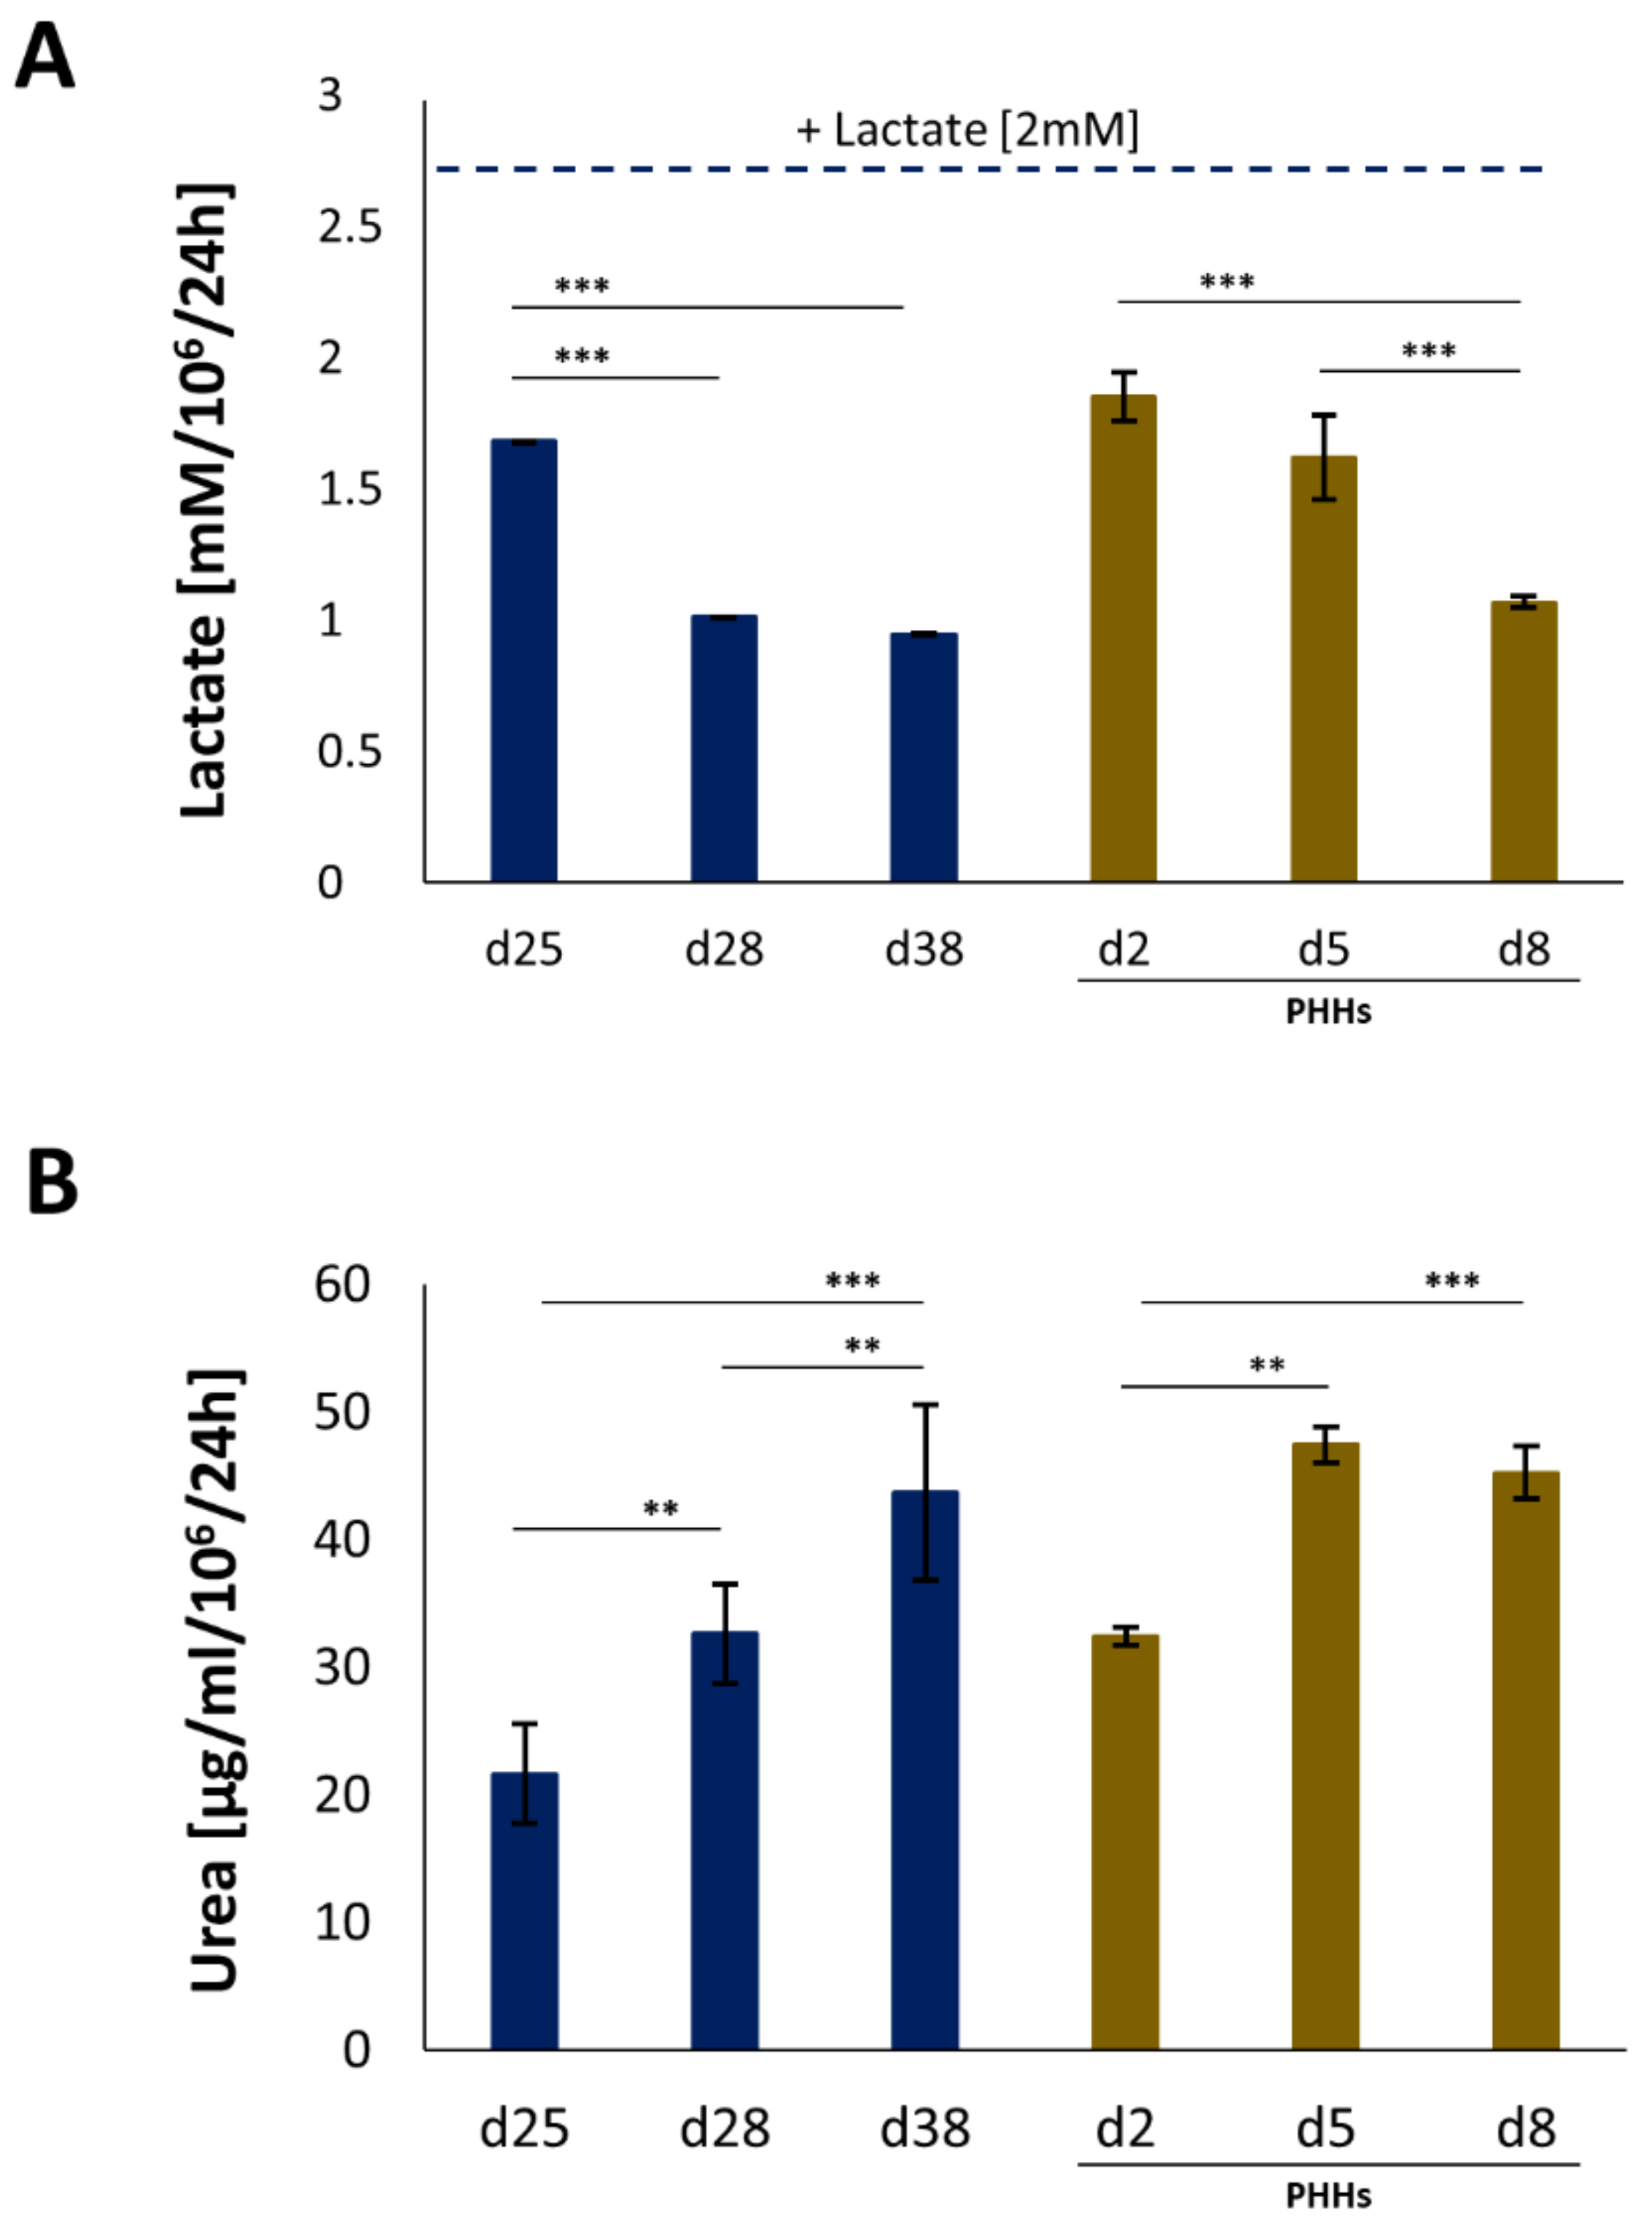
4.2. Assessment of Hepatic Functions
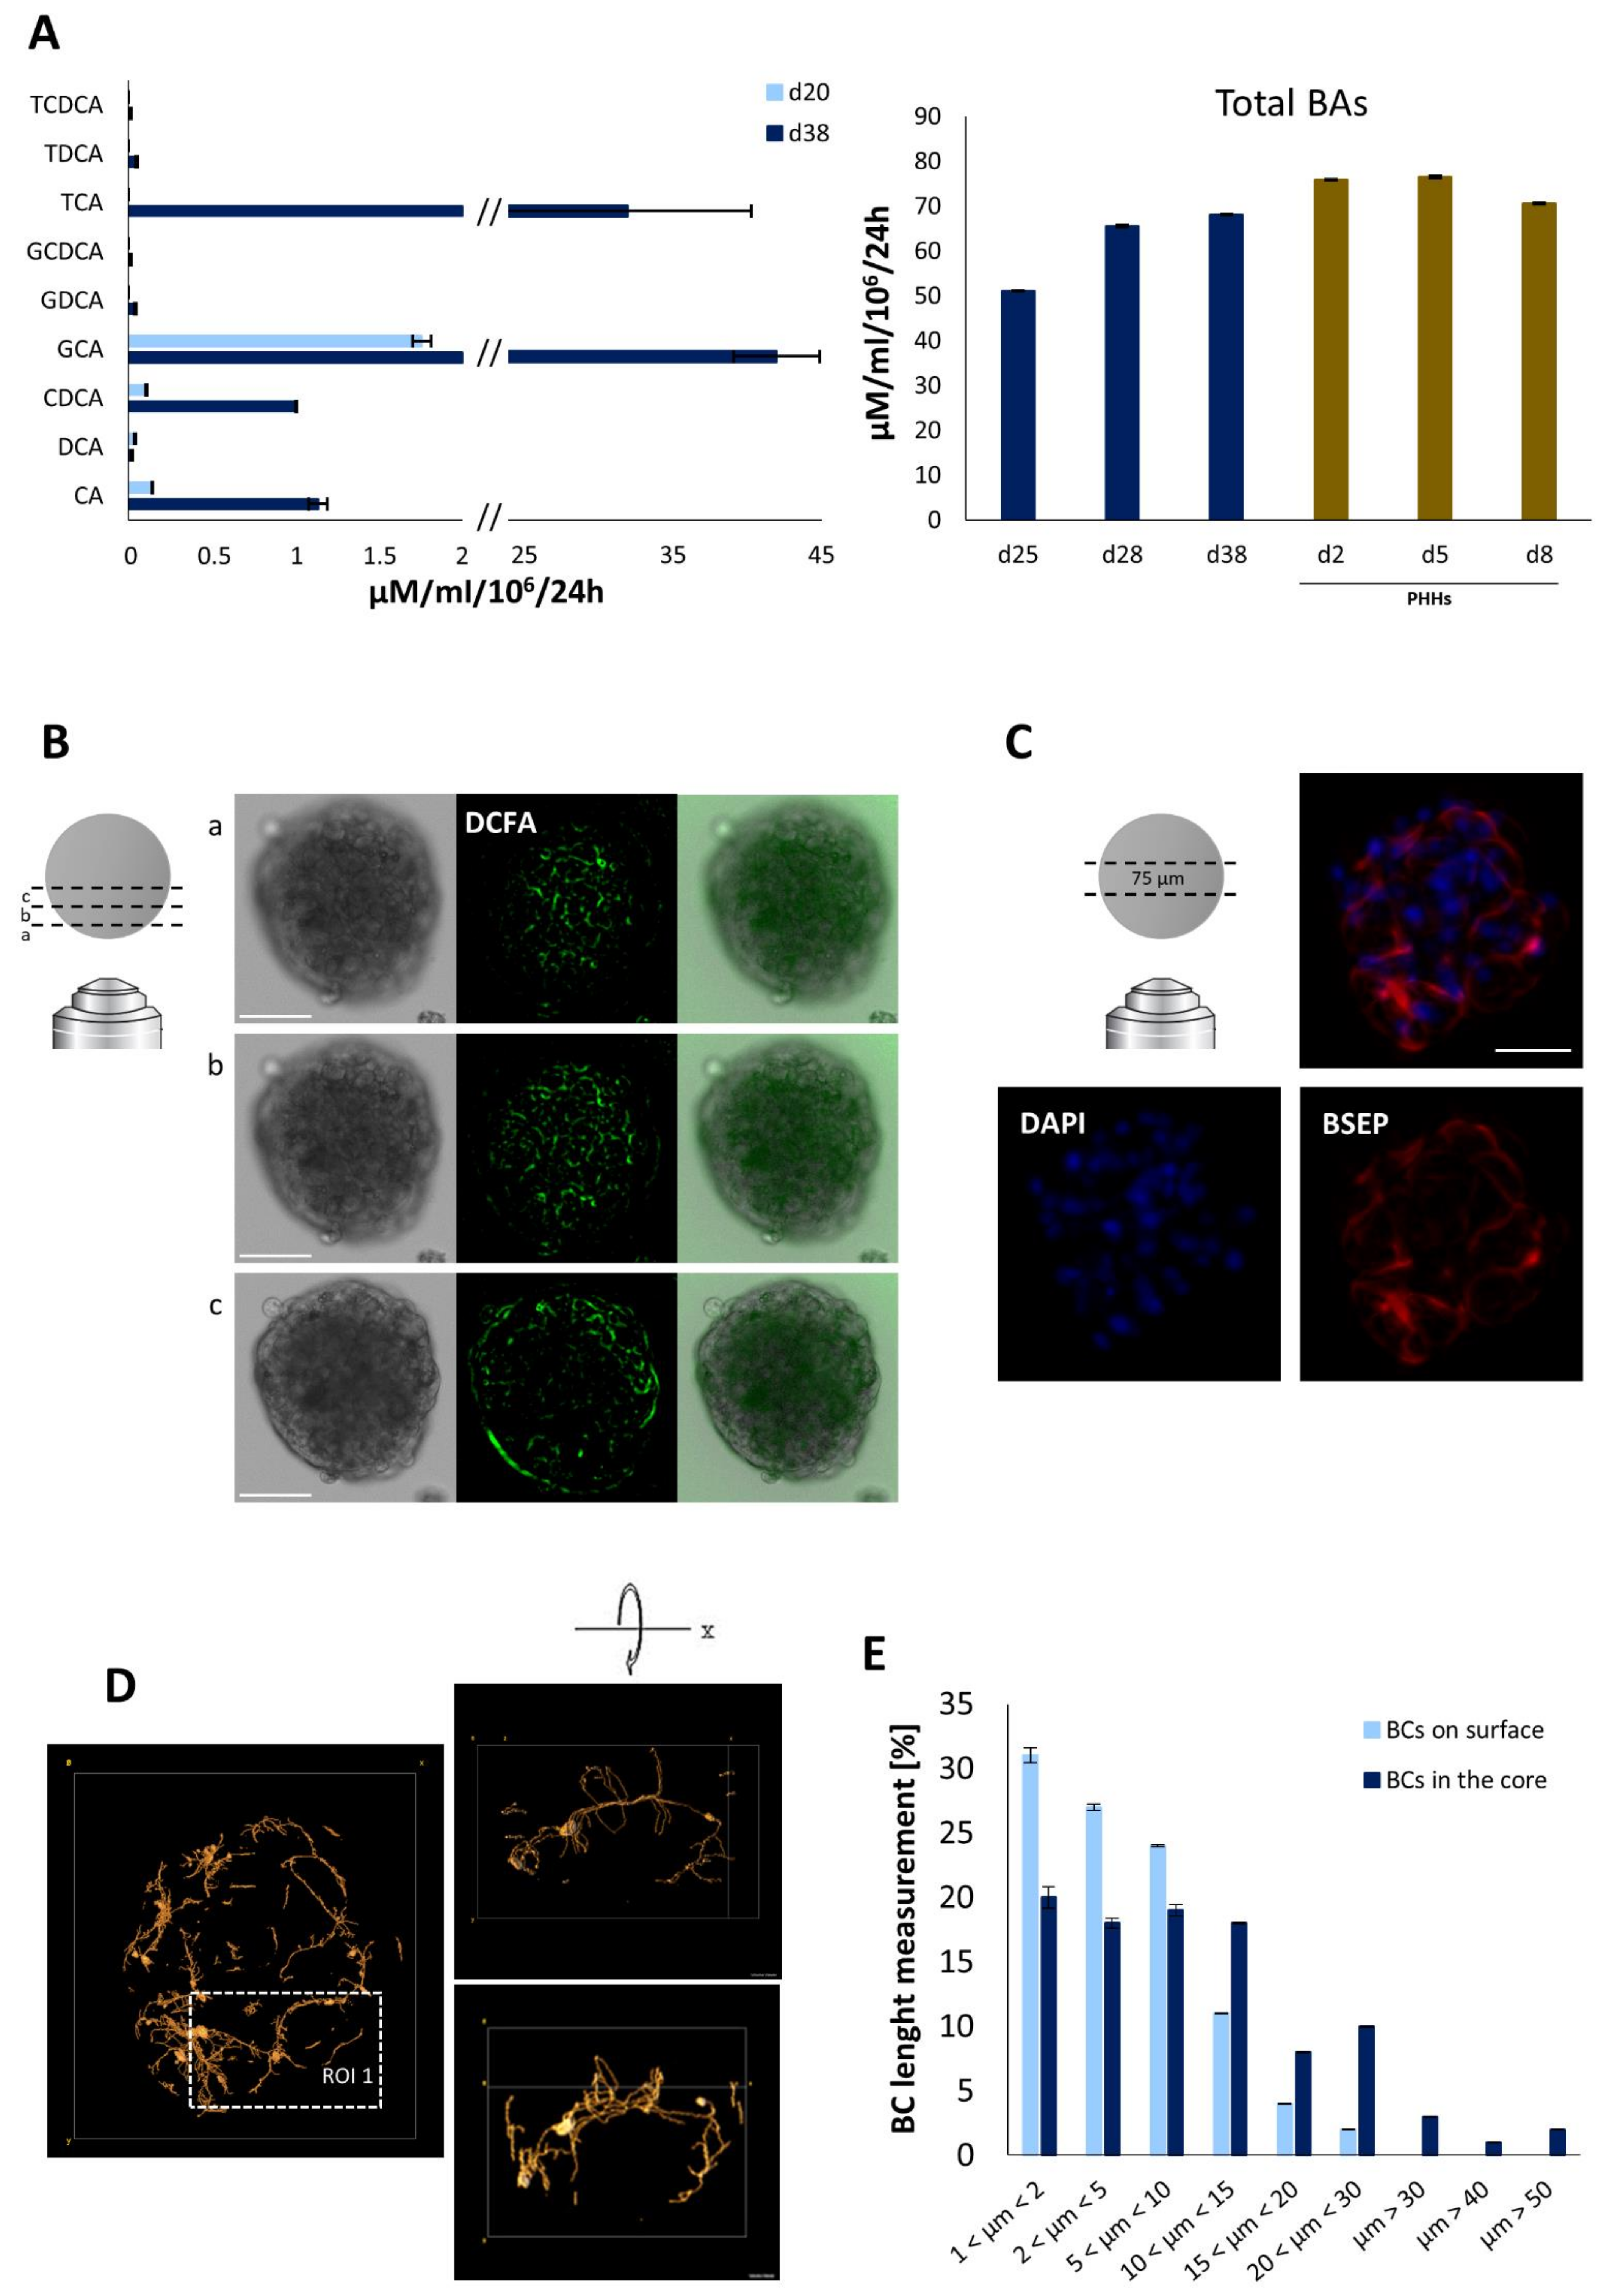
4.3. Bile Acid Secretion and Bile Canalicular Network in iHep-Orgs
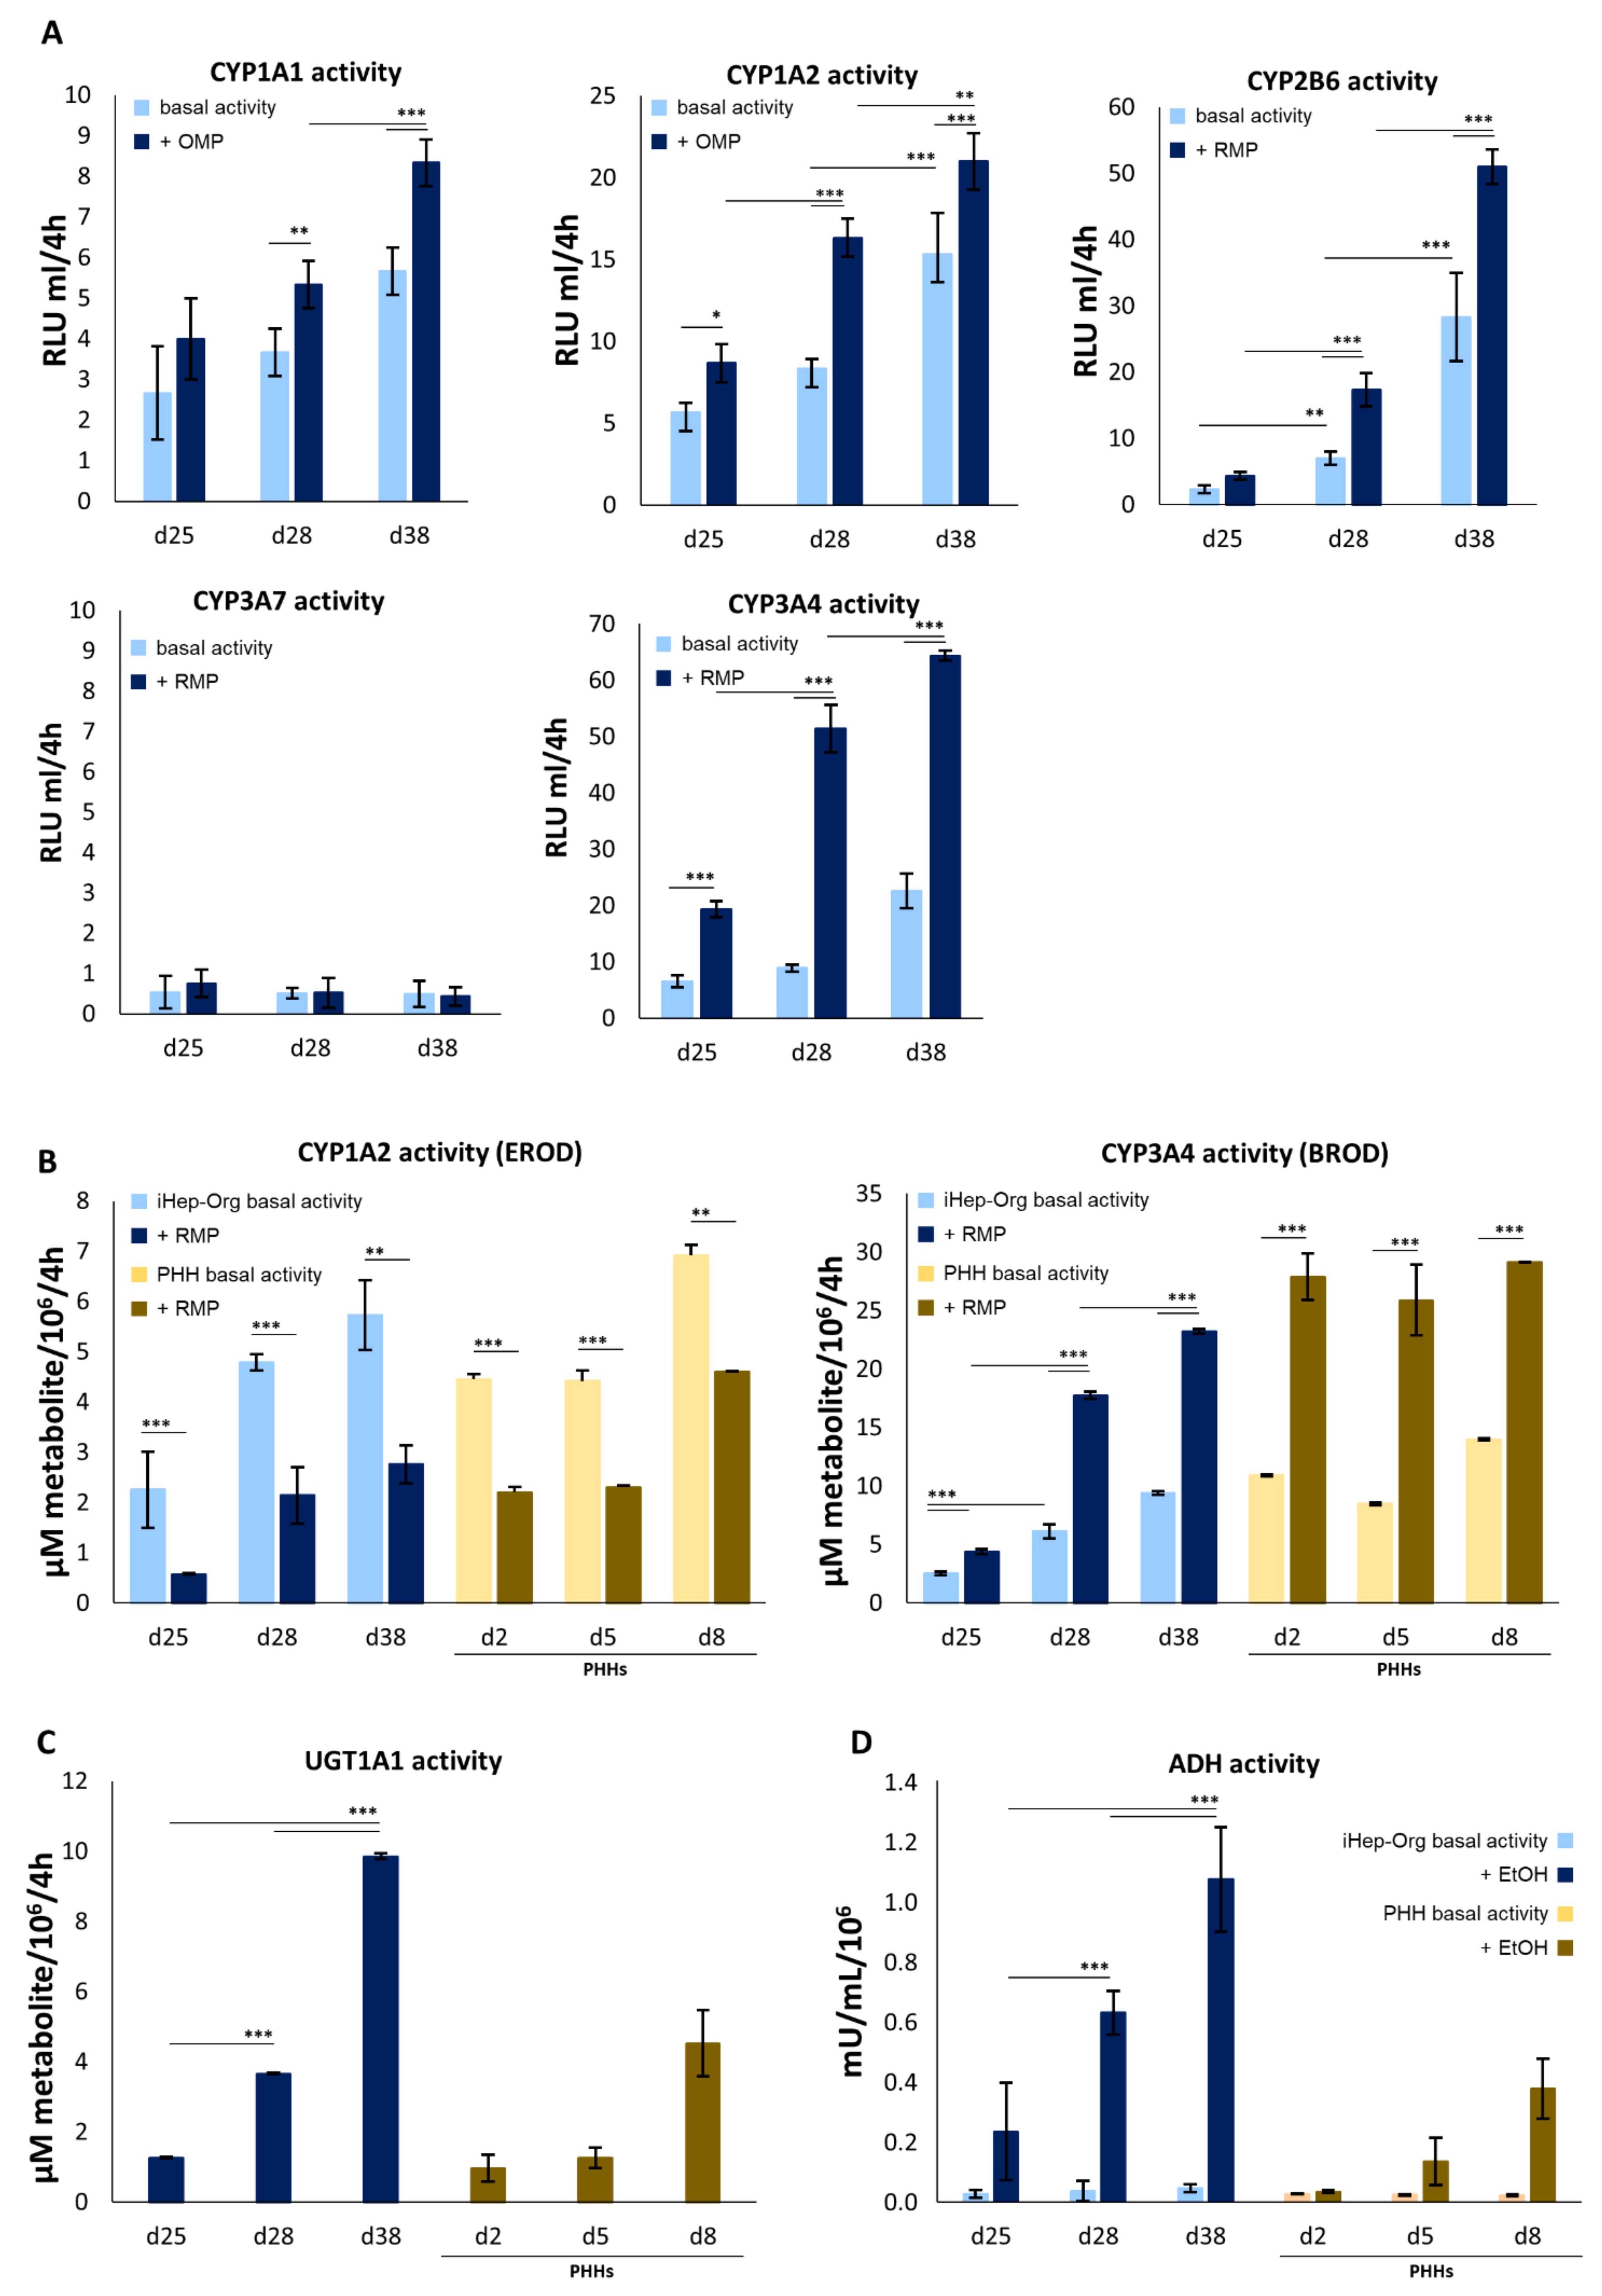
4.4. Biotransformation Capabilities of iHep-Orgs
5. Discussion
6. Conclusions
Supplementary Materials
Author Contributions
Funding
Institutional Review Board Statement
Informed Consent Statement
Acknowledgments
Conflicts of Interest
Abbreviations
References
- Li, Y.; Meng, Q.; Yang, M.; Liu, D.; Hou, X.; Tang, L.; Wang, X.; Lyu, Y.; Chen, X.; Liu, K.; et al. Current trends in drug metabolism and pharmaco-kinetics. Acta Pharm. Sin. B 2019, 9, 1113–1144. [Google Scholar] [CrossRef]
- Holmgren, G.; Ulfenborg, B.; Asplund, A.; Toet, K.; Andersson, C.X.; Hammarstedt, A.; Hanemaaijer, R.; Küppers-Munther, B.; Synnergren, J. Characterization of Human Induced Pluripotent Stem Cell-Derived Hepatocytes with Mature Features and Potential for Modeling Metabolic Diseases. Int. J. Mol. Sci. 2020, 21, 469. [Google Scholar] [CrossRef]
- Messina, A.; Luce, E.; Hussein, M.; Dubart-Kupperschmitt, A. Pluripotent-Stem-Cell-Derived Hepatic Cells: Hepatocytes and Organoids for Liver Therapy and Regeneration. Cells 2020, 9, 420. [Google Scholar] [CrossRef] [PubMed]
- Luce, E.; Messina, A.; Duclos-Vallée, J.; Dubart-Kupperschmitt, A. Advanced techniques and awaited clinical applications for human pluripotent stem cell differentiation into hepatocytes. Hepatology 2021, 74, 1101–1116. [Google Scholar] [CrossRef] [PubMed]
- Donato, M.T.; Tolosa, L. Stem-cell derived hepatocyte-like cells for the assessment of drug-induced liver injury. Differentiation 2019, 106, 15–22. [Google Scholar] [CrossRef]
- Chen, S.; Wang, J.; Ren, H.; Liu, Y.; Xiang, C.; Li, C.; Lu, S.; Shi, Y.; Deng, H.; Shi, X. Hepatic spheroids derived from human induced pluripotent stem cells in bio-artificial liver rescue porcine acute liver failure. Cell Res. 2020, 30, 95–97. [Google Scholar] [CrossRef]
- Baxter, M.; Withey, S.; Harrison, S.; Segeritz, C.-P.; Zhang, F.; Atkinson-Dell, R.; Rowe, C.; Gerrard, D.T.; Sison-Young, R.; Jenkins, R.; et al. Phenotypic and function-al analyses show stem cell-derived hepatocyte-like cells better mimic fetal rather than adult hepatocytes. J. Hepatol. 2015, 62, 581–589. [Google Scholar] [CrossRef]
- Schwartz, R.; Fleming, H.; Khetani, S.; Bhatia, S. Pluripotent stem cell-derived hepatocyte-like cells. Biotechnol. Adv. 2014, 32, 504–513. [Google Scholar] [CrossRef] [PubMed]
- Chen, C.; Soto-Gutierrez, A.; Baptista, P.M.; Spee, B. Biotechnology Challenges to In Vitro Maturation of Hepatic Stem Cells. Gastroenterology 2018, 154, 1258–1272. [Google Scholar] [CrossRef]
- Lou, Y.-R.; Leung, A.W. Next generation organoids for biomedical research and applications. Biotechnol. Adv. 2018, 36, 132–149. [Google Scholar] [CrossRef]
- Sakabe, K.; Takebe, T.; Asai, A. Organoid Medicine in Hepatology. Clin. Liver Dis. 2020, 15, 3–8. [Google Scholar] [CrossRef]
- Ebrahimkhani, M.R.; Neiman, J.A.S.; Raredon, M.S.B.; Hughes, D.J.; Griffith, L.G. Bioreactor technologies to support liver function in vitro. Adv. Drug Deliv. Rev. 2014, 69–70, 132–157. [Google Scholar] [CrossRef]
- Clevers, H. Modeling Development and Disease with Organoids. Cell 2016, 165, 1586–1597. [Google Scholar] [CrossRef]
- Legallais, C.; Kim, D.; Mihaila, S.M.; Mihajlovic, M.; Figliuzzi, M.; Bonandrini, B.; Salerno, S.; Yengej, F.A.Y.; Rookmaaker, M.B.; Romero, N.S.; et al. Bioengineering Organs for Blood Detoxification. Adv. Healthc. Mater. 2018, 7, e1800430. [Google Scholar] [CrossRef]
- Deguchi, S.; Takayama, K.; Mizuguchi, H. Generation of Human Induced Pluripotent Stem Cell-Derived Hepatocyte-Like Cells for Cellular Medicine. Biol. Pharm. Bull. 2020, 43, 608–615. [Google Scholar] [CrossRef]
- Caron, J.; Pène, V.; Tolosa, L.; Villaret, M.; Luce, E.; Fourrier, A.; Heslan, J.-M.; Saheb, S.; Bruckert, E.; Gómez-Lechón, M.J.; et al. Low-density lipoprotein receptor-deficient hepatocytes differentiated from induced pluripotent stem cells allow familial hypercholes-terolemia modeling, CRISPR/Cas-mediated genetic correction, and productive hepatitis C virus infection. Stem Cell Res. Ther. 2019, 10, 221. [Google Scholar] [CrossRef]
- Steichen, C.; Luce, E.; Maluenda, J.; Tosca, L.; Moreno-Gimeno, I.; Desterke, C.; Dianat, N.; Goulinet-Mainot, S.; Awan-Toor, S.; Burks, D.; et al. Messenger RNA- versus Retrovirus-Based Induced Pluripotent Stem Cell Reprogramming Strategies: Analysis of Genomic Integrity. Stem Cells Transl. Med. 2014, 3, 686–691. [Google Scholar] [CrossRef]
- Messina, A.; Morelli, S.; Forgacs, G.; Barbieri, G.; Drioli, E.; De Bartolo, L. Self-assembly of tissue spheroids on polymeric membranes: Self-assembly of spheroids on polymeric membranes. J. Tissue Eng. Regen. Med. 2017, 11, 2090–2103. [Google Scholar] [CrossRef]
- Humbert, L.; Maubert, M.A.; Wolf, C.; Duboc, H.; Mahé, M.; Farabos, D.; Seksik, P.; Mallet, J.M.; Trugnan, G.; Masliah, J.; et al. Bile acid profiling in human biological samples: Comparison of extraction procedures and application to normal and cholestatic patients. J. Chromatogr. B 2012, 899, 135–145. [Google Scholar] [CrossRef]
- Ma, X.; Duan, Y.; Tschudy-Seney, B.; Roll, G.; Behbahan, I.S.; Ahuja, T.P.; Tolstikov, V.; Wang, C.; McGee, J.; Khoobyari, S.; et al. Highly Efficient Differentiation of Functional Hepatocytes From Human Induced Pluripotent Stem Cells. Stem Cells Transl. Med. 2013, 2, 409–419. [Google Scholar] [CrossRef]
- Bell, C.C.; Lauschke, V.M.; Vorrink, S.U.; Palmgren, H.; Duffin, R.; Andersson, T.B.; Ingelman-Sundberg, M. Transcriptional, Functional, and Mechanistic Comparisons of Stem Cell-Derived Hepatocytes, HepaRG Cells, and Three-Dimensional Human Hepatocyte Spheroids as Predictive In Vitro Systems for Drug-Induced Liver Injury. Drug Metab. Dispos. Biol. Fate Chem. 2017, 45, 419–429. [Google Scholar] [CrossRef] [PubMed]
- Jozefczuk, J.; Prigione, A.; Chavez, L.; Adjaye, J. Comparative Analysis of Human Embryonic Stem Cell and Induced Pluripotent Stem Cell-Derived Hepatocyte-Like Cells Reveals Current Drawbacks and Possible Strategies for Improved Differentiation. Stem Cells Dev. 2011, 20, 1259–1275. [Google Scholar] [CrossRef]
- Godoy, P.; Schmidt-Heck, W.; Natarajan, K.; Lucendo-Villarin, B.; Szkolnicka, D.; Asplund, A.; Björquist, P.; Widera, A.; Stöber, R.; Campos, G.; et al. Gene net-works and transcription factor motifs defining the differentiation of stem cells into hepatocyte-like cells. J. Hepatol. 2015, 63, 934–942. [Google Scholar] [CrossRef]
- Gao, Y.; Zhang, X.; Zhang, L.; Cen, J.; Ni, X.; Liao, X.; Yang, C.; Li, Y.; Chen, X.; Zhang, Z.; et al. Distinct Gene Expression and Epigenetic Signatures in Hepatocyte-like Cells Produced by Different Strategies from the Same Donor. Stem Cell Rep. 2017, 9, 1813–1824. [Google Scholar] [CrossRef] [PubMed]
- Pashos, E.E.; Park, Y.; Wang, X.; Raghavan, A.; Yang, W.; Abbey, D.; Peters, D.T.; Arbelaez, J.; Hernandez, M.; Kuperwasser, N.; et al. Large, Diverse Population Cohorts of hiPSCs and Derived Hepatocyte-like Cells Reveal Functional Genetic Variation at Blood Lipid-Associated Loci. Cell Stem Cell 2017, 20, 558–570. [Google Scholar] [CrossRef] [PubMed]
- Kamiya, A.; Kinoshita, T.; Miyajima, A. Oncostatin M and hepatocyte growth factor induce hepatic maturation via distinct signaling pathways. FEBS Lett. 2001, 492, 90–94. [Google Scholar] [CrossRef]
- Wallin, R.; Hutson, S.M. Dexamethasone Stimulates Vitamin K-Dependent Carboxylase Activity in Neonatal Rats and Cultured Fetal Hepatocytes. Pediatr. Res. 1991, 30, 281–285. [Google Scholar] [CrossRef] [PubMed][Green Version]
- Ren, P.; De Feijter, A.W.; Paul, D.L.; Ruch, R.J. Enhancement of liver cell gap junction protein expression by glucocorticoids. Carcinogenesis 1994, 15, 1807–1813. [Google Scholar] [CrossRef]
- Qin, J.; Chang, M.; Wang, S.; Liu, Z.; Zhu, W.; Wang, Y.; Yan, F.; Li, J.; Zhang, B.; Dou, J.L.G.; et al. Connexin 32-mediated cell-cell communication is essential for hepatic differentiation from human embryonic stem cells. Sci. Rep. 2016, 6, 37388. [Google Scholar] [CrossRef]
- Li, Z.-Q.; He, F.-Y.; Stehle, C.J.; Wang, Z.; Kar, S.; Finn, F.M.; Carr, B.I. Vitamin K uptake in hepatocytes and hepatoma cells. Life Sci. 2002, 70, 2085–2100. [Google Scholar] [CrossRef]
- Avior, Y.; Levy, G.; Zimerman, M.; Kitsberg, D.; Schwartz, R.; Sadeh, R.; Moussaieff, A.; Cohen, M.; Itskovitz-Eldor, J.; Nahmias, Y. Microbial-derived lithocholic acid and vitamin K 2 drive the metabolic maturation of pluripotent stem cells-derived and fetal hepatocytes. Hepatology 2015, 62, 265–278. [Google Scholar] [CrossRef]
- Dihingia, A.; Ozah, D.; Ghosh, S.; Sarkar, A.; Baruah, P.K.; Kalita, J.; Sil, P.C.; Manna, P. Vitamin K1 inversely correlates with glycemia and insulin resistance in patients with type 2 diabetes (T2D) and positively regulates SIRT1/AMPK pathway of glucose metabolism in liver of T2D mice and hepatocytes cultured in high glucose. J. Nutr. Biochem. 2018, 52, 103–114. [Google Scholar] [CrossRef]
- Bordoloi, J.; Ozah, D.; Bora, T.; Kalita, J.; Manna, P. Gamma-glutamyl carboxylated Gas6 mediates the beneficial effect of vitamin K on lowering hyperlipidemia via regulating the AMPK/SREBP1/PPARα signaling cascade of lipid metabolism. J. Nutr. Biochem. 2019, 70, 174–184. [Google Scholar] [CrossRef]
- Luce, E.; Steichen, C.; Allouche, M.; Messina, A.; Heslan, J.; Lambert, T.; Weber, A.; Nguyen, T.H.; Christophe, O.; Dubart-Kupperschmitt, A. In vitro recovery of FIX clotting activity as a marker of highly functional hepatocytes in a hemophilia B iPSC model. Hepatology 2021. Online ahead of print. [Google Scholar] [CrossRef]
- Gieseck, R.L., III; Hannan, N.R.F.; Bort, R.; Hanley, N.A.; Drake, R.A.L.; Cameron, G.W.W.; Wynn, T.A.; Vallier, L. Maturation of Induced Pluripotent Stem Cell Derived Hepatocytes by 3D-Culture. PLoS ONE 2014, 9, e86372. [Google Scholar]
- Akbari, S.; Sevinç, G.G.; Ersoy, N.; Basak, O.; Kaplan, K.; Sevinç, K.; Ozel, E.; Sengun, B.; Enustun, E.; Ozcimen, B.; et al. Robust, Long-Term Culture of Endoderm-Derived Hepatic Organoids for Disease Modeling. Stem Cell Rep. 2019, 13, 627–641. [Google Scholar] [CrossRef]
- Mun, S.J.; Ryu, J.-S.; Lee, M.-O.; Son, Y.S.; Oh, S.J.; Cho, H.-S.; Son, M.-Y.; Kim, D.-S.; Kim, S.J.; Yoo, H.J.; et al. Generation of expandable human pluripotent stem cell-derived hepatocyte-like liver organoids. J. Hepatol. 2019, 71, 970–985. [Google Scholar] [CrossRef]
- Kulkeaw, K.; Tubsuwan, A.; Tongkrajang, N.; Whangviboonkij, N. Generation of human liver organoids from pluripotent stem cell-derived hepatic endoderms. PeerJ 2020, 8, e9968. [Google Scholar] [CrossRef]
- Shinozawa, T.; Kimura, M.; Cai, Y.; Saiki, N.; Yoneyama, Y.; Ouchi, R.; Koike, H.; Maezawa, M.; Zhang, R.-R.; Dunn, A.; et al. High-Fidelity Drug-Induced Liver Injury Screen Using Human Pluripotent Stem Cell–Derived Organoids. Gastroenterology 2021, 160, 831–846.e10. [Google Scholar] [CrossRef]


Publisher’s Note: MDPI stays neutral with regard to jurisdictional claims in published maps and institutional affiliations. |
© 2022 by the authors. Licensee MDPI, Basel, Switzerland. This article is an open access article distributed under the terms and conditions of the Creative Commons Attribution (CC BY) license (https://creativecommons.org/licenses/by/4.0/).
Share and Cite
Messina, A.; Luce, E.; Benzoubir, N.; Pasqua, M.; Pereira, U.; Humbert, L.; Eguether, T.; Rainteau, D.; Duclos-Vallée, J.-C.; Legallais, C.; et al. Evidence of Adult Features and Functions of Hepatocytes Differentiated from Human Induced Pluripotent Stem Cells and Self-Organized as Organoids. Cells 2022, 11, 537. https://doi.org/10.3390/cells11030537
Messina A, Luce E, Benzoubir N, Pasqua M, Pereira U, Humbert L, Eguether T, Rainteau D, Duclos-Vallée J-C, Legallais C, et al. Evidence of Adult Features and Functions of Hepatocytes Differentiated from Human Induced Pluripotent Stem Cells and Self-Organized as Organoids. Cells. 2022; 11(3):537. https://doi.org/10.3390/cells11030537
Chicago/Turabian StyleMessina, Antonietta, Eléanor Luce, Nassima Benzoubir, Mattia Pasqua, Ulysse Pereira, Lydie Humbert, Thibaut Eguether, Dominique Rainteau, Jean-Charles Duclos-Vallée, Cécile Legallais, and et al. 2022. "Evidence of Adult Features and Functions of Hepatocytes Differentiated from Human Induced Pluripotent Stem Cells and Self-Organized as Organoids" Cells 11, no. 3: 537. https://doi.org/10.3390/cells11030537
APA StyleMessina, A., Luce, E., Benzoubir, N., Pasqua, M., Pereira, U., Humbert, L., Eguether, T., Rainteau, D., Duclos-Vallée, J.-C., Legallais, C., & Dubart-Kupperschmitt, A. (2022). Evidence of Adult Features and Functions of Hepatocytes Differentiated from Human Induced Pluripotent Stem Cells and Self-Organized as Organoids. Cells, 11(3), 537. https://doi.org/10.3390/cells11030537