Article

Dectin-1 as a Potential Inflammatory Biomarker for Metabolic Inflammation in Adipose Tissue of Individuals with Obesity

1
Animal and Imaging Core Facilities, Dasman Diabetes Institute, Dasman 15462, Kuwait
2
Genetics and Bioinformatics, Dasman Diabetes Institute, Dasman 15462, Kuwait
3
Immunology and Microbiology Department, Dasman Diabetes Institute, Dasman 15462, Kuwait
*
Authors to whom correspondence should be addressed.
These authors contributed equally to this work.
Cells 2022, 11(18), 2879; https://doi.org/10.3390/cells11182879
Submission received: 27 July 2022 / Revised: 2 September 2022 / Accepted: 10 September 2022 / Published: 15 September 2022
(This article belongs to the Special Issue The Role of Adipose Tissue in Metabolic Diseases and Beyond)

Abstract

:
In obesity, macrophage activation and infiltration in adipose tissue (AT) underlie chronic low-grade inflammation-induced insulin resistance. Although dectin-1 is primarily a pathogen recognition receptor and innate immune response modulator, its role in metabolic syndromes remains to be clarified. This study aimed to investigate the dectin-1 gene expression in subcutaneous AT in the context of obesity and associated inflammatory markers. Subcutaneous AT biopsies were collected from 59 nondiabetic (lean/overweight/obese) individuals. AT gene expression levels of dectin-1 and inflammatory markers were determined via real-time reverse transcriptase-quantitative polymerase chain reaction. Dectin-1 protein expression was assessed using immunohistochemistry. Plasma lipid profiles were measured by ELISA. AT dectin-1 transcripts and proteins were significantly elevated in obese as compared to lean individuals. AT dectin-1 transcripts correlated positively with body mass index and fat percentage (r ≥ 0.340, p ≤ 0.017). AT dectin-1 RNA levels correlated positively with clinical parameters, including plasma C-reactive protein and CCL5/RANTES, but negatively with that of adiponectin. The expression of dectin-1 transcripts was associated with that of various proinflammatory cytokines, chemokines, and their cognate receptors (r ≥ 0.300, p ≤ 0.05), but not with anti-inflammatory markers. Dectin-1 and members of the TLR signaling cascade were found to be significantly associated, suggesting an interplay between the two pathways. Dectin-1 expression was correlated with monocyte/macrophage markers, including CD16, CD68, CD86, and CD163, suggesting its monocytes/macrophage association in an adipose inflammatory microenvironment. Dectin-1 expression was independently predicted by CCR5, CCL20, TLR2, and MyD88. In conclusion, dectin-1 may be regarded as an AT biomarker of metabolic inflammation in obesity.

1. Introduction

The global prevalence of obesity has increased manifold over the last four decades [1,2]. Worldwide, the health community has been exploring preventive strategies for obesity, including nutritional and surgical interventions. Miscellaneous factors cause obesity [3]; thus, personalized medical treatments and healthcare policy changes addressing emerging needs could be more effective [4,5,6]. Obesity is a potential risk factor for other metabolic disorders [7,8]. Nonetheless, the intertwined roles of genetic and environmental cofounders remain to be further elucidated [9,10]. The complex pathophysiology of obesity implicates the alteration of critical factors, including glucose homeostasis, dyslipidemia, and blood pressure. However, chronic systemic low-grade inflammation is reportedly the fundamental and main cause [11,12]. Remarkably, the precise mechanisms of the association of inflammation with metabolic syndrome are yet to be identified [13,14].
Adipose tissue (AT) is composed of multiple cells of different origins. Besides adipocytes, AT contains progenitor cells, residential leukocytes, and neuronal and vasculature cells [15,16]. Communication between these cell types has been found to be crucial for maintaining the tissue homeostasis and an active response to changes in physiological and environmental conditions [17]. AT is also a dynamic endocrine organ that produces and secretes hormones, adipokines, and chemokines [18]. Aberrant changes in the AT are associated with inflammatory responses and metabolic dysfunctions observed in obese patients [19,20]. The onset of obesity is often associated with rapid AT expansion, causing inadequate vascularization, hypoxia, and inflammation. Dysfunctional AT releases high levels of free fatty acids, adipokines, and proinflammatory cytokines/chemokines in the bloodstream which could reach other organs and ultimately affect their harmonized functions [21]. Notably, the secretion of inflammatory markers is chronologically correlated with the stage of obesity and its associated complications including insulin resistance and cardiovascular diseases [22,23].
Dectin-1 belongs to the type II transmembrane family C-type lectin receptors (CLRs) expressed in myeloid cells (monocytes, macrophages, and neutrophils) and antigen-presenting dendritic cells [24,25] and is involved in fungal recognition and innate immune response modulation. Dectin-1 binds to β-(1,3)-glucans at the fungal cell wall and triggers proinflammatory cytokine stimulation through the activation of reactive oxygen species and NF-κB signaling [26,27,28]. Dectin-1 deficiency in humans and rodent knockout models has been associated with a moderate, but noninvasive, fungal infection, suggesting the existence of compensatory antifungal response mechanisms [29,30,31]. As reported by Mata-Martinez et al. dectin-1 activation triggers numerous downstream cellular responses, including the production of proinflammatory mediators, induction of phagocytosis, and activation of cytotoxic T-cell responses through multifactorial mechanisms [32].
The emerging roles of dectin-1 as a positive regulator of AT inflammation in high-fat diet (HFD)-fed MyD88 KO mice and as a biomarker for metabolic dysregulation in humans have recently been reported [33]. Nonetheless, its multifunctional roles in the human subcutaneous AT remain elusive. In this study, we aimed to investigate the changes in gene expression of dectin-1 in relation to modulations in the inflammatory and insulin resistance markers in the human subcutaneous AT.

2. Material and Methods

2.1. Study Population and Anthropometric Measurements

This study cohort included 59 nondiabetic individuals from both sexes who were recruited in the study at the Dasman Diabetes Institute, Kuwait. The exclusion criteria included pregnant women and individuals with diseases, such as lung, heart, kidney, or liver complications, immune dysfunction, diabetes, cancers, or hematologic disorders as previously described [34,35,36]. Using the standard formula for the body mass index (BMI) (BMI = body weight (kg)/height2 (m2)), the cohort was divided into 10 lean (BMI < 25 kg/m2), 20 overweight (25 ≤ BMI < 30 kg/m2), and 29 obese (BMI ≥ 30 kg/m2) individuals. For each category, the sample size was dependent on the sample availability and each participant’s decision to be engaged in the research study. Written informed consents were obtained from all study participants in accordance with the ethical guidelines stipulated in the Declaration of Helsinki and approved by the ethics committee of Dasman Diabetes Institute, Kuwait (Grant numbers: RA 2010-003; June 2010). Weights and heights were measured using calibrated electronic weighing scales and height-measuring bars. Waist circumferences were measured using constant-tension tapes. The IOI 353 Body Composition Analyzer (Jawon Medical, Seoul, Korea) was used to determine the whole-body compositions (percent body fat, soft lean mass, and total body water).

2.2. Collection of Subcutaneous AT

As previously described [35], human AT biopsy samples (approximately 500 mg) were collected from abdominal subcutaneous fat pads located adjacent to the umbilicus using standard sterile surgical procedures [37]. Briefly, local anesthesia, i.e., 2% lidocaine, was applied to the periumbilical area post alcohol decontamination. Tissue biopsy samples were collected through a small superficial skin incision (5 mm). After removal, the fat tissue was further dissected into smaller pieces of approximately 50–100 mg, rinsed with cold phosphate buffered saline (PBS), preserved in RNAlater, and stored at −80 °C until use [38]. For immunohistochemistry (IHC) studies, fresh AT fragments were formalin fixed, paraffin embedded, and stored at room temperature till use as described in [38].

2.3. Measurement of Metabolic Inflammatory Markers

Peripheral blood was collected from fasted individuals and evaluated for metabolic and biochemical markers, as has been described previously [39,40,41]. Fasting blood glucose (FBG) and lipid profiles, including plasma triglycerides (TGL), high-density lipoprotein (HDL), low-density lipoprotein (HDL), and total cholesterol (Chol), were measured using a Siemens Dimension RXL chemistry analyzer (Diamond Diagnostics Holliston, MA, USA). HbA1c was measured using VARIANT II (Bio-Rad, Hercules, CA, USA). Insulin resistance, HOMA-IR, was calculated from basal FBG and insulin concentrations using the following formula: HOMA-IR = fasting insulin (μU/L) × fasting glucose (nmol/L)/22.5. Plasma high-sensitivity CRP levels were measured by ELISA (BioVendor, Ashville, NC, USA). All assays were performed following the instructions of the manufacturers. White blood cell (WBC) count was measured using hematocytometry.

2.4. RNA Extraction, cDNA Synthesis, and RT-qPCR Reactions

Human AT tissue total RNA was extracted using the RNeasy kit (Qiagen, Valencia, CA, USA) as described in the manufacturer’s protocol. The first strand cDNA was synthesized from 500 ng total RNA using a High Capacity cDNA Reverse Transcription kit (Applied Biosystems, Foster City, CA, USA) as previously described [42]. Real-time reverse transcriptase-quantitative polymerase chain reaction (RT-qPCR) was performed as described elsewhere [42]. Briefly, cDNA samples (50 ng) were amplified using TaqMan Gene Expression Master Mix (Applied Biosystems) and gene-specific 20× TaqMan gene expression assays (Applied Biosystems) containing appreciated primers for target genes (listed in Supplementary Table S1) and target-specific TaqMan MGB probe labeled with FAM dye at the 5′-end and NFQ-MGB at the 3′-end of the probe using the 7900 Fast Real-Time PCR System (Applied Biosystems). The RT-qPCR reaction was initiated with uracil-DNA glycosylases (UDG, 120 s at 50 °C) and AmpliTaq gold enzyme (10 min at 95 °C) activation cycles, followed by 40 cycles where each cycle involved denaturation (15 s at 95 °C) and annealing/extension (60 s at 60 °C). Relative gene expression to the lean AT control was also calculated using the comparative cycles to threshold (CT) method, as has been described previously [43]. Results were normalized using glyceraldehyde 3-phosphate dehydrogenase (GAPDH), and means ± standard error of the mean (SEM) are expressed as fold changes in the expression relative to controls as indicated [44].

2.5. Immunohistochemistry (IHC)

Paraffin-embedded sections (4 μm thick) of subcutaneous AT were deparaffinized in xylene and rehydrated through descending grades of ethanol (100%, 95%, and 75%) to water. Antigen retrieval was then performed by placing slides in a target retrieval solution (pH 6.0; Dako, Glostrup, Denmark) in the pressure cooker boiling for 8 min and cooling for 15 min. After washing in PBS, endogenous peroxidase activity was blocked with 3% H2O2 for 30 min and non-specific antibody binding was blocked with 5% nonfat milk for 1 hr, followed by 1% bovine serum albumin solution for 1 h. The slides were incubated at room temperature overnight with primary antibody (1:100 dilution of rabbit polyclonal anti-dectin-1 antibody (Abcam, Waltham, MA, USA; #ab140039)). After washing with PBS (0.5% Tween), the slides were incubated for 1 h with secondary antibody, namely goat anti-rabbit conjugated with horseradish peroxidase polymer chain DAKO EnVision Kit (Dako, Denmark), and color was developed using a 3,3‘-diaminobenzidine (DAB) chromogen substrate. The specimens were washed, counterstained, dehydrated, cleared, and mounted as described elsewhere [45]. For analysis, digital photomicrographs of the entire AT sections (20×; Pannoramic Scan, 3DHistech, Budapest, Hungary) were used to quantify the immunohistochemical staining using ImageJ software (NIH, Bethesda, MD, USA). Dectin-1 antibody specificity was validated using spleen tissue, as shown in Supplementary Figure S1.

2.6. Statistical Analysis

Statistical analysis was performed using GraphPad Prism software (GraphPad, La Jolla, CA, USA) and SPSS for Windows version 19.01 (IBM SPSS Inc., Chicago, IL, USA). Unless otherwise indicated, data were shown as mean ± SD values. Since the sample size is small and the data are not normally distributed, non-parametric Mann-Whitney U test was used to compare means between groups. Spearman correlation and multivariable regression analysis were performed to determine associations between different variables. As has been previously described [44,46], in all analyses, a p < 0.05 was considered significant. Standard multivariable linear regression by the Enter method was used; variables that significantly correlated with dectin-1 were selected as predictor variables and were entered simultaneously to generate the model. The F-test was used to assess whether the set of entered independent variables collectively predicted the dependent variable. R-squared was used to determine how much variance in the dependent variable could be accounted for by the set of independent variables. The t test, p value, and beta coefficients (β-value) were used to determine the significance and the magnitude of prediction for each independent variable, respectively.

3. Results

3.1. Demographic and Clinical Characteristics of the Study Population

The physiological and biochemical characteristics of the 59 individuals from both genders included in this study are summarized in Table 1. All participants were between 32 and 58 years old with comparable heights. However, the overweight and obese individuals were significantly heavier than the lean individuals. Furthermore, in comparison to the lean participants, the overweight and obese individuals were determined to have statistically significantly greater BMI, waist circumference, body fat, and plasma triglyceride levels (Table 1).
The three groups had comparable levels of plasma cholesterol and LDL, unlike HDL, which, as expected, was significantly lower in overweight and obese individuals than in lean individuals (Table 1). In this study, diabetic patients were excluded. However, for all participants, the FBG and HbA1c measurements ranged from 4.3 to 6.1 mmol/L and from 5.0% to 6.3%, respectively, indicating that the population is at normal and/or prediabetic status. This was further supported by a statistically significant increase in HOMA-IR in the obese individuals, as compared to that of the lean individuals (Table 1). Furthermore, the physical and biochemical parameters did not reflect differences related to gender within the studied cohort (Supplementary Tables S2 and S3).

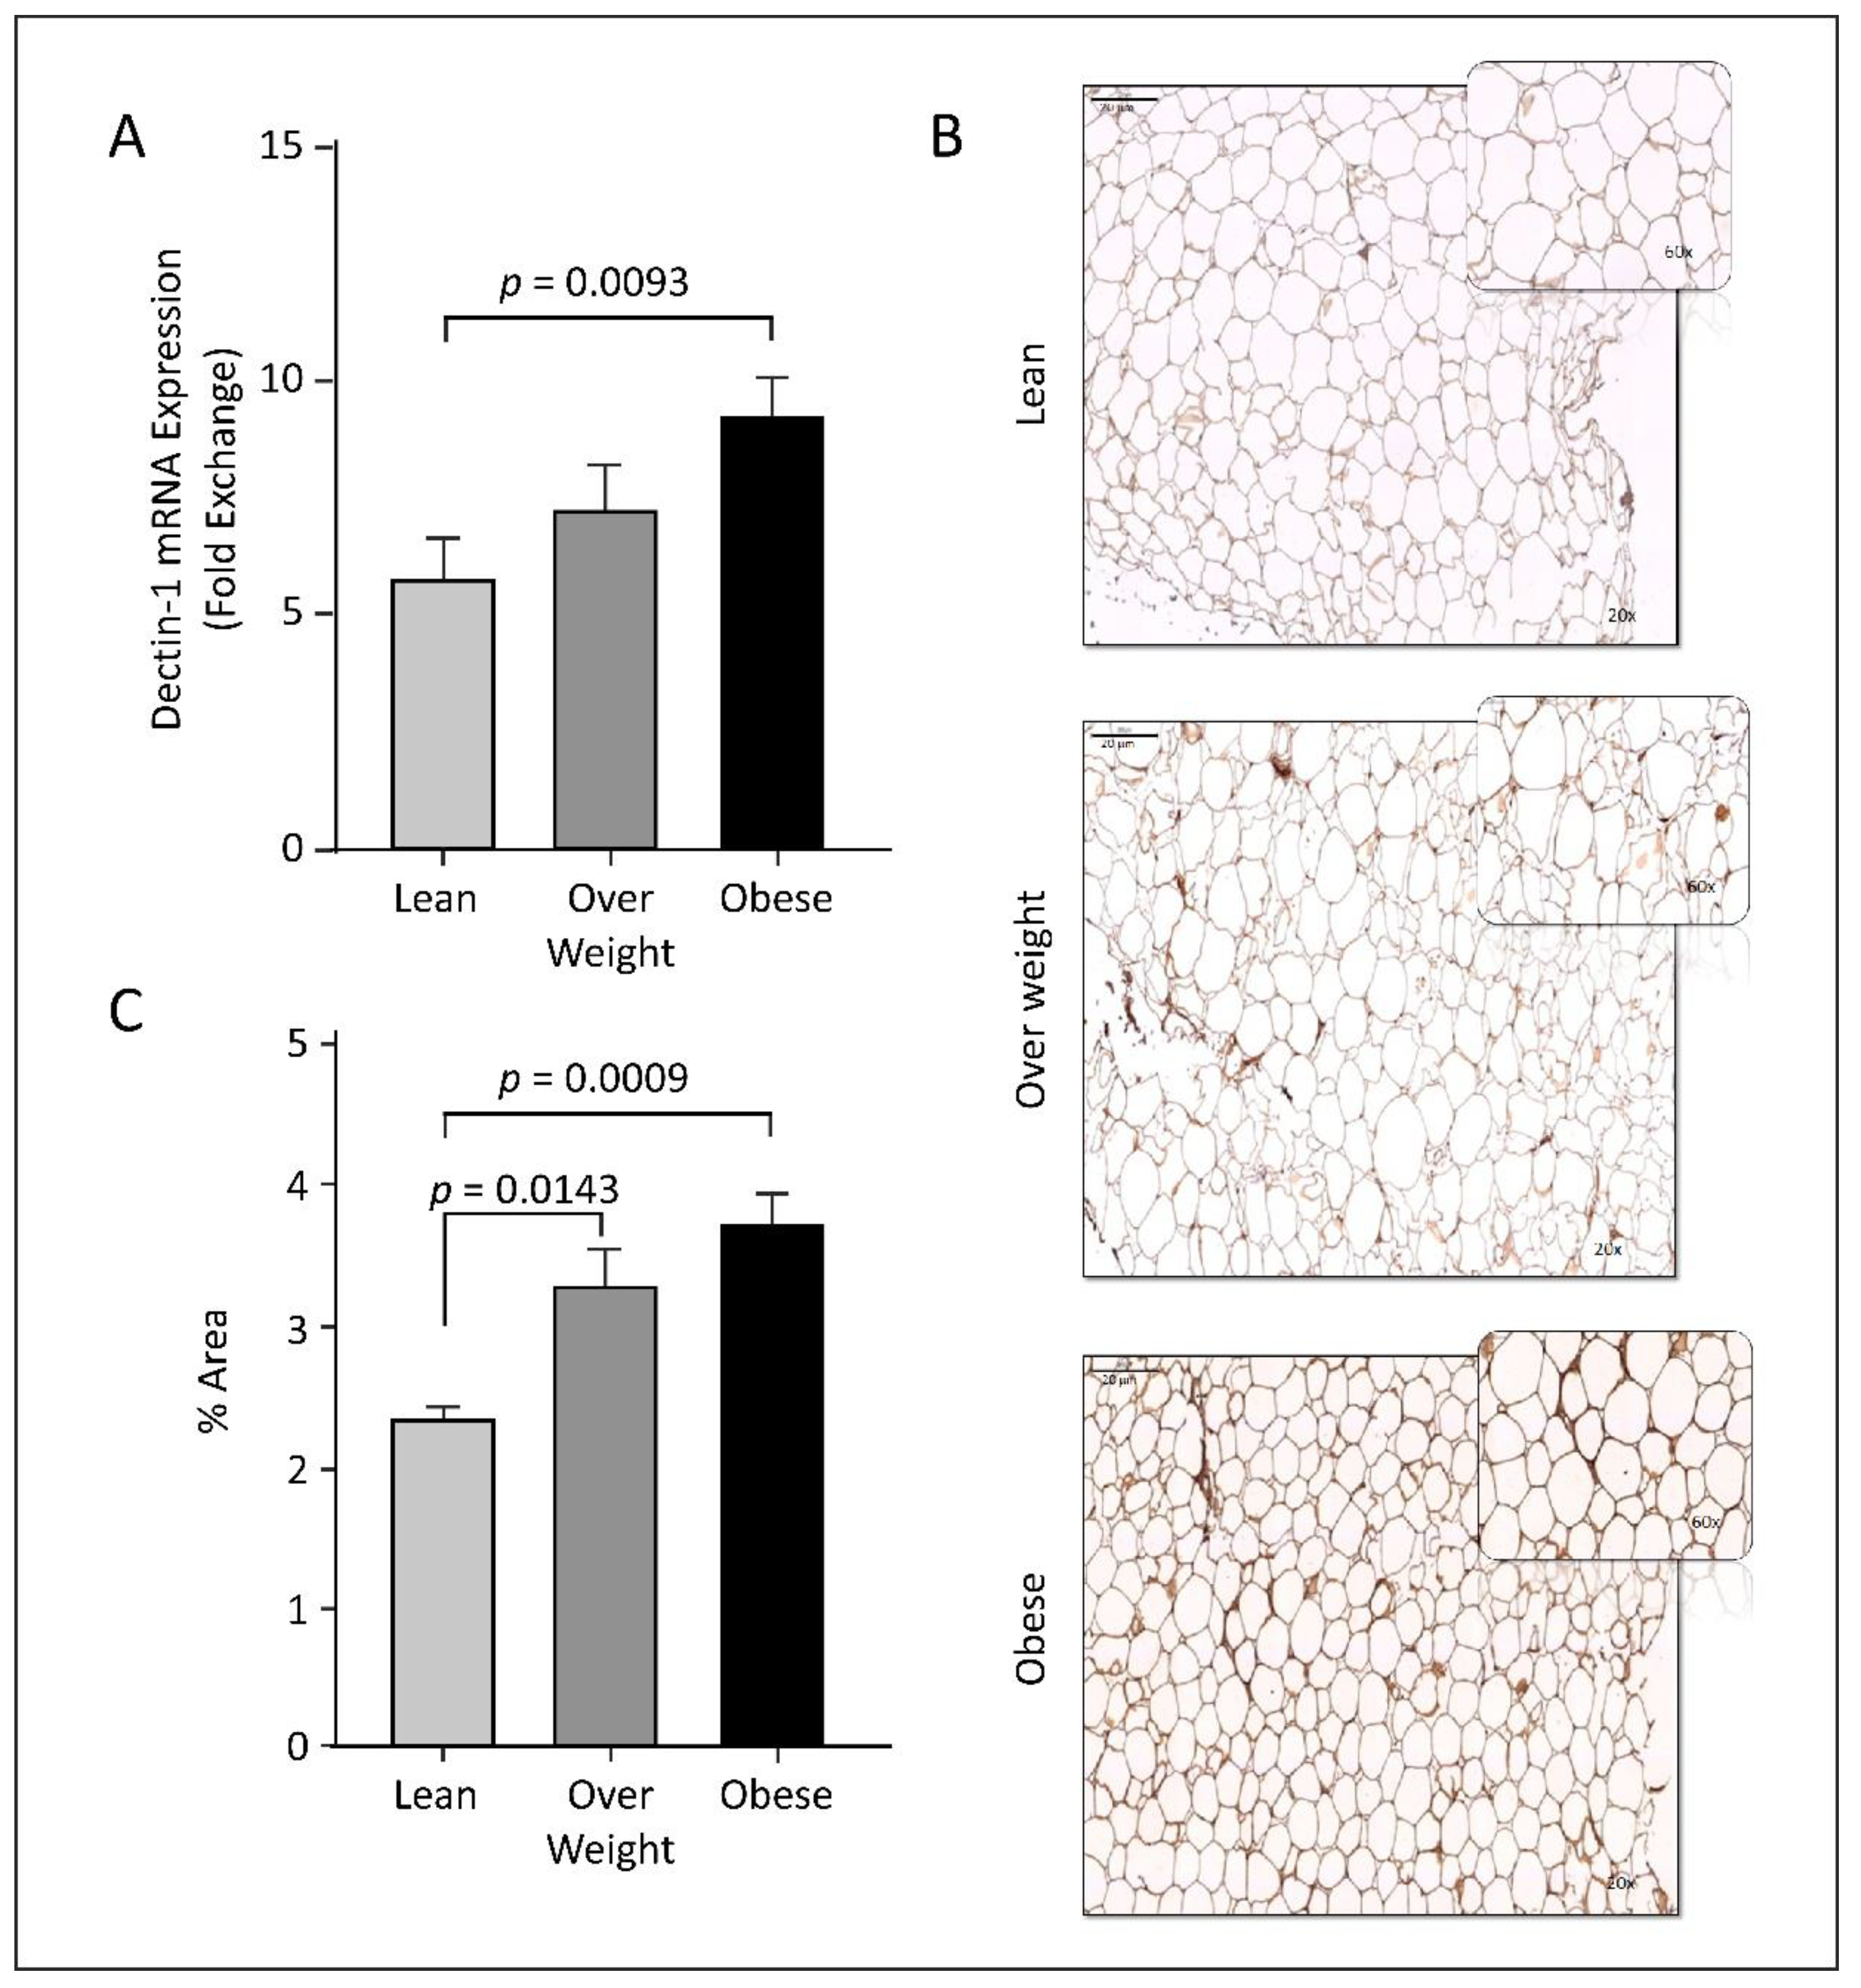
3.2. Dectin-1 Gene Expression Is Associated with Obesity

Dectin-1 has been shown to be elevated in mesenteric AT isolated from a small group of obese individuals [33]. To elaborate the prospective role of dectin-1 in other adipose tissues, we have examined the dectin-1 gene and protein expression profiles in the subcutaneous AT biopsies from healthy individuals with different BMIs. Relative to lean individuals, AT dectin-1 transcripts and protein expressions were significantly increased in obese individuals as assessed by RT-qPCR and immunohistochemistry analyses, respectively (p < 0.009; Figure 1). In overweight individuals, we observed a relative increase in dectin-1 mRNA (Figure 1A), while a statistically significant increase of dectin-1 protein was observed (p = 0.0143, Figure 1B,C). The minor differences in expression significancy between these molecules could be attributed to the sample size used in studying each molecule, as well as the sensitivity of the analytical techniques. Overall, the data indicate that AT dectin-1 RNA and proteins are elevated as a function of obesity.

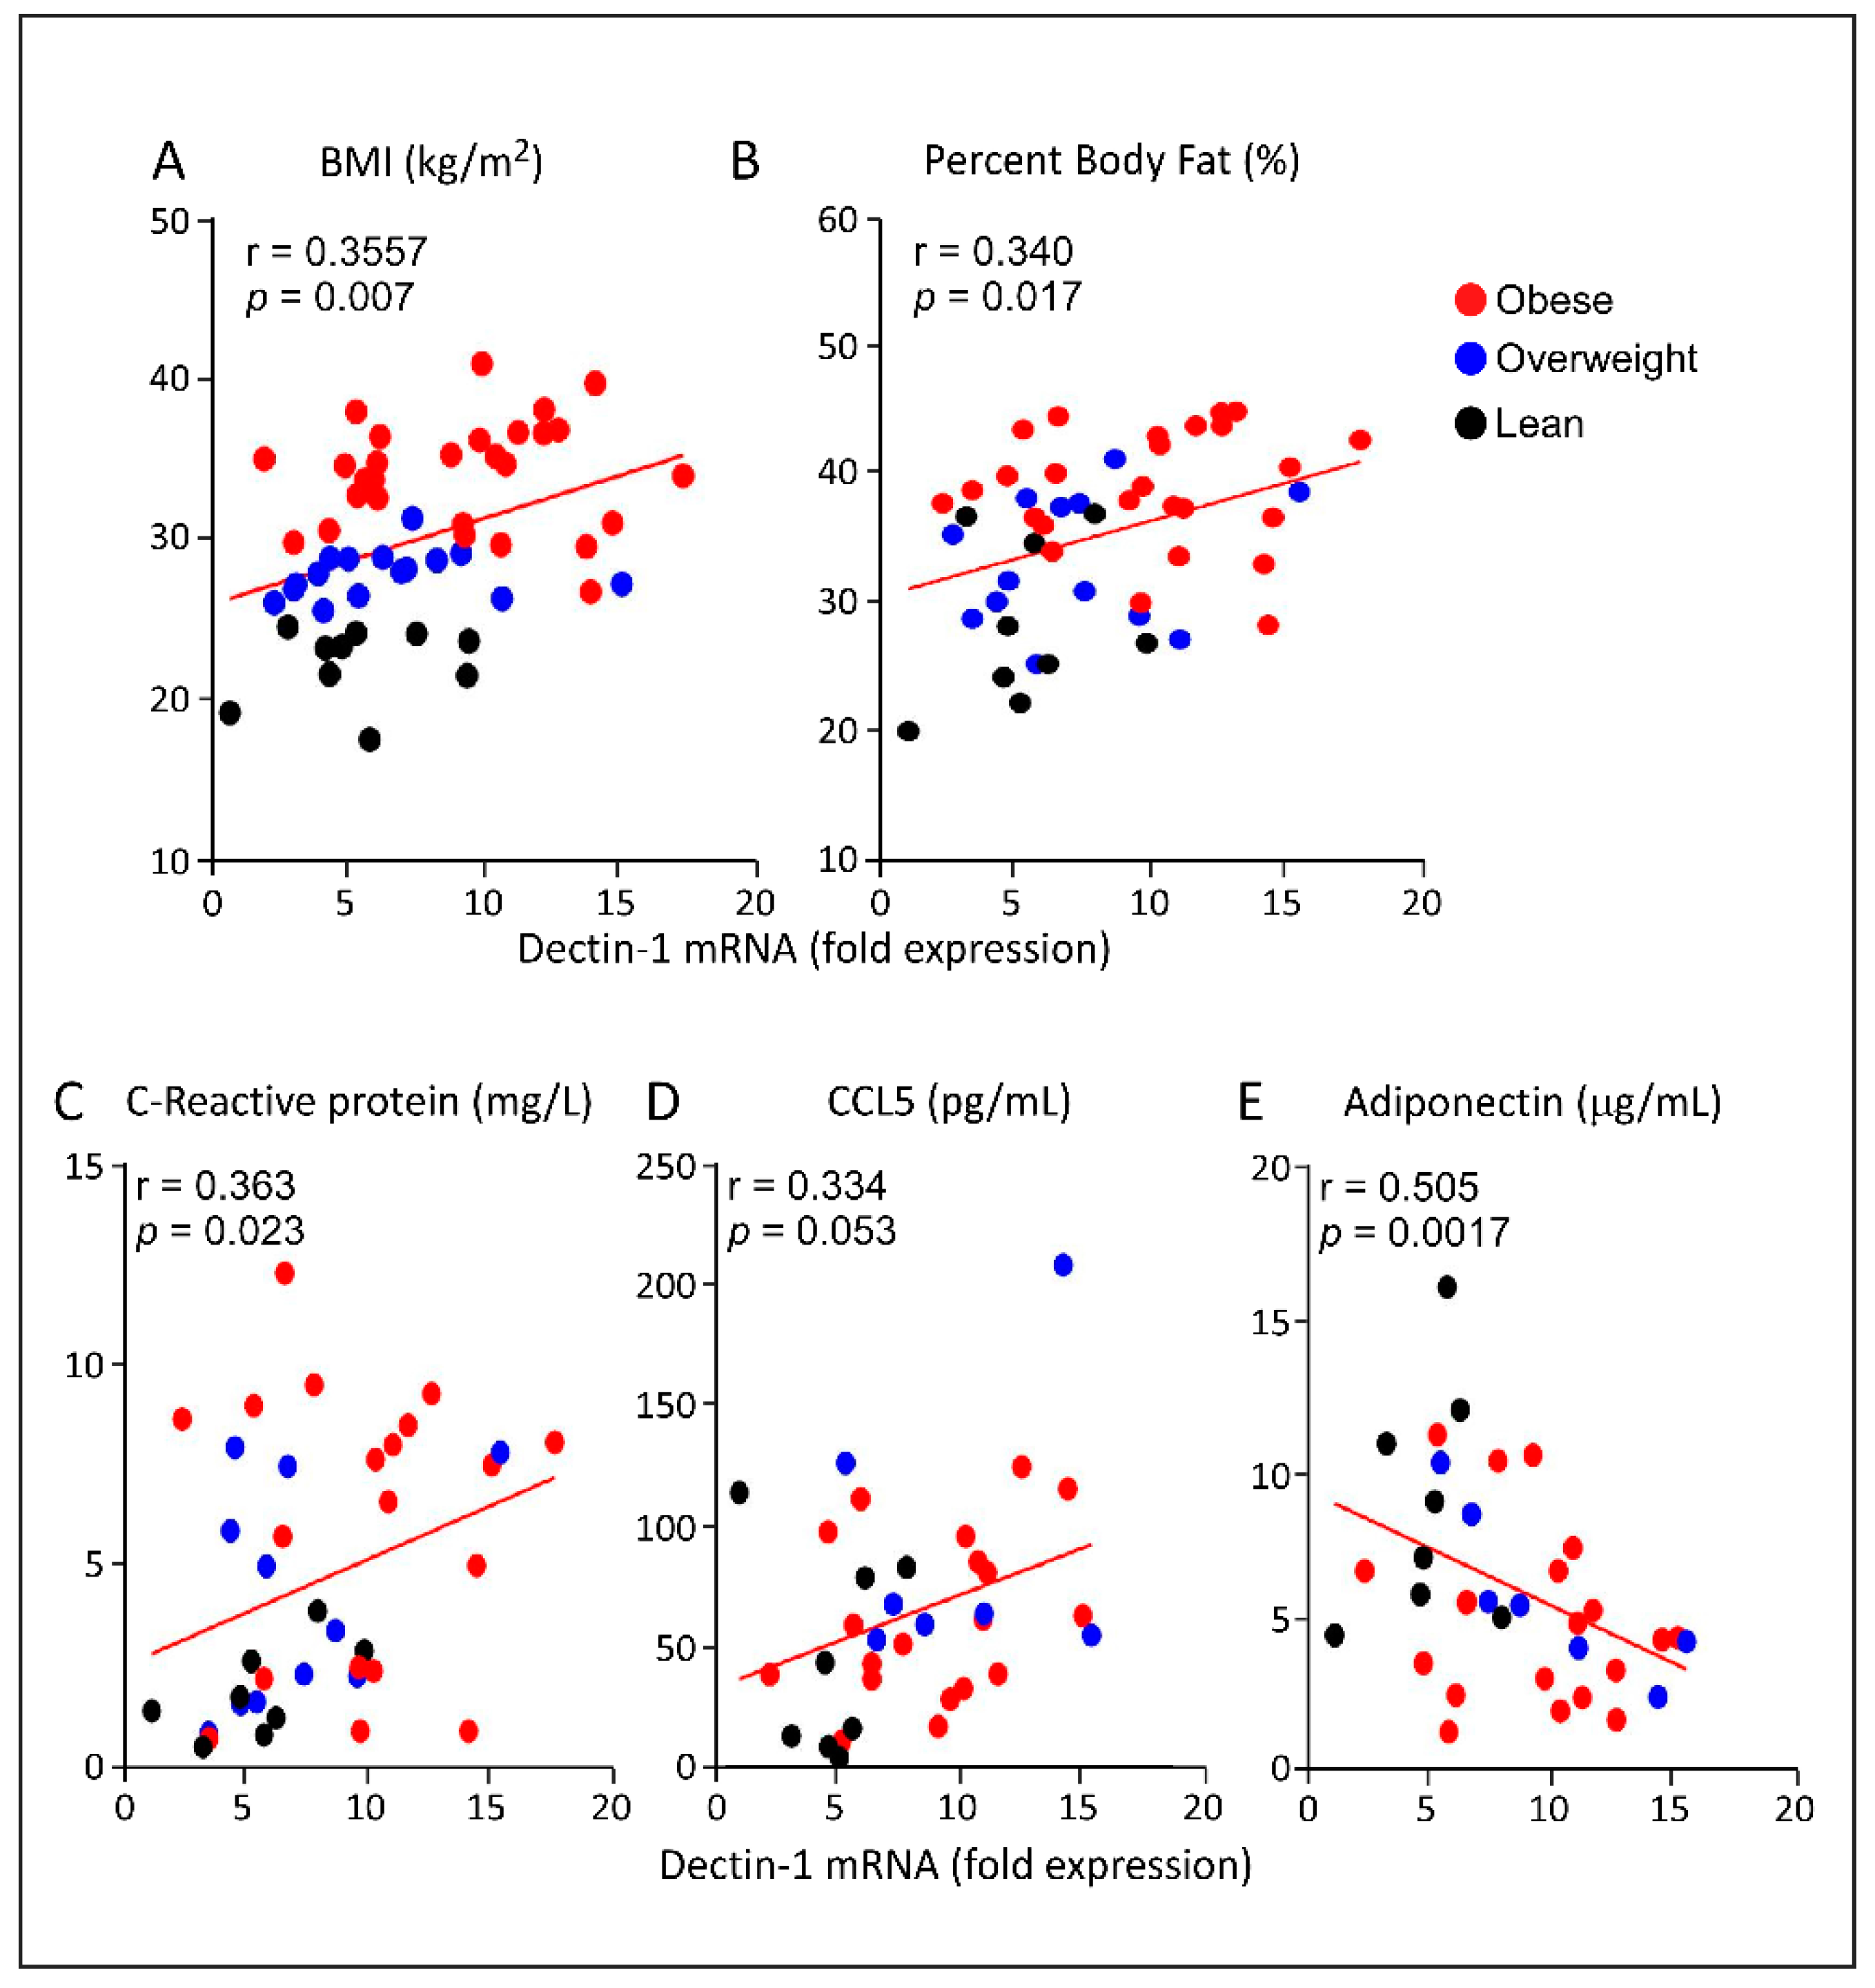
3.3. Increased AT Dectin-1 Gene Expression in Obesity Correlates with the Metabolic and Immune Markers

AT gene expression of dectin-1 was found to correlate positively with the clinical indicators of obesity including BMI (r = 0.3557, p = 0.007; Figure 2A) and body fat percentage (r = 0.340, p = 0.017; Figure 2B), indicating its strong association with obesity. In our cohort, AT dectin-1 transcripts expression was also found to be positively associated with systemic inflammatory biomarkers, including serum CRP (r = 0.363, p = 0.023; Figure 2C) and CCL5/RANTES (r = 0.334, p = 0.053; Figure 2D) levels. On the other hand, as expected, a negative correlation was observed between AT dectin-1 transcripts and serum adiponectin protein levels (r = -0.505, p = 0.0017; Figure 2E). Together, these data suggest that dectin-1 may represent a biomarker for obesity and associated inflammation.

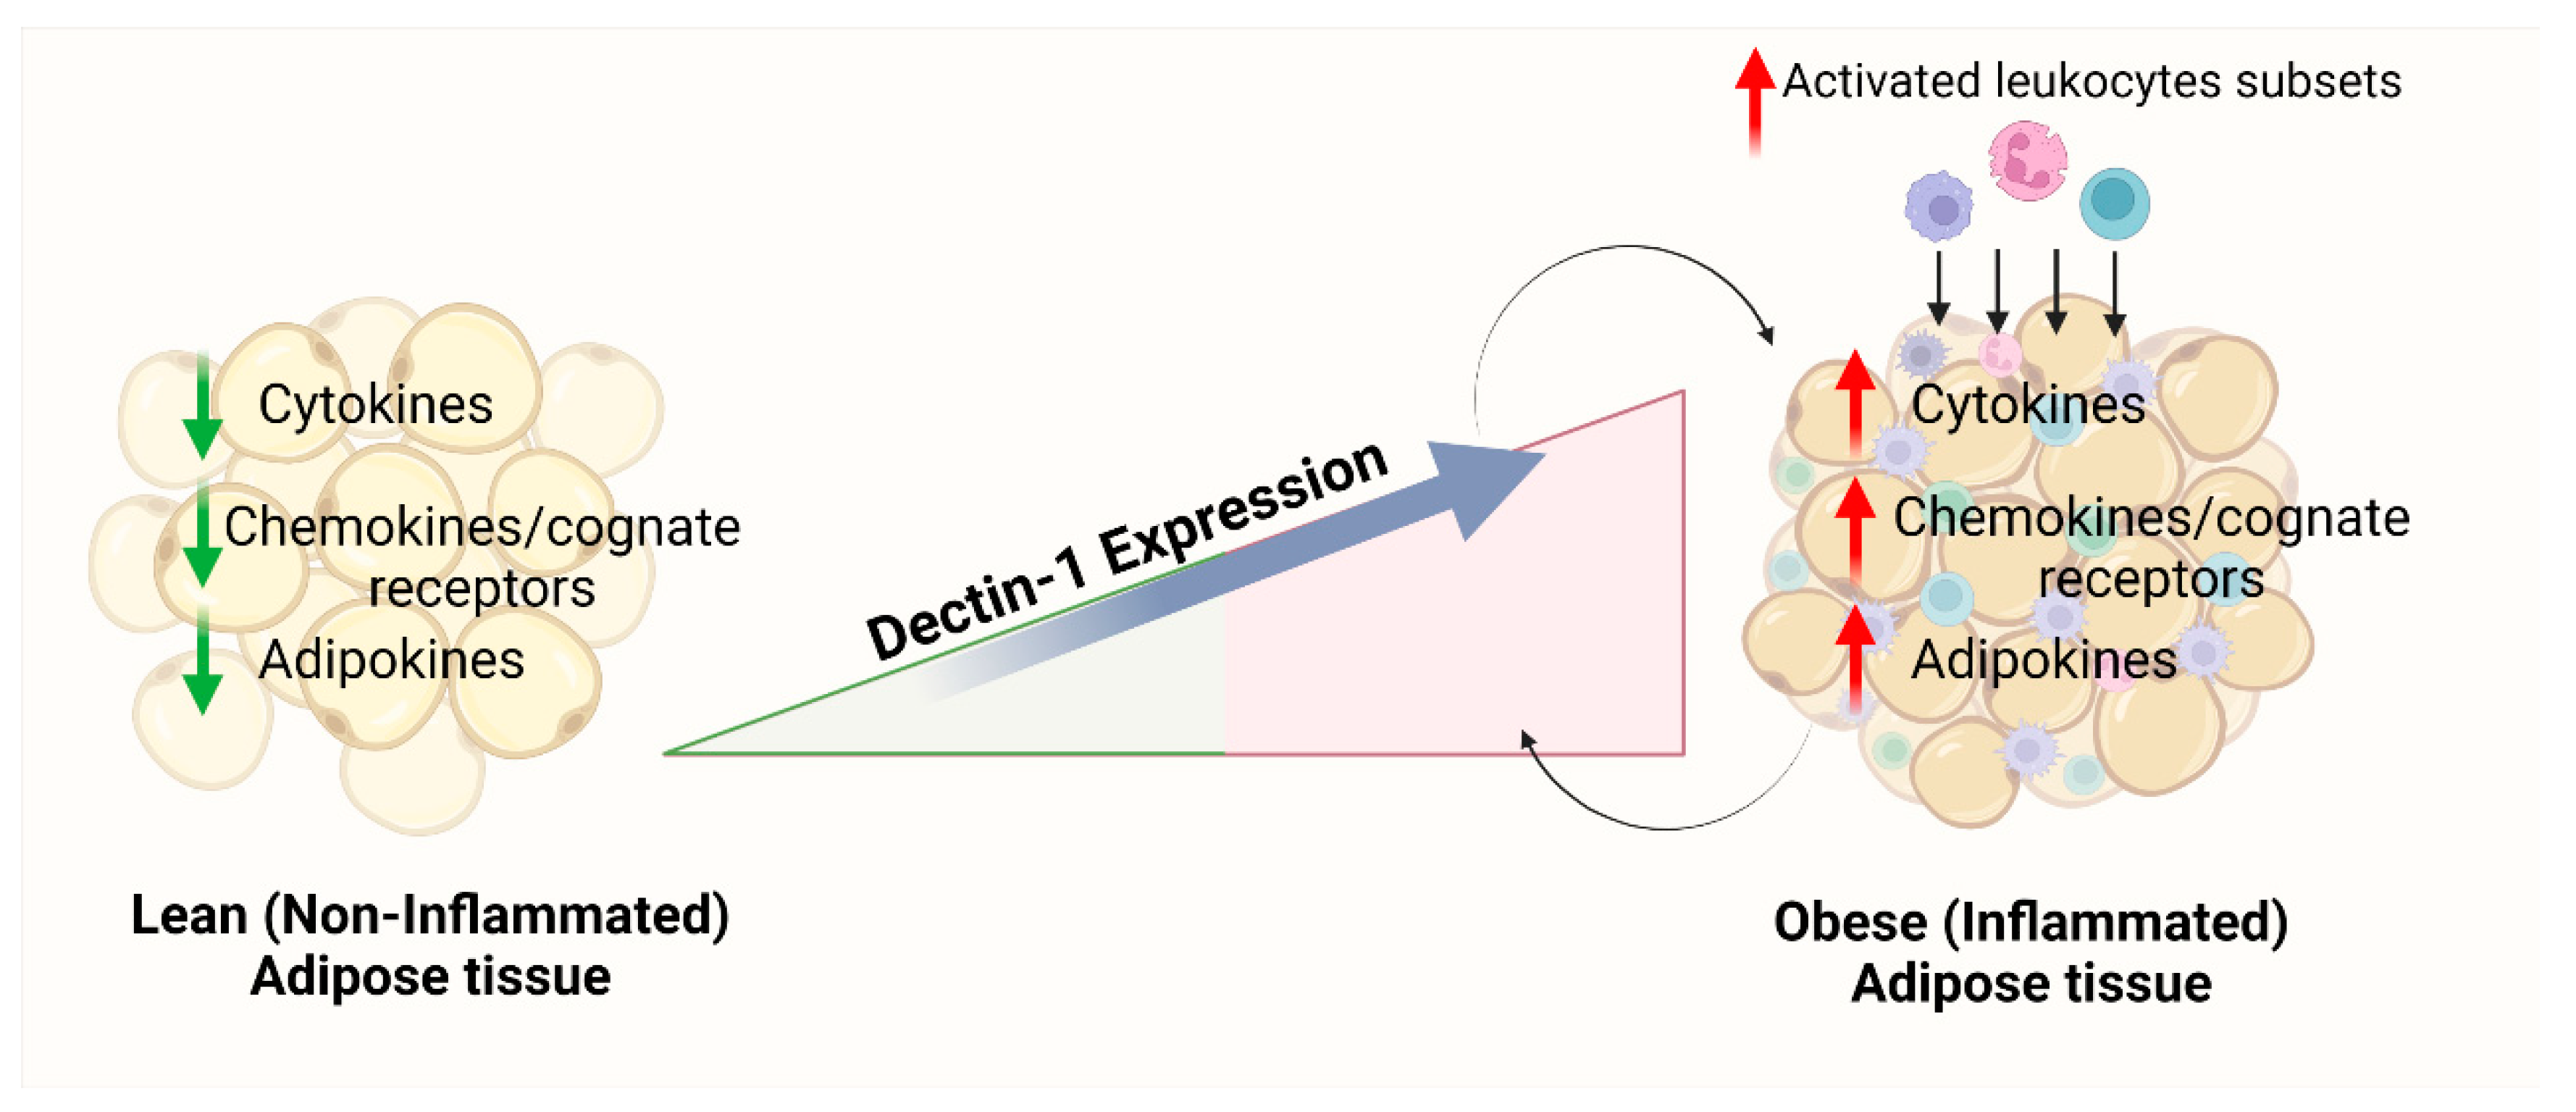
3.4. Increased Adipose Dectin-1 Gene Expression Is Associated with Inflammatory Signatures

Next, we determined the correlation of the transcriptional expression levels of dectin-1 to those of inflammatory markers in AT. As shown in Table 2 and Supplementary Figure S2, our data indicate that, in obese individuals, dectin-1 RNA expression correlated positively with that of the proinflammatory markers including IL-8, IL-18, and IL-23A (r ≥ 0.549; p < 0.0002) and slightly positively correlated with IL-1β (r = 0.323; p = 0.033). Notably, dectin-1 transcripts were also correlated with that of IL-10, which is a regulatory cytokine that exerts both pro- and anti-inflammatory (pleiotropic) effects. No correlations between dectin-1 and IL-2, IL-6, or IL-33 transcripts were observed (Table 2, and Supplementary Figure S2). Moreover, no statistically significant correlation was observed between the transcripts of dectin-1 and that of the B-cell maturation and differentiation markers IL-5 or IL-13, nor with that of the Th1 cell marker IL-12A, suggesting that dectin-1 is not associated with anti-inflammatory, Th1, or pleiotropic biomarkers. Moreover, the proinflammatory TNF-α transcription levels were positively correlated with those of dectin-1 (r = 0.491, p = 0.0002; Table 2, and Supplementary Figure S2).
Interestingly, dectin-1 gene expression levels were positively associated with that of some closely related CC motif chemokines and their receptors mediating obesity-induced chronic inflammation, such as CCL3, CCL8, and CCL20, markers for macrophages and lymphocytes, as well as CCL2 and CCL7, which are well-defined monocyte chemoattractants. Furthermore, the gene expression of dectin-1 and CCL5/RANTES was also found to be positively correlated in AT (r = 0.527; p < 0.0001; Table 2, and Supplementary Figure S2). Further, dectin-1 gene expression was also found to be associated with that of C-X-C motif chemokines, particularly CXCL10 and CXCL11 (r ≥ 0.438; p < 0.001) and slightly positively correlated with that of CXCL9 (r = 0.260; p = 0.049; Table 2). To sum up, the gene expression association studies reveal that the transcripts of dectin-1 are significantly correlated with those of a subset of interleukins and chemokines, suggesting that dectin-1 crosstalk is limited to certain cell populations localized within the heterogeneous AT.

3.5. Increased AT Dectin-1 Gene Expression in Obesity Is Associated with Toll-Like Receptors (TLRs), Downstream Signaling Molecules, and Inflammatory Leukocyte Subpopulations

TLRs are important modulators of the innate immune system and are known to play a crucial role in AT inflammation by activating expression of inflammatory cytokines and chemokines. Since dectin-1 action is mediated by IRF5 [47], which is regulated by TLRs, we hypothesized a prospective correlation between AT dectin-1 expression and TLRs at transcriptional levels. Indeed, a significant correlation was noted between dectin-1 mRNA levels and that of TLR2, TLR7, TLR 8, and TLR10 (r values ≥ 0.423; p ≤ 0.001; Table 3, and Supplementary Figure S2). No association was found between the dectin-1 gene expression and that of TLR3, TLR4, or TLR9.
Further associations were observed with downstream effectors of the TLR signaling pathways. AT expression levels of dectin-1 RNA were positively corelated with that of the innate immune signal transduction adaptor MyD88 (r = 0.408; p = 0.002) and its associated IL-1R-associated kinase 1 (IRAK1) (r = 0.360; p = 0.007) expression. Importantly and as anticipated, gene expression levels of dectin-1 and IRF5 were also found to be positively correlated (r = 0.492; p = 0.0002; Table 3, and Supplementary Figure S2).
AT contains residential immune cells, including T-cells, B-cells, dendritic cells, NK cells, and monocytes/macrophages, which become functionally dysregulated over time in the context of obesity [48]. Dectin-1 gene expression levels have been found to be associated with distinct proinflammatory cytokines and chemokines that are secreted by different leukocyte subpopulations in AT. Toward this end, our data showed a positive correlation between dectin-1 transcript levels and that of the common monocyte and macrophage markers CD11c, CD16, and CD68; M1 macrophages co-stimulatory marker CD86; and M2 macrophage immune sensing marker CD163 (Table 3, and Supplementary Figure S2). In addition, dectin-1 proteins were found to be colocalized with that of the M1 macrophage marker CD64, as well as that of the M2 marker CD163 (Supplementary Figure S3A,B, respectively).

3.6. Dectin-1 as an Independent Predictor of AT Inflammatory Markers

To determine which inflammatory parameter was independently correlated with the elevated AT dectin-1 transcript levels in overweight/obese individuals, the parameters showing a significant association were included for a further multiple stepwise regression analysis. The multiple regression analysis revealed that CCL20 (β = 0.024, p = 0.0004), CCR5 (β = 0.803, p = 0.0002), TLR2 (β = 1.754, p < 0.0001), and MyD88 (β = 2.036; p = 0.019) were independently associated with dectin-1 (Table 4).

4. Discussion

Dectin-1 is recognized as a pattern recognition receptor (PRR) expressed on myeloid cells (monocytes, macrophages, and neutrophils) and antigen-presenting dendritic cells. Whereas the expression of PRR such as TLRs is well studied in obesity, changes in dectin-1 expression in the adipose tissue in obesity and its significance remain largely unclear. Herein, we show the elevated dectin-1 gene/protein expression in the subcutaneous adipose tissue in humans with obesity to be associated positively with BMI, body fat percentage, and CRP levels in those individuals. Similar observations have also been reported in the mesenteric (visceral) AT of obese individuals [33]. Moreover, expression of dectin-1 was found to be negatively correlated with adiponectin, which is a key adipokine involved in energy metabolism, with antidiabetic and anti-inflammatory properties [49,50]. Together, these data suggest a potential role of dectin-1 in obesity and metabolic syndromes.
AT is an active endocrine organ that secretes several hormones, cytokines, and chemokines, collectively known as adipokines [16], which sustain body homeostasis through dynamic processes, including nutrient intake, insulin sensitivity, and immunomodulation [51]. Understanding the role of AT adipokines and metabolites is fundamental to prevent abnormalities or dysfunction and maintain the metabolic homeostasis.
Leukocyte activation and trafficking to inflammatory sites is known to be regulated by proinflammatory factors secreted within the AT. Among obese individuals that we studied, the upregulation of dectin-1 was found to correlate with expression of proinflammatory mediators, including several interleukins, CC chemokines, CXC chemokines, and TNF-α, but not with anti-inflammatory factors or pleiotropic cytokines.
The interplay between dectin-1 and inflammatory mediators has been reported. Elevated levels of dectin-1 transcripts were detected in monocytes isolated from diabetic patients, which was also associated with defective production of IL-10 [52], a potent regulatory cytokine with pleiotropic functions and recently reported to have a proinflammatory role depending on the ambient conditions [53,54,55].
The examined proinflammatory mediators have been associated with the pathogenesis of various metabolic disorders, such as diabetes, heart diseases, and atherosclerosis. Spiegelman et al. were the first to demonstrate the association of TNF-α with AT insulin resistance in obesity using animal models [56]. It has been reported that the levels of IL-1β, IL-2, and IL-6 are augmented in AT samples from obese individuals [57,58]. Taken together, positive associations at the transcriptional level between dectin-1 and multiple inflammatory markers imply that in obesity, dectin-1 expression is induced in the inflamed AT. Moreover, significant associations between AT dectin-1 expression and several proinflammatory mediators, especially the chemokines, indicate that these changes parallel the inflammatory cell infiltration into the AT, which might contribute to the pathogenesis of obesity, including the development of insulin resistance.
In obesity, white adipose tissue is expanded, including both hyperplasia and hypertrophy. The adipose tissue is both storage and an active metabolic organ. The increased metabolic activity within the expanding adipose tissue requires a consistent supply of oxygen as well as nutrients to suffice physiological needs and provide energy fuel. Therefore, adipose expression of the vascular endothelial growth factor (VEGF) triggers the process of angiogenesis to support neovascularization in the adipose tissue in obesity. These changes ensure a suitable microenvironment which is supportive of normal cellular metabolic activity and function. In our study, the angiostatic chemokines CXCL9, CXCL10, and CXCL11 were found to be correlated with dectin-1. Whereas on one hand, these factors are sufficient to recruit and activate immune cells in the AT in obese individuals, on the other hand, their angiostatic effect might create a hypoxic tissue microenvironment, causing or exacerbating inflammation and metabolic dysfunction. Consistent with our study, at least in part, Hueso et al. observed an elevated gene expression of CXCL10 and CXCL11 in obese visceral AT, associated with the reduced neovascularization, suggesting that the impaired angiogenesis was most likely associated with increased expression of angiostatic chemokines [59].
TLRs are well-characterized as the innate immune receptors and lately as the nutrient sensors that mediate metabolic inflammation through chronic expression of proinflammatory mediators, particularly in obese AT. TLR activation triggers a dynamic transduction cascade mediated by MyD88 and IRAK proteins, secreting proinflammatory cytokines [60]. Herein, we have delineated the relationship between AT expression of dectin-1, TLRs, and their related downstream signaling molecules. To this end, we found that elevated AT dectin-1 transcripts expression was positively associated with TLR2, TLR7, TLR8, and TLR10 gene expression in obese patients. In line with this finding, several studies show that TLRs expression in the AT is elevated in obese individuals, with/without type 2 diabetes, and these alterations can be directly associated with BMI, cytokines/chemokines expression, and insulin resistance [38,40,45,61]. Being a PRR, dectin-1 synergizes with the TLR pathway to induce the expression of inflammatory cytokines, including TNF-α, IL-1β, and IL-12 [62,63,64]. In our study, an increase in the AT dectin-1 transcripts levels was associated with the TLR-downstream signaling molecules, including MyD88, IRAK1, and IRF5. MyD88 is a key adaptor protein involved in the signaling of all TLRs (except TLR3) and IL1R, linking them to the IRAK family kinases and downstream IRF factors [65]. Recently, Castoldi et al. suggested a new role for MyD88 in metabolic syndromes and observed a notable upregulation of dectin-1 expression in AT residential macrophages isolated from MyD88 knockout mice, which correlated with the exacerbation of obesity and increased insulin resistance. Furthermore, they showed that treating mice with a dectin-1 inhibitor decreased the number of M1 macrophages in the AT and ameliorated insulin resistance [33].
We have previously observed a positive correlation between the expression levels of IRF5 and dectin-1 in diabetic obese patients, but not in diabetic lean or overweight individuals [66], which is in alignment with our current observations and suggests that obesity, but not diabetes, might be implicated in increased expression of both dectin-1 and IRF5. Consistent with our finding of an increased expression of the mentioned markers, similar changes in the AT expression of MyD88, IRAK1, and IRF5 have been reported in individuals with obesity and/or type-2 diabetes [33,45,66]. Together, our data point to a plausible link between dectin-1 and TLR signaling pathways, leading to metabolic inflammation in the AT.
Our data support a positive association between dectin-1 transcripts expression and that of monocytes/macrophage markers, including CD16, CD68, CD86, and CD163. In obesity, monocytic extravasation into the AT occurs and fat cell necrosis initiates an M2 to M1 macrophage phenotypic shift in the adipose tissue, which is regarded as one of the causes of metabolic inflammation associated with the disease [67]. M2 macrophages are characterized by the increased expression of dectin-1, CD206, CD163, CCR2, CXCR1, CXCR2, and MgL-1/2 [68]. M2 macrophages are considered anti-inflammatory, secrete high levels of IL-10 and TGF-β but low levels of IL-12, and are abundantly found in lean adipose tissue [69]. M1 macrophages are characterized by the elevated expression of major histocompatibility complex class II (MHC-II), CD80/CD86 costimulatory molecules, and CD68 [70]. M1 macrophages are pro-inflammatory, secrete high levels of IL-6, TNF-α, IL-1β, CXCL-9/10, IL-12, and IL-23 but low levels of IL-10, and are predominant in obese adipose tissue [71,72]. A strong correlation of the dectin-1 expression with pan monocyte/macrophage markers, including those used for M1 (CD68) and M2 characterization (CD163), suggests that dectin-1 might be constitutively co-expressed on cells of myeloid lineage, regardless of their M1/M2 polarization status. Besides, associating CD68 and CD163 to represent M1 and M2 macrophage subtypes, respectively, is also controversial since the CD68 has also been detected on cells other than macrophages and dendritic cells, such as lymphocytes, fibroblasts, stromal cells, and endothelial cells [73], all of which are increased in the inflamed adipose tissue. It is also suggested that macrophages may skew towards M1 profile via a relatively reduced CD163 expression [74].
This study remains limited by certain caveats and concerns. First, the complexity of the intercellular crosstalk between adipocytes and resident immune cells may affect the correlative dynamics between dectin-1 and proinflammatory markers in the AT microenvironment. Second, we cannot exclude the confounding effects of the presence of other immunomodulatory factors/agents present in the adipose tissue that we could not herein study. Third, the existence of genetic polymorphisms within the human cohorts may also impact the outcome of such correlative investigations. In any case, further studies involving larger and more diverse cohorts will be required to investigate how the dectin-1 expression might be induced or modulated by TLR2, MyD88, CCL20, and/or CCR5, all of which have been identified as the independent predictors of dectin-1 adipose expression in obesity, as per our preliminary findings from this study.

5. Conclusions

AT dectin-1 transcripts expression is positively associated with the gene expression of proinflammatory cytokines/chemokines, their cognate receptors, TLRs, and downstream signaling partners, as well as monocyte/macrophage markers (as described in the schematic Figure 3). Taken together, our results suggest that adipose dectin-1 upregulation may be regarded as a potential predictor of metabolic inflammation in an obesity setting.

Supplementary Materials

The following supporting information can be downloaded at: https://www.mdpi.com/article/10.3390/cells11182879/s1, Figure S1: Dectin-1 antibody specificity validation using spleen tissues. Primary antibody [1:100 dilution of rabbit polyclonal anti-dectin-1 antibody (Abcam, Waltham, MA, USA; #ab140039)] and secondary antibody goat anti-rabbit conjugated with horseradish peroxidase polymer chain DAKO EnVision Kit. Figure S2: Correlation of AT dectin-1 gene expression with that of various cytokines/chemokines and their cognate receptors. In the studied cohort, we performed association studies between the levels of dectin-1 transcripts and that of different cytokines, chemokines, and their receptors as well as the TLR signaling cascade and cellular surface markers. Figure S3: Representative confocal microscopy images for colocalization of dectin-1 and CD64 (A) and CD163 (B). Adipose tissues from lean, overweigh and obese individuals were incubated with antibodies directed against dectin-1, CD64 or CD163 and then with secondary antibodies Alexa fluor 647 or 488, as indicated. Nuclei were stained with DAPI. (C) The intensity of fluorescence for CD64 and CD163 were measured in all tested slides. Table S1: List of TaqMan Primers used for RT-PCR Assay. Table S2: Clinico-demographic characteristics of males and females regarding Lean, Overweight, and Obese individuals. Table S3: Correlation of Dectin-1 with all significantly correlated markers (Table 1) after adjustment to gender. Most of the correlations between dectin-1 and the studied factors, which were reported in Table 1, were also significant after adjusting for the gender effect. However, the correlation between decton-1 and CCL2, CXCL9, or RANTES showed marginal significance after adjusting for gender.

Author Contributions

S.K., F.A.-R., R.T. and L.M. participated in performing experiments and collecting the data. A.A.M., S.S. and R.A. performed data analysis and wrote the manuscript. F.A.-M. reviewed, edited, and provided technically feedback. A.A.M., F.A.-M. and R.A. conceived the idea, guided research study, provided material support, procured funds, interpreted data, participated in writing, edited, and approved the manuscript for submission. All authors have read and agreed to the published version of the manuscript.

Funding

This study was funded by Kuwait Foundation for Advancement of Sciences (KFAS) (Grant #: RA2010-003, June 2010).

Institutional Review Board Statement

The study was conducted in accordance with the Declaration of Helsinki, and approved by the Institutional Ethics Committee of Dasman Diabetes Institute (protocol code RA 2010-003, June 2010).

Informed Consent Statement

Informed consent was obtained from all subjects involved in the study.

Data Availability Statement

The data are available upon request.

Acknowledgments

The Authors would like to thank Fahad Al-Ghamlas for help with patients’ recruitment.

Conflicts of Interest

The authors declare no conflict of interests.

References

  1. GBD 2015 Obesity Collaborators; Afshin, A.; Forouzanfar, M.H.; Reitsma, M.B.; Sur, P.; Estep, K.; Lee, A.; Marczak, L.; Mokdad, A.H.; Moradi-Lakeh, M.; et al. Health Effects of Overweight and Obesity in 195 Countries over 25 Years. N. Engl. J. Med. 2017, 377, 13–27. [Google Scholar] [PubMed]
  2. Gregg, E.W.; Shaw, J.E. Global Health Effects of Overweight and Obesity. N. Engl. J. Med. 2017, 377, 80–81. [Google Scholar] [CrossRef] [PubMed]
  3. Ogden, J.; Flanagan, Z. Beliefs about the causes and solutions to obesity: A comparison of GPs and lay people. Patient Educ. Couns. 2008, 71, 72–78. [Google Scholar] [CrossRef] [PubMed]
  4. Fitipaldi, H.; McCarthy, M.I.; Florez, J.C.; Franks, P.W. A Global Overview of Precision Medicine in Type 2 Diabetes. Diabetes 2018, 67, 1911–1922. [Google Scholar] [CrossRef]
  5. Day, M.J. One Health Approach to Preventing Obesity in People and Their Pets. J. Comp. Pathol. 2017, 156, 293–295. [Google Scholar] [CrossRef]
  6. Bomberg, E.M.; Ryder, J.R.; Brundage, R.C.; Straka, R.J.; Fox, C.K.; Gross, A.C.; Oberle, M.M.; Bramante, C.T.; Sibley, S.D.; Kelly, A.S. Precision medicine in adult and pediatric obesity: A clinical perspective. Ther. Adv. Endocrinol. Metab. 2019, 10, 2042018819863022. [Google Scholar] [CrossRef]
  7. Lee, L.; Sanders, R.A. Metabolic syndrome. Pediatr. Rev. 2012, 33, 459–466. [Google Scholar] [CrossRef]
  8. Echahidi, N.; Mohty, D.; Pibarot, P.; Despres, J.P.; O’Hara, G.; Champagne, J.; Philippon, F.; Daleau, P.; Voisine, P.; Mathieu, P. Obesity and metabolic syndrome are independent risk factors for atrial fibrillation after coronary artery bypass graft surgery. Circulation 2007, 116 (Suppl. 11), I213–I219. [Google Scholar] [CrossRef]
  9. Herrera, B.M.; Lindgren, C.M. The genetics of obesity. Curr. Diabetes Rep. 2010, 10, 498–505. [Google Scholar] [CrossRef]
  10. Kissebah, A.H.; Vydelingum, N.; Murray, R.; Evans, D.J.; Hartz, A.J.; Kalkhoff, R.K.; Adams, P.W. Relation of body fat distribution to metabolic complications of obesity. J. Clin. Endocrinol. Metab. 1982, 54, 254–260. [Google Scholar] [CrossRef]
  11. Walker, K.A.; Gottesman, R.F.; Wu, A.; Knopman, D.S.; Gross, A.L.; Mosley, T.H.; Selvin, E., Jr.; Windham, B.G. Systemic inflammation during midlife and cognitive change over 20 years: The ARIC Study. Neurology 2019, 92, e1256–e1267. [Google Scholar] [PubMed]
  12. Walker, K.A.; Walston, J.; Gottesman, R.F.; Kucharska-Newton, A.; Palta, P.; Windham, B.G. Midlife Systemic Inflammation Is Associated With Frailty in Later Life: The ARIC Study. J. Gerontol. A Biol. Sci. Med. Sci. 2019, 74, 343–349. [Google Scholar] [CrossRef] [PubMed]
  13. Jung, U.J.; Choi, M.S. Obesity and its metabolic complications: The role of adipokines and the relationship between obesity, inflammation, insulin resistance, dyslipidemia and nonalcoholic fatty liver disease. Int. J. Mol. Sci. 2014, 15, 6184–6223. [Google Scholar] [CrossRef]
  14. Johnson, A.M.; Olefsky, J.M. The origins and drivers of insulin resistance. Cell 2013, 152, 673–684. [Google Scholar] [CrossRef] [PubMed]
  15. Fonseca-Alaniz, M.H.; Takada, J.; Alonso-Vale, M.I.; Lima, F.B. Adipose tissue as an endocrine organ: From theory to practice. J. Pediatr. 2007, 83 (Suppl. 5), S192–S203. [Google Scholar] [CrossRef]
  16. Ahima, R.S.; Flier, J.S. Adipose tissue as an endocrine organ. Trends Endocrinol. Metab. 2000, 11, 327–332. [Google Scholar] [CrossRef]
  17. Cinti, S. Pink Adipocytes. Trends Endocrinol. Metab. 2018, 29, 651–666. [Google Scholar] [CrossRef]
  18. Waki, H.; Tontonoz, P. Endocrine functions of adipose tissue. Annu. Rev. Pathol. 2007, 2, 31–56. [Google Scholar] [CrossRef]
  19. Pasarica, M.; Sereda, O.R.; Redman, L.M.; Albarado, D.C.; Hymel, D.T.; Roan, L.E.; Rood, J.C.; Burk, D.H.; Smith, S.R. Reduced adipose tissue oxygenation in human obesity: Evidence for rarefaction, macrophage chemotaxis, and inflammation without an angiogenic response. Diabetes 2009, 58, 718–725. [Google Scholar] [CrossRef]
  20. Garcia-Martin, R.; Alexaki, V.I.; Qin, N.; Rubin de Celis, M.F.; Economopoulou, M.; Ziogas, A.; Gercken, B.; Kotlabova, K.; Phieler, J.; Ehrhart-Bornstein, M.; et al. Adipocyte-Specific Hypoxia-Inducible Factor 2alpha Deficiency Exacerbates Obesity-Induced Brown Adipose Tissue Dysfunction and Metabolic Dysregulation. Mol. Cell Biol. 2016, 36, 376–393. [Google Scholar] [CrossRef] [Green Version]
  21. Esteve Rafols, M. Adipose tissue: Cell heterogeneity and functional diversity. Endocrinol. Nutr. 2014, 61, 100–112. [Google Scholar] [CrossRef] [PubMed]
  22. De Boer, M.D. Obesity, systemic inflammation, and increased risk for cardiovascular disease and diabetes among adolescents: A need for screening tools to target interventions. Nutrition 2013, 29, 379–386. [Google Scholar] [CrossRef]
  23. Scherer, P.E.; Hill, J.A. Obesity, Diabetes, and Cardiovascular Diseases: A Compendium. Circ. Res. 2016, 118, 1703–1705. [Google Scholar] [CrossRef] [PubMed]
  24. Taylor, P.R.; Brown, G.D.; Reid, D.M.; Willment, J.A.; Martinez-Pomares, L.; Gordon, S.; Wong, S.Y. The beta-glucan receptor, dectin-1, is predominantly expressed on the surface of cells of the monocyte/macrophage and neutrophil lineages. J. Immunol. 2002, 169, 3876–3882. [Google Scholar] [CrossRef] [PubMed]
  25. Brown, G.D.; Taylor, P.R.; Reid, D.M.; Willment, J.A.; Williams, D.L.; Martinez-Pomares, L.; Wong, S.Y.; Gordon, S. Dectin-1 is a major beta-glucan receptor on macrophages. J. Exp. Med. 2002, 196, 407–412. [Google Scholar] [CrossRef]
  26. Rogers, N.C.; Slack, E.C.; Edwards, A.D.; Nolte, M.A.; Schulz, O.; Schweighoffer, E.; Williams, D.L.; Gordon, S.; Tybulewicz, V.L.; Brown, G.D.; et al. Syk-dependent cytokine induction by Dectin-1 reveals a novel pattern recognition pathway for C type lectins. Immunity 2005, 22, 507–517. [Google Scholar] [CrossRef]
  27. Dennehy, K.M.; Brown, G.D. The role of the beta-glucan receptor Dectin-1 in control of fungal infection. J. Leukoc. Biol. 2007, 82, 253–258. [Google Scholar] [CrossRef]
  28. Gross, O.; Gewies, A.; Finger, K.; Schafer, M.; Sparwasser, T.; Peschel, C.; Forster, I.; Ruland, J. Card9 controls a non-TLR signalling pathway for innate anti-fungal immunity. Nature 2006, 442, 651–656. [Google Scholar] [CrossRef]
  29. Saijo, S.; Fujikado, N.; Furuta, T.; Chung, S.H.; Kotaki, H.; Seki, K.; Sudo, K.; Akira, S.; Adachi, Y.; Ohno, N.; et al. Dectin-1 is required for host defense against Pneumocystis carinii but not against Candida albicans. Nat. Immunol. 2007, 8, 39–46. [Google Scholar] [CrossRef]
  30. Taylor, P.R.; Tsoni, S.V.; Willment, J.A.; Dennehy, K.M.; Rosas, M.; Findon, H.; Haynes, K.; Steele, C.; Botto, M.; Gordon, S.; et al. Dectin-1 is required for beta-glucan recognition and control of fungal infection. Nat. Immunol. 2007, 8, 31–38. [Google Scholar] [CrossRef]
  31. Ferwerda, B.; Ferwerda, G.; Plantinga, T.S.; Willment, J.A.; van Spriel, A.B.; Venselaar, H.; Elbers, C.C.; Johnson, M.D.; Cambi, A.; Huysamen, C.; et al. Human dectin-1 deficiency and mucocutaneous fungal infections. N. Engl. J. Med. 2009, 361, 1760–1767. [Google Scholar] [CrossRef] [PubMed]
  32. Mata-Martinez, P.; Bergon-Gutierrez, M.; Del Fresno, C. Dectin-1 Signaling Update: New Perspectives for Trained Immunity. Front. Immunol. 2022, 13, 812148. [Google Scholar] [CrossRef] [PubMed]
  33. Castoldi, A.; Andrade-Oliveira, V.; Aguiar, C.F.; Amano, M.T.; Lee, J.; Miyagi, M.T.; Latancia, M.T.; Braga, T.T.; da Silva, M.B.; Ignacio, A.; et al. Dectin-1 Activation Exacerbates Obesity and Insulin Resistance in the Absence of MyD88. Cell Rep. 2017, 19, 2272–2288. [Google Scholar] [CrossRef] [PubMed]
  34. Sindhu, S.; Akhter, N.; Wilson, A.; Thomas, R.; Arefanian, H.; Al Madhoun, A.; Al-Mulla, F.; Ahmad, R. MIP-1alpha Expression Induced by Co-Stimulation of Human Monocytic Cells with Palmitate and TNF-alpha Involves the TLR4-IRF3 Pathway and Is Amplified by Oxidative Stress. Cells 2020, 9, 1799. [Google Scholar] [CrossRef]
  35. Kochumon, S.; Madhoun, A.A.; Al-Rashed, F.; Azim, R.; Al-Ozairi, E.; Al-Mulla, F.; Ahmad, R. Adipose tissue gene expression of CXCL10 and CXCL11 modulates inflammatory markers in obesity: Implications for metabolic inflammation and insulin resistance. Ther. Adv. Endocrinol. Metab. 2020, 11, 2042018820930902. [Google Scholar] [CrossRef]
  36. Al-Roub, A.; Al Madhoun, A.; Akhter, N.; Thomas, R.; Miranda, L.; Jacob, T.; Al-Ozairi, E.; Al-Mulla, F.; Sindhu, S.; Ahmad, R. IL-1β and TNFα Cooperativity in Regulating IL-6 Expression in Adipocytes Depends on CREB Binding and H3K14 Acetylation. Cells 2021, 10, 3228. [Google Scholar] [CrossRef]
  37. Kochumon, S.; Al-Rashed, F.; Abu-Farha, M.; Devarajan, S.; Tuomilehto, J.; Ahmad, R. Adipose tissue expression of CCL19 chemokine is positively associated with insulin resistance. Diabetes Metab. Res. Rev. 2019, 35, e3087. [Google Scholar] [CrossRef]
  38. Ahmad, R.; Shihab, P.K.; Thomas, R.; Alghanim, M.; Hasan, A.; Sindhu, S.; Behbehani, K. Increased expression of the interleukin-1 receptor-associated kinase (IRAK)-1 is associated with adipose tissue inflammatory state in obesity. Diabetol. Metab. Syndr. 2015, 7, 71. [Google Scholar] [CrossRef]
  39. Ahmad, R.; Kochumon, S.; Chandy, B.; Shenouda, S.; Koshy, M.; Hasan, A.; Arefanian, H.; Al-Mulla, F.; Sindhu, S. TNF-alpha Drives the CCL4 Expression in Human Monocytic Cells: Involvement of the SAPK/JNK and NF-kappaB Signaling Pathways. Cell Physiol. Biochem. 2019, 52, 908–921. [Google Scholar]
  40. Sindhu, S.; Akhter, N.; Kochumon, S.; Thomas, R.; Wilson, A.; Shenouda, S.; Tuomilehto, J.; Ahmad, R. Increased Expression of the Innate Immune Receptor TLR10 in Obesity and Type-2 Diabetes: Association with ROS-Mediated Oxidative Stress. Cell Physiol. Biochem. 2018, 45, 572–590. [Google Scholar] [CrossRef]
  41. Kochumon, S.; Wilson, A.; Chandy, B.; Shenouda, S.; Tuomilehto, J.; Sindhu, S.; Ahmad, R. Palmitate Activates CCL4 Expression in Human Monocytic Cells via TLR4/MyD88 Dependent Activation of NF-kappaB/MAPK/ PI3K Signaling Systems. Cell Physiol. Biochem. 2018, 46, 953–964. [Google Scholar] [CrossRef]
  42. Abdel-Halim, S.M.; Al Madhoun, A.; Nizam, R.; Melhem, M.; Cherian, P.; Al-Khairi, I.; Haddad, D.; Abu-Farha, M.; Abubaker, J.; Bitar, M.S.; et al. Increased Plasma Levels of Adenylate Cyclase 8 and cAMP Are Associated with Obesity and Type 2 Diabetes: Results from a Cross-Sectional Study. Biology 2020, 9, 244. [Google Scholar] [CrossRef]
  43. Kochumon, S.; Al Madhoun, A.; Al-Rashed, F.; Thomas, R.; Sindhu, S.; Al-Ozairi, E.; Al-Mulla, F.; Ahmad, R. Elevated adipose tissue associated IL-2 expression in obesity correlates with metabolic inflammation and insulin resistance. Sci. Rep. 2020, 10, 16364. [Google Scholar] [CrossRef]
  44. Akhter, N.; Wilson, A.; Thomas, R.; Al-Rashed, F.; Kochumon, S.; Al-Roub, A.; Arefanian, H.; Al-Madhoun, A.; Al-Mulla, F.; Ahmad, R.; et al. ROS/TNF-α Crosstalk Triggers the Expression of IL-8 and MCP-1 in Human Monocytic THP-1 Cells via the NF-κB and ERK1/2 Mediated Signaling. Int. J. Mol. Sci. 2021, 22, 10519. [Google Scholar] [CrossRef]
  45. Ahmad, R.; Al-Mass, A.; Atizado, V.; Al-Hubail, A.; Al-Ghimlas, F.; Al-Arouj, M.; Bennakhi, A.; Dermime, S.; Behbehani, K. Elevated expression of the toll like receptors 2 and 4 in obese individuals: Its significance for obesity-induced inflammation. J. Inflamm. 2012, 9, 48. [Google Scholar] [CrossRef]
  46. Al-Rashed, F.; Sindhu, S.; Al Madhoun, A.; Ahmad, Z.; AlMekhled, D.; Azim, R.; Al-Kandari, S.; Wahid, M.A.; Al-Mulla, F.; Ahmad, R. Elevated resting heart rate as a predictor of inflammation and cardiovascular risk in healthy obese individuals. Sci. Rep. 2021, 11, 13883. [Google Scholar] [CrossRef]
  47. del Fresno, C.; Soulat, D.; Roth, S.; Blazek, K.; Udalova, I.; Sancho, D.; Ruland, J.; Ardavin, C. Interferon-beta production via Dectin-1-Syk-IRF5 signaling in dendritic cells is crucial for immunity to C. albicans. Immunity 2013, 38, 1176–1186. [Google Scholar] [CrossRef]
  48. Lu, J.; Zhao, J.; Meng, H.; Zhang, X. Adipose Tissue-Resident Immune Cells in Obesity and Type 2 Diabetes. Front. Immunol. 2019, 10, 1173. [Google Scholar] [CrossRef]
  49. Ohashi, K.; Ouchi, N.; Matsuzawa, Y. Anti-inflammatory and anti-atherogenic properties of adiponectin. Biochimie 2012, 94, 2137–2142. [Google Scholar] [CrossRef]
  50. Forny-Germano, L.; De Felice, F.G.; Vieira, M. The Role of Leptin and Adiponectin in Obesity-Associated Cognitive Decline and Alzheimer’s Disease. Front. Neurosci. 2018, 12, 1027. [Google Scholar] [CrossRef]
  51. Coelho, M.; Oliveira, T.; Fernandes, R. Biochemistry of adipose tissue: An endocrine organ. Arch. Med. Sci. 2013, 9, 191–200. [Google Scholar] [CrossRef] [Green Version]
  52. Cortez-Espinosa, N.; Garcia-Hernandez, M.H.; Reynaga-Hernandez, E.; Cortes-Garcia, J.D.; Corral-Fernandez, N.E.; Rodriguez-Rivera, J.G.; Bravo-Ramirez, A.; Gonzalez-Amaro, R.; Portales-Perez, D.P. Abnormal expression and function of Dectin-1 receptor in type 2 diabetes mellitus patients with poor glycemic control (HbA1c>8%). Metabolism 2012, 61, 1538–1546. [Google Scholar] [CrossRef]
  53. Lauw, F.N.; Pajkrt, D.; Hack, C.E.; Kurimoto, M.; van Deventer, S.J.; van der Poll, T. Proinflammatory effects of IL-10 during human endotoxemia. J. Immunol. 2000, 165, 2783–2789. [Google Scholar] [CrossRef]
  54. Islam, H.; Chamberlain, T.C.; Mui, A.L.; Little, J.P. Elevated Interleukin-10 Levels in COVID-19: Potentiation of Pro-Inflammatory Responses or Impaired Anti-Inflammatory Action? Front. Immunol. 2021, 12, 677008. [Google Scholar] [CrossRef]
  55. Tilg, H.; van Montfrans, C.; van den Ende, A.; Kaser, A.; van Deventer, S.J.; Schreiber, S.; Gregor, M.; Ludwiczek, O.; Rutgeerts, P.; Gasche, C.; et al. Treatment of Crohn’s disease with recombinant human interleukin 10 induces the proinflammatory cytokine interferon gamma. Gut 2002, 50, 191–195. [Google Scholar] [CrossRef]
  56. Hotamisligil, G.S.; Shargill, N.S.; Spiegelman, B.M. Adipose expression of tumor necrosis factor-alpha: Direct role in obesity-linked insulin resistance. Science 1993, 259, 87–91. [Google Scholar] [CrossRef]
  57. Moschen, A.R.; Molnar, C.; Enrich, B.; Geiger, S.; Ebenbichler, C.F.; Tilg, H. Adipose and liver expression of interleukin (IL)-1 family members in morbid obesity and effects of weight loss. Mol. Med. 2011, 17, 840–845. [Google Scholar] [CrossRef]
  58. Hoene, M.; Weigert, C. The role of interleukin-6 in insulin resistance, body fat distribution and energy balance. Obes. Rev. 2008, 9, 20–29. [Google Scholar] [CrossRef]
  59. Hueso, L.; Ortega, R.; Selles, F.; Wu-Xiong, N.Y.; Ortega, J.; Civera, M.; Ascaso, J.F.; Sanz, M.J.; Real, J.T.; Piqueras, L. Upregulation of angiostatic chemokines IP-10/CXCL10 and I-TAC/CXCL11 in human obesity and their implication for adipose tissue angiogenesis. Int. J. Obes. 2018, 42, 1406–1417. [Google Scholar] [CrossRef]
  60. Jialal, I.; Kaur, H.; Devaraj, S. Toll-like receptor status in obesity and metabolic syndrome: A translational perspective. J. Clin. Endocrinol. Metab. 2014, 99, 39–48. [Google Scholar] [CrossRef]
  61. Ahmad, R.; Kochumon, S.; Thomas, R.; Atizado, V.; Sindhu, S. Increased adipose tissue expression of TLR8 in obese individuals with or without type-2 diabetes: Significance in metabolic inflammation. J. Inflamm. 2016, 13, 38. [Google Scholar] [CrossRef] [Green Version]
  62. Dennehy, K.M.; Ferwerda, G.; Faro-Trindade, I.; Pyz, E.; Willment, J.A.; Taylor, P.R.; Kerrigan, A.; Tsoni, S.V.; Gordon, S.; Meyer-Wentrup, F.; et al. Syk kinase is required for collaborative cytokine production induced through Dectin-1 and Toll-like receptors. Eur. J. Immunol. 2008, 38, 500–506. [Google Scholar] [CrossRef]
  63. Ferwerda, G.; Meyer-Wentrup, F.; Kullberg, B.J.; Netea, M.G.; Adema, G.J. Dectin-1 synergizes with TLR2 and TLR4 for cytokine production in human primary monocytes and macrophages. Cell Microbiol. 2008, 10, 2058–2066. [Google Scholar] [CrossRef]
  64. Underhill, D.M. Collaboration between the innate immune receptors dectin-1, TLRs, and Nods. Immunol. Rev. 2007, 219, 75–87. [Google Scholar] [CrossRef]
  65. Sindhu, S.; Kochumon, S.; Thomas, R.; Bennakhi, A.; Al-Mulla, F.; Ahmad, R. Enhanced Adipose Expression of Interferon Regulatory Factor (IRF)-5 Associates with the Signatures of Metabolic Inflammation in Diabetic Obese Patients. Cells 2020, 9, 730. [Google Scholar] [CrossRef]
  66. Sindhu, S.; Thomas, R.; Kochumon, S.; Wilson, A.; Abu-Farha, M.; Bennakhi, A.; Al-Mulla, F.; Ahmad, R. Increased Adipose Tissue Expression of Interferon Regulatory Factor (IRF)-5 in Obesity: Association with Metabolic Inflammation. Cells 2019, 8, 1418. [Google Scholar] [CrossRef]
  67. Cinti, S.; Mitchell, G.; Barbatelli, G.; Murano, I.; Ceresi, E.; Faloia, E.; Wang, S.; Fortier, M.; Greenberg, A.S.; Obin, M.S. Adipocyte death defines macrophage localization and function in adipose tissue of obese mice and humans. J. Lipid Res. 2005, 46, 2347–2355. [Google Scholar] [CrossRef]
  68. Martinez, F.O.; Helming, L.; Gordon, S. Alternative activation of macrophages: An immunologic functional perspective. Annu. Rev. Immunol. 2009, 27, 451–483. [Google Scholar] [CrossRef]
  69. Fuentes, L.; Roszer, T.; Ricote, M. Inflammatory mediators and insulin resistance in obesity: Role of nuclear receptor signaling in macrophages. Mediat. Inflamm. 2010, 2010, 219583. [Google Scholar] [CrossRef]
  70. Cucak, H.; Grunnet, L.G.; Rosendahl, A. Accumulation of M1-like macrophages in type 2 diabetic islets is followed by a systemic shift in macrophage polarization. J. Leukoc. Biol. 2014, 95, 149–160. [Google Scholar] [CrossRef]
  71. Goerdt, S.; Politz, O.; Schledzewski, K.; Birk, R.; Gratchev, A.; Guillot, P.; Hakiy, N.; Klemke, C.D.; Dippel, E.; Kodelja, V.; et al. Alternative versus classical activation of macrophages. Pathobiology 1999, 67, 222–226. [Google Scholar] [CrossRef] [PubMed]
  72. Hao, N.B.; Lu, M.H.; Fan, Y.H.; Cao, Y.L.; Zhang, Z.R.; Yang, S.M. Macrophages in tumor microenvironments and the progression of tumors. Clin. Dev. Immunol. 2012, 2012, 948098. [Google Scholar] [CrossRef]
  73. Gottfried, E.; Kunz-Schughart, L.A.; Weber, A.; Rehli, M.; Peuker, A.; Muller, A.; Kastenberger, M.; Brockhoff, G.; Andreesen, R.; Kreutz, M. Expression of CD68 in non-myeloid cell types. Scand. J. Immunol. 2008, 67, 453–463. [Google Scholar] [CrossRef]
  74. Veloso, P.; Fernandez, A.; Terraza-Aguirre, C.; Alvarez, C.; Vernal, R.; Escobar, A.; Hernandez, M. Macrophages skew towards M1 profile through reduced CD163 expression in symptomatic apical periodontitis. Clin. Oral Investig. 2020, 24, 4571–4581. [Google Scholar] [CrossRef]
Figure 1. Upregulation of adipose tissue (AT) dectin-1 gene and protein expression in obesity. (A) Dectin-1 gene expression was assessed in AT using qRT-PCR in 59 individuals grouped into lean, overweigh and obese based on their BMI, as described in Materials and Methods. Dectin-1 transcripts expression was significantly increased in obese compared with lean adipose tissue (p = 0.0093). (B) Immunohistochemistry (IHC) analysis was performed to determine dectin-1 protein expression using five AT sections isolated from 5 participants per-group (Leans: 3 females + 2 males; Overweight: 1 females + 4 males; Obese: 4 males + 1 female). Screening of all IHC sections revealed no gender differences. Representative images for AT dectin-1 protein expression (magnification, 20×; enlarged area of image in top right corner, magnification, 60×) in obese, overweight, lean individuals. (C) Integrated optical density (IOD) divided by the adipocytes area was used to quantify dectin-1 protein expression in IHC sections of the adipose tissue samples from lean, overweight, and obese individuals. The data (mean ± SEM) show elevated dectin-1 protein expression in overweight (p = 0.0143) and obese (p = 0.0009) individuals compared to lean. Regarding IHC.
Cells 11 02879 g001
Figure 2. Correlation of the adipose tissue (AT) dectin-1 gene expression with metabolic and immune biomarkers. In our study cohort, we performed association studies between the levels of dectin-1 transcripts in AT isolated from individual with different BMI and their clinical parameters as well as the inflammatory biomarkers related to obesity. Dectin-1 gene expression was found to associate positively with (A) Body mass index (p = 0.007), (B) Percentage of body fat (p = 0.017), (C) Plasma C-reactive protein (p = 0.023), and (D) CCL5/RANTES (p = 0.053)). (E) On the other hand, AT dectin-1 transcripts and plasma adiponectin were negatively correlated (p = 0.0017).
Cells 11 02879 g002
Figure 3. Schematic representation of dectin-1 and their association with metabolic inflammation in the context of obesity. Generated by BioRender software license number PM247G7WOB.
Cells 11 02879 g003
Table 1. Demographic and clinical characteristics of the study population.
Metabolic
Markers
LeanOverweightObeseLean vs.
Overweight
Lean vs. Obese
n = 10 (3M/7F) (Mean ± SD)n = 19 (12M/7F) (Mean ± SD)n = 30 (15M/15F) (Mean ± SD)(p-Value)(p-Value)
Age (years)42.70 ± 8.1743.68 ± 11.1245.20 ± 13.120.8070.572
Weight (kg)62.93 ± 11.9079.56 ± 9.9294.48 ± 14.060.0004<0.0001
Height (cm)1.66 ± 0.121.68 ± 0.111.64 ± 0.110.680.754
BMI (kg/m2)22.82 ± 2.3528.27 ± 1.1934.88 ± 3.22<0.0001<0.0001
Waist (cm)81.33 ± 12.4495.19 ± 8.81107.15 ± 12.830.003<0.0001
Body fat (%)28.37 ± 6.2732.52 ± 4.8739.47 ± 4.280.073<0.0001
FBG (mmol/L)4.97 ± 0.645.26 ± 0.685.37 ± 0.760.2820.14
TGL (mmol/L)0.63 ± 0.241.19 ± 0.641.34 ± 0.850.002<0.0001
Chol (mmol/L)5.30 ± 1.114.98 ± 0.735.05 ± 1.140.3480.544
HDL (mmol/L)1.69 ± 0.511.27 ± 0.301.17 ± 0.240.0090.01
LDL (mmol/L)3.31 ± 0.933.18 ± 0.673.29 ± 1.010.6770.963
HbA1c (%)5.66 ± 0.465.49 ± 0.455.70 ± 0.650.350.857
HOMA-IR1.40 ± 0.641.71 ± 0.984.40 ± 3.800.4130.009
WBC5.57 ± 1.606.11 ± 1.436.49 ± 1.970.3790.206
BMI, body mass index; FBG, fasting blood glucose; TGL, triglyceride; Chol, cholesterol; HDL, high-density lipoprotein; LDL, low-density lipoprotein; HbA1c, glycated hemoglobin A1c; HOMA-IR, homeostatic model assessment for insulin resistance; WBC, white blood cells.
Table 2. Correlation of AT dectin-1 gene expression with that of various cytokines/chemokines and their cognate receptors.
Inflammatory MarkersSpearman Correlation
r-Valuep-Valuen
Interleukins
IL-1β0.323 *0.03344
IL-20.2470.06756
IL-5−0.0480.73352
IL-60.1830.19552
IL-80.569 **<0.000149
IL-100.564 **<0.000155
IL-12A0.1880.22743
IL13−0.0820.56252
IL-180.496 **0.000253
IL-23A0.549 **<0.000157
IL-33−0.030.8355
TNF-α0.491 **0.000253
Cytokine/chemokines receptors
IL-2RA0.1000.45458
CCR10.446 **0.00155
CCR20.470 **0.00151
CCR50.681 **<0.000157
CC chemokine ligands
CCL20.266 *0.0555
CCL30.541 **<0.000154
CCL50.527 **0.000147
CCL70.515 **<0.000154
CCL80.2150.13849
CCL110.1940.15954
CCL150.0290.83157
CCL180.569 **<0.000156
CCL190.240.07257
CCL200.624 **<0.000156
CXC chemokine ligands
CXCL90.260 *0.04958
CXCL100.438 **0.00156
CXCL110.446 **0.00157
(* p ≤ 0.05, ** p ≤ 0.001 statistically significant).
Table 3. Correlation of AT dectin-1 transcripts with that of the Toll-like Receptors (TLRs), downstream singling molecules and AT resident monocyte/macrophage markers.
Inflammatory MarkersSpearman Correlation
r-Valuep-Valuen
TLRs and downstream signaling markers
TLR20.663 **0.000150
TLR30.2290.10651
TLR40.0540.71848
TLR70.485 **0.000158
TLR80.652 **0.000155
TLR9−0.0730.5957
TLR100.423 **0.00154
MyD880.408 **0.00257
IRAK10.360 **0.00755
IRF30.1570.28648
IRF50.492 **0.000254
Monocyte/macrophage surface markers
CD160.719 **<0.000156
CD680.502 **<0.000157
CD860.679 **<0.000155
CD1630.603 **<0.000157
(** p ≤ 0.001 statistically significant).
Table 4. Multi Linear Regression analysis, with Dectin-1 as a dependent variable.
ANOVA (Sig) R2 = 0.55; p < 0.0001
Predictor VariableScandalized Confinement (β)p-Value
CCR50.8030.0002
CCL200.0240.0004
TLR21.754<0.0001
MyD882.0360.019
Publisher’s Note: MDPI stays neutral with regard to jurisdictional claims in published maps and institutional affiliations.

