Article

Highly Correlated Recurrence Prognosis in Patients with Metastatic Colorectal Cancer by Synergistic Consideration of Circulating Tumor Cells/Microemboli and Tumor Markers CEA/CA19-9

1
Department of Engineering and System Science, National Tsing Hua University, Hsinchu 30013, Taiwan
2
Molecular Medicine Research Center, Chang Gung University, Taoyuan 33302, Taiwan
3
Department Education Research, Taipei City Hospital, Taipei 10341, Taiwan
4
Center for General Education, National United University, Miaoli 36003, Taiwan
5
General Education Center, University of Taipei, Taipei 110014, Taiwan
6
Institute of Microbiology and Immunology, National Yang-Ming Chiao-Tung University, Taipei 11221, Taiwan
7
Nano Science and Technology Program, Taiwan International Graduate Program, Academia Sinica, Taipei 115, Taiwan
8
Biomedical Science and Engineering Center, National Tsing Hua University, No. 101, Sec. 2, Kuang-Fu Rd., Hsinchu 30013, Taiwan
9
Department of Surgery, Division of Colorectal Surgery, Taipei Veterans General Hospital, Taiwan School of Medicine, National Yang-Ming Chiao-Tung University, Taipei 11217, Taiwan
10
Department of Engineering and System Science, Frontier Research Center on Fundamental and Applied Sciences of Matters, National Tsing-Hua University, Hsinchu 30013, Taiwan
11
Research Center for Applied Sciences, Academia Sinica, No. 128, Sec. 2, Academia Rd., Nankang, Taipei 11529, Taiwan
*
Authors to whom correspondence should be addressed.
Hsueh-Yao Chu and Chih-Yung Yang contributed equally to this work.
Cells 2021, 10(5), 1149; https://doi.org/10.3390/cells10051149
Submission received: 4 November 2020 / Revised: 22 April 2021 / Accepted: 23 April 2021 / Published: 10 May 2021
(This article belongs to the Special Issue Liquid Biopsy)

Abstract

:
Circulation tumor cells (CTCs) play an important role in metastasis and highly correlate with cancer progression; thus, CTCs could be considered as a powerful diagnosis tool. Our previous studies showed that the number of CTCs could be utilized for recurrence prediction in colorectal cancer (CRC); however, the odds ratio was still lower than five. To improve prognosis in CRC patients, we analyzed CTC clusters/microemboli, CTC numbers, and carcinoembryonic antigen (CEA)/carbohydrate antigen 19-9 (CA19-9) levels using a self-assembled cell array (SACA) chip system for recurrence prediction. In CRC patients, the presence of CTC clusters/microemboli may have higher correlation in metastasis when compared to the high number of CTCs. Additionally, when both the number of CTCs and serum CEA levels are high, very high odds ratios of 24.4 and 17.1 are observed in patients at all stages and stage III of CRC, respectively. The high number of CTCs and CTC clusters/microemboli simultaneously suggests the high chance of relapse (odds ratio 8.4). Overall, the characteristic of CTC clusters/microemboli, CEA level, and CTC number have a clinical potential to enhance CRC prognosis.

1. Introduction

Cancer was the second leading cause of human deaths worldwide in 2017 [1]. Colorectal cancer (CRC) is ranked as the third most common cancer and the second largest cause of cancer death in Europe and the United States [2,3]. Studies have estimated that the burden of CRC is expected to increase by 60% in the next decade. Moreover, almost half of CRC patients eventually develop metastasis, even with advances in treatment and monitoring [4,5]. Therefore, early diagnosis and recurrence prognosis are the key to preventing death in CRC patients.
Recurrence in CRC patients might be related to the expression of carcinoembryonic antigen (CEA) and carbohydrate cell surface antigen19-9 (CA19-9) [6,7,8]. However, the expression of CEA and CA19-9 might be influenced by several factors, including the liver status, inflammation, and chemotherapy, limiting the precision of recurrence prognosis, especially in advanced-stage cancers [9,10].
Circulating tumor cells (CTCs) are disseminated cells that detach from the primary tumors. They infiltrate the blood vessels and migrate to distant tissues, inducing cancer metastasis [11,12]. The number of CTCs in the blood is associated with disease progression in several types of cancer [13,14,15,16]. Our previous research has shown that the combination of CTC number and CEA levels can improve the precision of cancer prognosis in CRC patients [17]. Several studies have shown that tumor cells would form CTC clusters/microemboli in the stage of metastasis [18,19,20]. Moreover, patients with CTC clusters were more likely to develop metastasis in breast cancer [20,21].
CTC is known to be a type of rare cell, comprising fewer than 100 cells per 109 blood cells in patients [22,23]. The most common approach to detect CTCs relies on antibody-based selection of cells expressing epithelial cell adhesion molecules (EpCAM) on the surface and immunocytochemical identification of cytokeratin-positive and 45 (CD45)-negative nucleated cells [24,25,26]. However, the analysis of CTC clusters is relatively rare in mainstream research due to the fact that these clusters are vulnerable during the pre-treatment process. In addition, it is hard to distinguish CTC clusters using the fluorescence detection systems on the market [27,28,29,30]. To address these issues, we have developed a microfluidics-based cell self-assembling array chip (SACA) [31] and automatic imaging system [32]. The SACA chip can perform multiple rounds of fluid exchange on top of a cellular monolayer, with minimal cell loss. It is possible to perform multiple antibody labeling of CTC for image analysis within 4 h by coupling to an optimized three-dimensional microwell dialysis (3D-microDialysis) chip. This device can identify one CTC per 105 cells.

2. Results

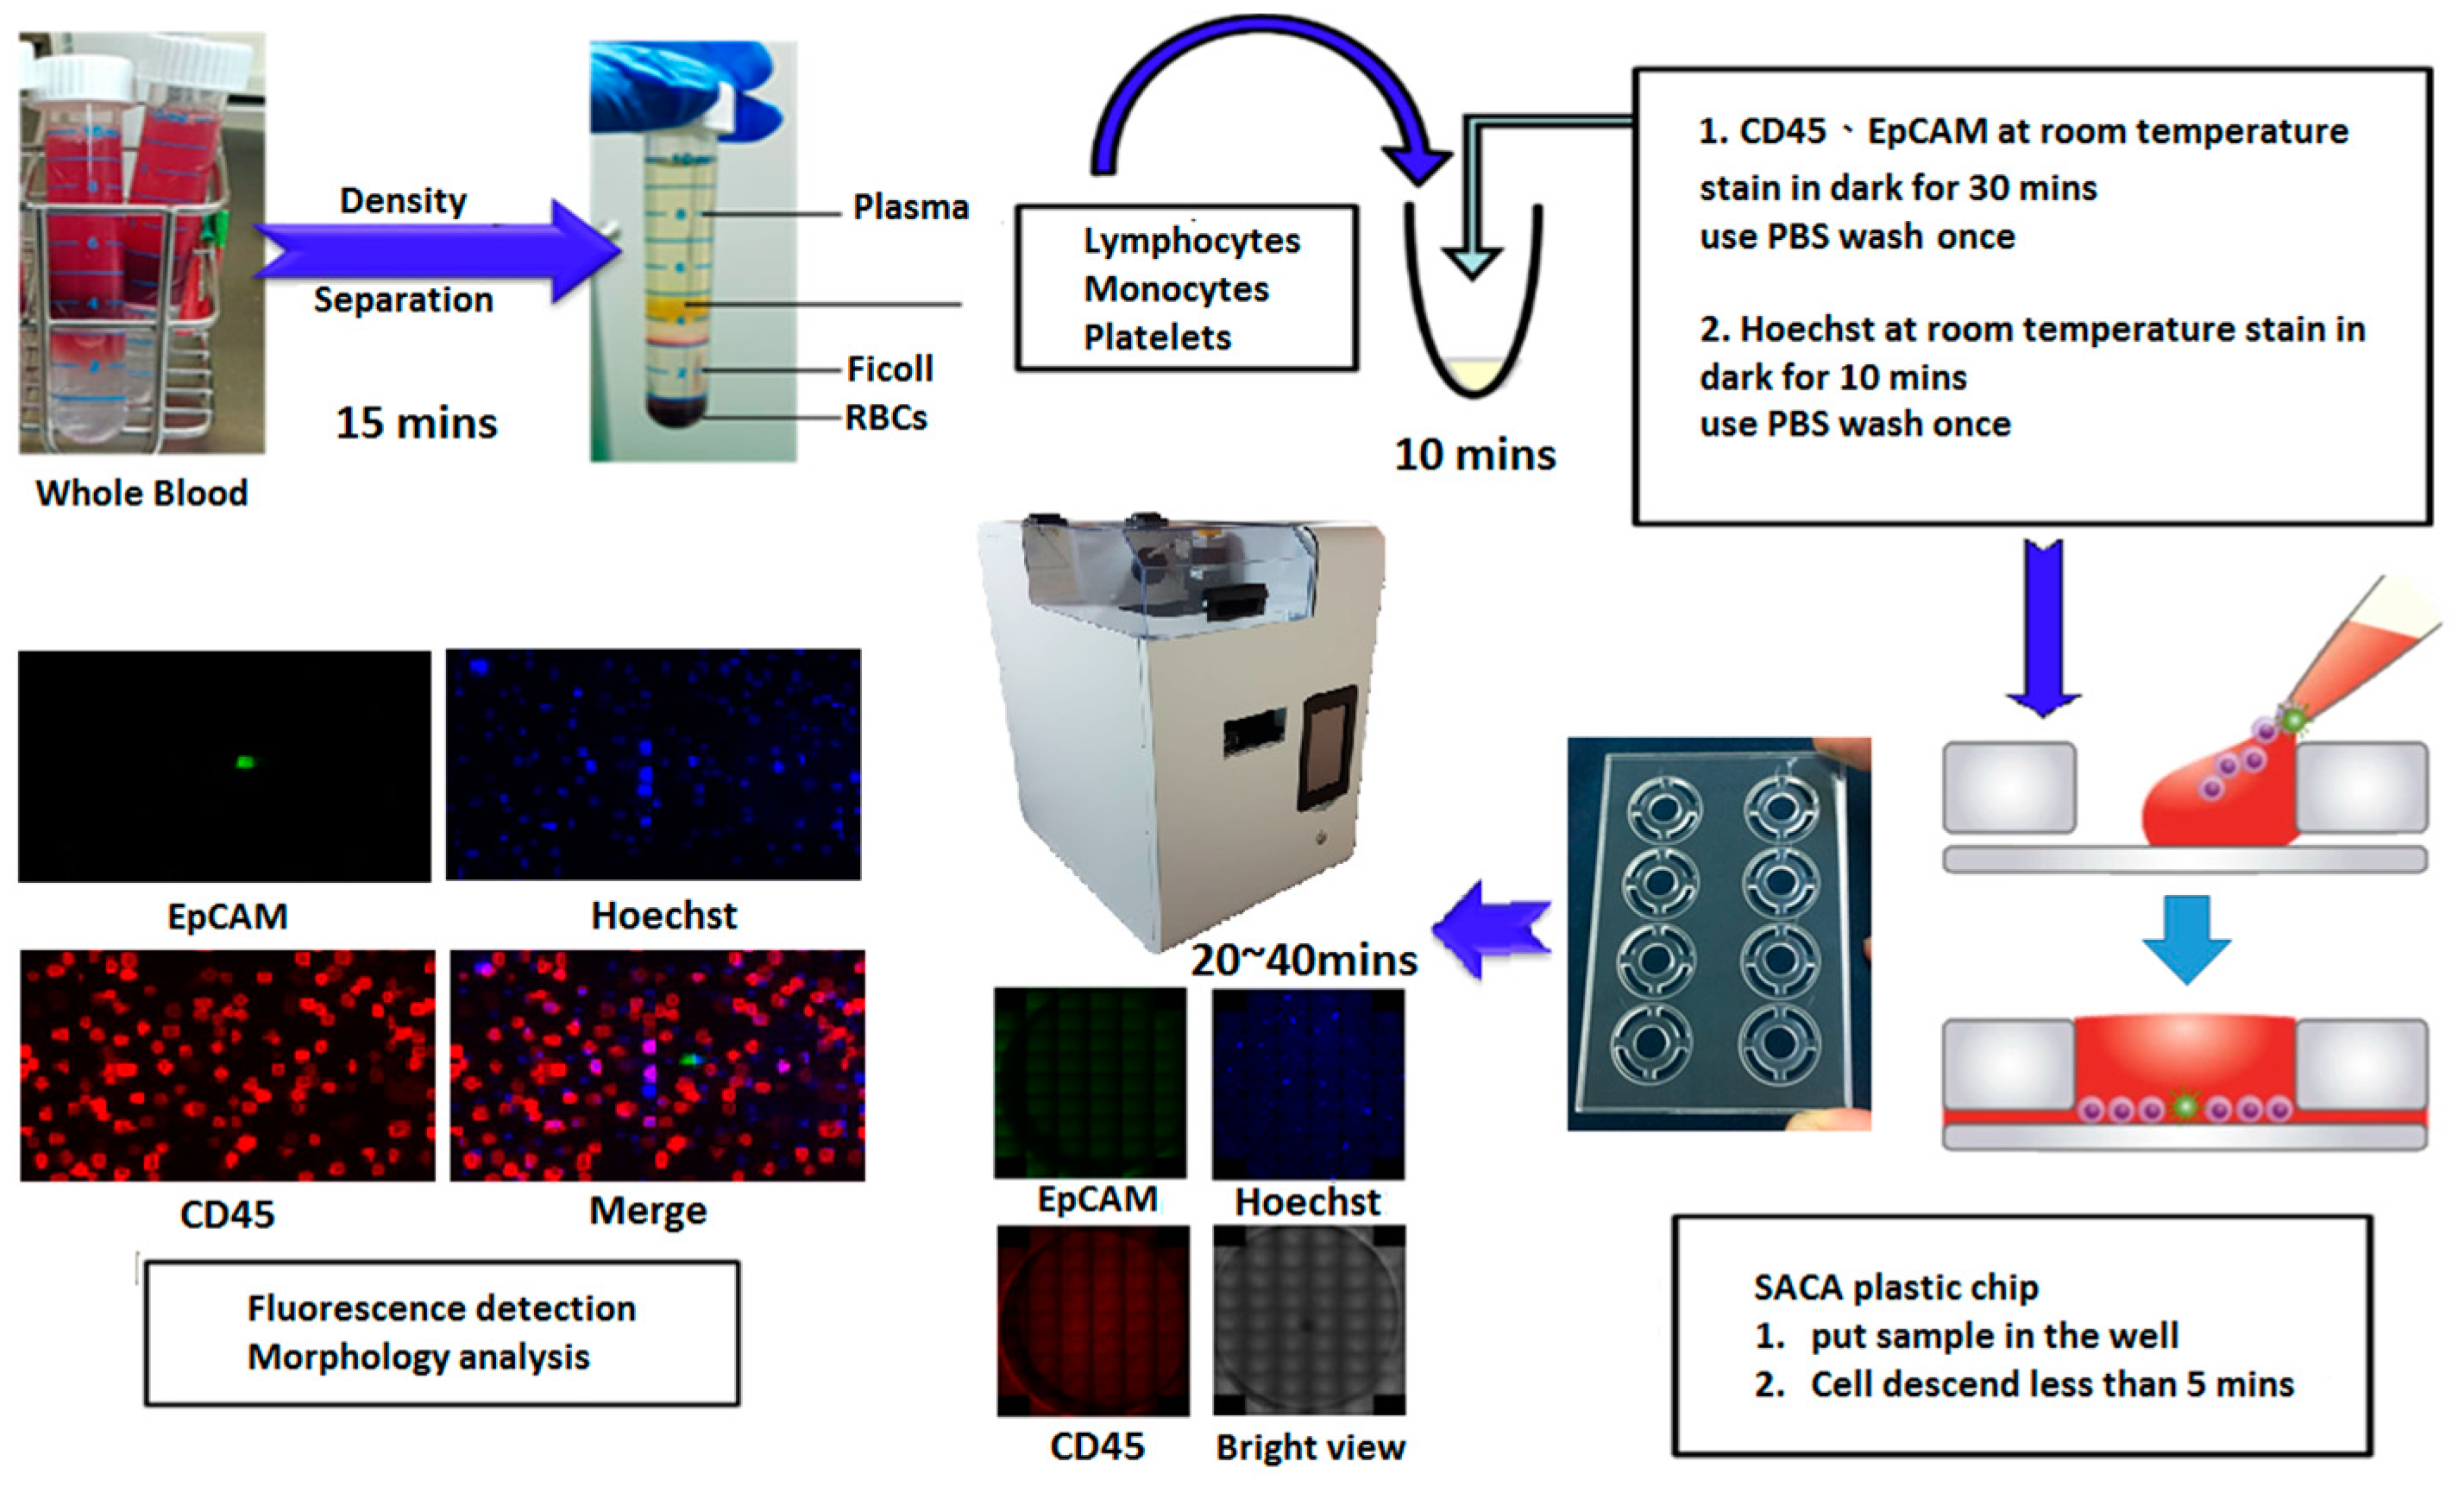
2.1. The Process for Preparing Clinical Samples

2.1.1. Identification and Detection of CTCs

In brief, samples were preserved by a blood tube with K2EDTA (BD Vacutainer®, Plymouth, UK) for both PB and MVB; this stage lasted less than 24 h. Then, red blood cells were removed using Leucosep TM tubes (bio-check LABORATORIES LTD, New Taipei City, Taiwan). In this step, red blood cells were removed through Ficoll–Paque PLUS (GE Healthcare Life Sciences, Taipei, Taiwan) using a concentration gradient. Hoechst (Thermo Fisher Scientific Taiwan Co., Ltd., Taipei, Taiwan) staining was used to mark cell nucleus DNA. CD45 (Beckman Coulter Inc, Brea, CA, USA) was employed to recognize white blood cells. EpCAM (BioMab Inc., Taipei, Taiwan) was used to identify CTC candidates. The details of the process and antibodies were described in a previous work [17]. The SACA chip system was used in CTC and CTC clusters/microemboli enumeration, and the technical details of the SACA chip were described previously [31].

2.1.2. Introduction of SACA Chip

The SACA chip consists of two parts: a 5 μm SU-8 structure made by a lithography process on the glass slide and the acrylic slide with 7 mm wide wells, as shown in the design schematic in Figure 1. Cells are spread on the well bottom by gravity force and capillary fluid force. The side fluid is driven by evaporation force, and cells are restricted by the 5μm gap between well and bottom surface. Each well can contain more than 500,000 cells. The erythrocyte removed samples from a patient’s blood are directly loaded into the well; about 2 SACA chips/15 wells are needed per one blood sample of 7 mL.

2.1.3. Time Evaluation of Each Step for Colorectal Sample

The processes of preparing samples is shown in Figure 2. The process of separating the PBMC from the PB lasted approximately 25 min. Cells were stained by anti-epithelial cell adhesion molecules (EpCAMs) conjugated with fluorescein isothiocyanate (FITC), anti-cluster of differentiation 45 (CD45)-AF594, and Hoechst 33258; the process of staining the cell lasted about 1 h. The cells were settled down on a SACA chip and then became monolayer in 5 min. Finally, all cell images were captured by an automatic imaging system for about 40 min to 80 min. In total, the entire sample process lasted less than 2.5 h.
(The image system protocol is according to Supplementary Video S1 in supplement.)

2.1.4. Automatic Imaging Machine

Our automatic imaging machine was designed in house and manufactured by an external provider (Visionatics Inc., Tainan, Taiwan). The image sensor was chosen from Sony semiconductor products. Both color (IMX183CQJ-J) and monochrome (IMX183CLK-J) products use a high-sensitivity back-illuminated structure with 2.4 μm square unit pixels. The procedure of the machine software is shown in Figure 3. A total of 50 pictures are taken from top to bottom and from left to right for a single well of the SACA chip, and 3 fluorescence images are acquired at the same position before changing to the next place. The system takes 14 min to detect 500,000 cells for 3 fluorescence and one bright view. Overall, the system needs 1 to 2 h to detect CTCs and CTC clusters on a 2 mL blood sample from each patient.

2.2. CTC Phenotyping Analysis in Fluorescence Microscopy

2.2.1. Recovering Rate Analysis in SACA Chip by Spike-In Samples

Fluorescent immunoassay was utilized to detect CTCs in accordance with our previous study [17]. In brief, Hoechst 33258, EpCAM-FITC, and CD45-PECy-7 were used to identify nuclear, EpCAM, and CD45, respectively. HCT 116 CRC cells were spiked into leukocytes using a 1:100,000 ratio and were detected by the SACA chip. The recovering rate was more than 89% (Supplementary Table S1). As shown in Figure 4, HCT116 cells were stained in Hoechst 33258 positive/EpCAM-FITC positive/CD45-PECy-7 negative, but leukocytes were stained in Hoechst 33258 positive/EpCAM-FITC negative/CD45-PECy-7 positive. In addition to fluorescence images, the Optical Microscope (OM) images of cells can also be easily acquired using the same SACA imaging system.
As shown in Figure 5, HCT116 cells were also stained in Hoechst 33258 positive/CK-18 positive/CD45-PECy-7 negative and leukocytes were stained in Hoechst 33258 positive/CK-18 negative/CD45-PECy-7 positive. All of them were observed under the same SACA imaging system, which verified that the EPCAM-identified HCT 116 cells can also be stained by CK-18 specific antibody for CRC tumor cells.

2.2.2. Different Types of CTC Detected by the SACA Chip for CRC Patients

CTCs and CTC clusters were detected in blood samples from CRC patients. Figure 6 shows single-cell CTC (Type I) and two types of CTC clusters (Types II and III). Here, the green fluorescence shows the EpCAM+ cells, the yellow fluorescence shows CD45+ cells, and the blue fluorescence marks the cell nuclei.

2.3. Affirmation in Clinical Samples

Patient Characteristics

We collected blood samples from 166 patients. Among them, both peripheral vein blood (PB) and mesenteric vein blood (MVB) samples were collected from 138 patients. The remaining 28 patients provided either PB (25) or MVB (3) samples. As shown in Table 1, samples of PB, MVB, and lymph node metastasis from 166 patients were analyzed dependent on age, sex, and tumor, nodes, and metastasis (TNM) classification stages. The number of PB, MVB, and lymph node metastasis are 163, 141, and 166, respectively. Among all the cases, the percentage of patients earlier than the T2 period was 36%, and 64% of these patients had not developed lymph node metastasis. Nevertheless, 16 patients had developed metastasis in other organs. We analyzed these data by different TMN stages for different clinical meanings.

2.4. Clinical Implications of CTCs, CTC Clusters, and CEA in Colorectal Cancer

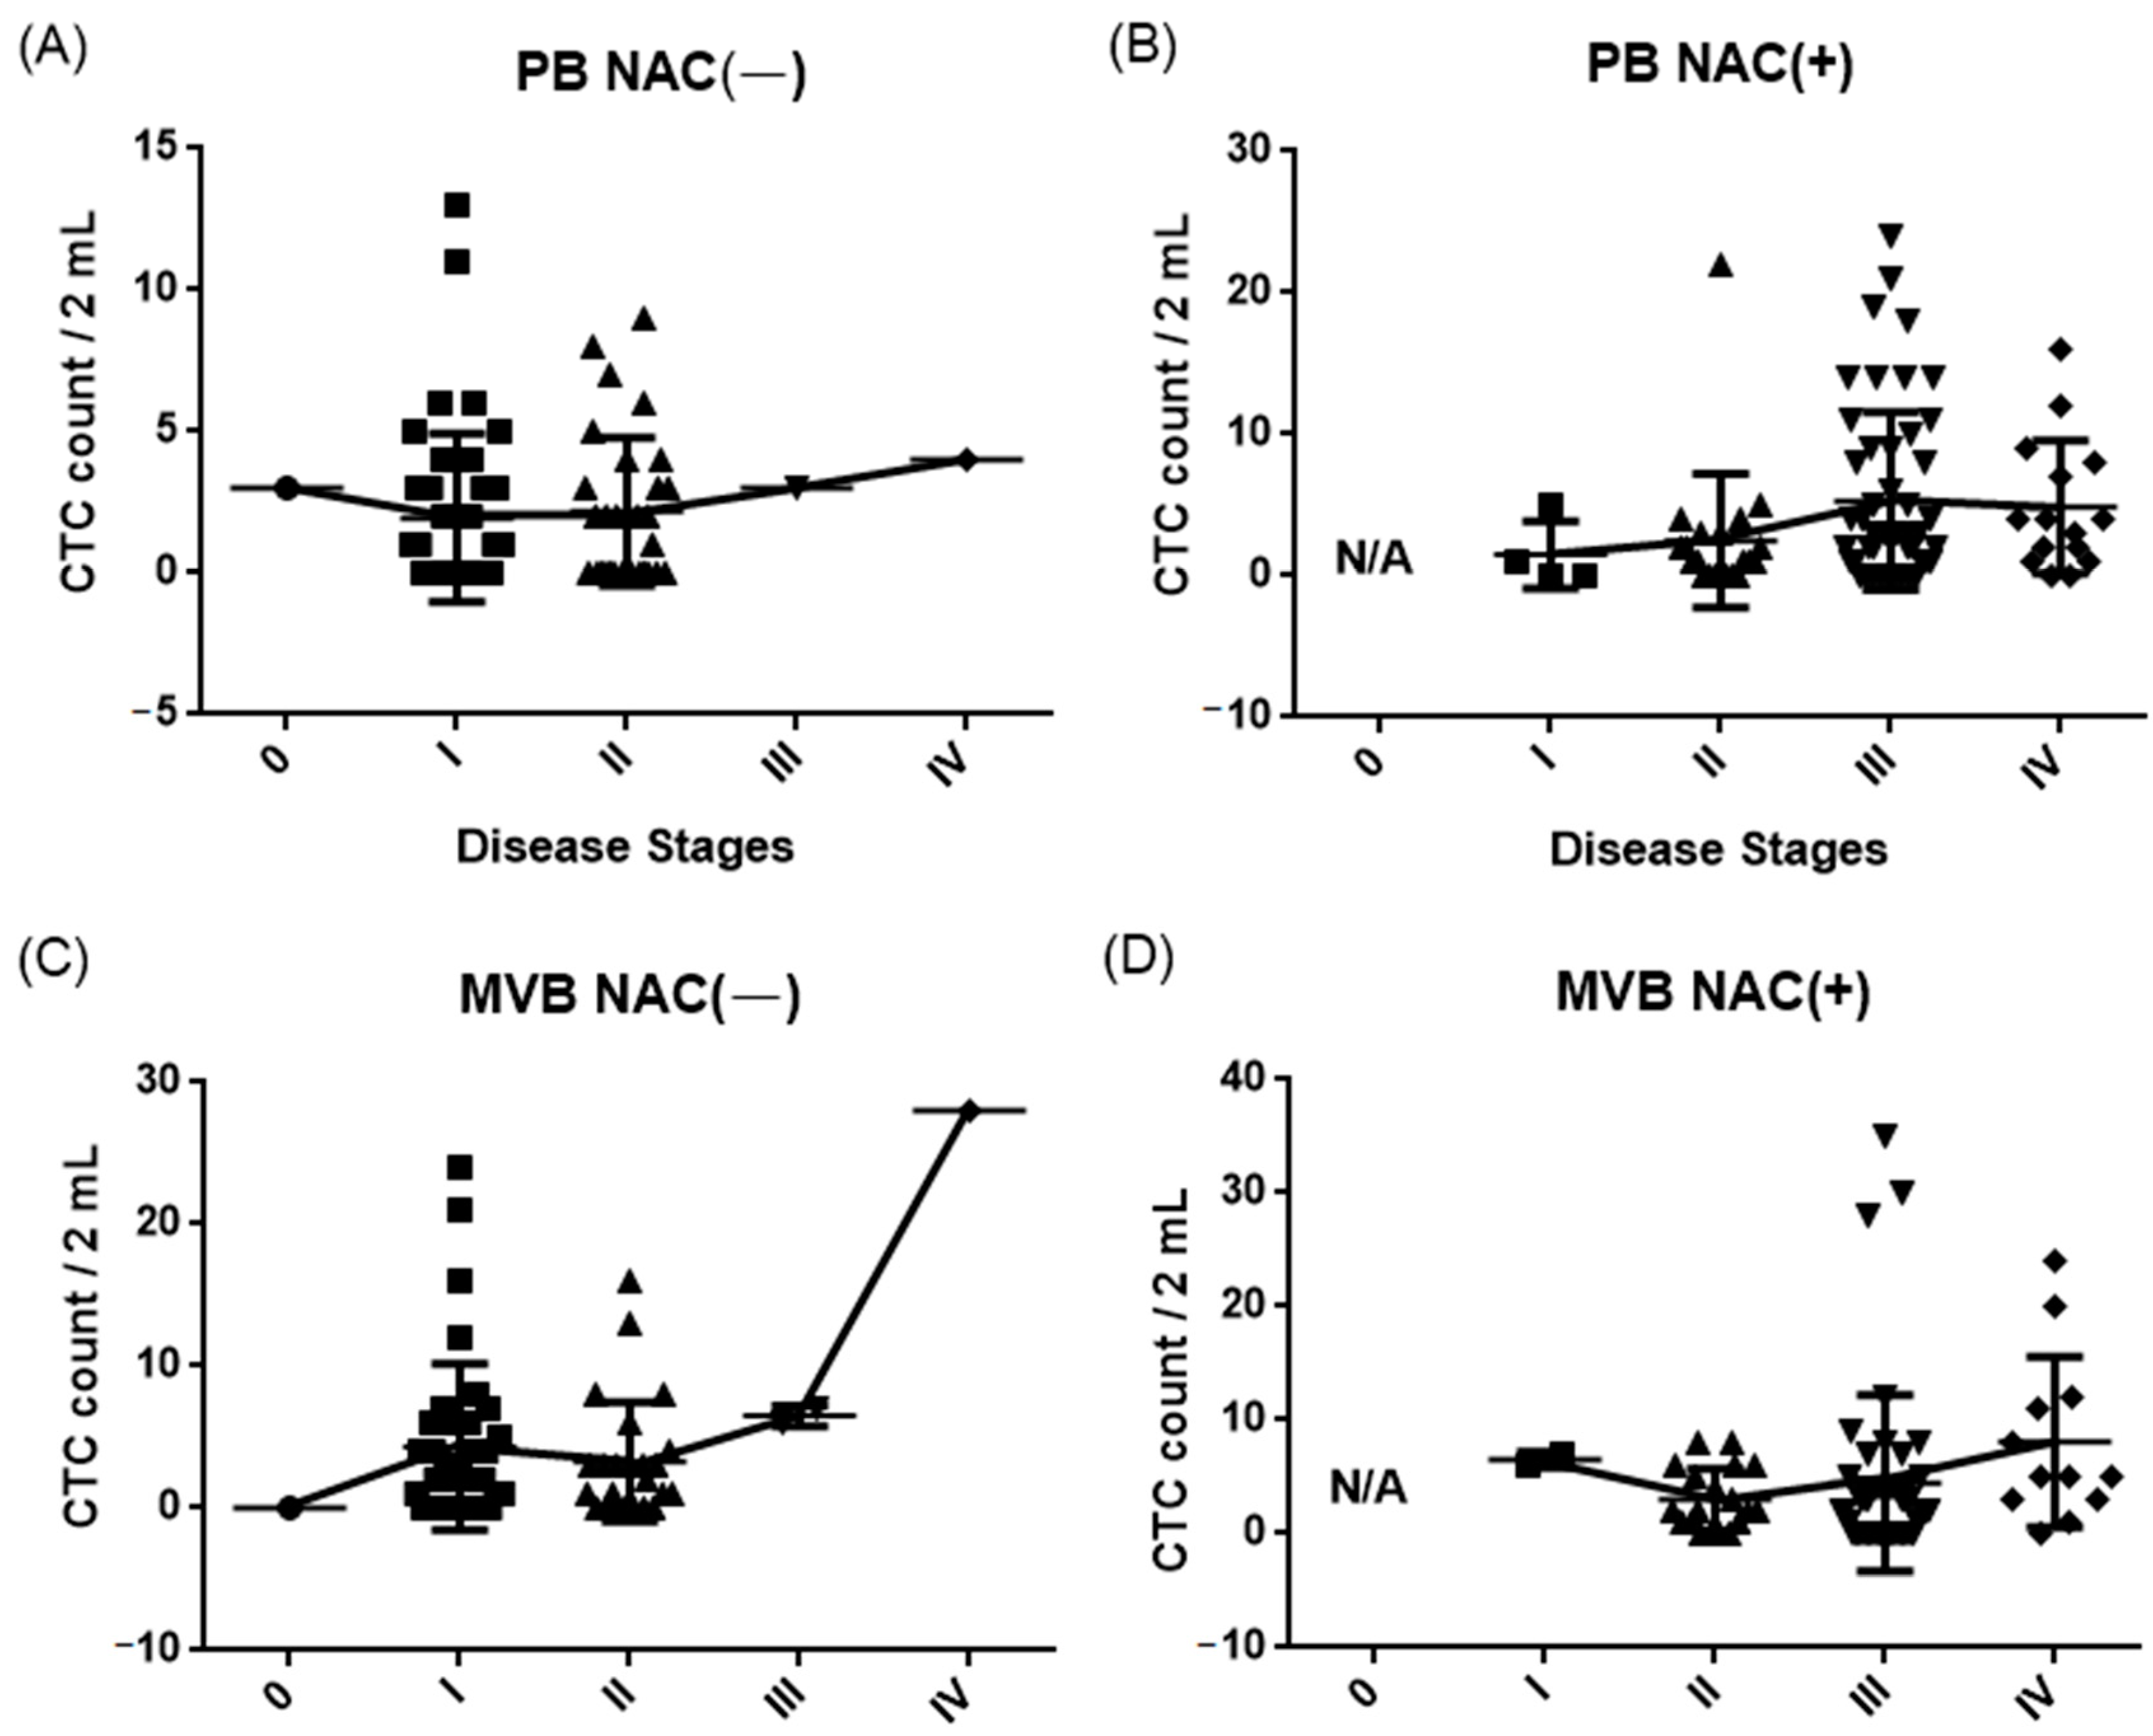
2.4.1. Results of CTC Detection by the SACA Chip

The number of CTCs from patients with different cancer stages were counted by a SACA chip in the automatic imaging system. Patients were separated into two groups according to their neoadjuvant chemotherapy status. The related statistical data for different cancer stages are shown in Table 2. Figure 7 shows the relationship between CTC counted numbers and the cancer stage of patients. Among them, 65.6% of PB cases were CTC positive (107/163), 70.2% of MVB cases were CTC positive (99/141), and 18.1% of patients had CTC clusters (30/166).

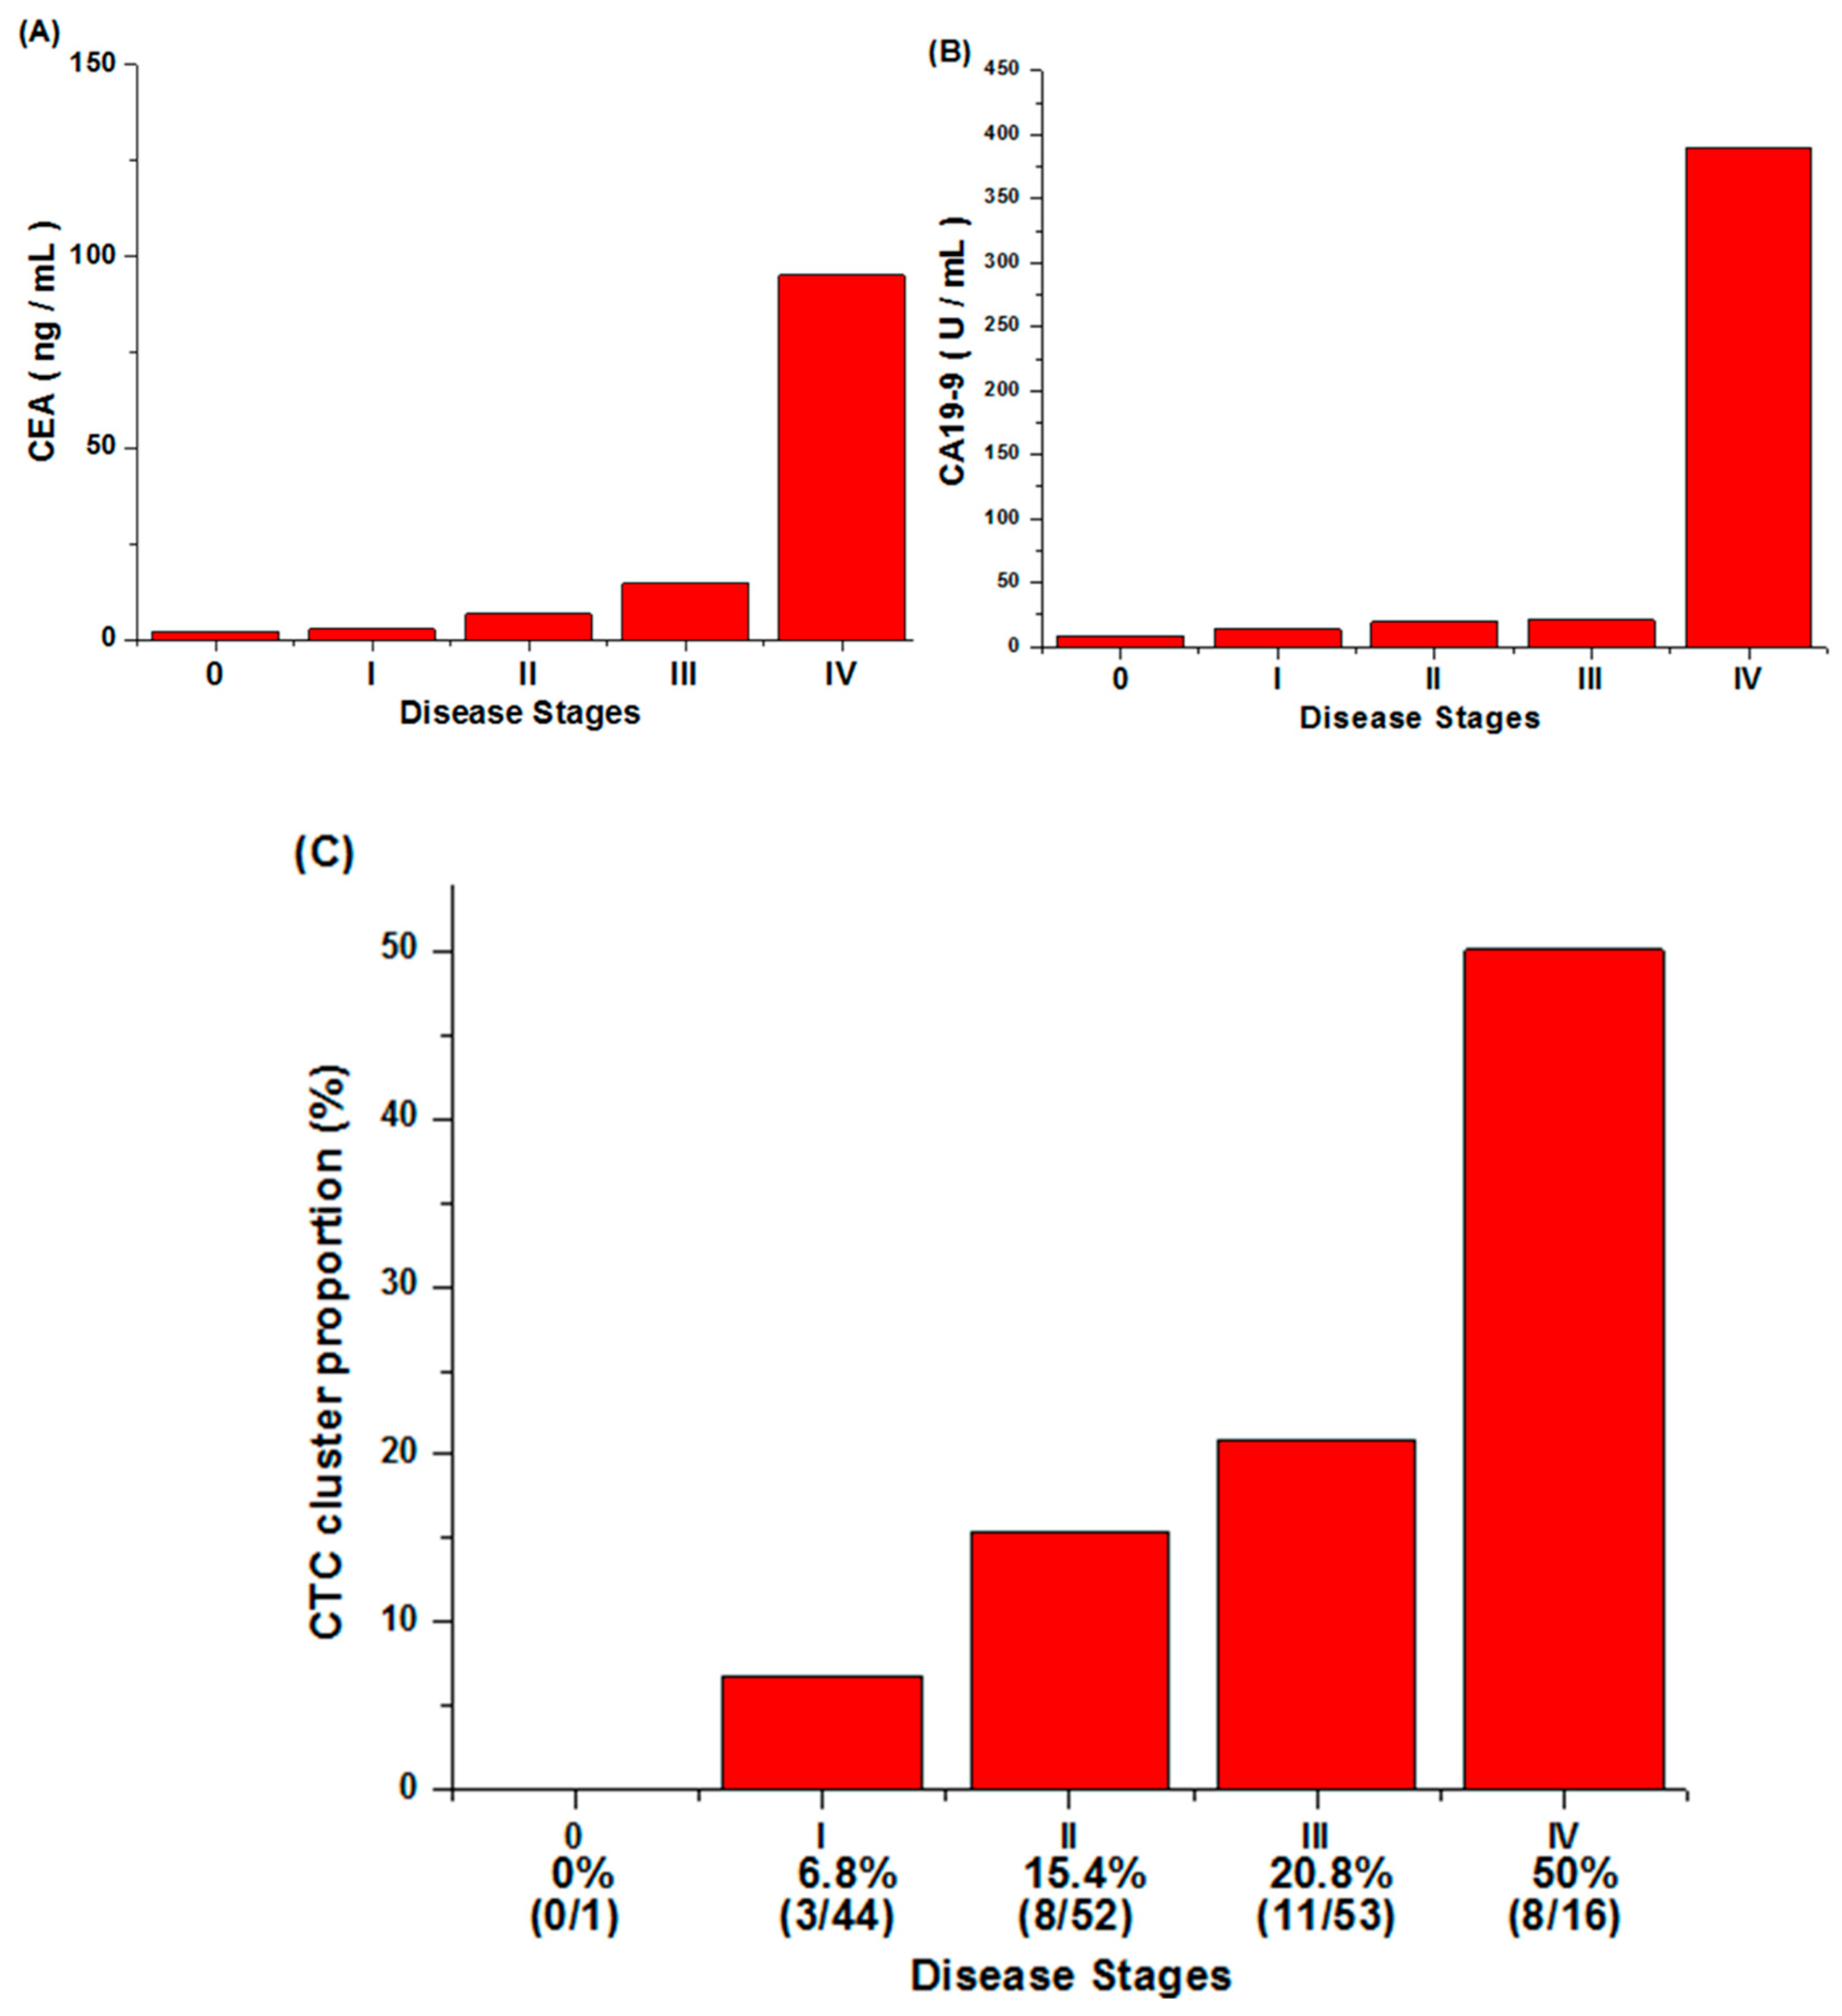
2.4.2. CEA, CA19-9 Value, and CTC Cluster Counts

The increase of CEA and CA 19-9 levels with the increment of disease stage can been observed in Figure 8. However, both tumor markers would be disrupted by liver status, inflammation, and chemotherapy [9,10]. Therefore, a single tumor marker is insufficient to predict disease progression, and more biomarkers are required to improve CRC prognosis.
The percentages of patients with CTC clusters at different cancer stages are shown in Figure 8C. In total, 166 patients with newly diagnosed CRC from a single institute were enrolled, and 30 had detected CTC clusters. (The related cluster count of PB, MVB cases are according to Supplementary Figure S1 in supplement.) Three out of 44 patients with stage I CRC had detected CTC clusters, and the ratio was 6.8% (3/44). Similarly, CTC clusters were found in patients with stage II CRC (15.4% (8/52)) and stage III CRC (20.8% (11/53)). It is noticeable that the ratio of patients with CTC clusters reached 50% (8/16) at stage IV CRC. This suggests that CTC clusters may be an important characteristic for CRC prognosis.

2.5. Prediction of CRC Recurrence with CTCs, CTC Clusters, CEA, CA19-9, and Their Combination

2.5.1. Recurrence Rate and Odds Ratio Analysis

We calculated the odds ratio (OR) of biomarkers (CTC counts, CEA and CA19-9 concentration, and CTC cluster counts) for recurrence prognosis of CRC. Recurrence rate was defined as (recurrence (+) / total patients), and odds ratio was defined as. The cutoff for the CTC count was 3 cells per 2 mL of blood using the Receiver Operating Characteristic (ROC) curve (Figure 9). The cutoffs with the largest area under the ROC curve (AUC) were chosen. The cutoff of CEA was selected to be 5 ng/mL, and the CA19-9 was selected to be 37 U/mL using clinical statistics from hospital. Because CTC clusters are rare, the presence of CTC clusters is defined as high risk.

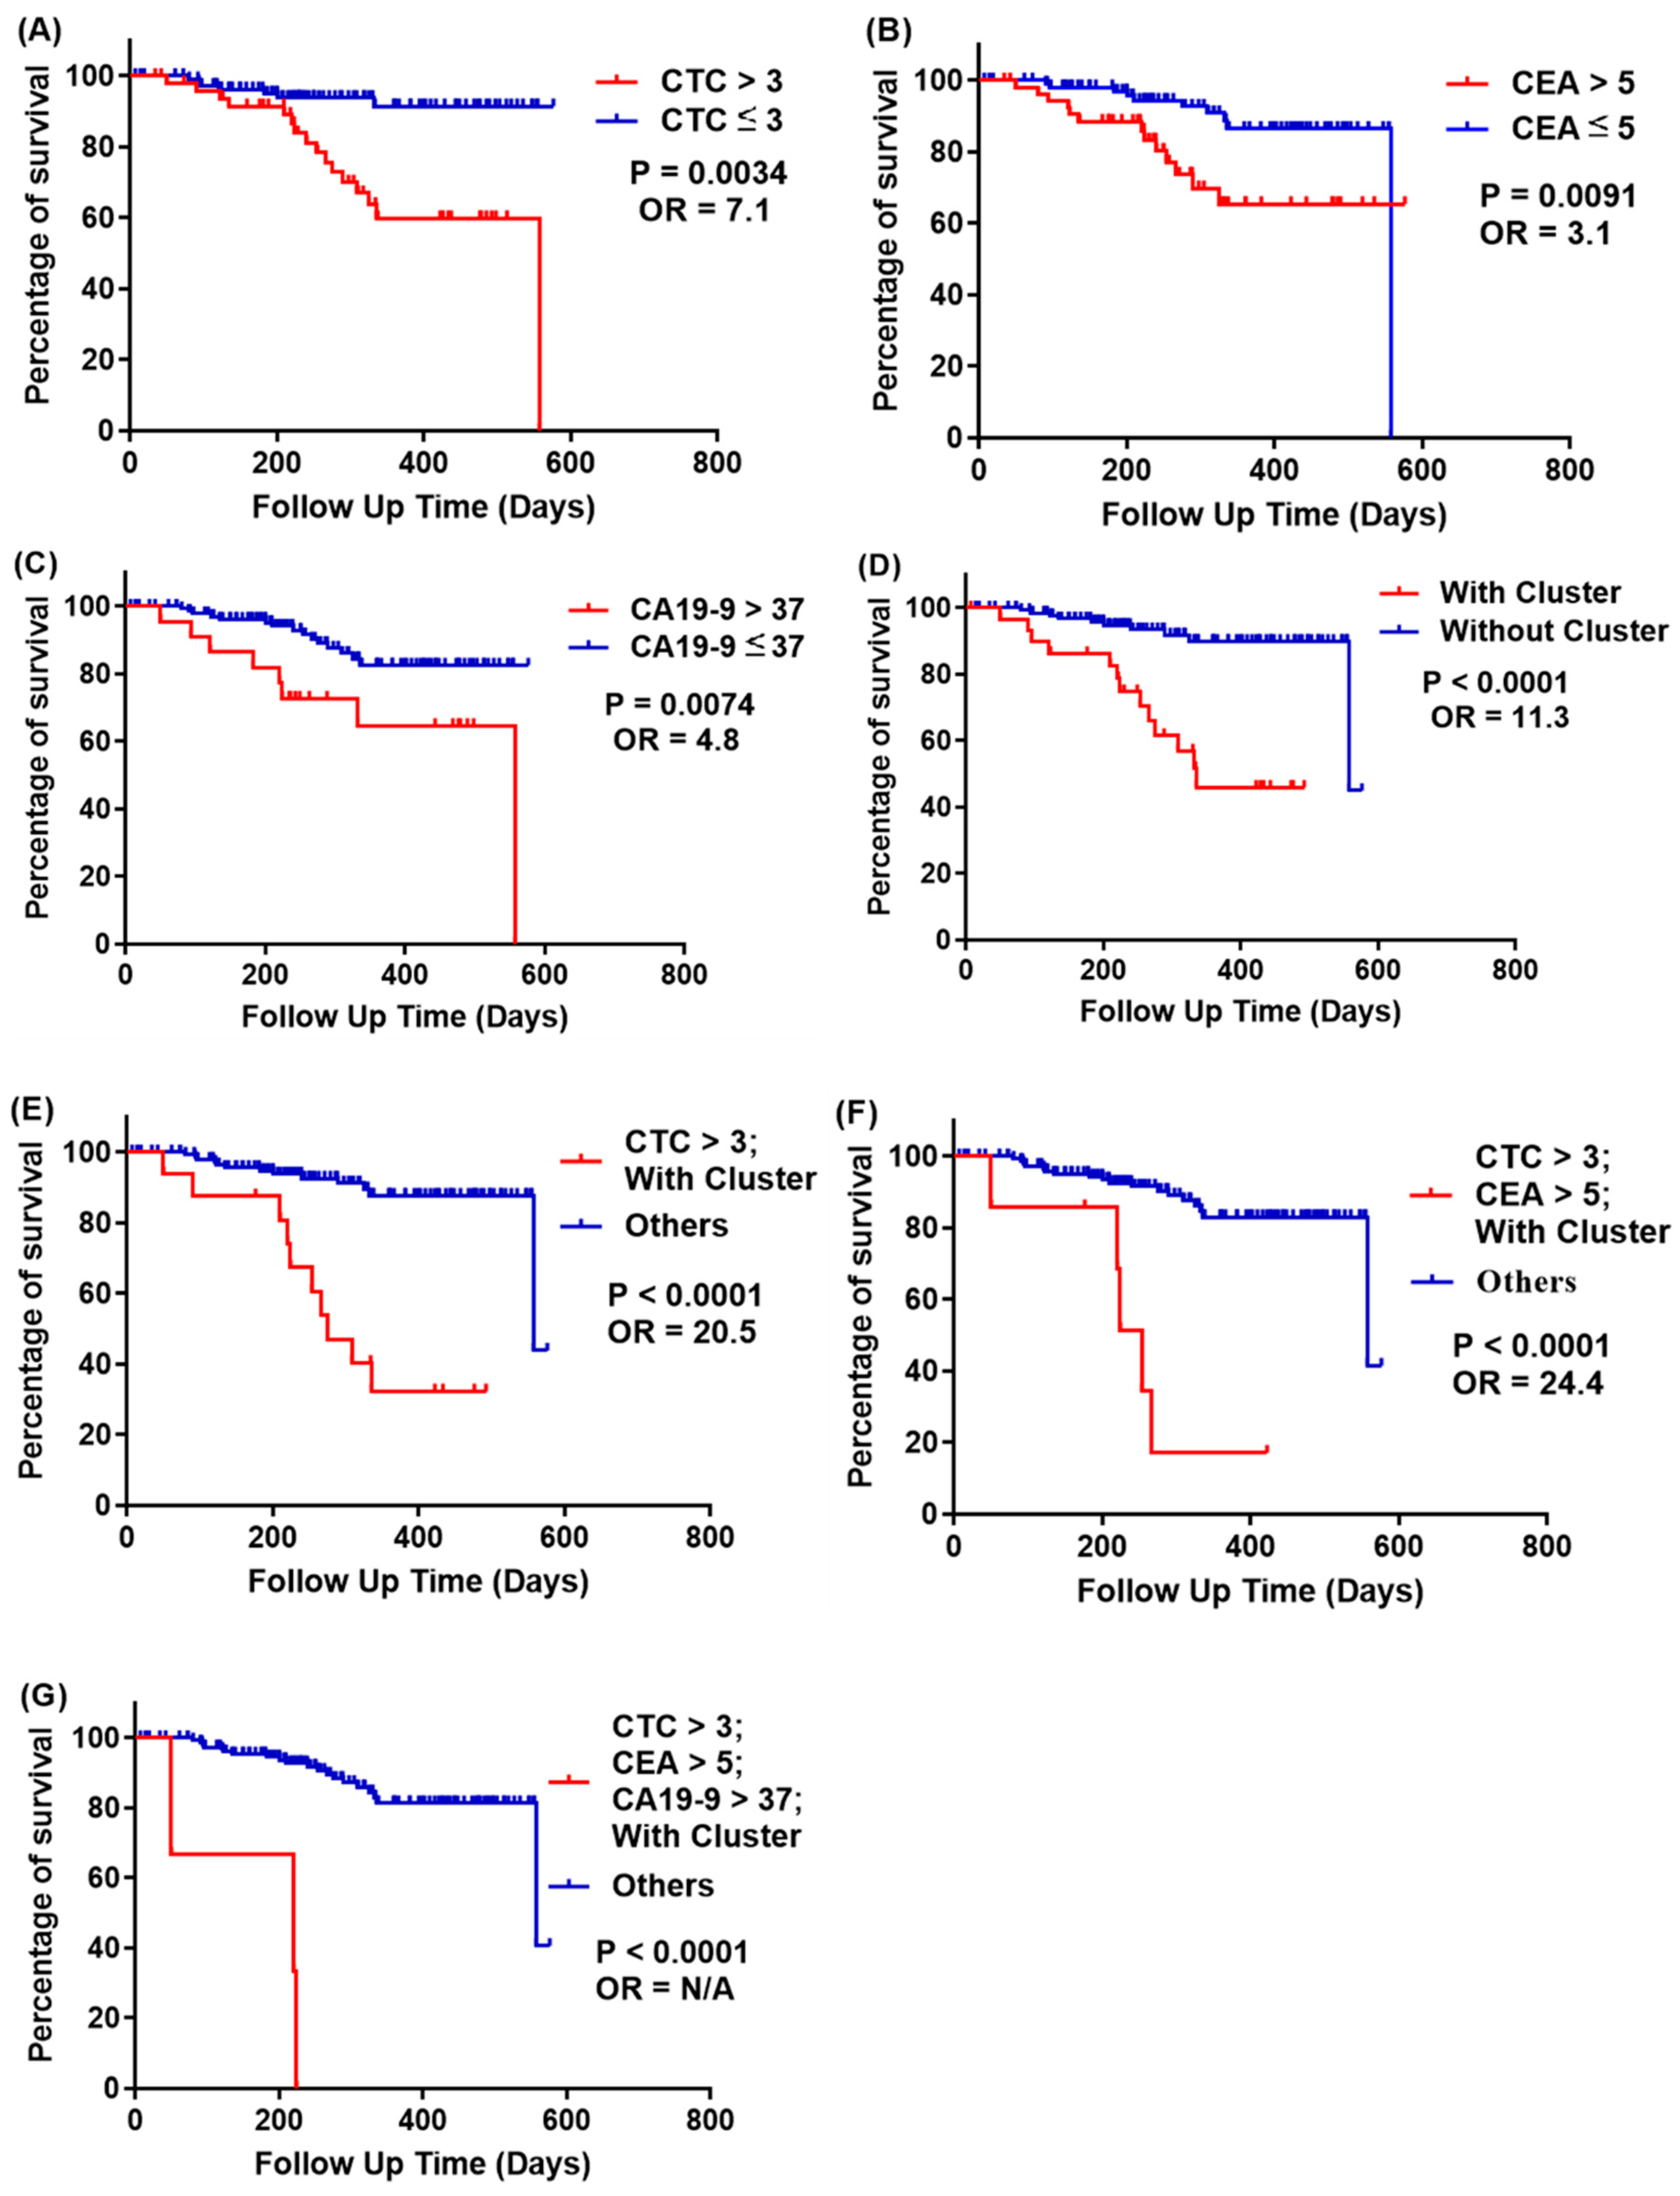
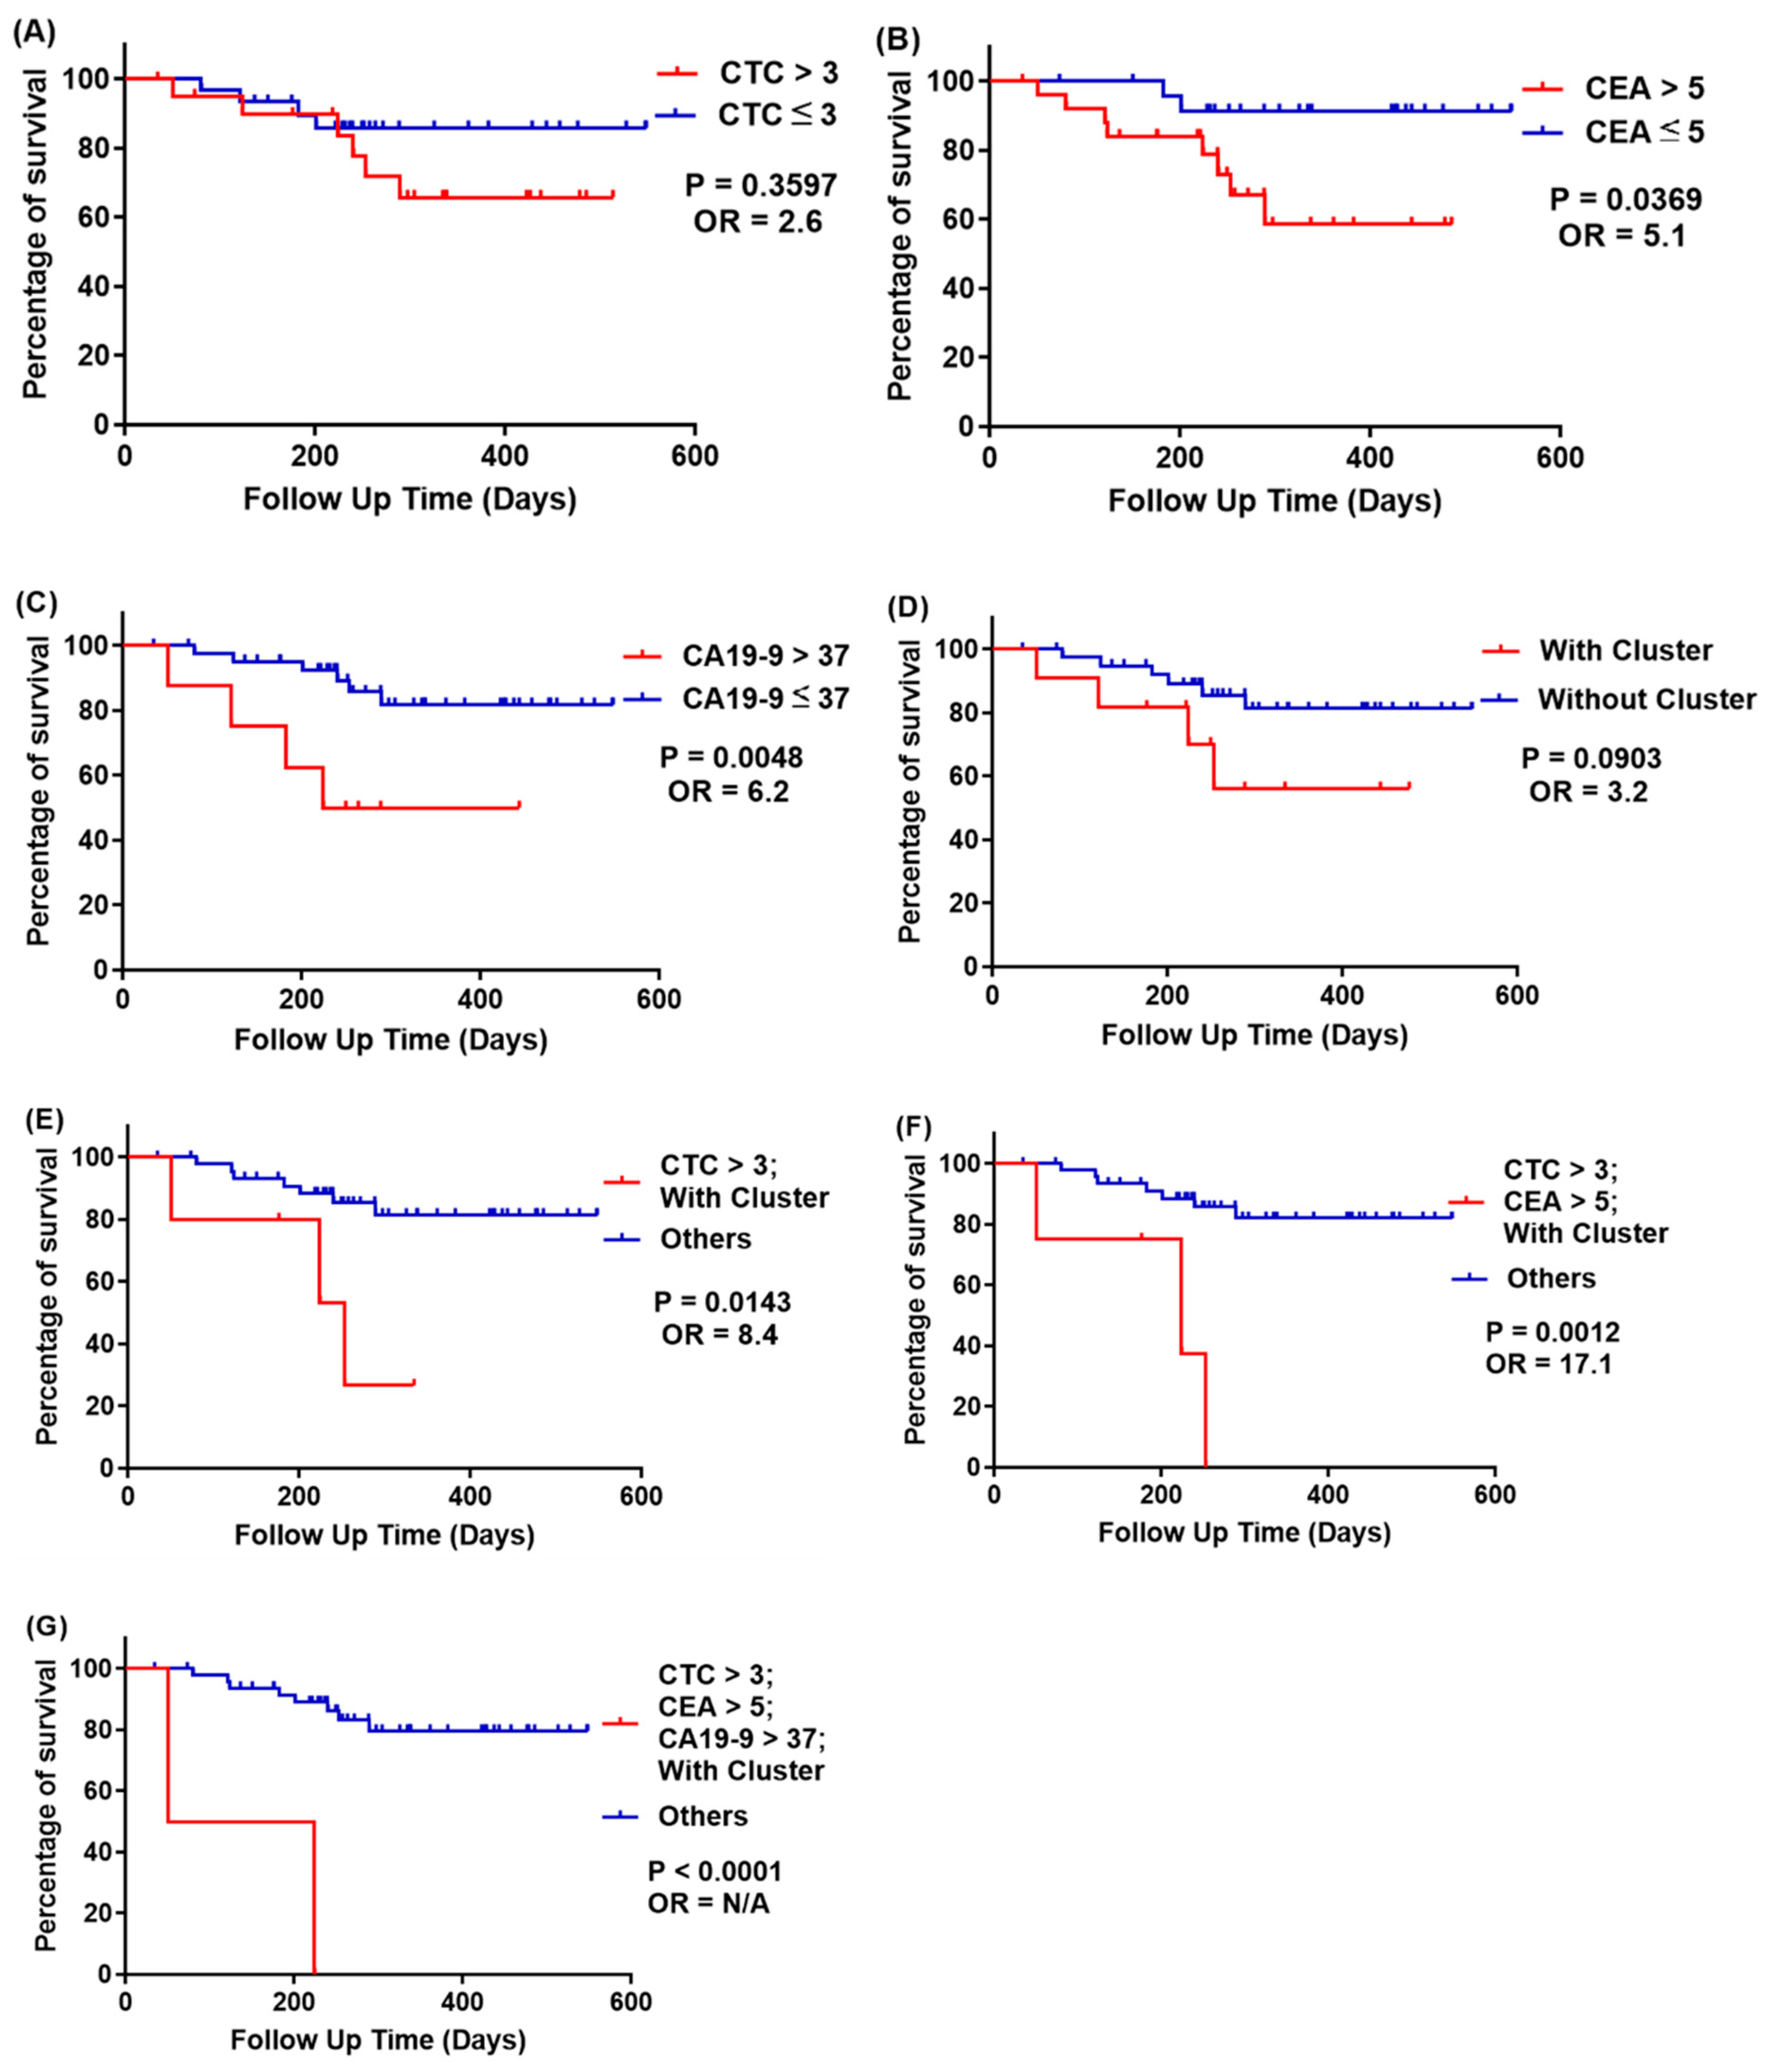
2.5.2. Survival Analysis

Kaplan-Meier survival curves on progression-free survival (PFS) are plotted in Figure 10 and Figure 11; the cutoff is similar to the recurrence and odds ratio criteria. We used survival curve to reveal the relation between recurrence and follow-up time.

2.5.3. Prediction of CRC Recurrence at All Cancer Stages

At all cancer stages (163 Peripheral Vein Blood cases, Table 3), the recurrence rate of patients with CTCs > 3 was 32%, but for those with CTCs ≤ 3, it was 6.2% (p = 0.0034, OR = 7.1, Figure 10A). Recurrence rates for patients with and without CTC clusters are 45.2% and 6.8%, respectively (p < 0.0001, OR = 11.3, Figure 10D). Although CA19-9 showed a high prognosis sensitivity (recurrence rate of CA19-9 > 37 U/mL was 36.4%), it also gave a high false-negative result (recurrence rate of CA19-9 ≤ 37 U/mL was 10.6%); thus the OR value could only reach 4.8. Importantly, CRC prognosis could be improved by combining two or more biomarkers together. For example, the recurrence rate of patients with both CTCs > 3 and CTC clusters was 64.7%, and that of the rest of the patients was 8.2% (p < 0.0001, OR = 20.5, Figure 10E). The recurrence rate in patients with CTCs > 3, CEA > 5 ng/mL, and CTC clusters was 75%, but that of the rest of the patients was 11% (p < 0.0001, OR = 24.4, Figure 10F). The recurrence rate in patients with CTCs > 3, CEA > 5 ng/mL, CA19-9 > 37 U/mL, and CTC clusters was 100%, but that of the rest of the patients was 12.5% (p < 0.0001, OR = N/A, Figure 10G).

2.5.4. Prediction of Recurrence at Stage III CRC

At stage III CRC (51 cases, Table 4), the recurrence rate of patients with CTCs > 3 is 28.6%, but with CTCs ≤ 3 is 13.3% (p = 0.0034, OR = 7.1, Figure 11A). The recurrence rate of patients with CEA > 5 ng/mL is 30.8%, but with CEA ≤ 5 ng/mL is 8% (p = 0.0369, OR = 5.1, Figure 11B). The recurrence rate of patients with CA19-9 > 37 U/mL is 50%, but CA19-9 ≤ 37 U/mL is 14% (p = 0.0048, OR = 6.2, Figure 11C); and the recurrence rate of patients with CTC clusters is 36.4%, but without CTC clusters is 15% (p < 0.0001, OR = 11.3, Figure 11D). We found that false-negative results occurred when using CTCs and CTC clusters as prognosis indicators, but CEA and CA19-9 have higher odds ratio at stage III CRC. To improve prognosis, we combined two or more biomarkers together to reach higher prognosis odds ratio, and the results are similar to that analyzed at all stages of CRC.

3. Materials and Methods

3.1. Sample Resource

The Colorectal cancer samples were sourced from the Taipei Veterans General Hospital for colorectal surgery in Taiwan. The purpose of the trial was to compare the CTC counts with different TMN stages using cell images. The amount of the sample was 133 patients, seen between September 2018 and September 2019, and all the cases were enrolled with a median follow-up of 272 days. The Institutional Review Board (IRB) of Taipei Veterans General Hospital approved the acquisition of the samples, and the case number was IRB-TVPEGH: 2017-11-002ACF. All patients signed the consent for IRB.

3.2. Cell Line Culture and Spike-In Testing

The selection of cell lines and the spike-in control method were described in detail in previous work [17]. In brief, HCT116, one type of human colon cancer cell line, was employed in this research; it was injected into white blood cells in order to simulate CTCs in patient blood. HCT116 cells were cultured in a medium containing Roswell Park Memorial Institute (RPMI-1640) (Corning INC., Brooklyn, NY, USA), 10% fetal bovine serum (FBS) (Corning INC., Brooklyn, NY, USA), and 1% penicillin/streptomycin (Pen-Strep) (GIBCO®, New York, NY, USA) under standard incubation conditions (37 °C, 5% CO2).

3.3. Statistical Analysis

The mean ± standard deviation was used to describe the data. Statistical analysis was conducted using Student’s t-test. The p values less than 0.05 were considered statistically significant. SPSS version 12.0 (IBM, Taipei, Taiwan) and GraphPad Prism 6 (GraphPad Software Inc. San Diego, CA, USA) were used for all statistical analyses. CTC threshold was calculated by the ROC curve method [33]. The time between the day of blood sample collection and the day of local recurrence, distal metastasis, or death was defined as progression-free survival (PFS).

4. Discussion

In this research, we demonstrated that using the SACA chip and the auto-imaging system not only distinguish CTCs in the blood of CRC patients but also identify different types of CTC clusters (Figure 4, Figure 5, and Figure 6). We compared CTC numbers in both PB and MVB in blood samples from a total of 133 CRC patients. The results showed that CTC numbers in PB with non-metastatic CRC showed a gradual increase with cancer stage, while the number of CTCs in MVB had no significant correlation (Figure 7). This result is similar to our previous study, showing stability of our SACA system.
CTC clusters/microemboli exist in aggressive cancers, and we speculated that the potential of using clusters/microemboli as the predictor of metastasis would be better than CTC enumeration alone. Our data proved that CTC clusters have more prognostic value than a high number of CTCs. On the other hand, CEA may not be an effective tool for assessing recurrence in metastatic patients; the prognosis efficiency could be greatly increased if regarding CTC counts as an indicator. The combination of CTC and CTC cluster counts can best predict recurrence in patients with non-metastatic CRC, enhancing prognosis dramatically when compared to our previous studies. This research for CRC recurrence prediction only covers one year; long-term observation is still ongoing for CRC patients participating in this study. As a result, we will further expand the number of participating samples for better CRC recurrence prognosis in the future.

5. Conclusions

CTC clusters/microemboli play a key role in cancer metastasis and could improve prognosis for CRC patients. Our research successfully utilized a microfluidic-based SACA chip and automatic imaging system to provide meaningful clinical information about CRC patients. The common indicator of CEA may not be an effective predictive tool in metastatic CRC, while the combination of CTCs and CTC clusters/microemboli counts can provide a much superior prediction for recurrence. Moreover, we successfully built up a useful risk stratification tool using information about CTC clusters and demonstrated the feasibility and potential of liquid biopsy in clinical prognosis.

Supplementary Materials

The following are available online at https://www.mdpi.com/article/10.3390/cells10051149/s1, Supplementary Table S1: SACA image detecting system spike-in recovering rate, Supplementary Figure S1: CTC clusters number of CRC patient in this research, Supplementary Video S1: The image system protocol.

Author Contributions

Performance of experiments, P.-H.Y.; Data analysis, C.-J.H., P.-H.Y., L.-W.C. and H.-Y.C.; drafting of manuscript, C.-J.H., and P.-H.Y.; conceptualization, H.-Y.C.; revision of manuscript, H.-Y.C., W.-J.C. and W.-C.W.; technical support, C.-W.L. and J.-K.W.; provision of clinical samples, C.-P.L., J.-K.J., C.-Y.Y. and Y.-Y.L.; F.-G.T. designed microfluidic chips and clinical trials, supervised the research, and modified the manuscript. The authors agree to responsibility for all aspects of the work. All authors approved the final version of the manuscript.

Funding

This research was funded by Veterans General Hospitals and University System of Taiwan Joint Research Program [VGHUST] (Project Number: VGHUST109-V6-1-1), Ministry of Science and Technology, (Project Number: MOST109-2634-F007-023, 108-2638-E-007-001-MY2.), and The National Health Research Institutes (NHRI), (Project Number: NHRI-EX109-10713E1).

Institutional Review Board Statement

All procedures were approved by Institutional Review Board (application number: 2016-01-008CC, 2017-06-018BC, 2017-07-008CC, 2018-08-008B).

Informed Consent Statement

Informed consent was obtained from all subjects involved in the study.

Data Availability Statement

Data for cohort available upon reasonable request.

Acknowledgments

The authors are thankful to VGHUST, MOST and National Health Research Institutes (NHRI). This work was also financially supported by the Frontier Research Center on Fundamental and Applied Sciences of Matters, from The Featured Areas Research Center Program within the framework of the Higher Education Sprout Project by the Ministry of Education (MOE 109QR001I5), Taiwan.

Conflicts of Interest

The authors declare no conflict of interest.

References

  1. Kochanek, K.D.; Murphy, S.L.; Xu, J.; Arias, E. Deaths: Final Data for 2017; DHHS Publication: Hyattsville, MD, USA, 2019. [Google Scholar]
  2. Ferlay, J.; Soerjomataram, I.; Dikshit, R.; Eser, S.; Mathers, C.; Rebelo, M.; Parkin, D.M.; Forman, D.; Bray, F. Cancer incidence and mortality worldwide: Sources, methods and major patterns in GLOBOCAN 2012. Int. J. Cancer 2015, 136, E359–E386. [Google Scholar] [CrossRef]
  3. Jemal, A.; Siegel, R.; Xu, J.; Ward, E. Cancer statistics, 2010. CA Cancer J. Clin. 2010, 60, 277–300. [Google Scholar] [CrossRef] [PubMed]
  4. Boursi, B.; Arber, N. Current and future clinical strategies in colon cancer prevention and the emerging role of chemoprevention. Curr. Pharm. Des. 2007, 13, 2274–2282. [Google Scholar] [CrossRef] [PubMed]
  5. Brenner, H.; Chang–Claude, J.; Jansen, L.; Knebel, P.; Stock, C.; Hoffmeister, M. Reduced risk of colorectal cancer up to 10 years after screening, surveillance, or diagnostic colonoscopy. Gastroenterology 2014, 146, 709–717. [Google Scholar] [CrossRef] [PubMed] [Green Version]
  6. Flanagan, F.L.; Dehdashti, F.; Ogunbiyi, O.A.; Kodner, I.J.; Siegel, B.A. Utility of FDG-PET for investigating unexplained plasma CEA elevation in patients with colorectal cancer. Ann. Surg. 1998, 227, 319. [Google Scholar] [CrossRef]
  7. Cutait, R.; Alves, V.A.; Lopes, L.C.; Cutait, D.E.; Borges, J.L.A.; Singer, J.; da Silva, J.H.; Goffi, F.S. Restaging of colorectal cancer based on the identification of lymph node micrometastases through immunoperoxidase staining of CEA and cytokeratins. Dis. Colon Rectum 1991, 34, 917–920. [Google Scholar] [CrossRef] [PubMed]
  8. Chen, C.-C.; Yang, S.-H.; Lin, J.-K.; Lin, T.-C.; Chen, W.-S.; Jiang, J.-K.; Wang, H.-S.; Chang, S.-C. Is it reasonable to add preoperative serum level of CEA and CA19-9 to staging for colorectal cancer? J. Surg. Res. 2005, 124, 169–174. [Google Scholar] [CrossRef]
  9. Duffy, M.J. Carcinoembryonic antigen as a marker for colorectal cancer: Is it clinically useful? Clin. Chem. 2001, 47, 624–630. [Google Scholar] [CrossRef] [Green Version]
  10. Fakih, M.G.; Padmanabhan, A. CEA monitoring in colorectal cancer. Oncology 2006, 20, 579–587. [Google Scholar]
  11. Plaks, V.; Koopman, C.D.; Werb, Z. Circulating tumor cells. Science 2013, 341, 1186–1188. [Google Scholar] [CrossRef]
  12. Giuliano, M.; Shaikh, A.; Lo, H.C.; Arpino, G.; De Placido, S.; Zhang, X.H.; Cristofanilli, M.; Schiff, R.; Trivedi, M.V. Perspective on circulating tumor cell clusters: Why it takes a village to metastasize. Cancer Res. 2018, 78, 845–852. [Google Scholar] [CrossRef] [Green Version]
  13. Danila, D.C.; Heller, G.; Gignac, G.A.; Gonzalez-Espinoza, R.; Anand, A.; Tanaka, E.; Lilja, H.; Schwartz, L.; Larson, S.; Fleisher, M. Circulating tumor cell number and prognosis in progressive castration-resistant prostate cancer. Clin. Cancer Res. 2007, 13, 7053–7058. [Google Scholar] [CrossRef] [Green Version]
  14. Gazzaniga, P.; Gradilone, A.; De Berardinis, E.; Busetto, G.; Raimondi, C.; Gandini, O.; Nicolazzo, C.; Petracca, A.; Vincenzi, B.; Farcomeni, A. Prognostic value of circulating tumor cells in nonmuscle invasive bladder cancer: A CellSearch analysis. Ann. Oncol. 2012, 23, 2352–2356. [Google Scholar] [CrossRef]
  15. Rack, B.; Schindlbeck, C.; Andergassen, U.; Schneeweiss, A.; Zwingers, T.; Lichtenegger, W.; Beckmann, M.; Sommer, H.; Pantel, K.; Janni, W. Use of circulating tumor cells (CTC) in peripheral blood of breast cancer patients before and after adjuvant chemotherapy to predict risk for relapse: The SUCCESS trial. J. Clin. Oncol. 2010, 28, 1003. [Google Scholar] [CrossRef]
  16. Wang, F.-B.; Yang, X.-Q.; Yang, S.; Wang, B.-C.; Feng, M.-H.; Tu, J.-C. A higher number of circulating tumor cells (CTC) in peripheral blood indicates poor prognosis in prostate cancer patients--a meta-analysis. Asian Pac. J. Cancer. Prev. 2011, 12, 2629–2635. [Google Scholar] [PubMed]
  17. Chu, H.-Y.; Lu, L.-S.; Cho, W.; Wu, S.-Y.; Chang, Y.-C.; Lin, C.-P.; Yang, C.-Y.; Lin, C.-H.; Jiang, J.-K.; Tseng, F.-G. Enumerating circulating tumor cells with a Self-Assembled Cell Array (SACA) Chip: A feasibility study in patients with colorectal cancer. Cancers 2019, 11, 56. [Google Scholar] [CrossRef] [PubMed] [Green Version]
  18. Cheung, K.J.; Ewald, A.J. A collective route to metastasis: Seeding by tumor cell clusters. Science 2016, 352, 167–169. [Google Scholar] [CrossRef] [Green Version]
  19. Fabisiewicz, A.; Grzybowska, E. CTC clusters in cancer progression and metastasis. Med. Oncol. 2017, 34, 12. [Google Scholar] [CrossRef] [PubMed]
  20. Wang, C.; Mu, Z.; Chervoneva, I.; Austin, L.; Ye, Z.; Rossi, G.; Palazzo, J.P.; Sun, C.; Abu-Khalaf, M.; Myers, R.E. Longitudinally collected CTCs and CTC-clusters and clinical outcomes of metastatic breast cancer. Breast Cancer Res. Treat. 2017, 161, 83–94. [Google Scholar] [CrossRef] [PubMed]
  21. Aceto, N.; Bardia, A.; Miyamoto, D.T.; Donaldson, M.C.; Wittner, B.S.; Spencer, J.A.; Yu, M.; Pely, A.; Engstrom, A.; Zhu, H. Circulating tumor cell clusters are oligoclonal precursors of breast cancer metastasis. Cell 2014, 158, 1110–1122. [Google Scholar] [CrossRef] [PubMed] [Green Version]
  22. Sastre, J.; Maestro, M.; Puente, J.; Veganzones, S.; Alfonso, R.; Rafael, S.; Garcia-Saenz, J.; Vidaurreta, M.; Martin, M.; Arroyo, M. Circulating tumor cells in colorectal cancer: Correlation with clinical and pathological variables. Ann. Oncol. 2008, 19, 935–938. [Google Scholar] [CrossRef]
  23. Stott, S.L.; Hsu, C.-H.; Tsukrov, D.I.; Yu, M.; Miyamoto, D.T.; Waltman, B.A.; Rothenberg, S.M.; Shah, A.M.; Smas, M.E.; Korir, G.K. Isolation of circulating tumor cells using a microvortex-generating herringbone-chip. Proc. Natl. Acad. Sci. USA 2010, 107, 18392–18397. [Google Scholar] [CrossRef] [Green Version]
  24. Martin, V.; Siewert, C.; Scharl, A.; Harms, T.; Heinze, R.; Ohl, S.; Radbruch, A.; Miltenyi, S.; Schmitz, J. Immunomagnetic enrichment of disseminated epithelial tumor cells from peripheral blood by MACS. Exp. Hematol. 1998, 26, 252–264. [Google Scholar]
  25. Shi, G.; Cui, W.; Benchimol, M.; Liu, Y.-T.; Mattrey, R.F.; Mukthavaram, R.; Kesari, S.; Esener, S.C.; Simberg, D. Isolation of rare tumor cells from blood cells with buoyant immuno-microbubbles. PLoS ONE 2013, 8, e58017. [Google Scholar] [CrossRef] [PubMed] [Green Version]
  26. Yoon, H.J.; Kim, T.H.; Zhang, Z.; Azizi, E.; Pham, T.M.; Paoletti, C.; Lin, J.; Ramnath, N.; Wicha, M.S.; Hayes, D.F. Sensitive capture of circulating tumour cells by functionalized graphene oxide nanosheets. Nat. Nanotechnol. 2013, 8, 735. [Google Scholar] [CrossRef] [PubMed]
  27. Andree, K.C.; van Dalum, G.; Terstappen, L.W. Challenges in circulating tumor cell detection by the CellSearch system. Mol. Oncol. 2016, 10, 395–407. [Google Scholar] [CrossRef] [PubMed] [Green Version]
  28. Müller, V.; Riethdorf, S.; Rack, B.; Janni, W.; Fasching, P.A.; Solomayer, E.; Aktas, B.; Kasimir-Bauer, S.; Pantel, K.; Fehm, T. Prognostic impact of circulating tumor cells assessed with the CellSearch System™ and AdnaTest Breast™ in metastatic breast cancer patients: The DETECT study. Breast Cancer Res. 2012, 14, R118. [Google Scholar] [CrossRef]
  29. Riethdorf, S.; Fritsche, H.; Müller, V.; Rau, T.; Schindlbeck, C.; Rack, B.; Janni, W.; Coith, C.; Beck, K.; Jänicke, F. Detection of circulating tumor cells in peripheral blood of patients with metastatic breast cancer: A validation study of the CellSearch system. Clin. Cancer Res. 2007, 13, 920–928. [Google Scholar] [CrossRef] [Green Version]
  30. Van der Auwera, I.; Peeters, D.; Benoy, I.; Elst, H.; Van Laere, S.; Prove, A.; Maes, H.; Huget, P.; Van Dam, P.; Vermeulen, P. Circulating tumour cell detection: A direct comparison between the CellSearch System, the AdnaTest and CK-19/mammaglobin RT–PCR in patients with metastatic breast cancer. Br. J. Cancer 2010, 102, 276–284. [Google Scholar] [CrossRef] [Green Version]
  31. Chen, T.-J.; Wu, J.-K.; Chang, Y.-C.; Fu, C.-Y.; Wang, T.-P.; Lin, C.-Y.; Chang, H.-Y.; Chieng, C.-C.; Tzeng, C.-Y.; Tseng, F.-G. High-efficiency rare cell identification on a high-density self-assembled cell arrangement chip. Biomicrofluidics 2014, 8, 036501. [Google Scholar] [CrossRef] [Green Version]
  32. Cho, W.; Weng, Y.H.; Chen, H.Y.; Chu, H.Y.; Chiou, T.-J.; Lin, C.P.; Jiang, J.-K.; Yang, C.-Y.; Tseng, F.G. CTCs detection by SACA chip and image analysis. In Proceedings of the 2017 IEEE 12th International Conference on Nano/Micro Engineered and Molecular Systems (NEMS), Los Angeles, CA, USA, 9–12 April 2017; pp. 360–363. [Google Scholar]
  33. Hoo, Z.H.; Candlish, J.; Teare, D. What is an ROC curve? Emerg. Med. J. 2016, 34, 349–356. [Google Scholar] [CrossRef] [Green Version]
Figure 1. The SACA chip consists of 8 wells with a 5 μm gap on the well bottom for cell restriction during the self-assemble process.
Cells 10 01149 g001
Figure 2. The experimental processes of preparing samples.
Cells 10 01149 g002
Figure 3. Automatic imaging machine and software procedure.
Cells 10 01149 g003
Figure 4. Phenotypic analysis in spike-in samples. The HCT116/leucocyte suspension at 1:100,000 dilution was prepared into a self-assembled cell array (SACA) chip and was stained by anti-epithelial cell adhesion molecules (EpCAMs) conjugated with fluorescein isothiocyanate (FITC), anti-cluster of differentiation 45 (CD45)-AF594, and Hoechst 33258. The targeted cell is marked by an arrow.
Cells 10 01149 g004
Figure 5. Phenotypic analysis in spike-in samples. The HCT116/leucocyte suspension at 1:100,000 dilution was prepared into a self-assembled cell array (SACA) chip and was stained by CK-18 conjugated with fluorescein isothiocyanate (FITC), anti-cluster of differentiation 45 (CD45)-AF594, and Hoechst 33258. The targeted cell is marked by an arrow.
Cells 10 01149 g005
Figure 6. Different kinds of CTC detected by our system.
Cells 10 01149 g006
Figure 7. CTC counts for NAC positive or negative patients at different CRC stages from PB (A,B) and MVB (C,D) blood.
Cells 10 01149 g007
Figure 8. The relationship between CEA/CA 19-9/CTC cluster levels and disease stages. (A) The correlation between cancer stages and the carcinoembryonic antigen (CEA). It can be seen that the CEA level has a slight upward trend with the increase in disease stage, and it rises significantly at stage IV. (B) The correlation between cancer stages and the carbohydrate antigen 19-9 (CA19-9). The growth trend of CA19-9 in the first three stages is not obvious, but it is significantly increased in stage IV. (C) The percentage of patients with CTC clusters at each cancer stage. The CTC cluster proportion increases steadily as the stage increases.
Cells 10 01149 g008
Figure 9. The Receiver Operating Characteristic (ROC) curve of the CTC count from patient blood.
Cells 10 01149 g009
Figure 10. Kaplan-Meier survival curves of progression-free survival at all cancer stages of patients, stratified with CTCs, CEA, CA19-9, and CTC clusters. (A) Red line: CTCs > 3; blue line: CTCs ≤ 3; p = 0.0034; (B) red line: both CEA > 5 ng/mL; blue line: CEA ≤ 5 ng/mL, p = 0.0091; (C) red line: both CA19-9 > 37 U/mL; blue line: CA19-9 ≤ 37 U/mL, p = 0.0074; (D) red line: with CTC clusters; blue line: without CTC clusters, p < 0.0001; (E) red line: CTCs > 3 and with CTC clusters; blue line: others, p < 0.0001; (F) red line: CTCs > 3, CEA > 5 ng/mL and with CTC clusters; blue line: others, p < 0.0001; (G) red line: CTCs > 3, CEA > 5 ng/mL, CA19-9 > 37 U/mL, and with CTC clusters; blue line: others, p < 0.0001.
Cells 10 01149 g010
Figure 11. Kaplan-Meier survival curves of progression-free survival of patients at all cancer stages, stratified with CTCs, CEA, CA19-9, and CTC clusters. (A) Red line: CTCs > 3; blue line: CTCs ≤ 3; p = 0.3597; (B) red line: both CEA > 5 ng/mL; blue line: CEA ≤ 5 ng/mL, p = 0.0369; (C) red line: both CA19-9 > 37 U/mL; blue line: CA19-9 ≤ 37 U/mL, p = 0.0048; (D) red line: with CTC clusters; blue line: without CTC clusters, p = 0.0903; (E) red line: CTCs > 3 and with CTC clusters; blue line: others, p = 0.0143; (F) red line: CTCs > 3, CEA > 5 ng/mL, and with CTC clusters; blue line: others, p = 0.0012; (G) red line: CTCs > 3, CEA > 5 ng/mL, CA19-9 > 37 U/mL, and with CTC clusters; blue line: others, p < 0.0001.
Cells 10 01149 g011
Table 1. Demographics of patients. Age, sex, and TNM (tumor, nodes, metastasis-classification) stages were analyzed for patients with peripheral blood (PB) and mesenteric vein blood (MVB) samples (A,B). Lymph node metastasis was analyzed in (C). The ratio of carcinoembryonic antigen (CEA) and carbohydrate antigen 19-9 (CA19-9) in the whole assemblage was calculated (C).
(A) Peripheral Vein Blood (PB)
CharacteristicsPatients (n)Percentage (%)
Age (years)
<605835.60%
≥6010564.40%
Sex
Male10564.40%
Female5835.60%
T status
T0-T25735%
T3-T410665%
(B) Mesenteric Vein Blood (MVB)
CharacteristicsPatients (n)Percentage (%)
Age (years)
<605236.90%
≥608963.10%
SexSex
Male9265.20%
Female4934.80%
T status
T0–T25035.50%
T3–T49164.50%
(C) All patients
CharacteristicsPatients (n)Percentage (%)
Lymph Node Metastasis
Negative10160.80%
Positive6539.10%
Preoperative Serum CEA
≤5 ng/mL5533.10%
>5 ng/mL11166.90%
Preoperative Serum CA19-9
<37 U/mL14386.10%
≥37 U/mL2313.90%
TNM: tumor, nodes, metastasis classification.
Table 2. Number of circulating tumor cells (CTCs) isolated in the colon cancer cases.
(A) CTC Count in 2 mL PB Blood
NAC (−) NAC (+)
Disease StagesNo. of CasesRangeMean MedianSDModeDisease StagesNo. of CasesRangeMean MedianSD Mode
01N/A3N/AN/AN/A00N/AN/AN/AN/AN/A
I400–131.9512.940I40–5 1.50.52.060
II300–92.1722.270II210–22 2.4814.610
III1N/A3N/AN/AN/AIII500–24 5.2836.220
IV1N/A4N/AN/AN/AIV150–16 4.8744.514
(B) CTC Count in 2 mL MVB Blood
NAC (−) NAC (+)
Disease StagesNo. of CasesRangeMean MedianSDModeDisease StagesNo. of CasesRangeMean MedianSDMode
01N/A0N/AN/AN/A00N/AN/AN/AN/AN/A
I350–24 4.3125.760I26–76.56.50.5N/A
II256–73.1624.090II180–8 2.7222.452
III20–176.56.50.5N/AIII450–35 4.4427.690
IV1N/A28N/AN/AN/AIV120–24 8.0857.165
NAC—neoadjuvant chemotherapy; SEM—standard error of mean; N/A—not available.
Table 3. Odds ratios (ORs) of CTCs, CEA, CA19-9, and CTC clusters and their combination to predict recurrence for patients at all cancer stages. N/A: not analyzable due to the absence of recurrent events.
All Cancer Stages (163 Cases)No. of Cases
CTCs per 2 mL BloodRecurrence No Recurrence Recurrence Rate(Odds Ratio, OR)
CTCs > 31634 32%7.1
CTCs ≤ 371066.2%
CEA > 5134124%3.1
CEA ≤ 510999.2%
CA19-9 > 3781436.4%4.8
CA19-9 ≤ 371512610.6%
With CTC clusters141745.2%11.3
Without CTC clusters91236.8%
CTCs > 3; CEA > 5101245.5%8.2
Others131289.2%
CTCs > 3; CA19-9 > 374357.1%9.6
Others1913712.8%
CTCs > 3; With CTC clusters11664.7%20.5
Others121348.2%
CEA > 5; CA19-9 > 375741.7%5.3
Others1813311.9%
CEA > 5; With CTC clusters7846.7%7.2
Others1613210.8%
CA19-9 > 37; With CTC clusters5455.6%9.4
Others1813611.7%
CTCs > 3; CEA > 5; CA19-9 > 373175%20.9
Others2013912.8%
CTCs > 3; CEA > 5; With CTC clusters6275%24.4
Others1713811%
CTCs > 3; CA19-9 > 37; With CTC clusters1150%6.3
Others2213913.7%
CEA > 5; CA19-9 > 37; With CTC clusters3350%6.9
Others2013712.7%
CTCs > 3; CEA > 5;
CA19-9 > 37; With CTC clusters
30100%N/A
Others2014012.5%
Table 4. Odds ratios (ORs) of CTCs, CEA, CA19-9, CTC clusters and their combination to predict recurrence of patients with stage III CRC. N/A: not analyzable due to absence of recurrent.
Stage III CRC (51 Cases)No. of Cases
Recurrence No Recurrence Recurrence Rate(Odds Ratio, OR)
CTCs > 36428.6%2.6
CTCs ≤ 3152613.3%
CEA > 581830.8%5.1
CEA ≤ 52238%
CA19-9 > 374450%6.2
CA19-9 ≤ 3763714%
With CTC clusters4736.4%3.2
Without CTC clusters63415%
CTCs > 3; CEA > 56746.2%7.3
Others43410.5%
CTCs > 3; CA19-9 > 3720100%N/A
Others84116.3%
CTCs > 3; With CTC clusters3260%8.4
Others73915.2%
CEA > 5; CA19-9 > 373350%5.4
Others73815.6%
CEA > 5; With CTC clusters4544.4%4.8
Others63614.3%
CA19-9 > 37; With CTC clusters3350%5.4
Others73815.6%
CTCs > 3; CEA > 5; CA19-9 > 3720100%N/A
Others84116.3%
CTCs > 3; CEA > 5; With CTC clusters3175%17.1
Others74014.9%
CTCs > 3; CA19-9 > 37; With CTC clusters20100%N/A
Others84116.3%
CEA > 5; CA19-9 > 37; With CTC clusters3350%5.4
Others73815.6%
CTCs > 3; CEA > 5;
CA19-9 > 37; With CTC clusters
20100%N/A
Others84116.3%
Publisher’s Note: MDPI stays neutral with regard to jurisdictional claims in published maps and institutional affiliations.

