Article

YY2 in Mouse Preimplantation Embryos and in Embryonic Stem Cells

by
Raquel Pérez-Palacios
1,2,
María Climent
2,3,
Javier Santiago-Arcos
2,†,
Sofía Macías-Redondo
1,‡,
Martin Klar
4,
Pedro Muniesa
2,3 and
Jon Schoorlemmer
1,3,5,*
1
Regenerative Medicine Program, Instituto Aragonés de Ciencias de la Salud, CIBA, Avenida San Juan Bosco 13, 50009 Zaragoza, Spain
2
Departamento de Anatomía, Embriología y Genética Animal, Facultad de Veterinaria, Universidad de Zaragoza, C/Miguel Servet 177, 50013 Zaragoza, Spain
3
Placental Pathophysiology and Fetal Programming Group, Fundación IISA, Avenida San Juan Bosco 13, 50009 Zaragoza, Spain
4
Department of Neonatology, Charité—Universitätsmedizin Berlin, Augustenburger Platz 1, 13353 Berlin, Germany
5
Fundación “Agencia Aragonesa para la Investigación y el Desarrollo” (ARAID), 50018 Zaragoza, Spain
*
Author to whom correspondence should be addressed.
Current address: Center for Cooperative Research in Biomaterials (CIC biomaGUNE), 20014 Donostia San Sebastián, Spain.
Current address: CerTest Biotec SL, 50840 Zaragoza, Spain.
Cells 2021, 10(5), 1123; https://doi.org/10.3390/cells10051123
Submission received: 19 March 2021 / Revised: 22 April 2021 / Accepted: 29 April 2021 / Published: 7 May 2021

Abstract

:
Yin Yang 2 encodes a mammalian-specific transcription factor (YY2) that shares high homology in the zinc finger region with both YY1 and REX1/ZFP42, encoded by the Yin Yang 1 and Reduced Expression Protein 1/Zinc Finger Protein 42 gene, respectively. In contrast to the well-established roles of the latter two in gene regulation, X chromosome inactivation and binding to specific transposable elements (TEs), much less is known about YY2, and its presence during mouse preimplantation development has not been described. As it has been reported that mouse embryonic stem cells (mESC) cannot be propagated in the absence of Yy2, the mechanistic understanding of how Yy2 contributes to mESC maintenance remains only very partially characterized. We describe Yy2 expression studies using RT-PCR and staining with a high-affinity polyclonal serum in mouse embryos and mESC. Although YY2 is expressed during preimplantation development, its presence appears dispensable for developmental progress in vitro until formation of the blastocyst. Attenuation of Yy2 levels failed to alter either Zscan4 levels in two-cell embryos or IAP and MERVL levels at later preimplantation stages. In contrast to previous claims that constitutively expressed shRNA against Yy2 in mESC prohibited the propagation of mESC in culture, we obtained colonies generated from mESC with attenuated Yy2 levels. Concomitant with a decreased number of undifferentiated colonies, Yy2-depleted mESC expressed higher levels of Zscan4 but no differences in the expression of TEs or other pluripotency markers including Sox2, Oct4, Nanog and Esrrb were observed. These results confirm the contribution of Yy2 to the maintenance of mouse embryonic stem cells and show the preimplantation expression of YY2. These functions are discussed in relation to mammalian-specific functions of YY1 and REX1.

Graphical Abstract

1. Introduction

Yin Yang 2 (Yy2) is one of a group of related genes encoding DNA-binding transcription factors that also includes Reduced Expression Protein 1/Zinc Finger Protein 42 (Rex1/Zfp42) [1] and the prototype Yin Yang 1 (Yy1) [2]. YY1 is a well-studied, ubiquitously expressed transcription factor with DNA-binding zinc fingers (reviewed in [3,4]). Dependent on the epigenetic environment and numerous interactions with chromatin regulators, including Polycomb Group complexes [5] and histone-modifying complexes [6], YY1 can function as an activator, repressor, or initiator of gene transcription. YY1 controls the expression of a wide variety of genes, through either classical promoter regulation, or regulation of enhancer–promoter interactions [7]. YY1 also participates in distinct mechanisms potentially related to oncogenesis [4], including increased mutagenesis, DNA repair, and chromosome segregation. Finally, YY1 contributes to silencing of an X chromosome (X chromosome inactivation (XCI)) [8]. YY1 function in XCI is essential for both normal expression of non-coding Tsix and Xist transcripts [9] and physical Xist association with the inactivation center [10].
While Yy1 function has been demonstrated in a variety of tissues and developmental processes, Yy1-loss-of-function in the mouse also has revealed an essential function at the time of embryo implantation [11]. Mammalian embryonic development starts at fertilization, which is followed by formation of the zygote and cleavage divisions. Further development includes the successive generation of the morula and blastocyst, coinciding with the first lineage separation into inner cell mass (ICM) and trophectoderm, which contribute to the embryo and extra-embryonic tissues, respectively. The blastocyst hatches and starts the process of implantation in the uterus. Pluripotent, self-renewing embryonic stem cells (ESC) can be derived from the ICM of the preimplantation blastocyst. Maintenance of mouse ESC (mESC) in vitro depends on the core pluripotency factors Oct4, Nanog, and Sox2 transcription factors, which form a cooperating network of transcription factors including also Esrrb and Rex1/Zfp42 [12], which maintains a pluripotent signaling environment and epigenetic landscape.
The Yy1 paralog Rex1/Zfp42 is prominently expressed in embryonic stem cells and preimplantation embryos [1,13]. Modest levels of expression are also detected during spermatogenesis and early trophectoderm derivatives and placenta in the mouse [14] (Pérez-Palacios, Climent et al., in preparation). REX1 has been identified as a major regulator of Tsix expression [15] and XCI [16]. Depletion of Rex1 in mESC does not affect expression levels of pluripotency-related transcription factors [15]. However, under conditions of Rex1 deficiency, Tsix levels are reduced [15] and murine endogenous retrovirus-like (MERVL) expression [17] is induced, the latter both in mESC and during preimplantation development. MERVL is coregulated with several so-called two-cell stage genes including Zscan4 [18], and there is also some evidence for regulation of Zscan4 during preimplantation development by REX1 [13].
The Yy2 gene most likely originates from a relatively recent retroposition event in an ancestor of placental mammals and evolved very quickly afterwards [19]. Expression of YY2/Yy2 has been shown in most tissues and cell types investigated, including many adult organs [19,20], and in situ hybridization on mouse embryos showed ubiquitous Yy2 expression from the 11.5 days post-coitum stage onwards [21]. Based on the similarity of in vitro binding sites and DNA-binding domains, both redundant and antagonistic functions for YY1 and YY2 have been proposed [22]. However, transcriptomics in depleted HeLa cells showed gene expression alterations specific to either YY1 or YY2 [23], and an analysis of a limited number of YY2 binding sites in mouse trophectoderm stem (TS) cells showed no YY1 binding to these sites in vivo [24]. Recently, identification of target genes by ChIP-Seq assay in mESC [25] showed that the majority of YY2 targets are non-overlapping with YY1 targets [26,27]. Altogether, the combined data support that YY1 and YY2 mostly regulate unique sets of genes. A combination of ChIPseq data and expression data in embryoid bodies (EB) derived from YY2-overexpressing cells suggests a role for YY2 as an activator of transcription in differentiation towards a cardiovascular lineage [25]. In mESC, Yy2 expression levels are controlled by splicing-dependent differential translation. The resulting stringent regulation of Yy2 expression levels is critical for proper mESC self-renewal and lineage commitment [25].
Repeat DNA and transposable elements (TEs) including endogenous retroviruses (ERVs) occupy >50% of mammalian genomes [28,29]. While they contribute to biological processes, their expression is generally considered deleterious to normal physiology and genome integrity [30,31]. Specific TEs including LINE, Intracisternal A-particle (IAP), and MERVL are expressed in a stage-specific pattern in both human and mouse preimplantation embryos [31,32]. Altering normal levels of either LINE-1 [33] or MERVL-containing transcripts [34] during preimplantation stages interferes with normal developmental progress, probably as a result of altered chromatin accessibility [35]. The expression of MERVL in mESC is associated with expanded potency, attributed to so-called two-cell-like cells [32,36]. While sequences related to the YY1-binding motif element are enriched at LINE, IAP, and MERVL elements, and YY2 binding has been reported [24,28], the extent to which YY1 or its paralog YY2 contribute to this regulation during preimplantation development and in mESC has not been extensively studied.
Despite the presence of both YY1 and REX1 in preimplantation embryos [1,13], neither the presence of YY2 at preimplantation stages nor a functional role for Yy2 at stages before blastocyst outgrowth/implantation has been previously addressed. This functional role may reside in the regulation of either Zscan4 [18], as described for REX1 [13], or transposable elements. YY2 binding to the latter has been reported in mESC [24] and TS cells [17], especially to MERVL and IAP. However, as opposed to the regulation of these elements by REX1 in early embryonic stages [17], similar regulation by YY2 has not been previously addressed. It was previously shown that propagation of mESC requires Yy2 [25]. However, in the absence of viable Yy2-deprived cells, gene expression analysis in mESCs with attenuated Yy2 levels was very limited and did not define the role of Yy2 in ES self-renewal and pluripotency. Therefore, while YY2 binding sites in mESC were identified, results on the potential deregulation of pluripotency genes were mostly derived from YY2 overexpression studies. Moreover, deregulation of transposable elements in mESC as a function of Yy2 levels was not addressed at all [25].
In the present manuscript, we first set out to show the presence of YY2 in preimplantation embryos from zygote onwards. Once its presence was established, we addressed both whether attenuation of Yy2 levels might alter preimplantation development in vitro and the possibility that a lack of YY2 may deregulate the expression of co-regulated Zscan4 and MERVL, as well as IAP elements. Furthermore, in an independent effort to confirm and analyze Yy2 function in mESC, we studied mESC with attenuated Yy2 levels. For the first time, we addressed both colony formation capacities and pluripotency-associated gene expression in these cells. Finally, we were then able to test whether YY2 binding to MERVL and IAP elements in ES cells is translated into deregulation of such elements in the absence of YY2.

2. Materials and Methods

2.1. Oocyte and Embryo Collection and In Vitro Culture

Oocyte and embryo collection were performed according to standard procedures [37]. Four- to six-week-old females were superovulated by an intraperitoneal (i.p.) injection of pregnant mare serum gonadotropin (PMSG, 5 IU) followed by human chorionic gonadotropin (hCG; 7.5 IU) 48 h later. Fertilized eggs were harvested at 20 h post-hCG in M2 media (Sigma-Aldrich, Ref. M7167, St. Louis, MO, USA. Cumulus cells were removed by thorough pipetting in M2 media containing hyaluronidase. Good-quality zygotes were thoroughly washed three times in clean dishes containing M2 media and KSOM (Embryomax®; Millipore, Ref. MR-020P, Burlington, MA, USA, and cultured in vitro in KSOM at 37 °C, 5% CO2, 90% relative humidity.
All procedures were carried out under Project License PI29/08, approved by the in-house Ethic Committee for Animal Experiments from the University of Zaragoza. The care and use of animals were performed according to the Spanish Policy for Animal Protection RD1201/05, which meets the European Union Directive 86/609 on the protection of animals used for experimental and other scientific purposes.

2.2. Immunofluorescence and Confocal Microscopy

Mouse embryos (CD-1, Charles River, Lyon, France) for immunostaining were obtained from natural matings using standard methods. Immunostaining and confocal microscopy were routinely performed as previously described [13,38,39], with minor modifications. Briefly, mouse embryos from natural matings at the indicated stage were washed in PBS for 5 min, fixed at room temperature (RT) for 20 min in 2.5% paraformaldehyde in PBS (pH 7.4), and permeabilized with 0.2% Triton-X100 in PBS for 20 min at RT. Embryos were then blocked/permeabilized in PBS/0.2% Triton-X100/10% FBS for 1 h at RT. All the following incubations and washes were performed in PBS/0.2%Tx100/2% FBS (PTF). Fixed and permeabilized embryos were then incubated overnight (o.n.) at 4 °C with primary antibodies. Anti-YY2 antibody was used at (1:4800) dilution. Embryos were washed three times for 15 min and incubated with anti-rabbit biotin (1:150) secondary antibody for 1h at RT. Embryos were washed three times for 15 min and incubated with streptavidin-488 (1:400) for 1h at RT, followed by three washing steps in the dark. Nuclei were counterstained with DAPI (10 μg/mL) in PBS for 20 min. Embryos were mounted in glycerol/DABCO 2.5%/Tris pH8.6 (DTG). Negative controls were performed using the same procedure without the addition of primary antibody. Confocal sections were obtained using an Olympus confocal microscope Fluoview FV1000 with 40X objective (Olympus Europe, Hamburg, Germany). Images were pseudocolored as follows: YY2 in green and DAPI in blue (cell nuclei).

2.3. Immunological Reagents and Western Blot

A rabbit antiserum raised in house against a GST-YY2Δ protein (amino acids 1 to 173) and IgG-purified according to standard methods has been described in detail elsewhere [24]. To prove specificity for YY2, the serum has previously been tested in Western blot and immunoprecipitation assays, comparing HA-tagged YY2 with HA-tagged YY1 in 293T cells (Figure S3 in [24]). The experiments demonstrated that this antibody is specific for YY2, showing also absence of binding to YY1, absence of IF staining in non-transfected 293T cells, and absence of cross-reaction with YY1 in transfected 293T cells. Monoclonal α-HA (clone HA-7) was obtained as an unpurified ascites fraction (Sigma H9658). Preparation of cell lysates, separation by SDS-PAGE, and Western blot were carried out as described [17]; equivalent loading in each lane is demonstrated by reprobing the membrane with an αTUBULIN antibody.

2.4. Embryo Microinjection with siRNAs

Zygotes were collected from superovulated B6D2F1/J females mated to B6D2F1/J males (Charles River, Lyon, France) at 20 h post-hCG (defined as Day 1), maintained in M2 media, and microinjected into the cytoplasm with siRNA duplexes (100 μM). Gene-specific StealthTM siRNA duplexes were purchased from Invitrogen and prepared as described [13]. Sequences are listed in Table S2; Stealth™ RNAi Negative Control Med GC (Life Technologies Corporation, Ref. 12935300, Carlsbad, CA, USA) was used as a control.
Texas Red detection was used to monitor siRNA microinjections. Degenerated embryos were removed both immediately after injection and 18 h after. The number of embryos and their developmental stage (e.g., number of cells) were evaluated daily. Images were captured using a Leica DFC360Fx camera adapted to a Leica M165FC stereomicroscope (Leica Microsystems AG, Heerbrugg, Switzerland) using Leica Application Suite 3.2.0 (Leica Microsystems Ltd., Heerbrugg, Switzerland). For subsequent gene expression analysis, embryos were harvested at the indicated morphology in TRIzol® (Life Technologies Corporation, Carlsbad, CA, USA), flash-frozen, and stored at −80 °C.

2.5. Gene Expression in Preimplantation Embryos

Embryos were harvested at 1-cell, 2-cell, 4-cell, 8-cell, morula, blastocyst, and late blastocyst stage, at 20, 43, 55, 66, 80, 92 h post-hCG, and at embryonic day 4.5, respectively. Oocytes were collected at 14 h post-hCG from unmated females. An identical number of experimental and control oocytes or embryos from the same experiment (generally 8 to 10 embryos) were pooled and homogenized in 100 μL TRIzol®. Total RNA from embryos was purified by a two-round extraction protocol. RNA was firstly isolated from TRIzol® by chloroform extraction, ethanol precipitation using glycogen (Roche, Basel, Switzerland) as a carrier, pelleted by centrifugation, and re-suspended in DEPC-treated water. RNA was further DNAse-treated with RQ1 RNase-free DNase (Promega), phenol extracted, re-precipitated with ethanol, and re-suspended in DEPC-treated water. Reverse transcription of purified RNA was performed using the ThermoScript® RT-PCR System (Life Technologies Corporation, Carlsbad, CA, USA) with random hexamer primers. cDNA from one to two oocyte or embryo equivalents were used as a template for each PCR reaction, and amplified using the following PCR program: 35 cycles of denaturation at 94 °C for 30 s, 30 s of annealing and 1 min extension at 72 °C; and a final 5 min extension. PCR products were visualized using ethidium bromide and photographed on a Gel Doc transilluminator (BIO-RAD, BIO-RAD Laboratories, Segrate, Milan, Italy). Primers are listed in Table S2.

2.6. Cell Culture, shRNA Knockdown, and RT-qPCR Analysis

Procedures for tissue culture of mESC line E14T [40], colony formation assays after shRNA-mediated knockdown, and RT-qPCR analysis were carried out as described previously [17]. mESC were cultured in in the presence of 10% fetal calf serum, leukemia inhibitory factor (LIF), and 2i as described [41], on gelatin-coated tissue culture dishes. Vectors used for the episomal expression of short hairpin RNAs (shRNAs) [17] contained sequences for episomal maintenance, PGKHygro, a H1 promoter [42], and short hairpin sequences, which were designed using specialized software [43]. Two different sequences were inserted: 5′ CAATACCACTCTCCTGTTATT as sh1Yy2; 5′ GTAGTAGAGATCATGATAA as sh2Yy2; a GFP sequence was used as a control: 5′ AAGCGCGATCACATGGTCCTG.
For the subsequent evaluation of colony formation assays (colony numbers, protein extraction, and RNA extraction), colonies grown in the presence of selective agent for 7 days were carefully washed twice with ice-cold PBS (avoiding colony cell loss). For colony numbers and self-renewal analyses, cell colonies were fixed at 4 °C in 80% ethanol. Posterior analysis included staining for alkaline phosphatase (AP) (Sigma-Aldrich, Ref. 85L3R, St. Louis, MO, USA) and counting of colonies (Nikon Diaphot Inverted Tissue Culture Microscope, (Nikon Corporation, Tokio, Japan)). For each condition, ten fields of predetermined size were counted; colony numbers of three independent experiments are represented as mean ± standard deviation. Pearson’s chi-squared test was subsequently used to determine whether the difference between the frequencies observed after treatment with each shRNA were statistically significant. Alternatively, cells were directly harvested in TRIzol® or in protein lysis buffer for further gene expression (RT-qPCR) and protein level (Western blot) analyses.
Attenuation of Yy2 levels with a third hairpin (5′ TTCAGTCCTGAATTTGGAAGC named sh3Yy2) was studied after transient transfection. The construct contained a CAGG-driven EGFP and an H1 promoter for expression of hairpin RNA. Two days after transfection, cells were sorted to separate GFP+ from GFP- cells, which were subsequently lysed in TRIzol® for posterior gene expression analysis.
Gene expression was analyzed by quantitative PCR; all primers are listed in Table S2. Expression levels were normalized to Gapdh as a reference gene and depicted as fold expression (2−∆∆Ct) [44] relative to mESC-expressing shControl RNAs. The origin and specificity of TE primers has been amply discussed [17]. Statistical analyses were performed using GraphPad software (San Diego, California USA, software version 9.0.2. for MacOS).

3. Results

3.1. Expression of YY2 during Preimplantation Development

A publicly available database of expressed-sequence tags (ESTs) (Unigene database) was searched for ESTs encoding Yy2. While ESTs for diverse adult body parts including bone marrow, bone, lung, mammary gland, skin, spleen, testis, and thymus were listed in the database, no pancreas, eye, or intestine-derived ESTs have been reported. We also found that among 31 cDNA Yy2 clones described, no EST was detected in oocytes or embryos at the zygotic stage, but several originated from libraries of embryos at cleavage, morula, and blastocyst stages (Figure S1). This in silico analysis indicates that Yy2 is expressed during embryonic preimplantation development.
To experimentally confirm the expression patterns of Yy2 during early development, we performed RT-PCR analysis of pooled oocytes and embryos at preimplantation stages. Yy2 mRNA was detected in oocytes and early embryos at all developmental stages (Figure 1A). Surprisingly, in contrast with the in silico prediction, Yy2 was expressed in oocytes and zygotes, although its levels of expression were lower than in blastocysts (Figure 1A, Figure S1B). From the two-cell stage onwards, Yy2 mRNA levels gradually increased, reaching peak levels in the late blastocyst.
To study the temporal and spatial expression pattern of the YY2 protein, we performed indirect immunofluorescence analyses using an affinity-purified polyclonal serum, raised against the aminoterminus of YY2 [24]. The specificity of this serum for YY2 has been extensively confirmed previously; see Materials and Methods for a full description of relevant data. In accordance with the presence of Yy2 transcripts (Figure 1A), immunostaining revealed YY2 expression at all preimplantation stages tested, showing a more prominent staining in two-cell embryos, which may correspond to either increased protein levels or nuclear clustering (Figure 1B). Starting at the one-cell stage until the blastocyst stage, anti-YY2 immunoreactivity was detected in all cells, although dynamic subcellular localization patterns were evident. YY2 staining was detected in the nucleus at all embryonic stages analyzed, although some potential cytoplasmic localization might be observed in embryonic cells and metaphase II (MII) oocytes above the antibody unspecific background (Figure 1B,C). In embryonic day 3.5 (E3.5) blastocysts (Figure 1B), YY2 showed a mixed perinuclear–cytoplasmic localization pattern in the ICM compartment, while nuclear staining was observed in cells within the trophectoderm. YY2 staining became progressively more nuclear in trophectoderm cells at the late blastocyst stage. YY2 showed dynamic levels of expression during preimplantation, with apparent fluctuations in expression level and intracellular localization.

3.2. In Vitro Development of Yy2 Depleted Embryos

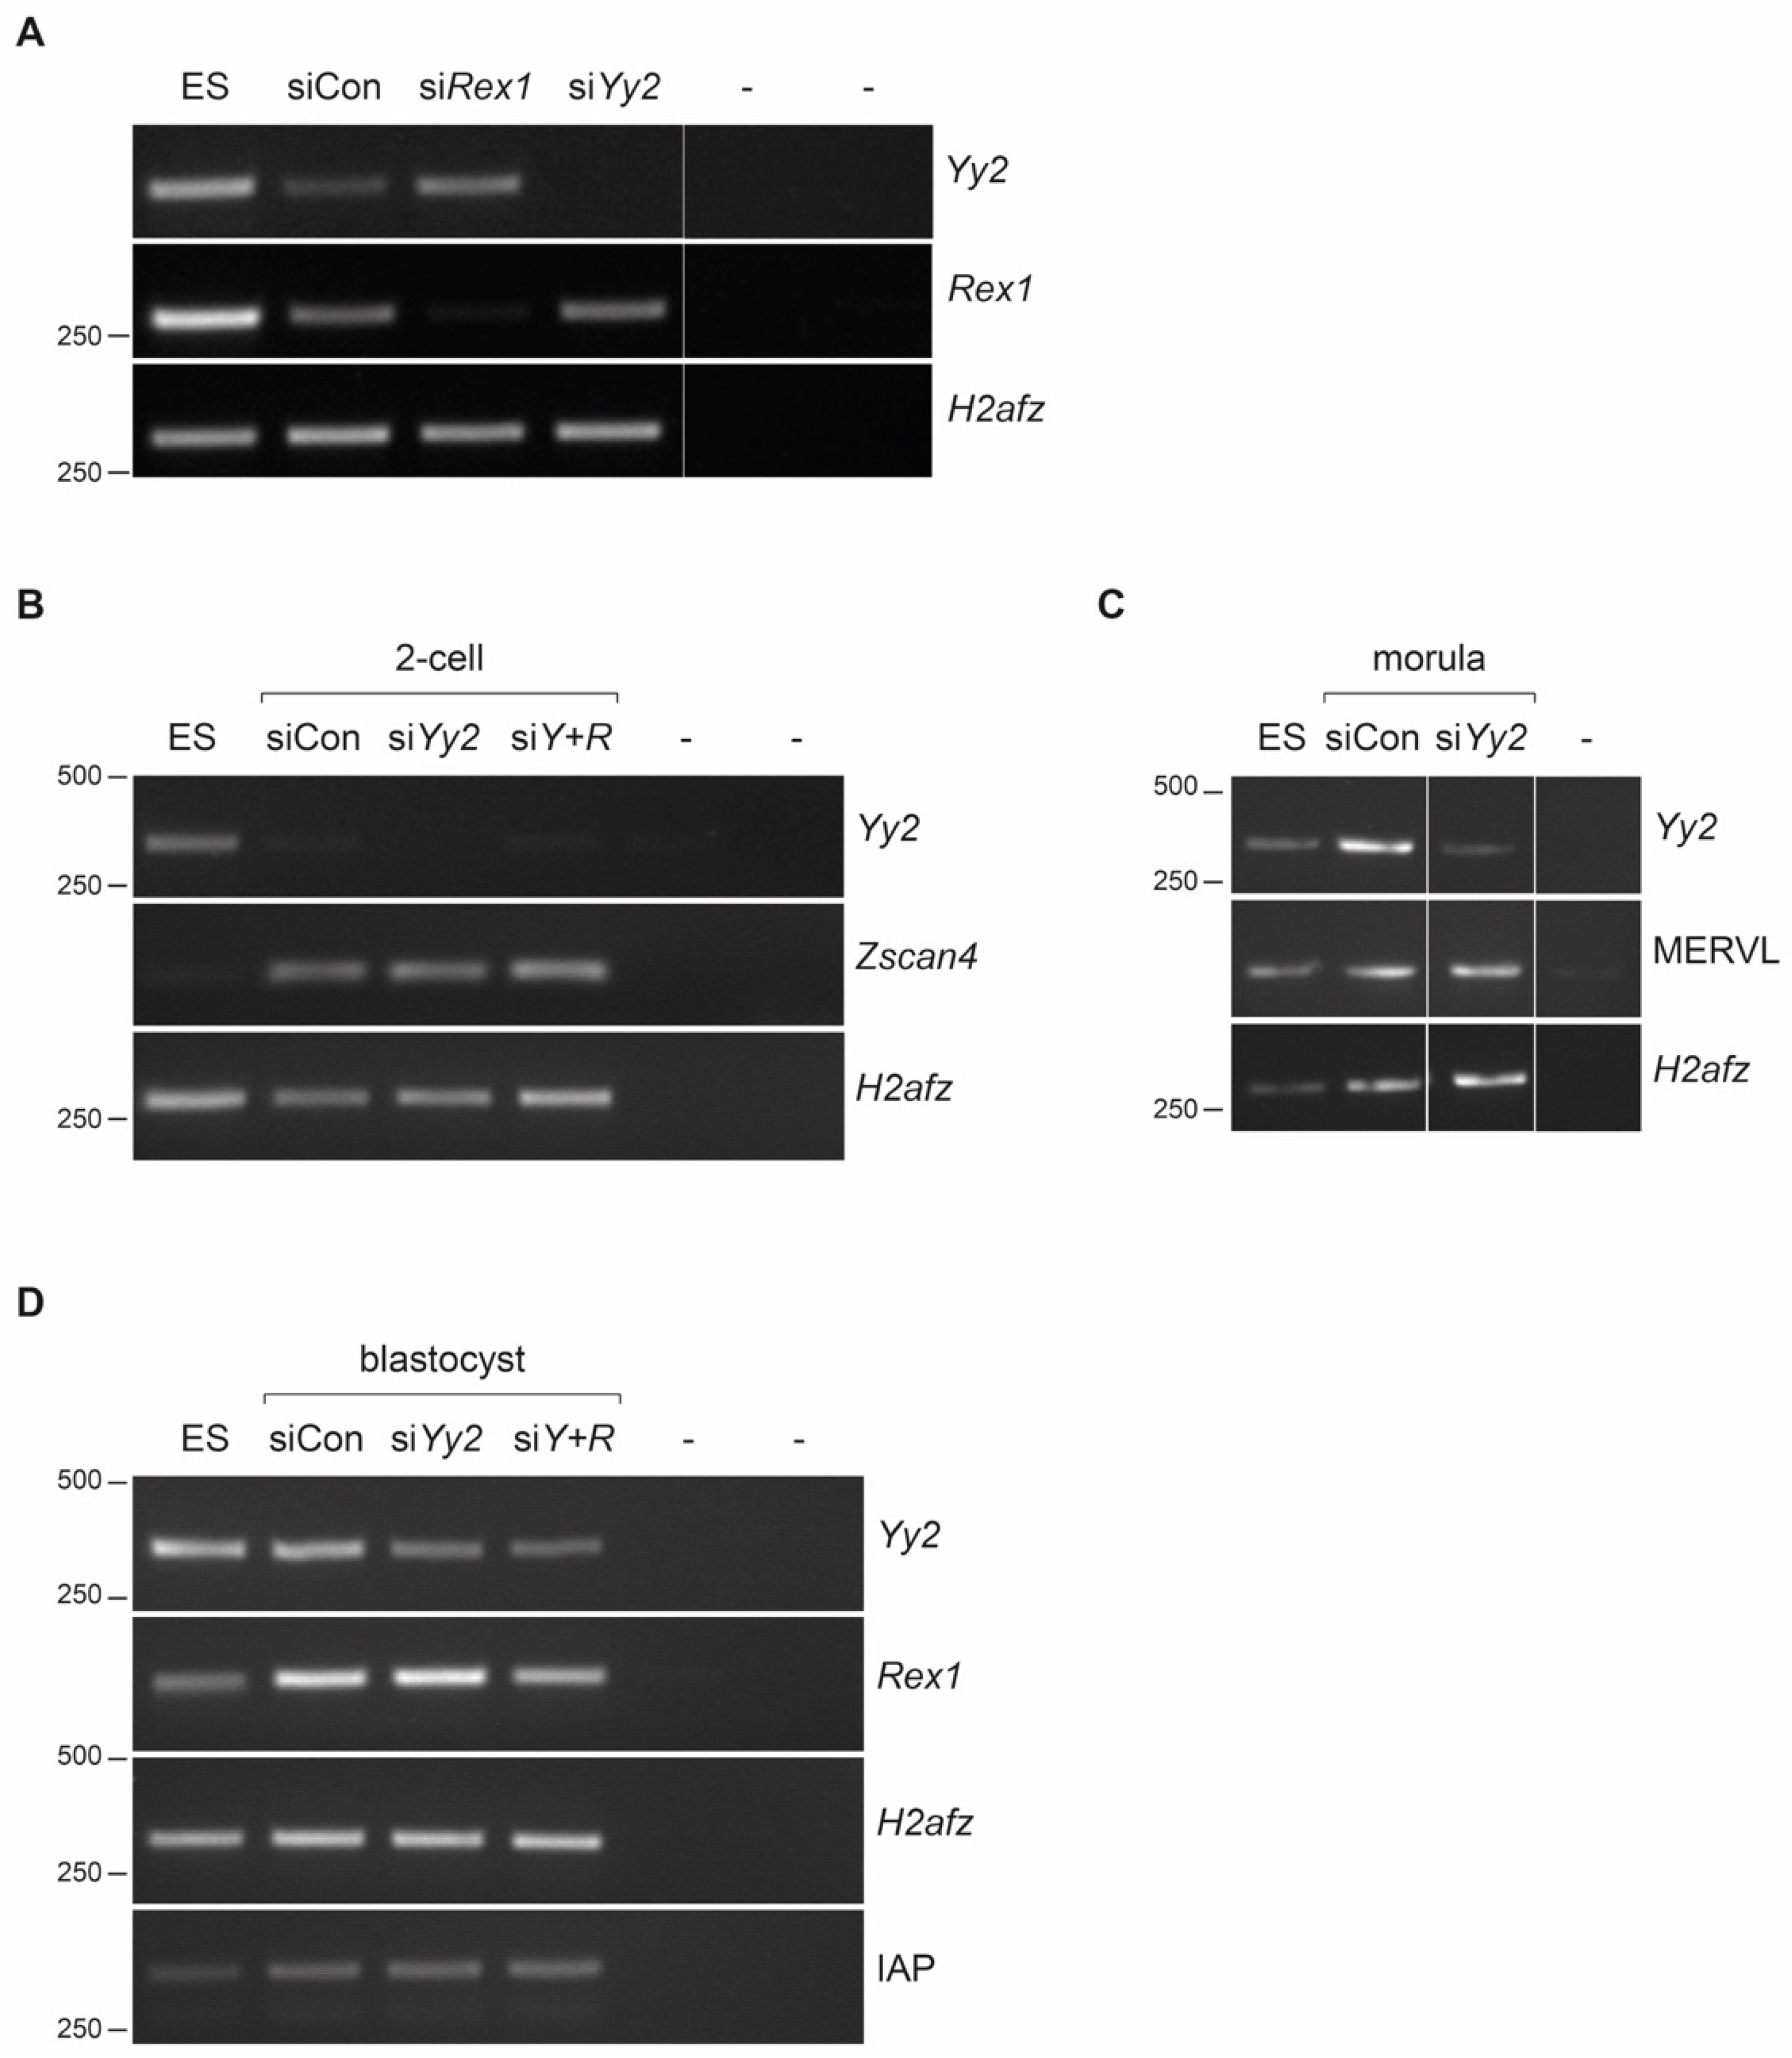
To attenuate Yy2 expression during preimplantation development, we designed siRNAs (StealthTM RNAs; see Materials and Methods). The efficiency of siRNAs was tested by co-transfection with HA-YY2 in 293T cells. Expression of HA-YY2 was abolished by co-transfection of S5 Stealth RNAs and, to a much lesser degree, by S6 Stealth RNAs, but not by control siRNAs (Figure S2A). Efficiency of these Yy2 S5 Stealth RNAs (siYy2 hereafter) and siRNA against Rex1 (siRex1) in mouse embryos was assessed after injection of one-cell embryos. Yy2 and Rex1 mRNA levels were monitored in injected embryos at the morula stage. Expression of Rex1 was severely suppressed in the siRex1-injected embryos (Figure 2A). The converse was true in siYy2-injected embryos, which displayed unaltered levels of Rex1 and attenuated levels of Yy2. No changes were detected in the expression of the H2afz gene, used as a control.
In order to examine whether transient depletion of Yy2 affected early embryonic development, one-cell embryos were collected and injected with control siRNAs (nonsense oligonucleotides) or with siYy2 and cultured in vitro. Similar numbers of embryos were injected with either Yy2 or control siRNAs in each experiment, and successful injection was visualized using co-injected Texas Red (Figure S2B). Two-cell embryos were selected for further culture and developmental progress was examined daily. After injection of 104 and 114 embryos in total (siControl and siYy2, respectively) on three independent experiments, we were unable to observe differences in developmental progress between embryos injected with control siRNAs or siRNAs directed against Yy2 (Table 1, Table S1). Control and siYy2-injected embryos developed into two-cell embryos (100 and 99.1%, respectively; day 2), 5–8-cell embryos (88 and 82.2%, respectively; day 3), morulae (90 and 93%, respectively; day 4), and blastocysts (80.8 and 76.3%, respectively; day 5) with equal efficiency (Table 1, Figure S2B). No statistically significant differences were found between the two groups at the stages analyzed.
Given the absence of a phenotype in Yy2-depleted embryos, we addressed the effect of simultaneous depletion of both Yy2 and Rex1. Similar injection experiments were performed, resulting in no significant developmental defects or delays (Supplementary Table S1). Similar to control embryos, the doubly depleted embryos developed with high efficiency into 5–8-cell embryos (95%), morulae (92%), and blastocyst stages (82%) on consecutive days.

3.3. Yy2 Loss-of-Function Mouse Embryos Express Normal Levels of ERV Elements

We assayed the gene expression of the embryo-specific gene Zscan4 and selected transposable elements by RT-PCR at different developmental stages, in embryos with attenuated Yy2 levels, which were generated using siRNAs as described above. While weak but detectable expression of Yy2 in two-cell embryos seemed slightly attenuated by the siRNAs (Figure 2B), we could not detect differences in the levels of Zscan4 expression. Additionally, under these conditions, neither MERVL expression at the morula stage (Figure 2C) nor the blastocyst-specific expression of IAP elements was altered (Figure 2D). IAP expression was also not affected in Yy2+Rex1 doubly depleted embryos at the blastocyst stage. Altogether, we found no evidence for altered gene expression as a result of Yy2 depletion in preimplantation embryos.

3.4. Depletion of Yy2 Expression Alters Self-Renewal in Mouse ES Cells

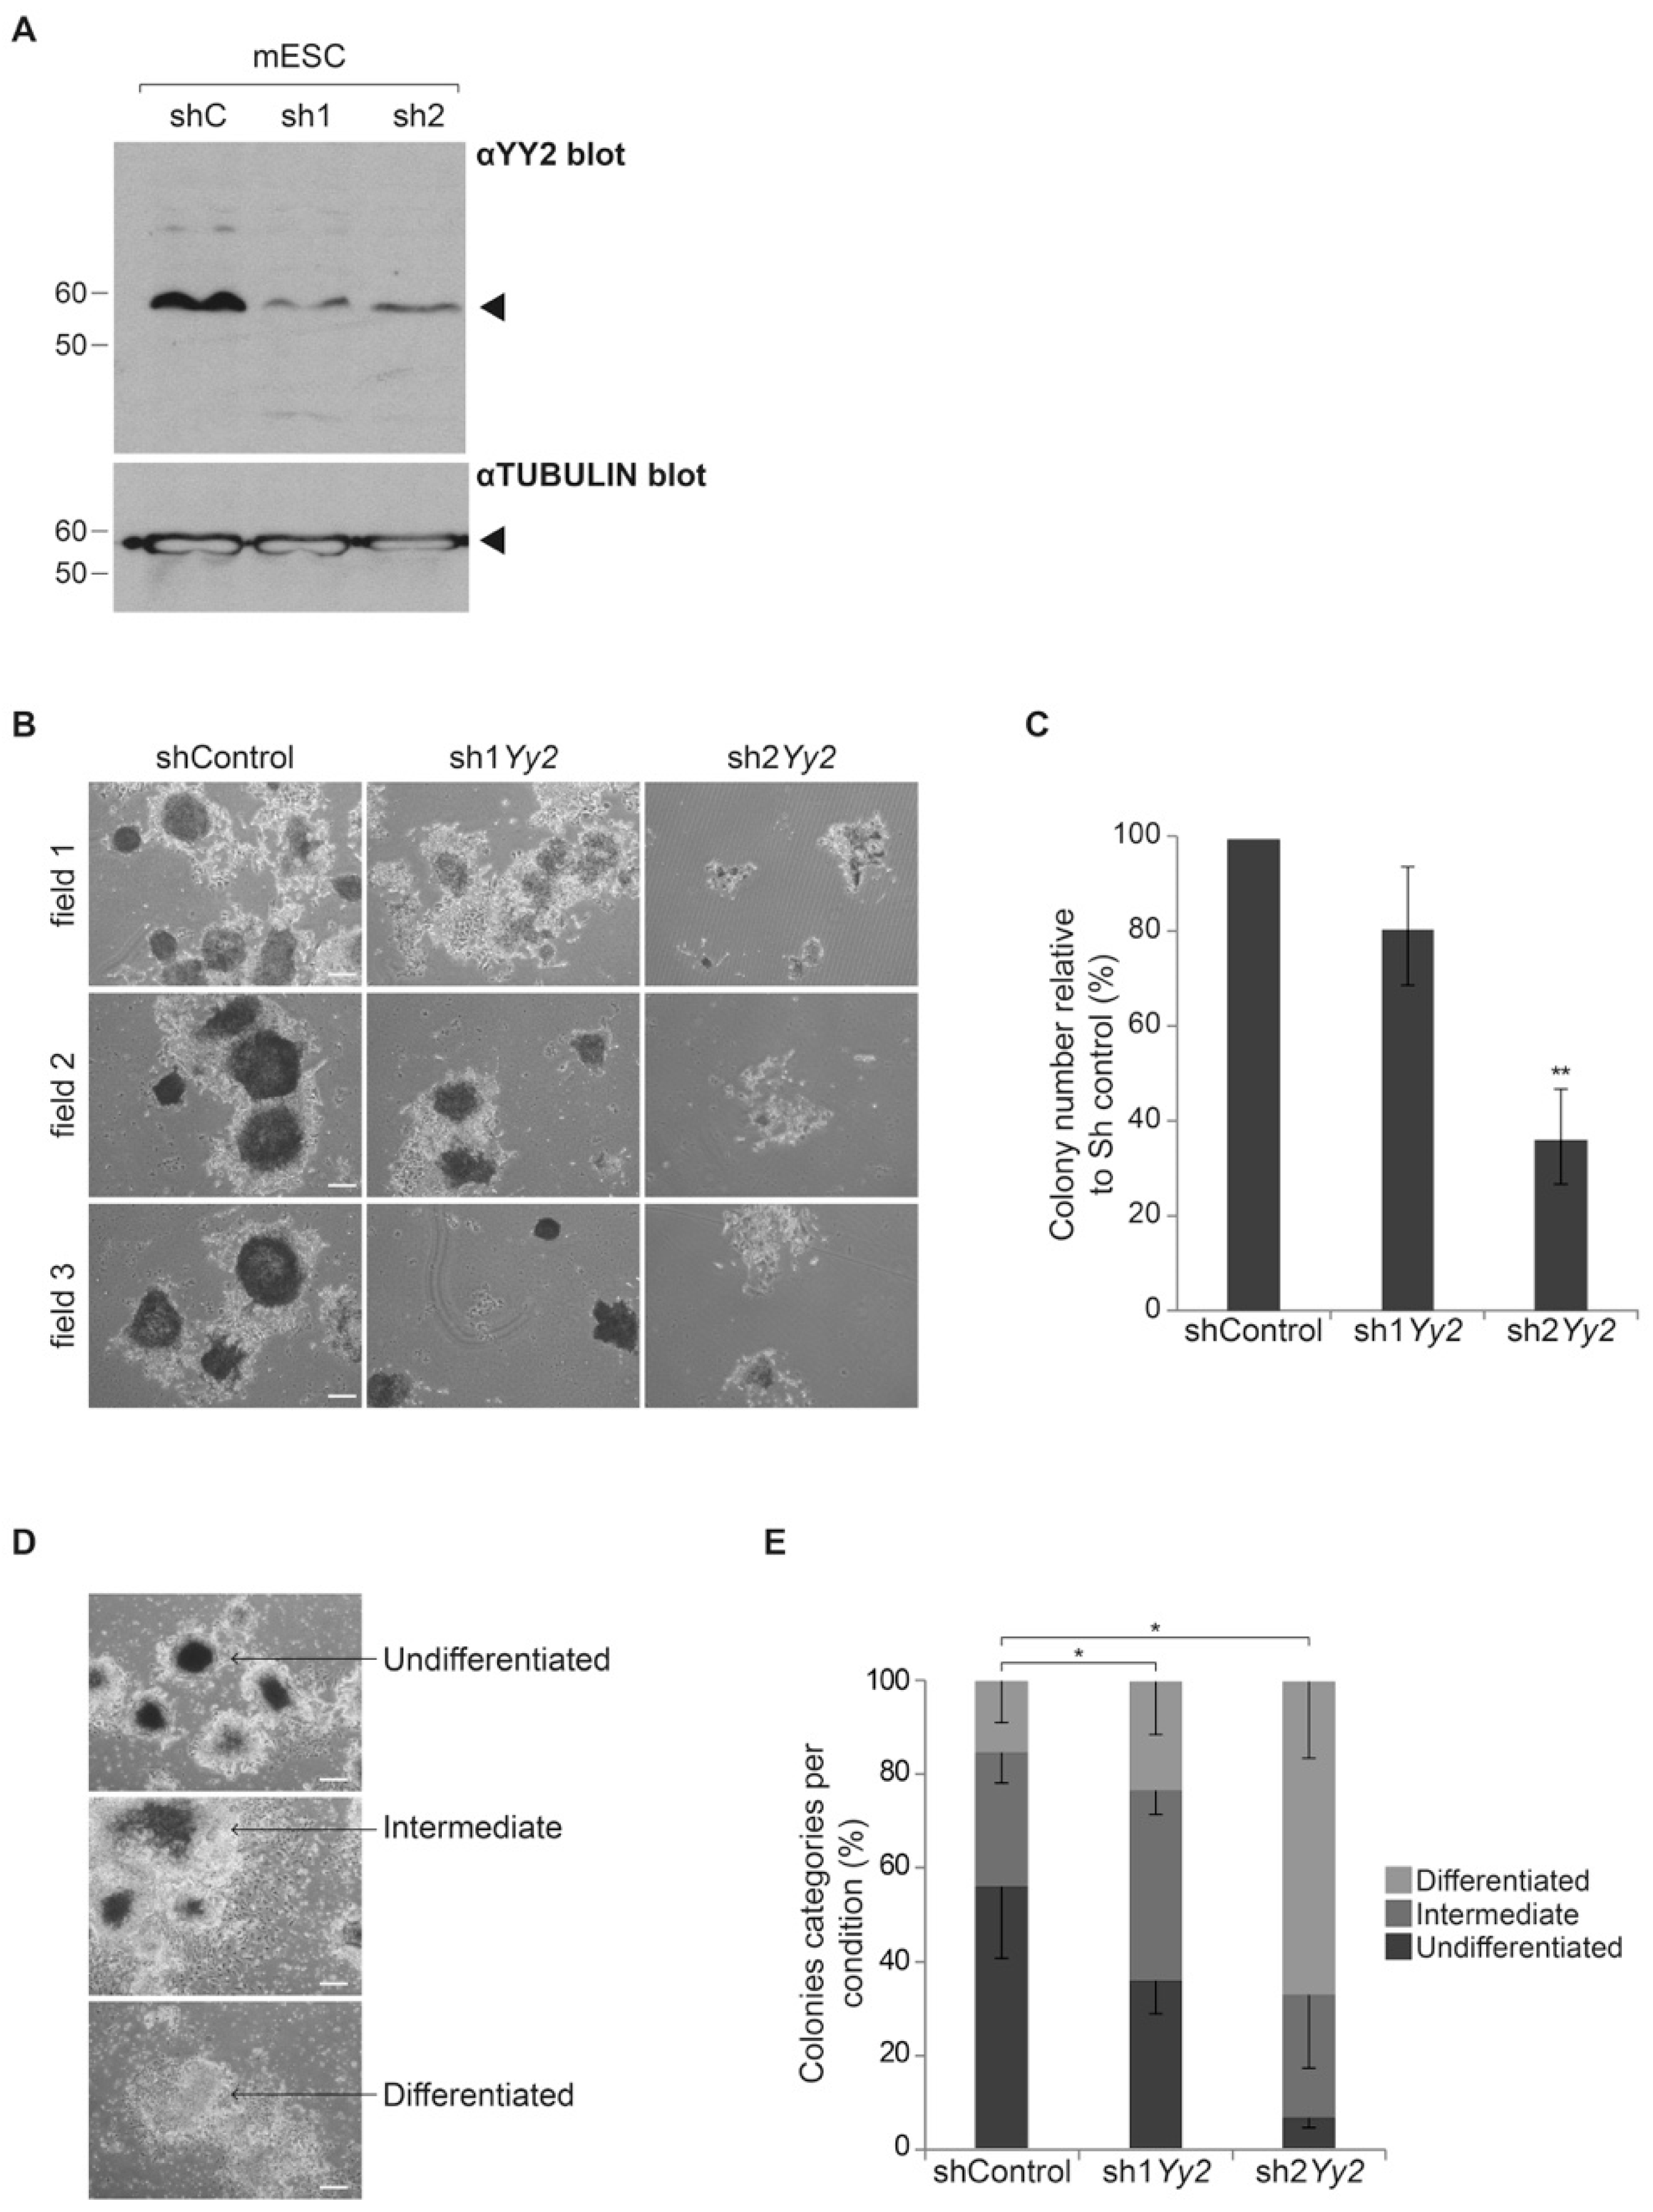
To attenuate Yy2 expression in mESC, we designed two hairpin constructs, termed Sh1Yy2 and Sh2Yy2. YY2 protein levels in mESC were severely reduced in cultures over-expressing either hairpin RNA, as opposed to cells expressing the control shRNA (Figure 3A). We subsequently investigated Yy2 function in mESC by using stable episomal expression of these shRNAs. Cells were electroporated and selected for expression of Hygromicine resistance co-carried on the shRNA plasmids, seeded at clonal densities, and colony formation was analyzed as a measure of self-renewal. Cells expressing shRNAs targeting Yy2 formed fewer colonies compared to cells electroporated with control shRNAs (Figure 3B), accounting for 81% and 37% of the total number of colonies in Sh1Yy2 and Sh2Yy2 conditions, respectively, relative to the total number of colonies in shControl (Figure 3C). ES colonies were classified into three different categories based on morphology and alkaline phosphatase (AP) staining: undifferentiated—colonies with smooth edges and rounded shape, limited presence of differentiated cells and strong AP positive staining; intermediate colonies—those with irregular edges, considerable number of differentiated cells, and faint AP staining; and differentiated colonies—with no AP positive staining. Colony morphology was affected by Yy2 depletion, as the number of undifferentiated colonies diminished 1.5- and 8.8-fold in colonies expressing sh1Yy2 and sh2Yy2, respectively (Figure 3D). In contrast, the percentage of colonies with either an intermediate or differentiated morphology increased in both conditions (3- and 7.3-fold for sh1Yy2 and sh2Yy2, respectively (Figure 3D)). The observed difference in colony morphology was significant between control and both sh1Yy2 (X2 = 106.64, df = 2, p-value < 0.05) and sh2Yy2 (X2 = 604.9, df = 2, p-value < 0.001). Altogether, these data show that reduced expression of Yy2 was coincident with reduced self-renewal in mESC.

3.5. Gene Expression in Yy2-Depleted ES Cells

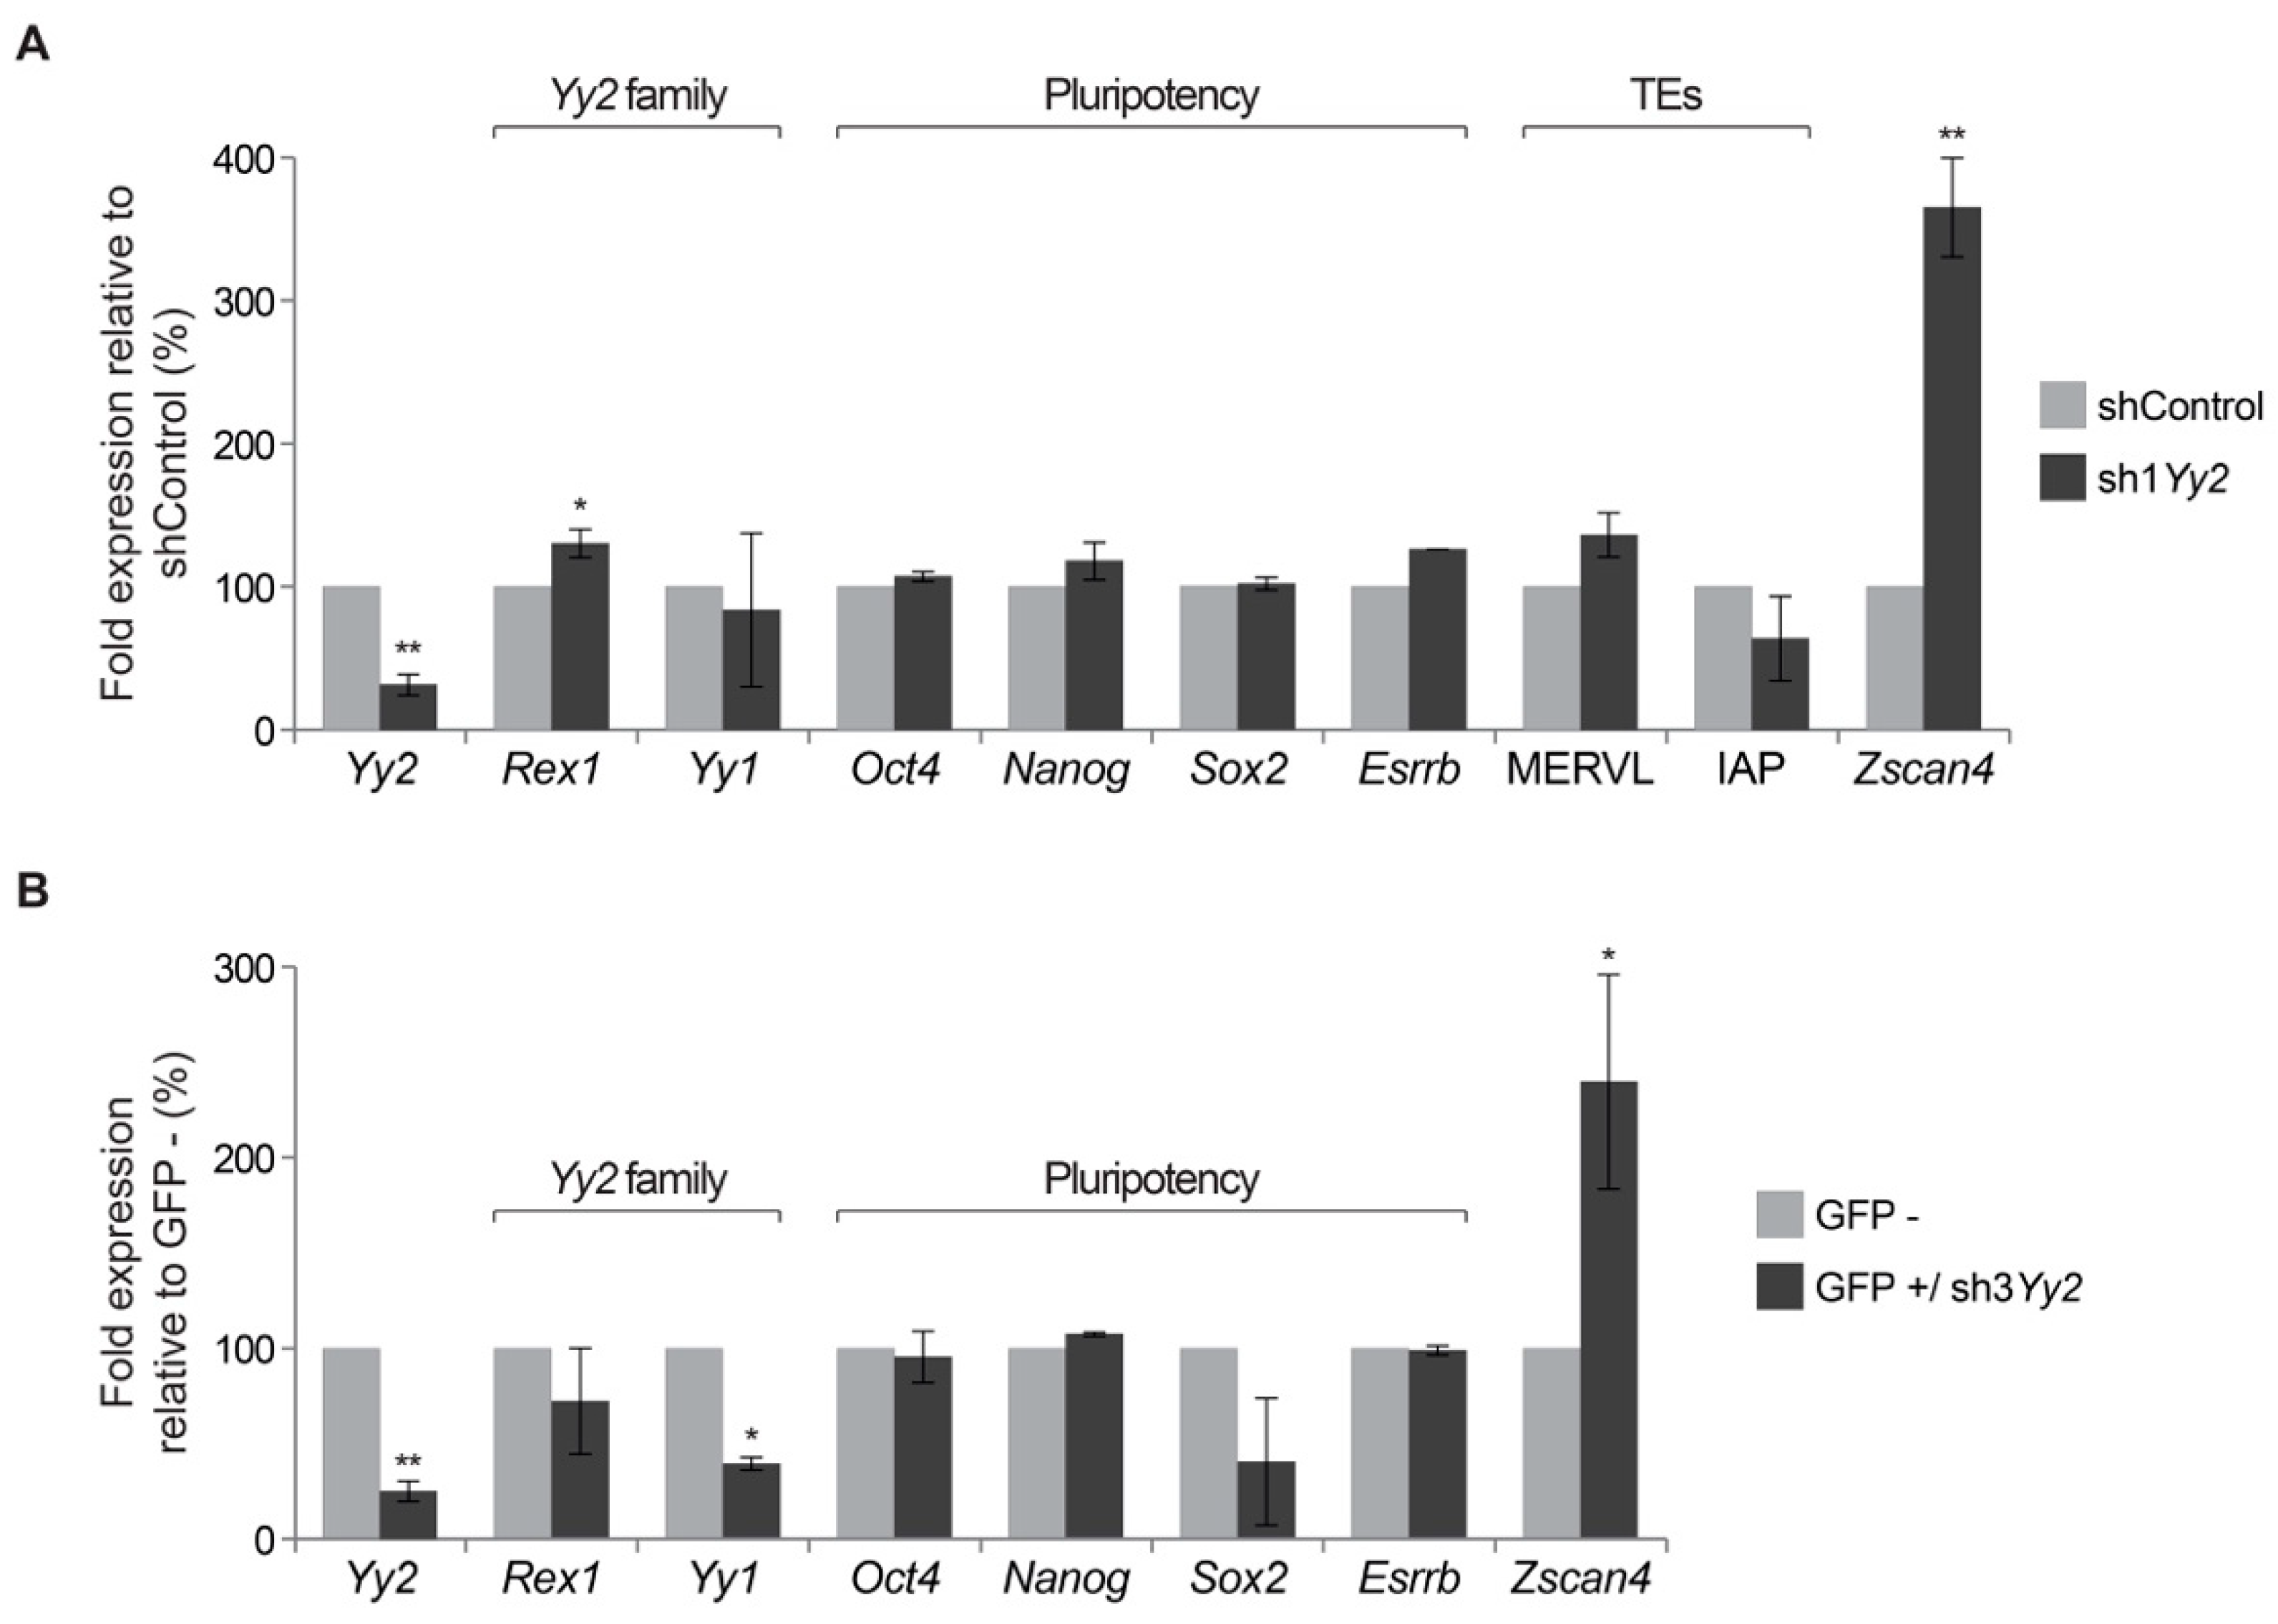
To further understand the molecular changes associated with the depletion of YY2 in mESC, we extracted RNA from Yy2-depleted colonies (and controls) and performed RT-qPCR gene expression analyses. We first compared the expression levels of pluripotency factors in the colonies analyzed, to mESCs obtained from regular culture. Results (Figure S3) indicate that the control colonies (shControl) express levels of core pluripotency factors comparable to mESC. We therefore assume that the cells making up these colonies can be considered mostly undifferentiated as expected, although some differentiation is apparent in the colonies after 7 days of culture (Figure 3B). We then analyzed whether changes in the levels of Yy2 (Figure 4A) could affect the expression of other members of the transcription factor family. In Yy2-depleted cells, Rex1 levels appeared slightly but significantly increased (p-value ≤ 0.05), while Yy1 levels were not changed, although a trend of downregulation and some variability was observed between independent experiments (Figure 4A). We next measured the expression of several pluripotency markers and no significant differences of expression were detected for Oct4/Pou5f1, Sox2, Nanog, and Esrrb mRNAs as a result of attenuation of Yy2 levels (Figure 4A, Figure S3A). Using primers that amplify regions conserved among several copies of transposable elements, we did not detect significant differences in the expression levels of either MERVL or IAP (Figure 4A). We finally investigated the expression of Zscan4 in Yy2-depleted cells. We detected a significant induction of Zscan4 levels in Yy2-depleted cells as opposed to control cells (3.6-fold change, p-value ≤ 0.01, Figure 4A).
To validate these results, we transfected mESCs with an shRNA against Yy2 containing an EGFP cassette (sh3Yy2) and compared the levels of gene expression of GFP-expressing (GFP+) versus GFP-non-expressing (GFP-) cells by RT-qPCR. As expected, GFP + sorted cells had lower levels of Yy2 compared to GFP-cells (Figure 4B). Similarly to the results obtained in the previous approach, Yy2 family members were somewhat affected in Yy2-depleted cells GFP + cells. While no significant changes were observed for Rex1, Yy1 mRNA levels were significantly downregulated. Consistent with the results shown in Figure 4A, no significant changes in gene expression levels were detected in the pluripotency markers analyzed (Oct4/Pou5f1, Sox2, Nanog, and Esrrb), although the level of Sox2 trended downwards. As before, the Yy2-depleted GFP + cells showed a 2.4-fold increase in Zscan4 levels compared to GFP- cells (Figure 4B). From the combined experiments, we conclude that YY2 contributes to the regulation of Zscan4 levels in mESC.

4. Discussion

The data on YY2/Yy2 expression in time and space are by no means complete. We had previously shown that YY2 protein is expressed in mouse ES and TS cells [24]. We now report the presence of Yy2 mRNA and protein starting in oocytes and in preimplantation embryos at all stages. We show that YY2 is present during all stages of preimplantation development, and dynamically localized between the nucleus and cytoplasm. As opposed to a steady and gradually increasing expression of Yy2 throughout preimplantation development, we detected apparently higher levels of YY2 specifically at the two-cell stage, showing clear nuclear expression above the cytoplasmic staining. This pattern may be indicative of a potential clustering of YY2 protein (and associated functional relevance at these particular stages) or directly result from higher expression levels. The latter case is compatible with a non-linear relationship between mRNA and protein levels described in mESC [25]. While knockdown of Yy2 mRNA was clearly achieved, development until blastocyst under these conditions proceeded in the absence of temporal or morphological alterations. While depletion of Yy2 has been shown to interfere with blastocyst outgrowth [25], we find no evidence for an earlier role in vivo according to morphological and viability criteria. However, more subtle defects cannot be ruled out and defects may have been further masked by the continued presence of protein from maternal deposits (see the presence of Yy2 mRNA and YY2 protein in the oocyte, Figure 1). Furthermore, implantation and posterior development of either the embryos or extra-embryonic tissues is likely to depend on YY2, as Yy2 depletion interferes with blastocyst outgrowth in vitro [25]. The continued presence of Yy2 mRNA and protein during preimplantation embryos at all stages overlaps with the YY1 transcription factor [45] and ZFP42/REX1 [13]. As Yy1 and Rex1 contribute to mammalian-specific processes such as regulation of transposable elements and XCI, contributions of Yy2 to these processes may still be envisaged.
YY2 shares homology in the DNA-binding zinc fingers with both YY1 and ZFP42/REX1. Despite a high degree of homology in the DNA-binding domain between YY1 and YY2, target genes for both genes are mostly unique to either of them [24,25], although some overlap exists [23,25]. Certainly, overlap exists to some extent in YY1 and YY2 binding to specific TE [17,46] and YY2 associates with MERVL and IAP elements in mESC [24]. In contrast to previously reported regulation of IAP and MERVL elements by YY1 [46] and REX1 [17], respectively, we were unable to detect altered expression of these elements in mouse embryos or mESC with attenuated levels of Yy2. However, similar to YY1, YY2 may interact with the TRIM28-mediated silencing machinery through LSD1 [18,32]. Therefore, Yy2 may regulate the expression of other TEs, at stages not investigated, or be supplanted by YY1 or REX1 in its absence.
It was previously shown that propagation of mESC requires Yy2 [25]. However, in the absence of viable Yy2-deprived cells, data presented in this report did not define the role of Yy2 in ES self-renewal and pluripotency. Careful titration of selective agent and the use of episomal vectors allowed us to obtain ES colonies with constitutively diminished Yy2 levels. Reduced expression of Yy2 in mESC compromised their colony-forming capacities, resulting in lower numbers of colonies and more differentiated cells (Figure 3). Surprisingly, we failed to detect alterations in the expression levels of a set of pluripotency-associated genes including Sox2, Oct4, Esrrb, and Nanog (Figure 4A, Figure S3). This result was repeated when analyzing cells sorted for sh3Yy2 expression, with the exception of a weak downregulation of Sox2 levels (Figure 4B). Tahmasebi et al. have argued that the essential function of YY2 in mESC is most likely mediated by direct transcriptional regulation of ESC genes that they identified in genome-wide YY2 binding studies, which include Oct4, Esrrb, Eras, Tet1, Tet2, and Tdgf1 [25]. This proposal was further based on results of YY2 overexpression studies and attenuation studies in which transient high overexpression of Yy1 was also observed. We show that Yy2 levels can be attenuated in mESC, while still affecting colony formation. Yy2 depletion did not affect Oct4 and Esrrb levels in our experiments. This may be compatible with the nature of the colonies obtained with sh1Yy2, 80% of which were either undifferentiated or consisted of a core of undifferentiated cells. A second explanation is the enhanced expression of these factors upon attenuation of Yy2 levels (as reported previously [25]) in a relatively diminished number of pluripotent cells, resulting in the observed lack of overall change in gene expression levels (Figure 4). It also remains possible that the effect of Yy2 depletion on the levels of core pluripotency factors is indeed temporal, as suggested by the absence of effects after 16 h (Figure 4B), or after 7 days (Figure 4A), in contrast to increased levels observed after 48 h [25], in different studies. Independent of the explanation, our results do not provide further proof for the role of core pluripotency factors in Yy2-mediated mESC self-renewal. Future studies aimed at understanding the contribution of Yy2 to the expression of core pluripotency factors will have to consider off-targeting effects of shYy2, establish appropriate time-courses, and test for genes beyond the restricted set analyzed in our studies.
Although Zscan4 was not identified as a YY2-binding target in mESC [25], we observed that the attenuation of Yy2 levels was concomitant with higher Zscan4 expression. Surprisingly, however, Zscan4 levels in preimplantation embryos seemed indifferent to Yy2 depletion. However, given the weak effect of Yy2 siRNAs in two-cell embryos (Figure 2B), an effect of YY2 on Zscan4 levels cannot be excluded at this point. Temporal differences in regulation were also observed for REX1-regulated expression of ERV [17]. This observation or phenomenon could be explained by the presence of cis-regulatory regions specific for either stage, the epigenetic modifications that allow YY2 binding in one cell type but not the other, or the requirement for stage-specific cofactors for binding or regulation.
In addition to so-called core pluripotency factors [12], several genes which are essential for long-term maintenance of mESC in culture are expressed only in a subset of cells [47]. Cells shuttle between high- and low-expressing states and the resulting heterogeneity reflects the presence of subpopulations of cells. The non-uniform expression of Zfp42/Rex1 [48] and Stella (Dppa3/Pgc7) [49] is related to a primed or naive state of pluripotency [50,51]. A small subset of cells expressing Zscan4 [36] display a two-cell stage embryo signature marked by the activation of MERVL endogenous retrovirus [32] and the expression of Zscan4 co-regulated genes including Prame, Thoc, and Tcstv [52,53]. Both Yy2 (Figure 4) and Rex1 [13] deficiency alter Zscan4 levels in mESC and two-cell embryos, respectively, raising the possibility of co-regulation of this locus by these two factors. We do not know whether they converge at the level of DNA binding or through LSD1 interaction, which is shared by both factors. Attempts to quantitate Zscan4-positive cells in Yy2- or double Yy2 + Rex1-depleted mouse ES colonies may help to clarify this issue. We entertain the possibility that Yy2 exerts an essential function in the regulation of the expression of Zscan4, whose expression in turn is essential for long-term culture of mESC [36].

Supplementary Materials

The following are available online at https://www.mdpi.com/article/10.3390/cells10051123/s1, Figure S1: Yy2 expression during embryonic development, Figure S2: Specificity of siYy2 and developmental progression of siYy2-injected embryos, Figure S3: Comparison of gene expression levels in shRNA-treated and non-treated mESC, Table S1: Developmental progress of preimplantation embryos, Table S2: Primers and siRNA used.

Author Contributions

Conceptualization, P.M. and J.S.; Formal analysis, P.M., R.P.-P. and J.S.; Funding acquisition, J.S.; Investigation, R.P.-P., M.C., J.S.-A., S.M.-R. and P.M.; Methodology, M.C.; Resources, M.K.; Writing—original draft, R.P.-P. and J.S.; Writing—review and editing, R.P.-P. and J.S. All authors have read and agreed to the published version of the manuscript.

Funding

This work has been supported by grant PI07119 from FIS/CarlosIII, Ministry of Health; PAMER grants, Aragon Health Sciences Institute, Spain; grant PI110/09 from Dpto de CTU (Gobierno de Aragón) and grants B77 and B05_17D from the Government of Aragon (Department of Research and Innovation)/European Social Funds. R.P.-P. and S.M.-R. were supported by PhD fellowships B138/10 and C071/2014, respectively, from the DGA (Aragón, Spain). The funders had no role in study design, data collection and analysis, decision to publish, or preparation of the manuscript.

Institutional Review Board Statement

All procedures were carried out under Project License PI29/08 approved by the in-house Ethics Committee for Animal Experiments from the University of Zaragoza. The care and use of animals were performed according to the Spanish Policy for Animal Protection RD1201/05, which meets the European Union Directive 86/609 on the protection of animals used for experimental and other scientific purposes.

Informed Consent Statement

Not applicable.

Data Availability Statement

The data and materials generated for and described in the current study are available from corresponding authors on request.

Acknowledgments

Special thanks go to I. García-Tuñón for expert advice and to Alberto Cebollada (IACS) for help with the statistics. We acknowledge the use of Servicios Científico Técnicos del CIBA (IACS-Universidad de Zaragoza). The authors acknowledge A. de Diego and M. Sanz (Transgenic Core Facility, I+CS) D. García-Domingo (Cell Culture Core Facility, I+CS) for technical assistance with zygote injections and tissue culture, respectively. J.S. wishes to express his gratitude towards the Departamento de Anatomía, Embriología y Genética Animal, Facultad de Veterinaria, Universidad de Zaragoza for its hospitality.

Conflicts of Interest

The authors report no conflict of interest.

References

  1. Rogers, M.B.; Hosler, A.B.; Gudas, L.J. Specific Expression of a Retinoic Acid-regulated, Zinc-finger Gene, Rex-1, in Preimplantation Embryos, Trophoblast and Spermatocytes. Development 1991, 113, 815–824. [Google Scholar] [CrossRef]
  2. Kim, J.; Faulk, C. Retroposition and Evolution of the DNA-binding Motifs of YY1, YY2 and REX1. Nucleic Acids Res. 2007, 35, 3442–3452. [Google Scholar] [CrossRef] [Green Version]
  3. Thomas, M.J.; Seto, E. Unlocking the Mechanisms of Transcription factor YY1: Are Chromatin Modifying Enzymes the Key? Gene 1999, 236, 197–208. [Google Scholar] [CrossRef]
  4. Atchison, M.L.; Basu, A.; Zaprazna, K.; Papasani, M. Mechanisms of Yin Yang 1 in Oncogenesis: The Importance of Indirect Effects. Crit. Rev. Oncog. 2011, 16, 143–161. [Google Scholar] [CrossRef] [Green Version]
  5. Garcia-Tuñon, I.; Guallar, D.; Alonso-Martin, S.; Benito, A.; Benítez-Lázaro, A.; Pérez-Palacios, R.; Muniesa, P.; Climent, M.; Sánchez, M.; Vidal, M.; et al. Association of Rex-1 to Target Genes Supports Its Interaction with Polycomb Function. Stem Cell Res. 2011, 7, 1–16. [Google Scholar] [CrossRef] [PubMed] [Green Version]
  6. Cai, Y.; Jin, J.; Yao, T.; Gottschalk, A.J.; Swanson, S.K.; Wu, S.; Shi, Y.; Washburn, M.P.; Florens, L.; Conaway, R.C.; et al. YY1 Functions with INO80 to Activate Transcription. Nat. Struct. Mol. Biol. 2007, 14, 872–874. [Google Scholar] [CrossRef] [PubMed]
  7. Weintraub, A.S.; Li, C.H.; Zamudio, A.V.; Sigova, A.A.; Hannett, N.M.; Day, D.S.; Abraham, B.J.; Cohen, M.A.; Nabet, B.; Buckley, D.L.; et al. YY1 Is a Structural Regulator of Enhancer-Promoter Loops. Cell 2017, 171, 1573–1588. [Google Scholar] [CrossRef] [Green Version]
  8. Makhlouf, M.; Ouimette, J.-F.; Oldfield, A.; Navarro, P.; Neuillet, D.; Rougeulle, C. A Prominent and Conserved Role for YY1 in Xist Transcriptional Activation. Nat. Commun. 2014, 5, 4878. [Google Scholar] [CrossRef] [PubMed] [Green Version]
  9. Donohoe, M.E.; Zhang, L.-F.; Xu, N.; Shi, Y.; Lee, J.T. Identification of a Ctcf Cofactor, Yy1, for the X Chromosome Binary Switch. Mol. Cell 2007, 25, 43–56. [Google Scholar] [CrossRef]
  10. Jeon, Y.; Lee, J.T. YY1 Tethers Xist RNA to the Inactive X Nucleation Center. Cell 2011, 146, 119–133. [Google Scholar] [CrossRef] [Green Version]
  11. Donohoe, M.E.; Zhang, X.; McGinnis, L.; Biggers, J.; Li, E.; Shi, Y. Targeted Disruption of Mouse Yin Yang 1 Transcription Factor Results in Peri-Implantation Lethality. Mol. Cell. Biol. 1999, 19, 7237–7244. [Google Scholar] [CrossRef] [Green Version]
  12. Ng, H.-H.; Surani, M.A. The Transcriptional and Signalling Networks of Pluripotency. Nat. Cell Biol. 2011, 13, 490–496. [Google Scholar] [CrossRef] [PubMed]
  13. Climent, M.; Alonso-Martín, S.; Pérez-Palacios, R.; Guallar, D.; Benito, A.A.; Larraga, A.; Fernández-Juan, M.; Sanz, M.; De Diego, A.; Seisdedos, M.T.; et al. Functional Analysis of Rex1 during Preimplantation Development. Stem Cells Dev. 2013, 22, 459–472. [Google Scholar] [CrossRef] [Green Version]
  14. Kim, J.D.; Kim, H.; Ekram, M.B.; Yu, S.; Faulk, C.; Kim, J. Rex1/Zfp42 as an Epigenetic Regulator for Genomic Imprinting. Hum. Mol. Genet. 2011, 20, 1353–1362. [Google Scholar] [CrossRef] [Green Version]
  15. Navarro, P.; Oldfield, A.; Legoupi, J.; Festuccia, N.; Dubois, A.; Attia, M.; Schoorlemmer, J.; Rougeulle, C.; Chambers, I.; Avner, P. Molecular Coupling of Tsix Regulation and Pluripotency. Nat. Cell Biol. 2010, 468, 457–460. [Google Scholar] [CrossRef] [PubMed]
  16. Gontan, C.; Achame, E.M.; Demmers, J.; Barakat, T.S.; Rentmeester, E.; Van Ijcken, W.; Grootegoed, J.A.; Gribnau, J. RNF12 Initiates X-chromosome Inactivation by Targeting REX1 for Degradation. Nat. Cell Biol. 2012, 485, 386–390. [Google Scholar] [CrossRef] [PubMed]
  17. Guallar, D.; Pérez-Palacios, R.; Climent, M.; Martínez-Abadía, I.; Larraga, A.; Fernández-Juan, M.; Vallejo, C.; Muniesa, P.; Schoorlemmer, J. Expression of Endogenous Retroviruses is Negatively Regulated by the Pluripotency Marker Rex1/Zfp42. Nucleic Acids Res. 2012, 40, 8993–9007. [Google Scholar] [CrossRef] [Green Version]
  18. Macfarlan, T.S.; Gifford, W.D.; Agarwal, S.; Driscoll, S.; Lettieri, K.; Wang, J.; Andrews, S.E.; Franco, L.; Rosenfeld, M.G.; Ren, B.; et al. Endogenous Retroviruses and Neighboring Genes are Coordinately Repressed by LSD1/KDM1A. Genes Dev. 2011, 25, 594–607. [Google Scholar] [CrossRef] [Green Version]
  19. Luo, C.; Lu, X.; Stubbs, L.; Kim, J. Rapid Evolution of a Recently Retroposed Transcription factor YY2 in Mammalian Genomes. Genomics 2006, 87, 348–355. [Google Scholar] [CrossRef] [Green Version]
  20. Nguyen, N.; Zhang, X.; Olashaw, N.; Seto, E. Molecular Cloning and Functional Characterization of the Transcription Factor YY2. J. Biol. Chem. 2004, 279, 25927–25934. [Google Scholar] [CrossRef] [Green Version]
  21. Drews, D.; Klar, M.; Dame, C.; Bräuer, A.U. Developmental Expression Profile of the yy2 Gene in Mice. BMC Dev. Biol. 2009, 9, 45. [Google Scholar] [CrossRef] [Green Version]
  22. Klar, M.; Bode, J. Enhanceosome Formation over the Beta Interferon Promoter Underlies a Remote-Control Mechanism Mediated by YY1 and YY2. Mol. Cell. Biol. 2005, 25, 10159–10170. [Google Scholar] [CrossRef] [PubMed] [Green Version]
  23. Chen, L.; Shioda, T.; Coser, K.R.; Lynch, M.C.; Yang, C.; Schmidt, E.V. Genome-wide Analysis of YY2 versus YY1 Target Genes. Nucleic Acids Res. 2010, 38, 4011–4026. [Google Scholar] [CrossRef] [Green Version]
  24. Pérez-Palacios, R.; Macías-Redondo, S.; Climent, M.; Contreras-Moreira, B.; Muniesa, P.; Schoorlemmer, J. In vivo Chromatin Targets of the Transcription Factor Yin Yang 2 in Trophoblast Stem Cells. PLoS ONE 2016, 11, e0154268. [Google Scholar] [CrossRef] [PubMed] [Green Version]
  25. Tahmasebi, S.T.; Jafarnejad, S.M.; Tam, I.S.; Gonatopoulos-Pournatzis, T.; Matta-Camacho, E.; Tsukumo, Y.; Yanagiya, A.; Li, W.; Atlasi, Y.; Caron, M.; et al. Control of Embryonic Stem Cell Self-renewal and Differentiation via Coordinated Alternative Splicing and Translation of YY2. Proc. Natl. Acad. Sci. USA 2016, 113, 12360–12367. [Google Scholar] [CrossRef] [PubMed] [Green Version]
  26. Vella, P.; Barozzi, I.; Cuomo, A.; Bonaldi, T.; Pasini, D. Yin Yang 1 Extends the Myc-related Transcription Factors Network in Embryonic Stem Cells. Nucleic Acids Res. 2011, 40, 3403–3418. [Google Scholar] [CrossRef] [Green Version]
  27. Sigova, A.A.; Abraham, B.J.; Ji, X.; Molinie, B.; Hannett, N.M.; Guo, Y.E.; Jangi, M.R.; Giallourakis, C.C.; Sharp, P.A.; Young, R.A. Transcription Factor Trapping by RNA in Gene Regulatory Elements. Science 2015, 350, 978–981. [Google Scholar] [CrossRef] [PubMed] [Green Version]
  28. Schoorlemmer, J.; Pérez-Palacios, R.; Climent, M.; Guallar, D.; Muniesa, P. Regulation of Mouse Retroelement MuERV-L/MERVL Expression by REX1 and Epigenetic Control of Stem Cell Potency. Front. Oncol. 2014, 4, 14. [Google Scholar] [CrossRef] [Green Version]
  29. Chuong, E.B.; Elde, N.C.; Feschotte, E.B.C.N.C.E.C. Regulatory Activities of Transposable Elements: From Conflicts to Benefits. Nat. Rev. Genet. 2017, 18, 71–86. [Google Scholar] [CrossRef] [Green Version]
  30. Schlesinger, S.; Goff, S.P. Retroviral Transcriptional Regulation and Embryonic Stem Cells: War and Peace. Mol. Cell. Biol. 2014, 35, 770–777. [Google Scholar] [CrossRef] [Green Version]
  31. Cosby, R.L.; Chang, N.-C.; Feschotte, C. Host–transposon Interactions: Conflict, Cooperation, and Cooption. Genes Dev. 2019, 33, 1098–1116. [Google Scholar] [CrossRef] [Green Version]
  32. Macfarlan, T.S.; Gifford, W.D.; Driscoll, S.P.; Lettieri, K.; Rowe, H.M.; Bonanomi, D.; Firth, A.L.; Singer, O.; Trono, D.; Pfaff, S.L. Embryonic Stem Cell Potency Fluctuates with Endogenous Retrovirus Activity. Nat. Cell Biol. 2012, 487, 57–63. [Google Scholar] [CrossRef] [PubMed] [Green Version]
  33. Beraldi, R.; Pittoggi, C.; Sciamanna, I.; Mattei, E.; Spadafora, C. Expression of LINE-1 Retroposons is Essential for Murine Preimplantation Development. Mol. Reprod. Dev. 2005, 73, 279–287. [Google Scholar] [CrossRef] [PubMed]
  34. Wang, J.; Li, X.; Wang, L.; Li, J.; Zhao, Y.; Bou, G.; Li, Y.; Jiao, G.; Shen, X.; Wei, R.; et al. A Novel Long Intergenic Noncoding RNA Indispensable for the Cleavage of Mouse Two-cell Embryos. EMBO Rep. 2016, 17, 1452–1470. [Google Scholar] [CrossRef] [Green Version]
  35. Jachowicz, J.W.; Bing, X.; Pontabry, J.; Bošković, A.; Rando, O.J.; Torres-Padilla, M.-E. LINE-1 Activation after Fertilization Regulates Global Chromatin Accessibility in the Early Mouse Embryo. Nat. Genet. 2017, 49, 1502–1510. [Google Scholar] [CrossRef] [PubMed]
  36. Zalzman, M.; Falco, G.; Sharova, L.V.; Nishiyama, A.; Thomas, M.P.; Lee, S.-L.; Stagg, C.A.; Hoang, H.G.; Yang, H.-T.; Indig, F.E.; et al. Zscan4 Regulates Telomere Elongation and Genomic Stability in ES Cells. Nat. Cell Biol. 2010, 464, 858–863. [Google Scholar] [CrossRef] [Green Version]
  37. Nagy, A.; Gertsenstein, M.; Vintersten, K.; Behringer, R. Manipulating the Mouse Embryo: A Laboratory Manual, 3rd ed.; Cold Spring Harbor Laboratory Press: New York, NY, USA, 2003. [Google Scholar]
  38. Palmieri, S.L.; Payne, J.; Stiles, C.D.; Biggers, J.D.; Mercola, M. Expression of Mouse PDGF-A and PDGF α-receptor Genes during Pre- and Post-implantation Development: Evidence for a Developmental Shift from an Autocrine to a Paracrine Mode of Action. Mech. Dev. 1992, 39, 181–191. [Google Scholar] [CrossRef]
  39. Torres-Padilla, M.-E.; Bannister, A.J.; Hurd, P.J.; Kouzarides, T.; Zernicka-Goetz, M. Dynamic Distribution of the Replacement Histone Variant H3.3 in the Mouse Oocyte and Preimplantation Embryos. Int. J. Dev. Biol. 2006, 50, 455–461. [Google Scholar] [CrossRef] [Green Version]
  40. Aubert, J.; Dunstan, H.; Chambers, I.; Smith, A.G. Functional Gene Screening in Embryonic Stem Cells Implicates Wnt Antagonism in Neural Differentiation. Nat. Biotechnol. 2002, 20, 1240–1245. [Google Scholar] [CrossRef] [Green Version]
  41. Ying, Q.-L.; Wray, J.; Nichols, J.; Batlle-Morera, L.; Doble, B.; Woodgett, J.; Cohen, P.; Smith, A. The Ground State of Embryonic Stem Cell Self-renewal. Nat. Cell Biol. 2008, 453, 519–523. [Google Scholar] [CrossRef] [Green Version]
  42. Velkey, J.M.; O’Shea, K.S. Oct4 RNA Interference Induces Trophectoderm Differentiation in Mouse Embryonic Stem Cells. Genesis 2003, 37, 18–24. [Google Scholar] [CrossRef] [Green Version]
  43. Santoyo, J.; Vaquerizas, J.M.; Dopazo, J.; Santoyo-Lopez, J. Highly Specific and Accurate Selection of siRNAs for High-throughput Functional Assays. Bioinformatics 2004, 21, 1376–1382. [Google Scholar] [CrossRef] [PubMed]
  44. Livak, K.J.; Schmittgen, T.D. Analysis of Relative Gene Expression Data Using Real-time Quantitative PCR and the 2−ΔΔCT Method. Methods 2001, 25, 402–408. [Google Scholar] [CrossRef] [PubMed]
  45. Wallingford, M.C.; Hiller, J.; Zhang, K.; Mager, J. YY1 Is Required for Posttranscriptional Stability of SOX2 and OCT4 Proteins. Cell Reprogram. 2017, 19, 263–269. [Google Scholar] [CrossRef]
  46. Schlesinger, S.; Lee, A.H.; Wang, G.Z.; Green, L.; Goff, S.P. Proviral Silencing in Embryonic Cells Is Regulated by Yin Yang 1. Cell Rep. 2013, 4, 50–58. [Google Scholar] [CrossRef] [Green Version]
  47. Enver, T.; Pera, M.; Peterson, C.; Andrews, P.W. Stem Cell States, Fates, and the Rules of Attraction. Cell Stem Cell 2009, 4, 387–397. [Google Scholar] [CrossRef] [PubMed] [Green Version]
  48. Toyooka, Y.; Shimosato, D.; Murakami, K.; Takahashi, K.; Niwa, H. Identification and Characterization of Subpopulations in Undifferentiated ES Cell Culture. Development 2008, 135, 909–918. [Google Scholar] [CrossRef] [PubMed] [Green Version]
  49. Hayashi, K.; Lopes, S.M.C.D.S.; Tang, F.; Surani, M.A. Dynamic Equilibrium and Heterogeneity of Mouse Pluripotent Stem Cells with Distinct Functional and Epigenetic States. Cell Stem Cell 2008, 3, 391–401. [Google Scholar] [CrossRef] [Green Version]
  50. Wray, J.; Kalkan, T.; Gomez-Lopez, S.; Eckardt, D.; Cook, A.D.; Kemler, R.; Smith, A. Inhibition of Glycogen Synthase Kinase-3 Alleviates Tcf3 Repression of the Pluripotency Network and Increases Embryonic Stem Cell Resistance to Differentiation. Nat. Cell Biol. 2011, 13, 838–845. [Google Scholar] [CrossRef] [Green Version]
  51. Osorno, R.; Chambers, I. Transcription Factor Heterogeneity and Epiblast Pluripotency. Philos. Trans. R. Soc. B Biol. Sci. 2011, 366, 2230–2237. [Google Scholar] [CrossRef] [Green Version]
  52. Lee, S.-L.; Falco, G.; Stanghellini, I.; Bassey, U.C.; Hamatani, T.; Ko, M.S.H. Zscan4: A Novel Gene Expressed Exclusively in Late 2-cell Embryos. Biol. Reprod. 2007, 77, 79. [Google Scholar] [CrossRef]
  53. Carter, M.G.; Stagg, C.A.; Falco, G.; Yoshikawa, T.; Bassey, U.C.; Aiba, K.; Sharova, L.V.; Shaik, N.; Ko, M.S. An in situ Hybridization-based Screen for Heterogeneously Expressed Genes in Mouse ES Cells. Gene Expr. Patterns 2008, 8, 181–198. [Google Scholar] [CrossRef] [PubMed] [Green Version]
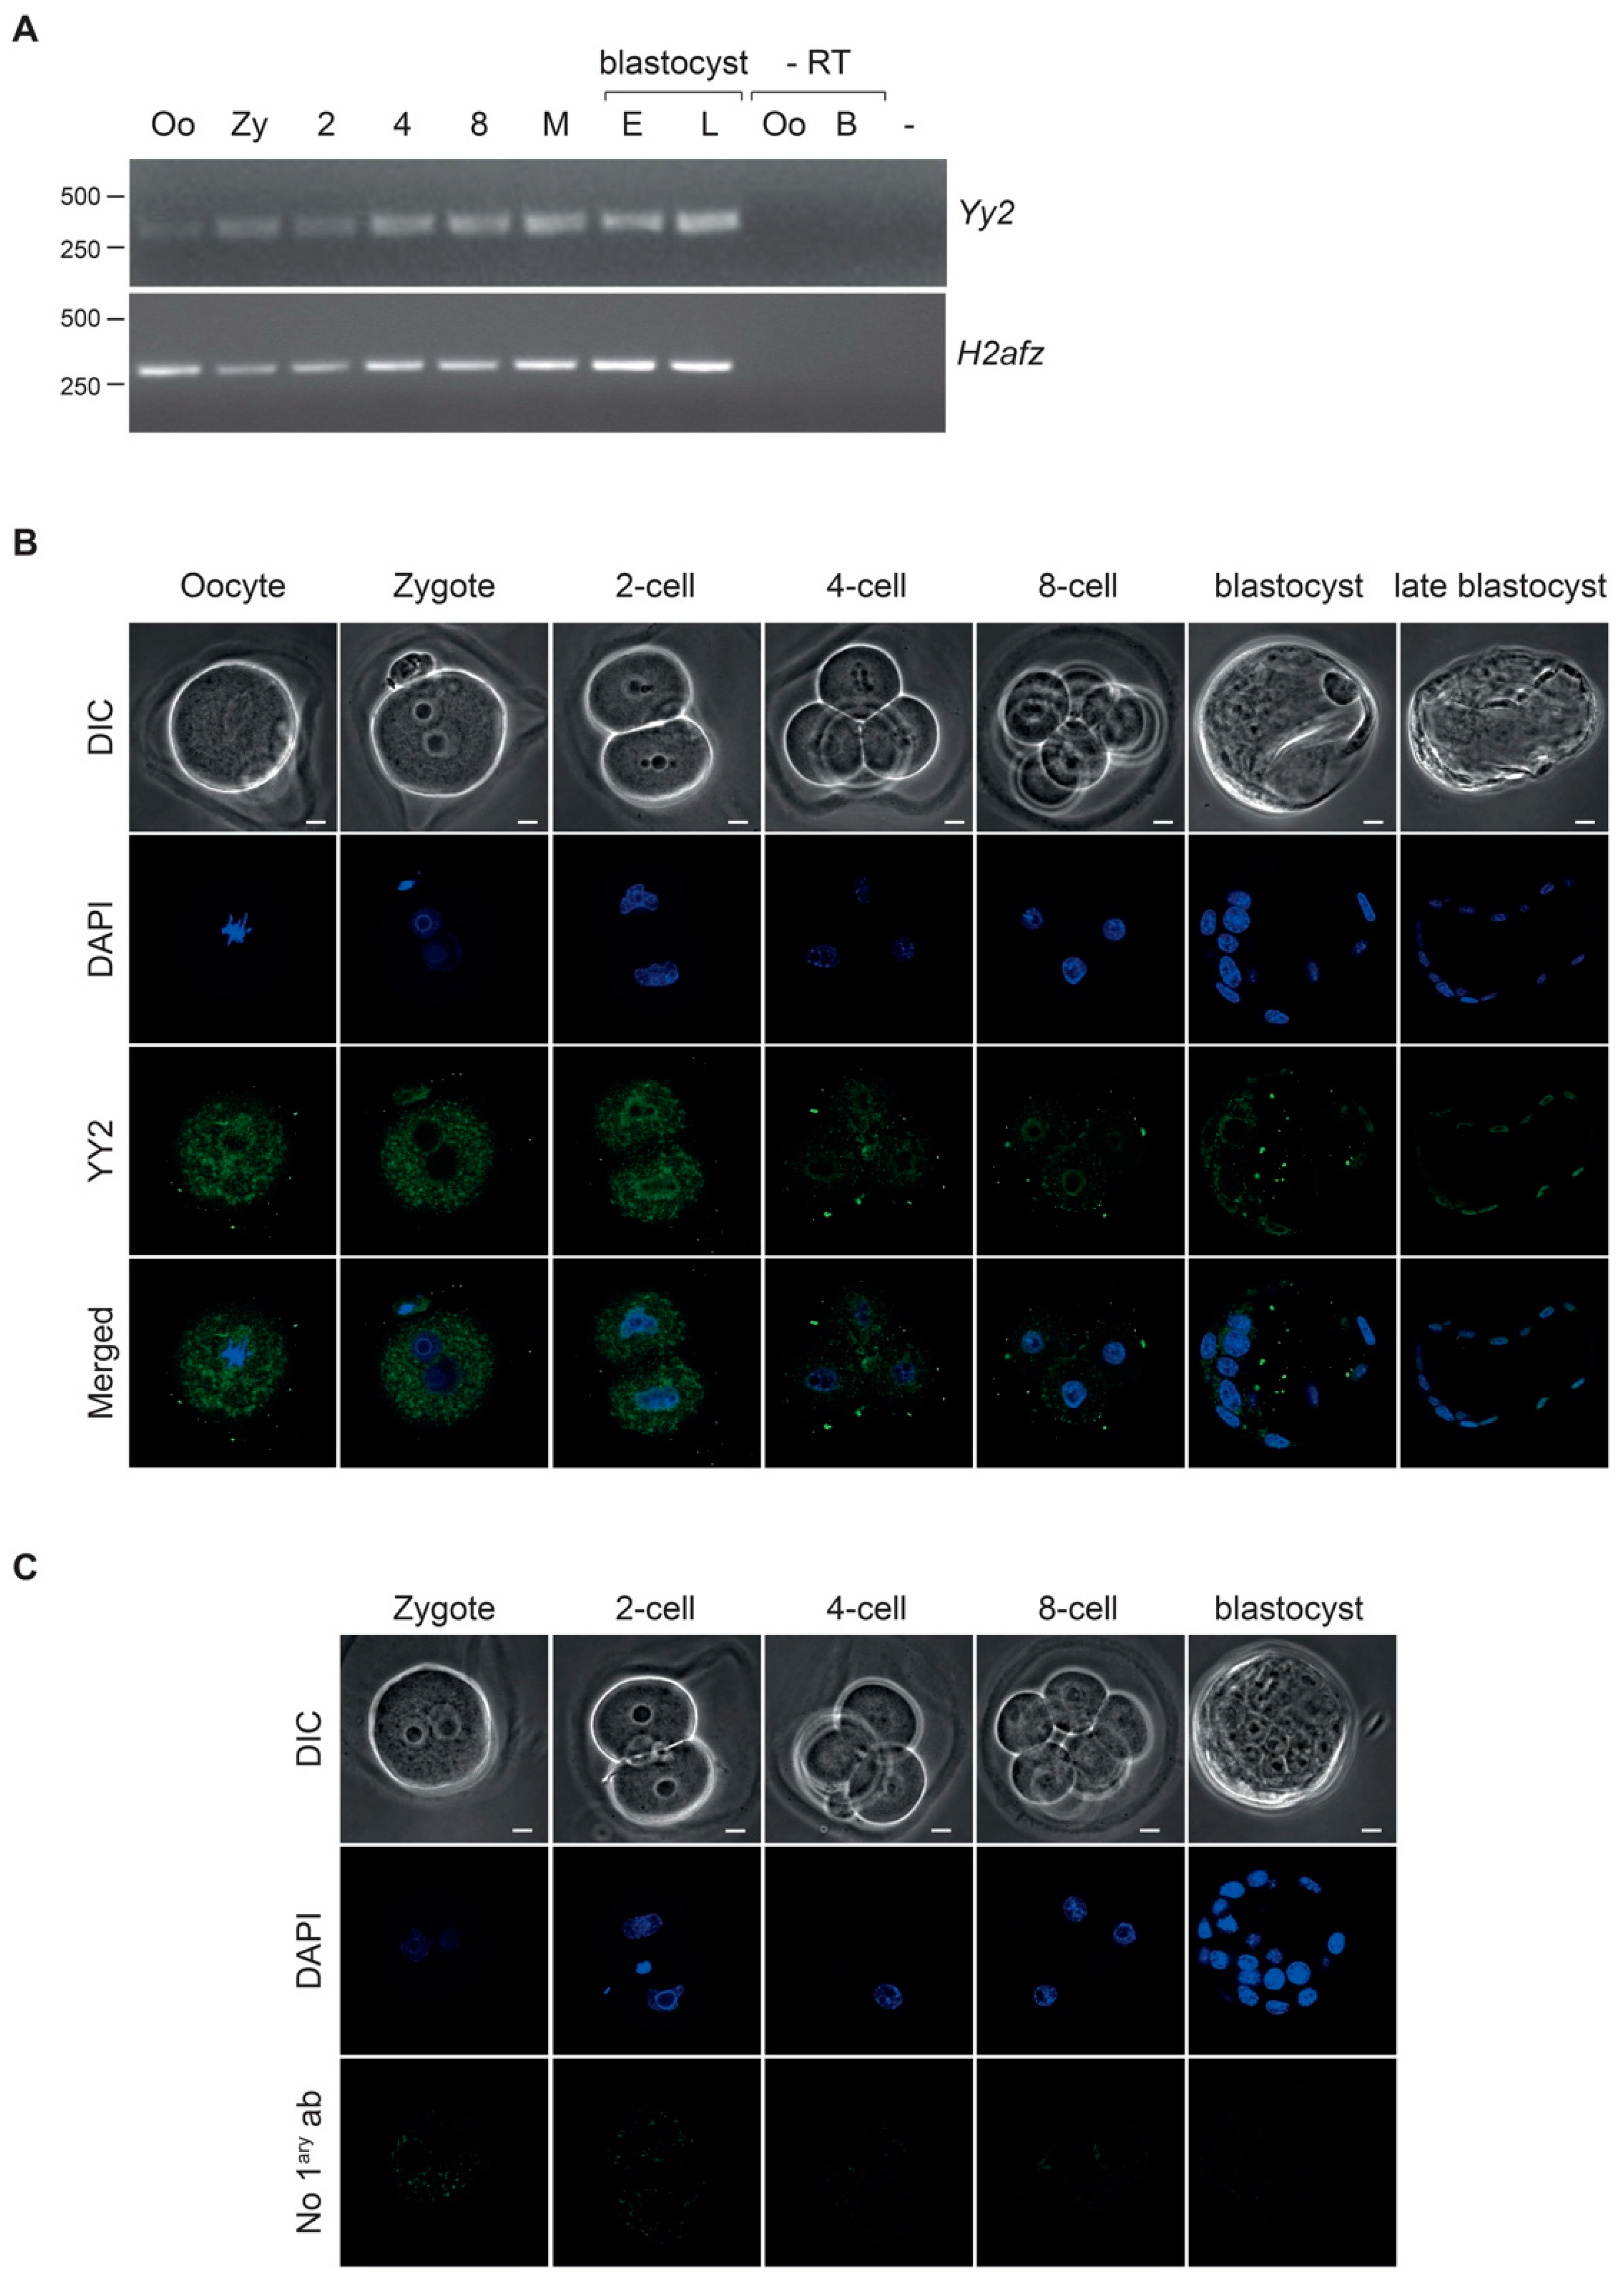
Figure 1. YY2 is present throughout mouse preimplantation development. (A) Detection of mRNA encoding Yy2 in mouse oocytes and preimplantation embryos by RT-PCR. RNA extracted from ~ 25 pooled oocytes or embryos at each stage was reverse-transcribed and subjected to PCR using primers to amplify either Yy2 or H2afz gene as a control. O, oocyte at metaphase II, Zy, zygote; 2, 2-cell; 4, 4-cell; 8, 8-cell embryos; M, morula, E, early blastocyst, L, late blastocyst (E4.5). RT refers to controls without reverse transcription; a PCR reaction without input (-) is shown to the right. The sizes of molecular weight markers run alongside are indicated on the left. (B) Indirect immunofluorescent detection of YY2 in confocal sections of representative mouse embryos depicted as DIC images. DAPI staining indicates chromatin (blue). The antibody used has been shown to specifically detect YY2 in immunofluorescence (Figure 1A and Figure S4 in [24]). Scale bar, 10 µm. (C) Absence of unspecific background in indirect immunofluorescence. Confocal sections of preimplantation mouse embryos incubated without primary antibody (control), processed in parallel to the indirect immunofluorescent detection of YY2 shown in Figure 1B. Scale bar, 10 µm.
Cells 10 01123 g001
Figure 2. Attenuation of Yy2 levels in mouse preimplantation embryos. (A) Yy2 and Rex1 levels in siRNA-injected embryos. mRNA levels were assessed by semi-quantitative RT-PCR analysis in embryos at the morula stage injected with either control siRNA (siCon), Rex1 siRNA (siRex1), or Yy2 siRNA (siYy2); mESC RNA was used as a positive control. PCR reactions without input (-) did not yield any products. H2afz was used as a control. The sizes of molecular weight (Mw) markers run alongside are indicated on the left. (B) Developmental progress assessment of Yy2-depleted preimplantation embryos. Injections of control siRNAs (siControl) and siRNAs against Yy2 (siYy2) were performed in parallel and embryonic development was monitored daily. The ratio of the number of embryos at the specified stage over the total number of embryos, and the average percentage, is indicated. The day of zygotic microinjection was set as Day 1. Cumulative data of three independent experiments are presented, except for data at Day 5, which corresponds to 1 and 2 experiments for siControl and siYy2, respectively. A technical issue for the control condition on Day 5 precluded normal developmental progression; therefore, Day 5 data of this condition are limited to only one experiment (see Table S1). (BD) Effect of attenuation of Yy2 levels on gene expression. One-cell embryos were microinjected with control siRNAs (siCon), Yy2-specific siRNAs (siYy2), or a combination of Rex1 and Yy2 siRNAs (siY + R). Embryos were cultured in vitro to the 2-cell (B), morula (C), or blastocyst (D) stages. RNA was extracted, reverse-transcribed, and gene expression of equivalent amounts of embryos was analyzed by semiquantitative RT-PCR with primers specific for the indicated genes; RNA extracted from mESC was processed alongside. H2afz was used as a control. (-) refers to PCR reactions without template added. The sizes of Mw markers run alongside are indicated on the left.
Cells 10 01123 g002
Figure 3. Attenuation of Yy2 levels impacts on colony formation capacity in mESC. (A) Western blot to detect YY2 (Top) or TUBULIN (Bottom) in cell lysates of mESC transfected with plasmids that express either control shRNAs (shC) or shRNAs directed against Yy2, sh1Yy2 (sh1), and sh2Yy2 (sh2). Migration of molecular weight standards is indicated to the right; detected proteins are marked with arrowheads. (BE) Clonogenic colony formation assays. Equal numbers of mESC were transfected with shRNA-expressing plasmids, shControl, sh1Yy2, or shYy2, and were selected for 7 days with hygromycin. (B) The resulting colonies were stained for alkaline phosphatase (AP) and photographed. Three representative fields are shown for each condition. Scale bar, 100 µm. (C) Quantification of the total number of colonies obtained in (B). Colonies per field (10 fields) were counted; the number of colonies formed by cells expressing control shRNA was set at a 100% and the number of colonies in the presence of shRNAs directed against Yy2 was calculated accordingly. Error bars represent the standard deviation over three independent assays. ** p-value ≤ 0.01 (one sample t-test). (D,E) Colony morphology assessment. Quantification of colonies according to AP staining and colony morphology obtained in (B). Colonies were categorized as pluripotent, intermediate, and differentiated according to the examples indicated. Scale bar, 100 µm. (E) Total number of colonies of cells in the shControl, sh1Yy2, and sh2Yy2 conditions in a predetermined number of fields (10 fields) was counted and classified in each category. The relative percentage of each category per condition is represented as a stacked bar graph. Error bars represent the standard deviation over three independent experiments. * p-value < 0.001 (X2 test).
Cells 10 01123 g003
Figure 4. Gene expression in Yy2-depleted mESC. (A) Gene expression in mESC colonies transfected with either sh1Yy2- or shCon-expressing plasmids was measured by qPCR. Expression levels are depicted as fold expression in depleted cells relative to mESC-expressing shControl. Data presented for sh1Yy2 are the mean of 3 biological replicates, each performed on different days and using a different preparation of cells (except for Yy1 and Esrrb data that correspond to two replicates and one experiment, respectively), and three technical replicates for each experiment. The statistical significance (one sample t-test) of differences in gene expression is indicated, ** p-value ≤ 0.01, * p-value ≤ 0.05; all other differences were not significant. (B) Expression levels of Yy2 gene family members, pluripotency markers, and Zscan4, measured in cells transfected with a GFP-expressing sh3Yy2 construct. Cells were sorted based on GFP expression, and expression is depicted as fold expression of GFP+ relative to GFP- cells. Data shown are based on technical replicates. ** p-value ≤ 0.01, * p-value ≤ 0.05 (one sample t-test).
Cells 10 01123 g004
Table 1. Developmental progress assessment of Yy2-depleted preimplantation embryos.
2-Cell5–8 Cells≥MorulaBlastocyst
Day 2Day 3Day 4Day 5
siControl104/10481/9272/8021/26
(100%)(88.0%)(90.0%)(80.8%)
siYy2113/11483/10180/8658/76
(99.1%)(82.2%)(93.0%)(76.3%)
Injections of control siRNAs (siControl) and siRNAs against Yy2 (siYy2) were performed in parallel and embryonic development was monitored daily. The ratio of the number of embryos at the specified stage over the total number of embryos, and the average percentage, is indicated. The day of zygotic microinjection was set as Day 1. Cumulative data of three independent experiments are presented, except for data at Day 5, which corresponds to one and two experiments for siControl and siYy2, respectively. A technical issue for the control condition on Day 5 precluded normal developmental progression; therefore, Day 5 data of this condition are limited to only one experiment (see Table S1).
Publisher’s Note: MDPI stays neutral with regard to jurisdictional claims in published maps and institutional affiliations.