
NAD Modulates DNA Methylation and Cell Differentiation

 , , , , ,
  , and
, and 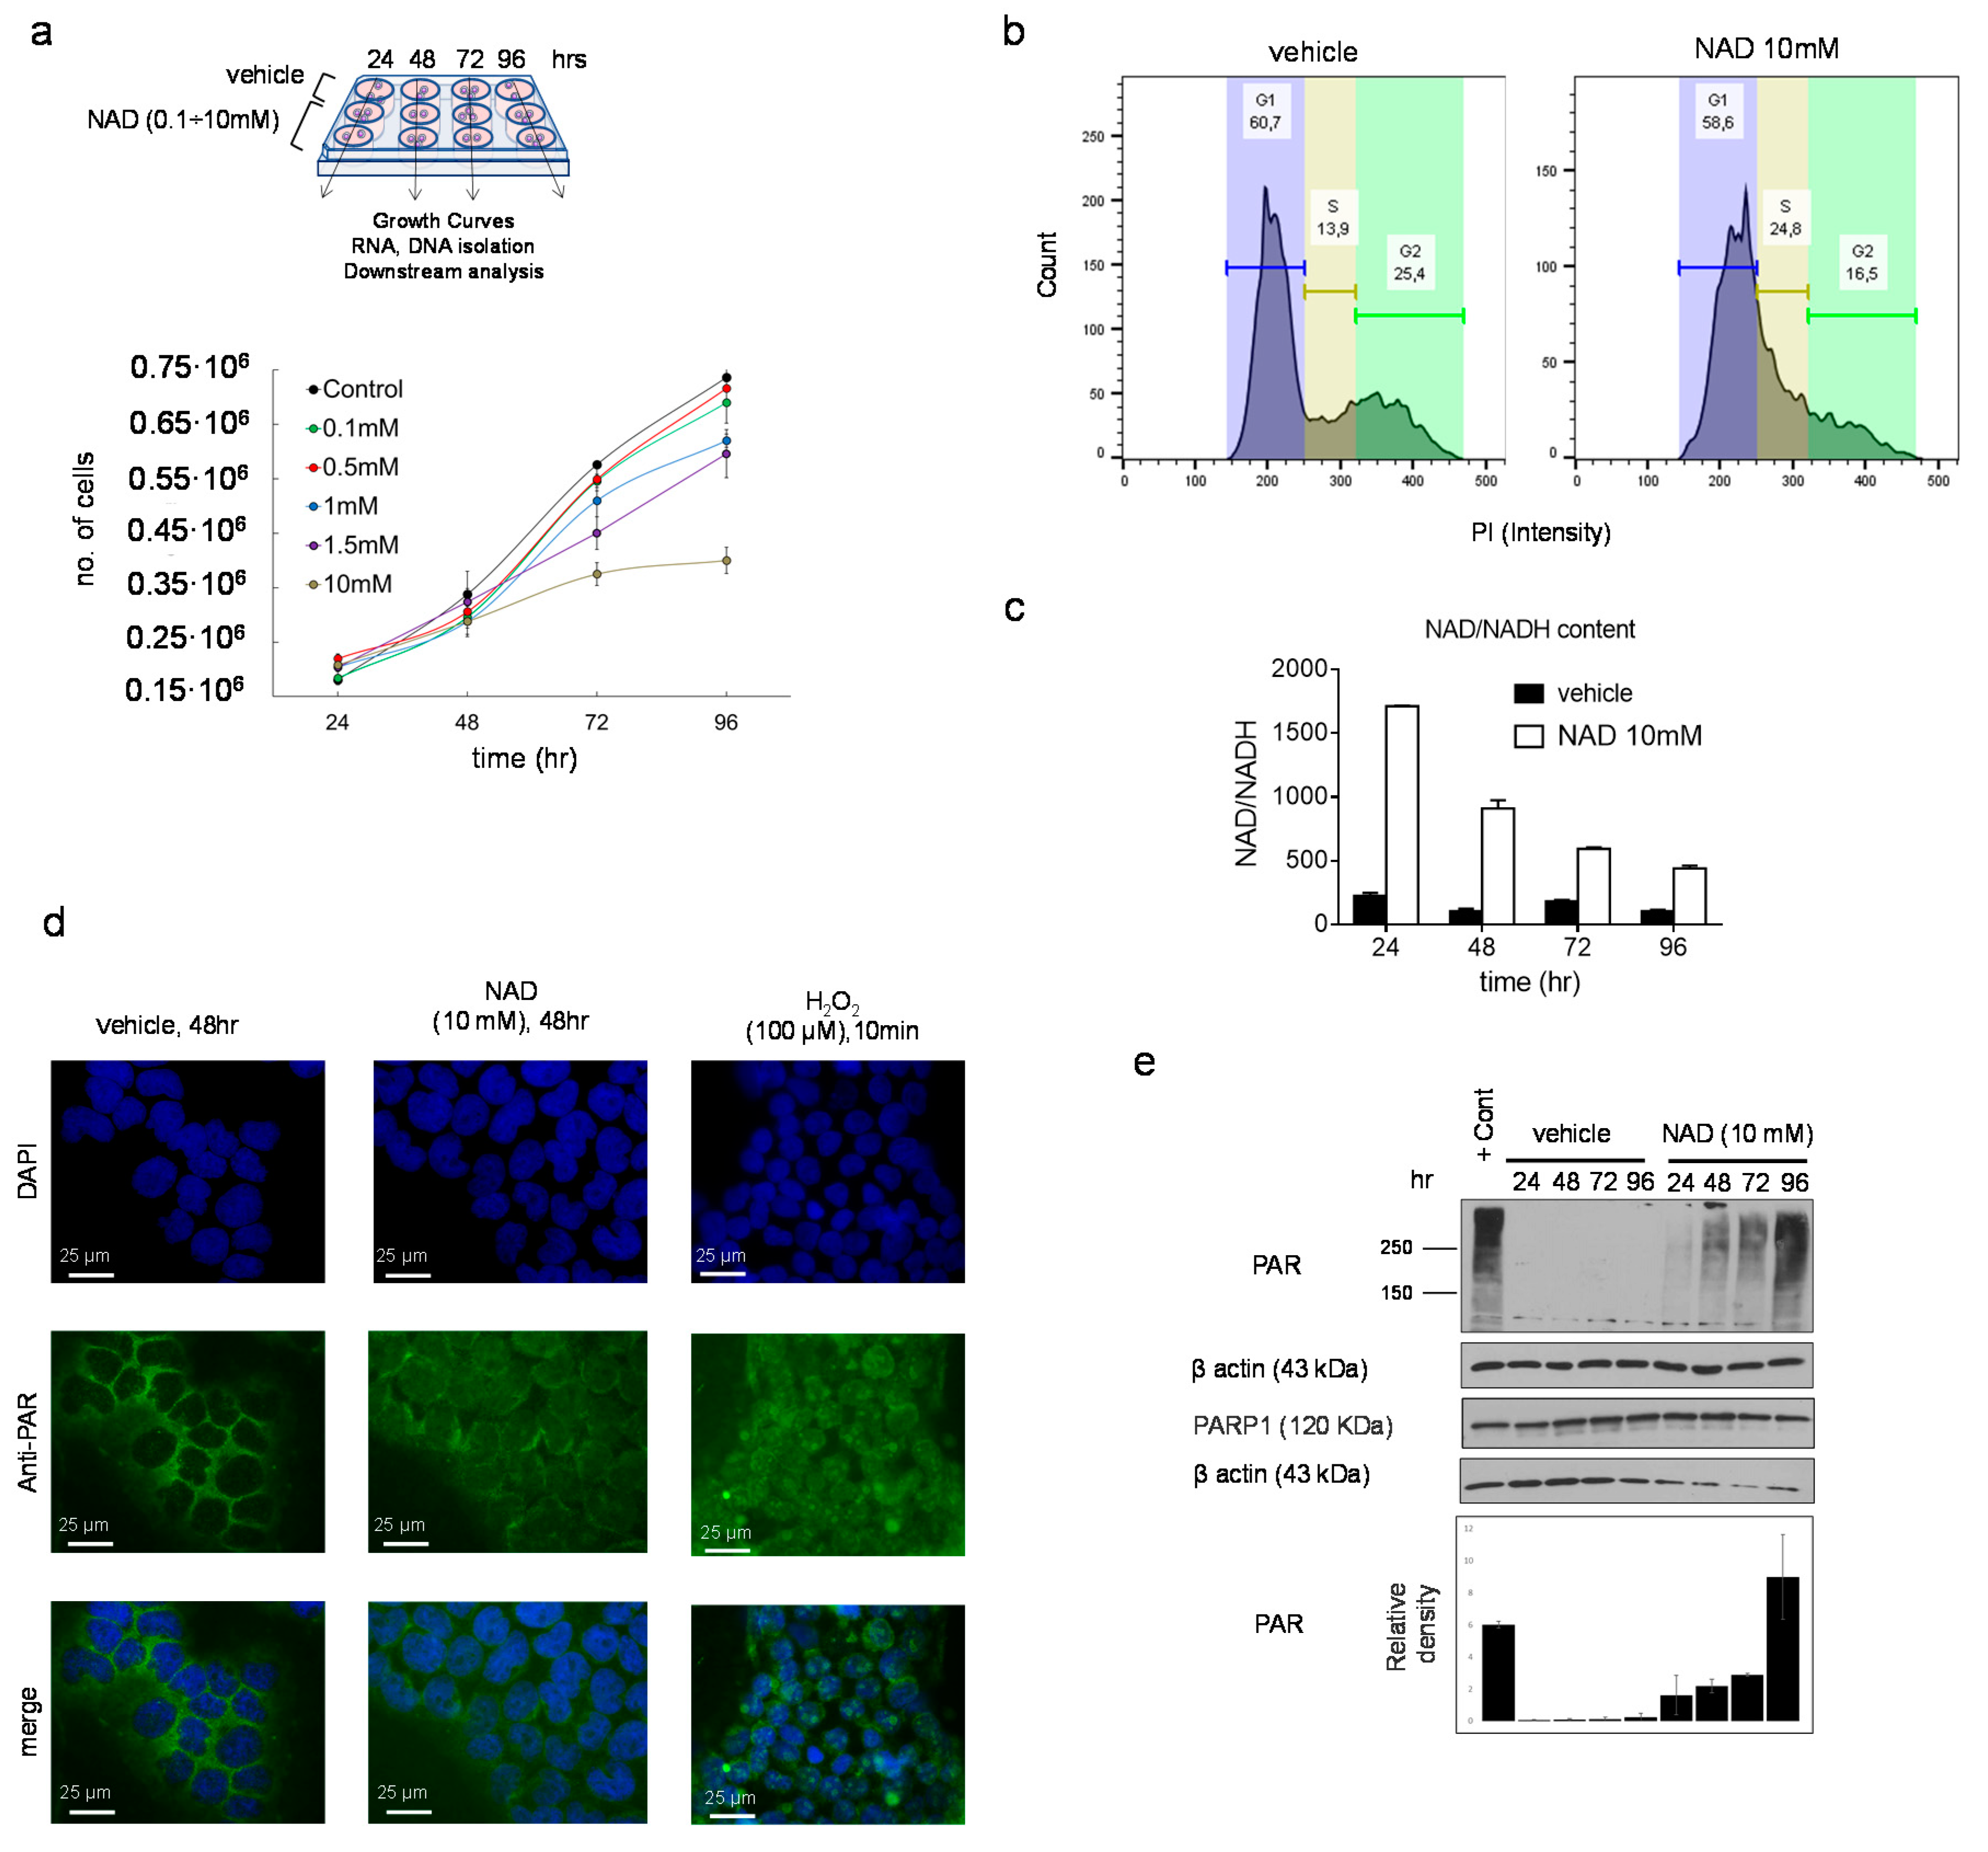
Abstract
1. Introduction
2. Materials and Methods
2.1. Cells and Cell Culture
2.2. NAD Treatment
2.3. K562 Wright Giemsa Staining
2.4. Nitroblue Tetrazolium (NBT) Assay
2.5. Immunofluorescence
2.6. RNA Isolation and qRT-PCR Analyses
2.7. DNA Isolation
2.8. Western Blotting Analysis
2.9. Bisulfite Sequencing and Analysis
2.10. Chromatin Immunoprecipitation
2.11. Immunostaining for FACS Analysis
2.12. Flow Cytometry Analysis for Cell Cycle Distribution
2.13. Annexin V Staining
2.14. Seahorse Analysis
2.15. Statistical Analysis
3. Results
3.1. NAD Inhibits Cancer Cell Growth in a Dose-Dependent Manner and Drives Accumulation of Intracellular Poly ADP-Ribose Polymers
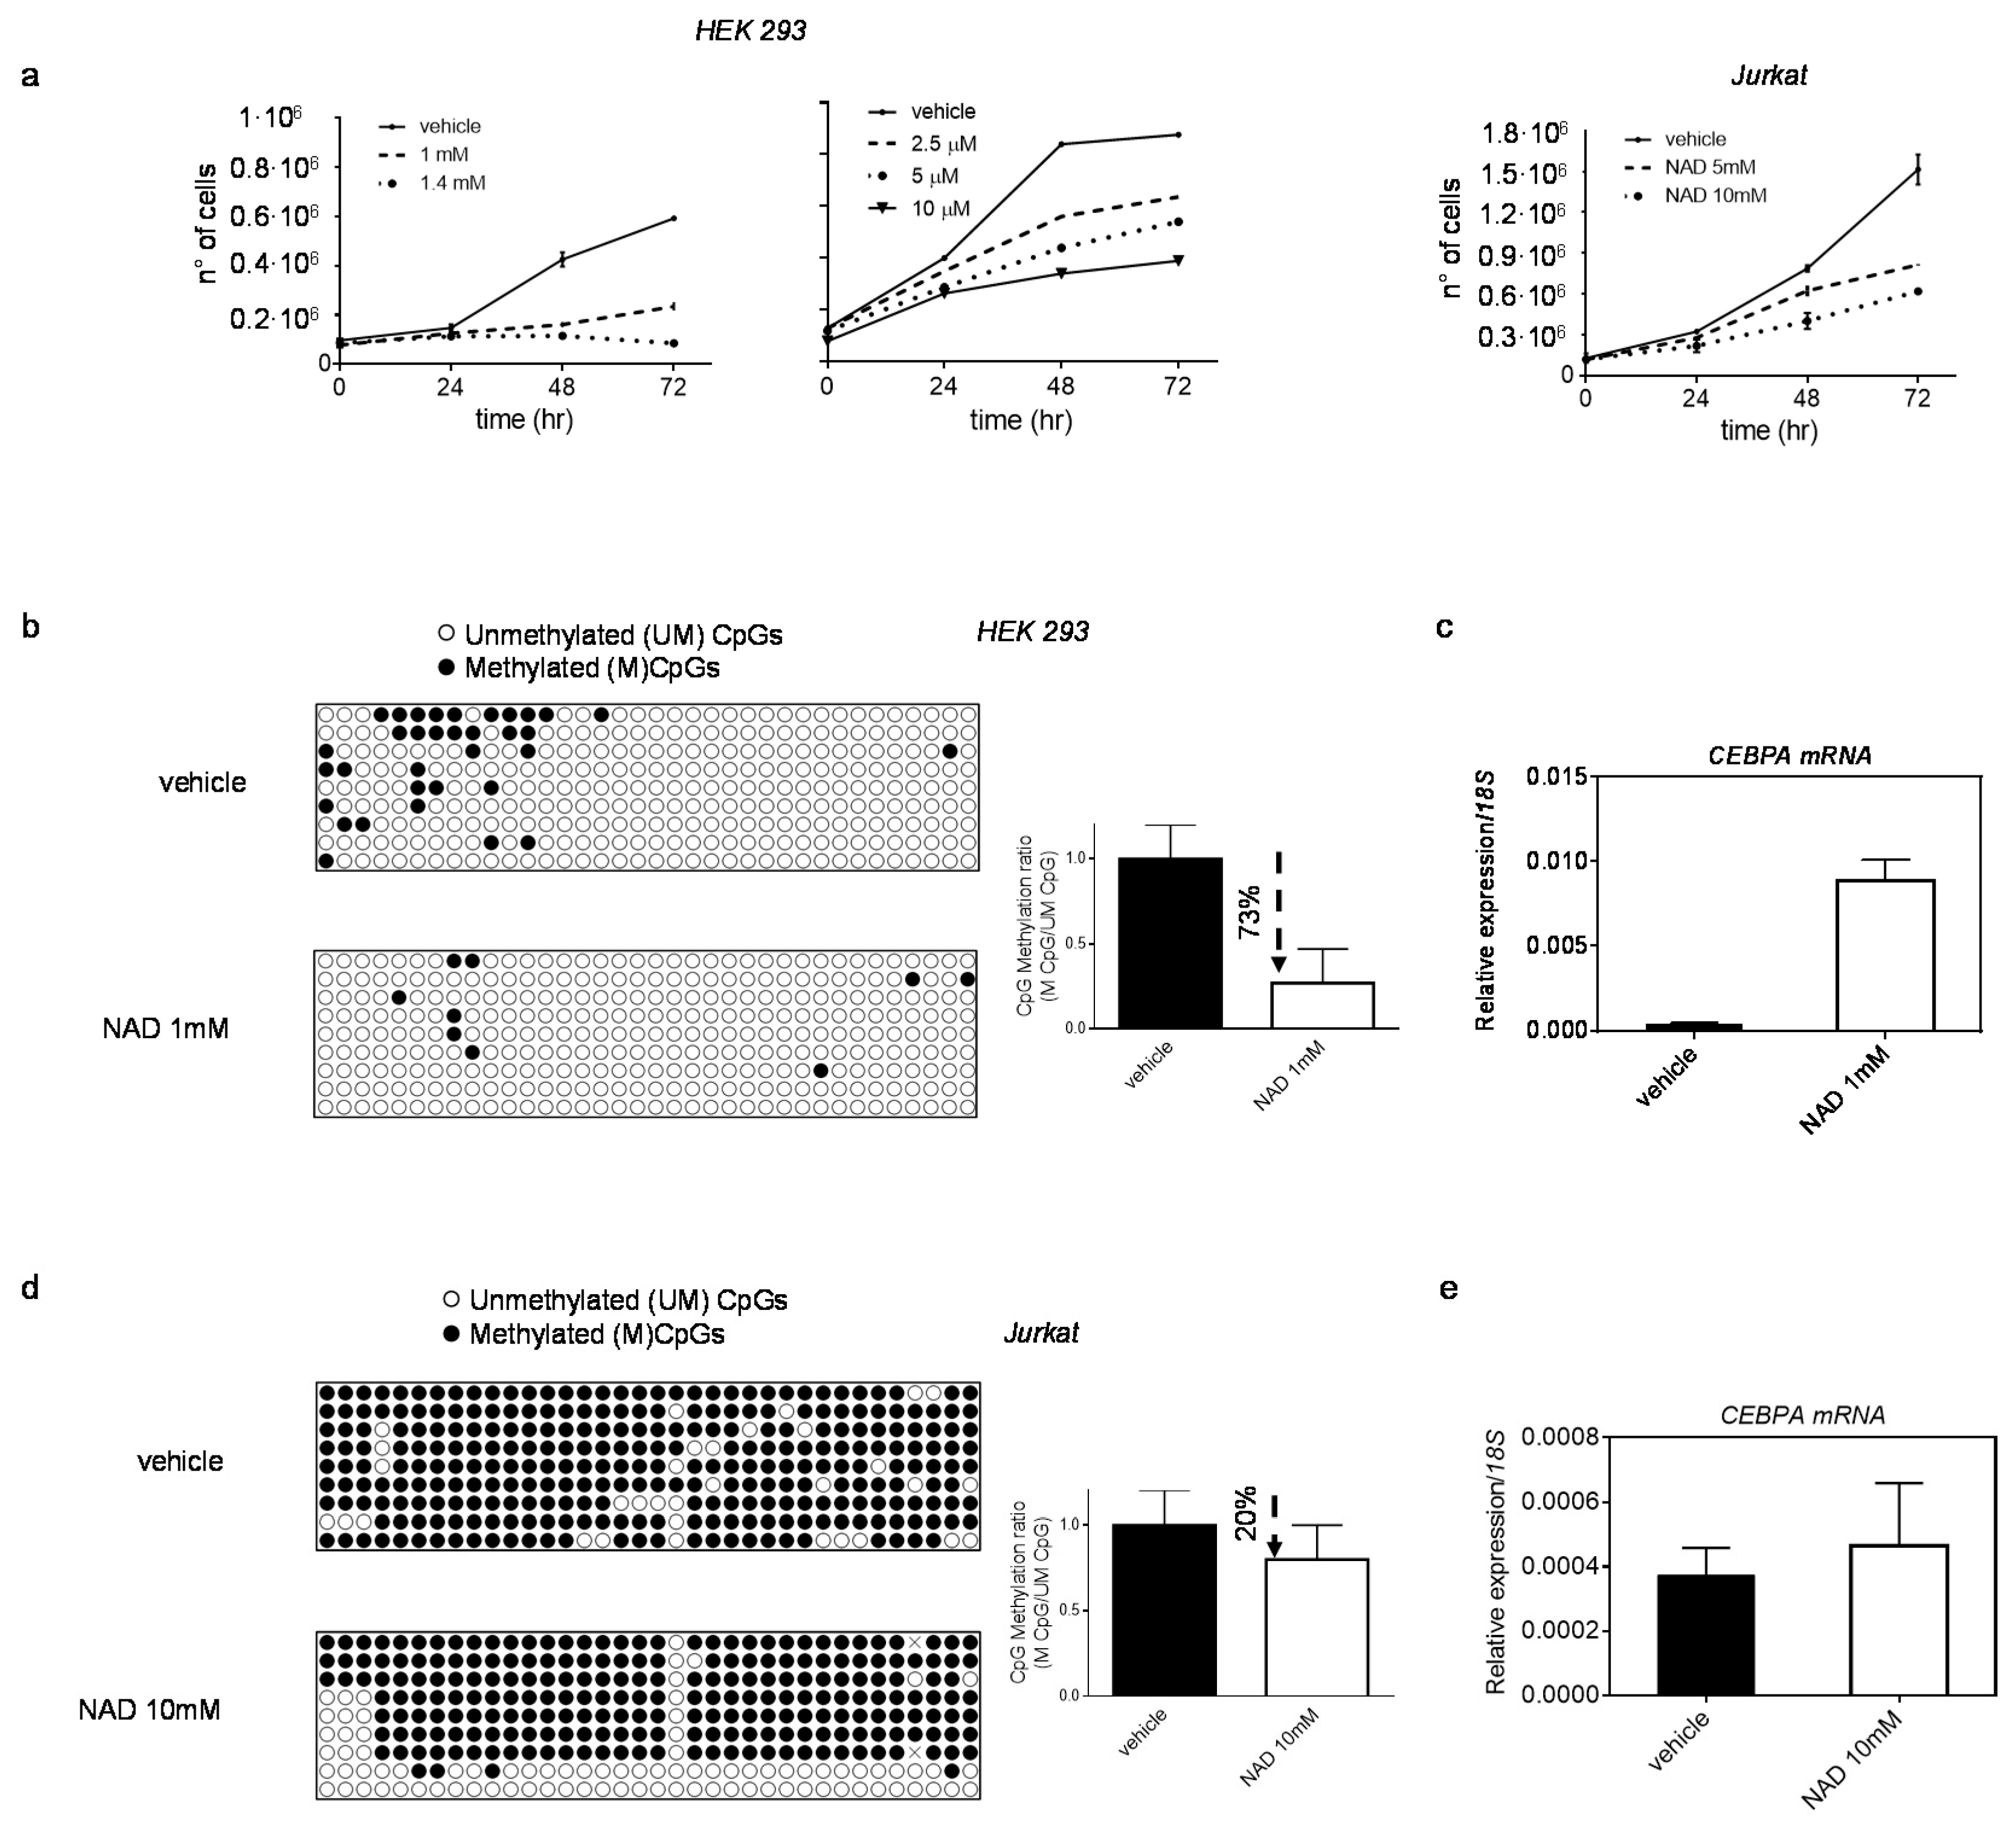
3.2. NAD Treatment Induces CEBPA Distal Promoter Demethylation
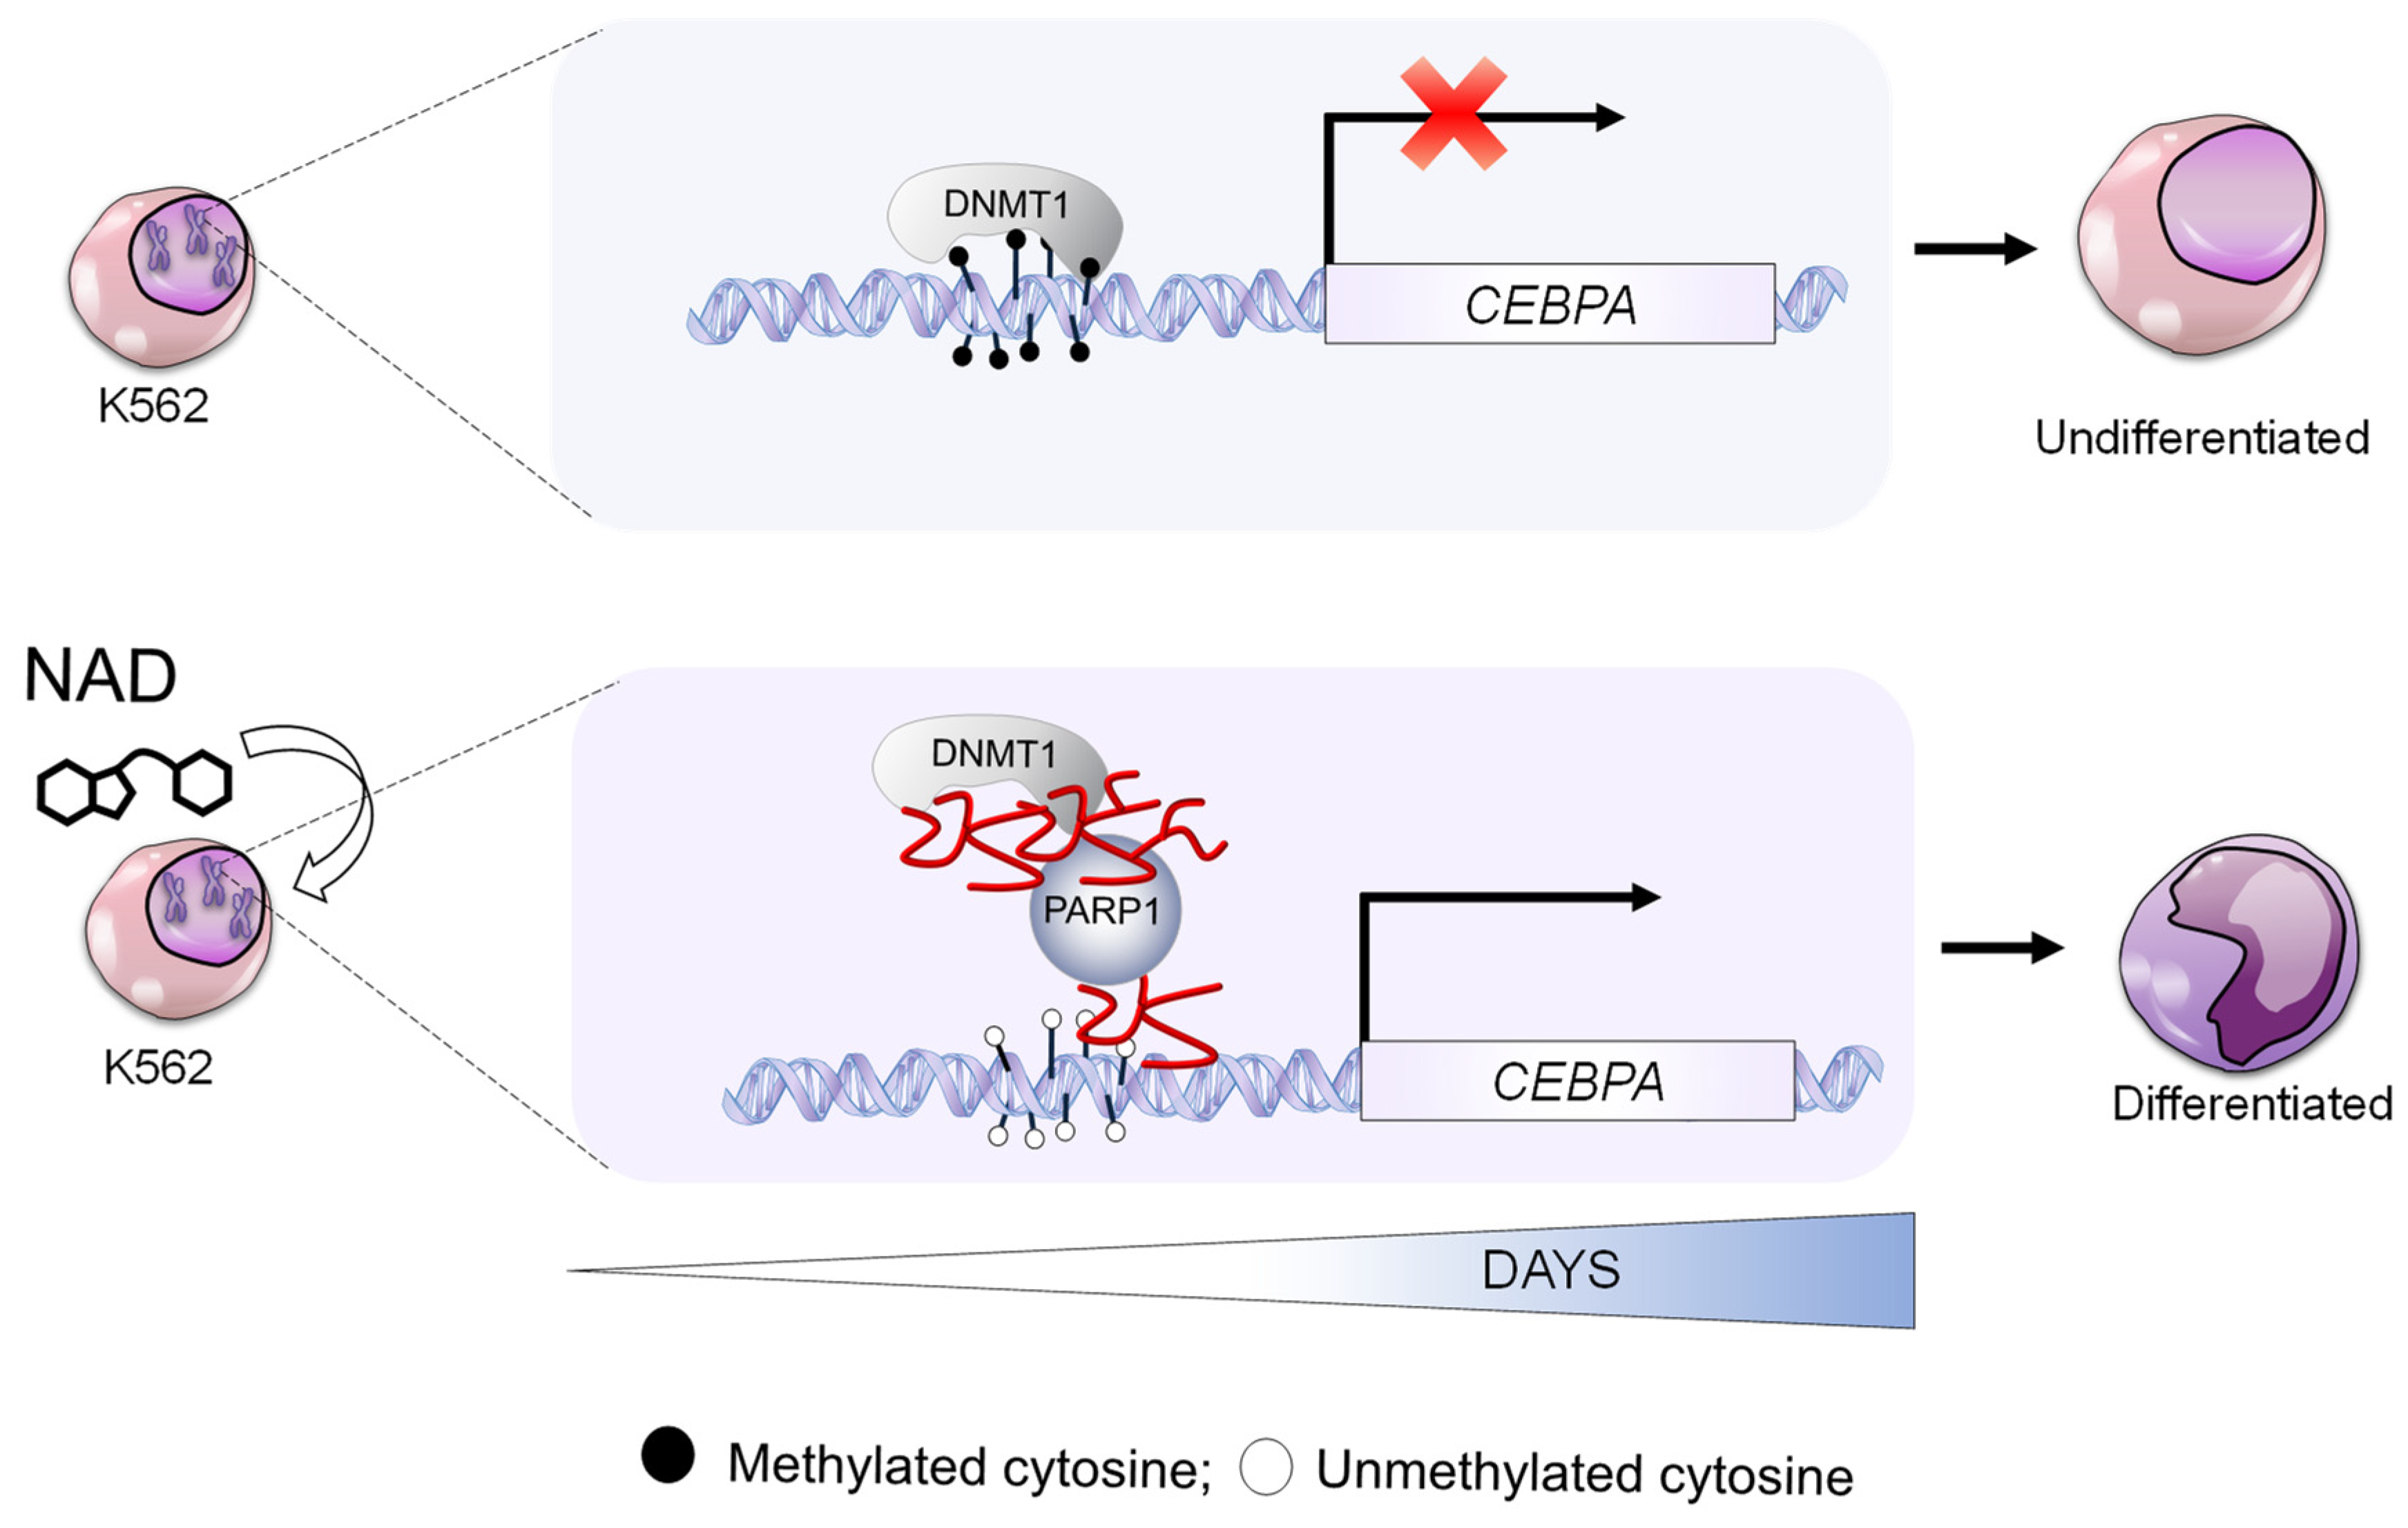
3.3. NAD Treatment Enhances CEBPA mRNA Transcription in K562 by a PARP1-Dependent Mechanism
3.4. NAD Induces Myeloid Differentiation
3.5. NAD Treatment Improves Mitochondrial OXPHOS Function
4. Discussion
Supplementary Materials
Author Contributions
Funding
Institutional Review Board Statement
Informed Consent Statement
Data Availability Statement
Acknowledgments
Conflicts of Interest
References
- Avgerinos, K.I.; Spyrou, N.; Mantzoros, C.S.; Dalamaga, M. Obesity and cancer risk: Emerging biological mechanisms and perspectives. Metabolism 2019, 92, 121–135. [Google Scholar] [CrossRef] [PubMed]
- Birks, S.; Peeters, A.; Backholer, K.; O’Brien, P.; Brown, W. A systematic review of the impact of weight loss on cancer incidence and mortality. Obes. Rev. 2012, 13, 868–891. [Google Scholar] [CrossRef] [PubMed]
- King, S.E.; Skinner, M.K. Epigenetic transgenerational inheritance of obesity susceptibility. Trends Endocrinol. Metab. 2020, 31, 478–494. [Google Scholar] [CrossRef]
- Strom, S.S.; Yamamura, Y.; Kantarijian, H.M.; Cortes, J. Obesity, weight gain, and risk of chronic myeloid leukemia. Cancer Epidemiol. Biomark. Prev. 2009, 18, 1501–1506. [Google Scholar] [CrossRef] [PubMed]
- Tedesco, J.; Qualtieri, J.; Head, D.; Savani, B.N.; Reddy, N. High prevalence of obesity in acute promyelocytic leukemia (APL): Implications for differentiating agents in APL and metabolic syndrome. Ther. Adv. Hematol. 2011, 2, 141–145. [Google Scholar] [CrossRef]
- Montgomery, M.; Srinivasan, A. Epigenetic gene regulation by dietary compounds in cancer prevention. Adv. Nutr. 2019, 10, 1012–1028. [Google Scholar] [CrossRef] [PubMed]
- Yilmaz, M.; Atilla, F.D.; Sahin, F.; Saydam, G. The effect of malnutrition on mortality in hospitalized patients with hematologic malignancy. Support. Care Cancer 2020, 28, 1441–1448. [Google Scholar] [CrossRef]
- Zeisel, S.H. Precision (Personalized) nutrition: Understanding metabolic heterogeneity. Annu. Rev. Food Sci. Technol. 2020, 11, 71–92. [Google Scholar] [CrossRef]
- Nur, S.M.; Rath, S.; Ahmad, V.; Ahmad, A.; Ateeq, B.; Khan, M.I. Nutritive vitamins as epidrugs. Crit. Rev. Food Sci. Nutr. 2020, 61, 1–13. [Google Scholar] [CrossRef] [PubMed]
- Bunce, C.M.; Brown, G.; Hewison, M. Vitamin D and hematopoiesis. Trends Endocrinol. Metab. 1997, 8, 245–251. [Google Scholar] [CrossRef]
- Meroni, M.; Longo, M.; Rustichelli, A.; Dongiovanni, P. Nutrition and genetics in NAFLD: The perfect binomium. Int. J. Mol. Sci. 2020, 21, 2986. [Google Scholar] [CrossRef] [PubMed]
- Di Tano, M.; Raucci, F.; Vernieri, C.; Caffa, I.; Buono, R.; Fanti, M.; Brandhorst, S.; Curigliano, G.; Nencioni, A.; De Braud, F.; et al. Synergistic effect of fasting-mimicking diet and vitamin C against KRAS mutated cancers. Nat. Commun. 2020, 11, 2332. [Google Scholar] [CrossRef]
- Rajman, L.; Chwalek, K.; Sinclair, D.A. Therapeutic potential of NAD-boosting molecules: The in vivo evidence. Cell Metab. 2018, 27, 529–547. [Google Scholar] [CrossRef] [PubMed]
- Ralto, K.M.; Rhee, E.P.; Parikh, S.M. NAD(+) homeostasis in renal health and disease. Nat. Rev. Nephrol. 2020, 16, 99–111. [Google Scholar] [CrossRef]
- Ida, C.; Ogata, S.; Okumura, K.; Taguchi, H. Induction of differentiation in k562 cell line by nicotinic acid-related compounds. Biosci. Biotechnol. Biochem. 2009, 73, 79–84. [Google Scholar] [CrossRef] [PubMed][Green Version]
- Iwata, K.; Ogata, S.; Okumura, K.; Taguchi, H. Induction of differentiation in human promyelocytic leukemia HL-60 cell line by niacin-related compounds. Biosci. Biotechnol. Biochem. 2003, 67, 1132–1135. [Google Scholar] [CrossRef] [PubMed]
- Jones, P.A. Functions of DNA methylation: Islands, start sites, gene bodies and beyond. Nat. Rev. Genet. 2012, 13, 484–492. [Google Scholar] [CrossRef] [PubMed]
- Herman, J.G.; Baylin, S.B. Gene silencing in cancer in association with promoter hypermethylation. N. Engl. J. Med. 2003, 349, 2042–2054. [Google Scholar] [CrossRef]
- Jones, P.A.; Baylin, S.B. The fundamental role of epigenetic events in cancer. Nat. Rev. Genet. 2002, 3, 415–428. [Google Scholar] [CrossRef]
- Ray Chaudhuri, A.; Nussenzweig, A. The multifaceted roles of PARP1 in DNA repair and chromatin remodelling. Nat. Rev. Mol. Cell Biol. 2017, 18, 610–621. [Google Scholar] [CrossRef] [PubMed]
- Hageman, G.J.; Stierum, R.H. Niacin, poly(ADP-ribose) polymerase-1 and genomic stability. Mutat. Res. 2001, 475, 45–56. [Google Scholar] [CrossRef]
- Ciccarone, F.; Zampieri, M.; Caiafa, P. PARP1 orchestrates epigenetic events setting up chromatin domains. Semin. Cell Dev. Biol. 2017, 63, 123–134. [Google Scholar] [CrossRef] [PubMed]
- Reale, A.; De Matteis, G.; Galleazzi, G.; Zampieri, M.; Caiafa, P. Modulation of DNMT1 activity by ADP-ribose polymers. Oncogene 2005, 24, 13–19. [Google Scholar] [CrossRef] [PubMed]
- Fang, Y.-Y.; Bi, F.-F.; Zhou, Y.-M.; Sun, W.-P.; Li, C.-Y.; Liu, Q.; Zhao, Y.; Li, D. Nicotinamide adenine dinucleotide (NAD) may affect DNA methyltransferase 1 through regulation of BRCA1 in ovarian cancer. Am. J. Cancer Res. 2015, 5, 1199–1206. [Google Scholar] [PubMed]
- Witcher, M.; Emerson, B.M. Epigenetic silencing of the p16(INK4a) tumor suppressor is associated with loss of CTCF binding and a chromatin boundary. Mol. Cell 2009, 34, 271–284. [Google Scholar] [CrossRef] [PubMed]
- Ciccarone, F.; Valentini, E.; Bacalini, M.G.; Zampieri, M.; Calabrese, R.; Guastafierro, T.; Mariano, G.; Reale, A.; Franceschi, C.; Caiafa, P. Poly(ADP-ribosyl)ation is involved in the epigenetic control of TET1 gene transcription. Oncotarget 2014, 5, 10356–10367. [Google Scholar] [CrossRef]
- Di Ruscio, A.; Ebralidze, A.K.; Benoukraf, T.; Amabile, G.; Goff, L.; Terragni, J.; Figueroa, M.E.; Pontes, L.L.D.F.; Jorda, M.A.; Zhang, P.; et al. DNMT1-interacting RNAs block gene-specific DNA methylation. Nature 2013, 503, 371–376. [Google Scholar] [CrossRef] [PubMed]
- Umek, R.M.; Friedman, A.D.; McKnight, S.L. CCAAT-enhancer binding protein: A component of a differentiation switch. Science 1991, 251, 288–292. [Google Scholar] [CrossRef]
- D’Alò, F.; Johansen, L.M.; Nelson, E.A.; Radomska, H.S.; Evans, E.K.; Zhang, P.; Nerlov, C.; Tenen, D.G. The amino terminal and E2F interaction domains are critical for C/EBP alpha-mediated induction of granulopoietic development of hematopoietic cells. Blood 2003, 102, 3163–3171. [Google Scholar] [CrossRef] [PubMed]
- Kumaki, Y.; Oda, M.; Okano, M. QUMA: Quantification tool for methylation analysis. Nucleic Acids Res. 2008, 36, W170–W175. [Google Scholar] [CrossRef] [PubMed]
- Zhang, H.; Alberich-Jorda, M.; Amabile, G.; Yang, H.; Staber, P.B.; Di Ruscio, A.; Welner, R.S.; Ebralidze, A.; Zhang, J.; Levantini, E.; et al. Sox4 is a key oncogenic target in C/EBPalpha mutant acute myeloid leukemia. Cancer Cell 2013, 24, 575–588. [Google Scholar] [CrossRef] [PubMed]
- Ryabokon, N.I.; Cieslar-Pobuda, A.; Rzeszowska-Wolny, J. Inhibition of poly(ADP-ribose) polymerase activity affects its subcellular localization and DNA strand break rejoining. Acta Biochim. Pol. 2009, 56, 243–248. [Google Scholar] [CrossRef] [PubMed]
- Valdor, R.; Schreiber, V.; Saenz, L.; Martínez, T.; Muñoz-Suano, A.; Domínguez-Villar, M.; Ramírez, P.; Parrilla, P.; Aguado, E.; Garcia-Cozar, F. Regulation of NFAT by poly(ADP-ribose) polymerase activity in T cells. Mol. Immunol. 2008, 45, 1863–1871. [Google Scholar] [CrossRef]
- Blenn, C.; Althaus, F.R.; Malanga, M. Poly(ADP-ribose) glycohydrolase silencing protects against H2O2-induced cell death. Biochem. J. 2006, 396, 419–429. [Google Scholar] [CrossRef] [PubMed]
- O’Sullivan, J.; Ferreira, M.T.; Gagné, J.-P.; Sharma, A.K.; Hendzel, M.J.; Masson, J.-Y.; Poirier, G.G. Emerging roles of eraser enzymes in the dynamic control of protein ADP-ribosylation. Nat. Commun. 2019, 10, 1182. [Google Scholar] [CrossRef] [PubMed]
- Hackanson, B.; Bennett, K.L.; Brena, R.M.; Jiang, J.; Claus, R.; Chen, S.-S.; Blagitko-Dorfs, N.; Maharry, K.; Whitman, S.P.; Schmittgen, T.D.; et al. Epigenetic modification of CCAAT/enhancer binding protein alpha expression in acute myeloid leukemia. Cancer Res. 2008, 68, 3142–3151. [Google Scholar] [CrossRef] [PubMed]
- Tenen, D.G. Disruption of differentiation in human cancer: AML shows the way. Nat. Rev. Cancer 2003, 3, 89–101. [Google Scholar] [CrossRef] [PubMed]
- Prasad, C.; Prasad, S.B.; Yadav, S.S.; Pandey, L.K.; Singh, S.; Pradhan, S.; Narayan, G. Olaparib modulates DNA repair efficiency, sensitizes cervical cancer cells to cisplatin and exhibits anti-metastatic property. Sci. Rep. 2017, 7, 12876. [Google Scholar] [CrossRef]
- Wu, J.; Xiao, S.; Yuan, M.; Li, Q.; Xiao, G.; Wu, W.; Ouyang, Y.; Huang, L.; Yao, C. PARP inhibitor resensitizes Adriamycin resistant leukemia cells through DNA damage and apoptosis. Mol. Med. Rep. 2019, 19, 75–84. [Google Scholar] [PubMed]
- Federzoni, E.A.; Humbert, M.; Torbett, B.E.; Behre, G.; Fey, M.F.; Tschan, M.P. CEBPA-dependent HK3 and KLF5 expression in primary AML and during AML differentiation. Sci. Rep. 2014, 4, 4261. [Google Scholar] [CrossRef] [PubMed]
- Perrotti, D.; Cesi, V.; Trotta, R.; Guerzoni, C.; Santilli, G.; Campbell, K.; Iervolino, A.; Condorelli, F.; Gambacorti-Passerini, C.; Caligiuri, M.A.; et al. BCR-ABL suppresses C/EBPalpha expression through inhibitory action of hnRNP E2. Nat. Genet. 2002, 30, 48–58. [Google Scholar] [CrossRef] [PubMed]
- Khan, N.A.; Auranen, M.; Paetau, I.; Pirinen, E.; Euro, L.; Forsström, S.; Pasila, L.; Velagapudi, V.; Carroll, C.; Auwerx, J.; et al. Effective treatment of mitochondrial myopathy by nicotinamide riboside, a vitamin B3. EMBO Mol. Med. 2014, 6, 721–731. [Google Scholar] [CrossRef]
- Chalkiadaki, A.; Guarente, L. The multifaceted functions of sirtuins in cancer. Nat. Rev. Cancer 2015, 15, 608–624. [Google Scholar] [CrossRef] [PubMed]
- Bonkowski, M.S.; Sinclair, D.A. Slowing ageing by design: The rise of NAD(+) and sirtuin-activating compounds. Nat. Rev. Mol. Cell Biol. 2016, 17, 679–690. [Google Scholar] [CrossRef]
- Lautrup, S.; Sinclair, D.A.; Mattson, M.P.; Fang, E.F. NAD(+) in Brain Aging and Neurodegenerative Disorders. Cell Metab. 2019, 30, 630–655. [Google Scholar] [CrossRef]
- Bai, P. Biology of Poly(ADP-Ribose) polymerases: The factotums of cell maintenance. Mol. Cell 2015, 58, 947–958. [Google Scholar] [CrossRef] [PubMed]
- Chang, J.; Zhang, B.; Heath, H.; Galjart, N.; Wang, X.; Milbrandt, J. Nicotinamide adenine dinucleotide (NAD)-regulated DNA methylation alters CCCTC-binding factor (CTCF)/cohesin binding and transcription at the BDNF locus. Proc. Natl. Acad. Sci. USA 2010, 107, 21836–21841. [Google Scholar] [CrossRef] [PubMed]
- Kane, A.E.; Sinclair, D.A. Epigenetic changes during aging and their reprogramming potential. Crit. Rev. Biochem. Mol. Biol. 2019, 54, 61–83. [Google Scholar] [CrossRef] [PubMed]
- Vivelo, C.A.; Wat, R.; Agrawal, C.; Tee, H.Y.; Leung, A.K. ADPriboDB: The database of ADP-ribosylated proteins. Nucleic Acids Res. 2017, 45, 6254. [Google Scholar] [CrossRef] [PubMed]
- Hou, W.; Wang, Z.-Y.; Lin, J.; Chen, W.-M. Induction of differentiation of the acute myeloid leukemia cell line (HL-60) by a securinine dimer. Cell Death Discov. 2020, 6, 123. [Google Scholar] [CrossRef] [PubMed]
- Duprez, E.; Wagner, K.; Koch, H.; Tenen, D.G. C/EBPbeta: A major PML-RARA-responsive gene in retinoic acid-induced differentiation of APL cells. EMBO J. 2003, 22, 5806–5816. [Google Scholar] [CrossRef] [PubMed]


Publisher’s Note: MDPI stays neutral with regard to jurisdictional claims in published maps and institutional affiliations. |
© 2021 by the authors. Licensee MDPI, Basel, Switzerland. This article is an open access article distributed under the terms and conditions of the Creative Commons Attribution (CC BY) license (https://creativecommons.org/licenses/by/4.0/).
Share and Cite
Ummarino, S.; Hausman, C.; Gaggi, G.; Rinaldi, L.; Bassal, M.A.; Zhang, Y.; Seelam, A.J.; Kobayashi, I.S.; Borchiellini, M.; Ebralidze, A.K.; et al. NAD Modulates DNA Methylation and Cell Differentiation. Cells 2021, 10, 2986. https://doi.org/10.3390/cells10112986
Ummarino S, Hausman C, Gaggi G, Rinaldi L, Bassal MA, Zhang Y, Seelam AJ, Kobayashi IS, Borchiellini M, Ebralidze AK, et al. NAD Modulates DNA Methylation and Cell Differentiation. Cells. 2021; 10(11):2986. https://doi.org/10.3390/cells10112986
Chicago/Turabian StyleUmmarino, Simone, Clinton Hausman, Giulia Gaggi, Lucrezia Rinaldi, Mahmoud A. Bassal, Yanzhou Zhang, Andy Joe Seelam, Ikei S. Kobayashi, Marta Borchiellini, Alexander K. Ebralidze, and et al. 2021. "NAD Modulates DNA Methylation and Cell Differentiation" Cells 10, no. 11: 2986. https://doi.org/10.3390/cells10112986
APA StyleUmmarino, S., Hausman, C., Gaggi, G., Rinaldi, L., Bassal, M. A., Zhang, Y., Seelam, A. J., Kobayashi, I. S., Borchiellini, M., Ebralidze, A. K., Ghinassi, B., Trinh, B. Q., Kobayashi, S. S., & Di Ruscio, A. (2021). NAD Modulates DNA Methylation and Cell Differentiation. Cells, 10(11), 2986. https://doi.org/10.3390/cells10112986