
Multimodal Imaging-Based Potential Visualization of the Tumor Microenvironment in Bone Metastasis

 ,
,  and
and
Abstract
1. Introduction
2. Imaging-Based Understanding of BM Pathophysiology
2.1. Pathophysiologic Factors Related to Bone Metastasis
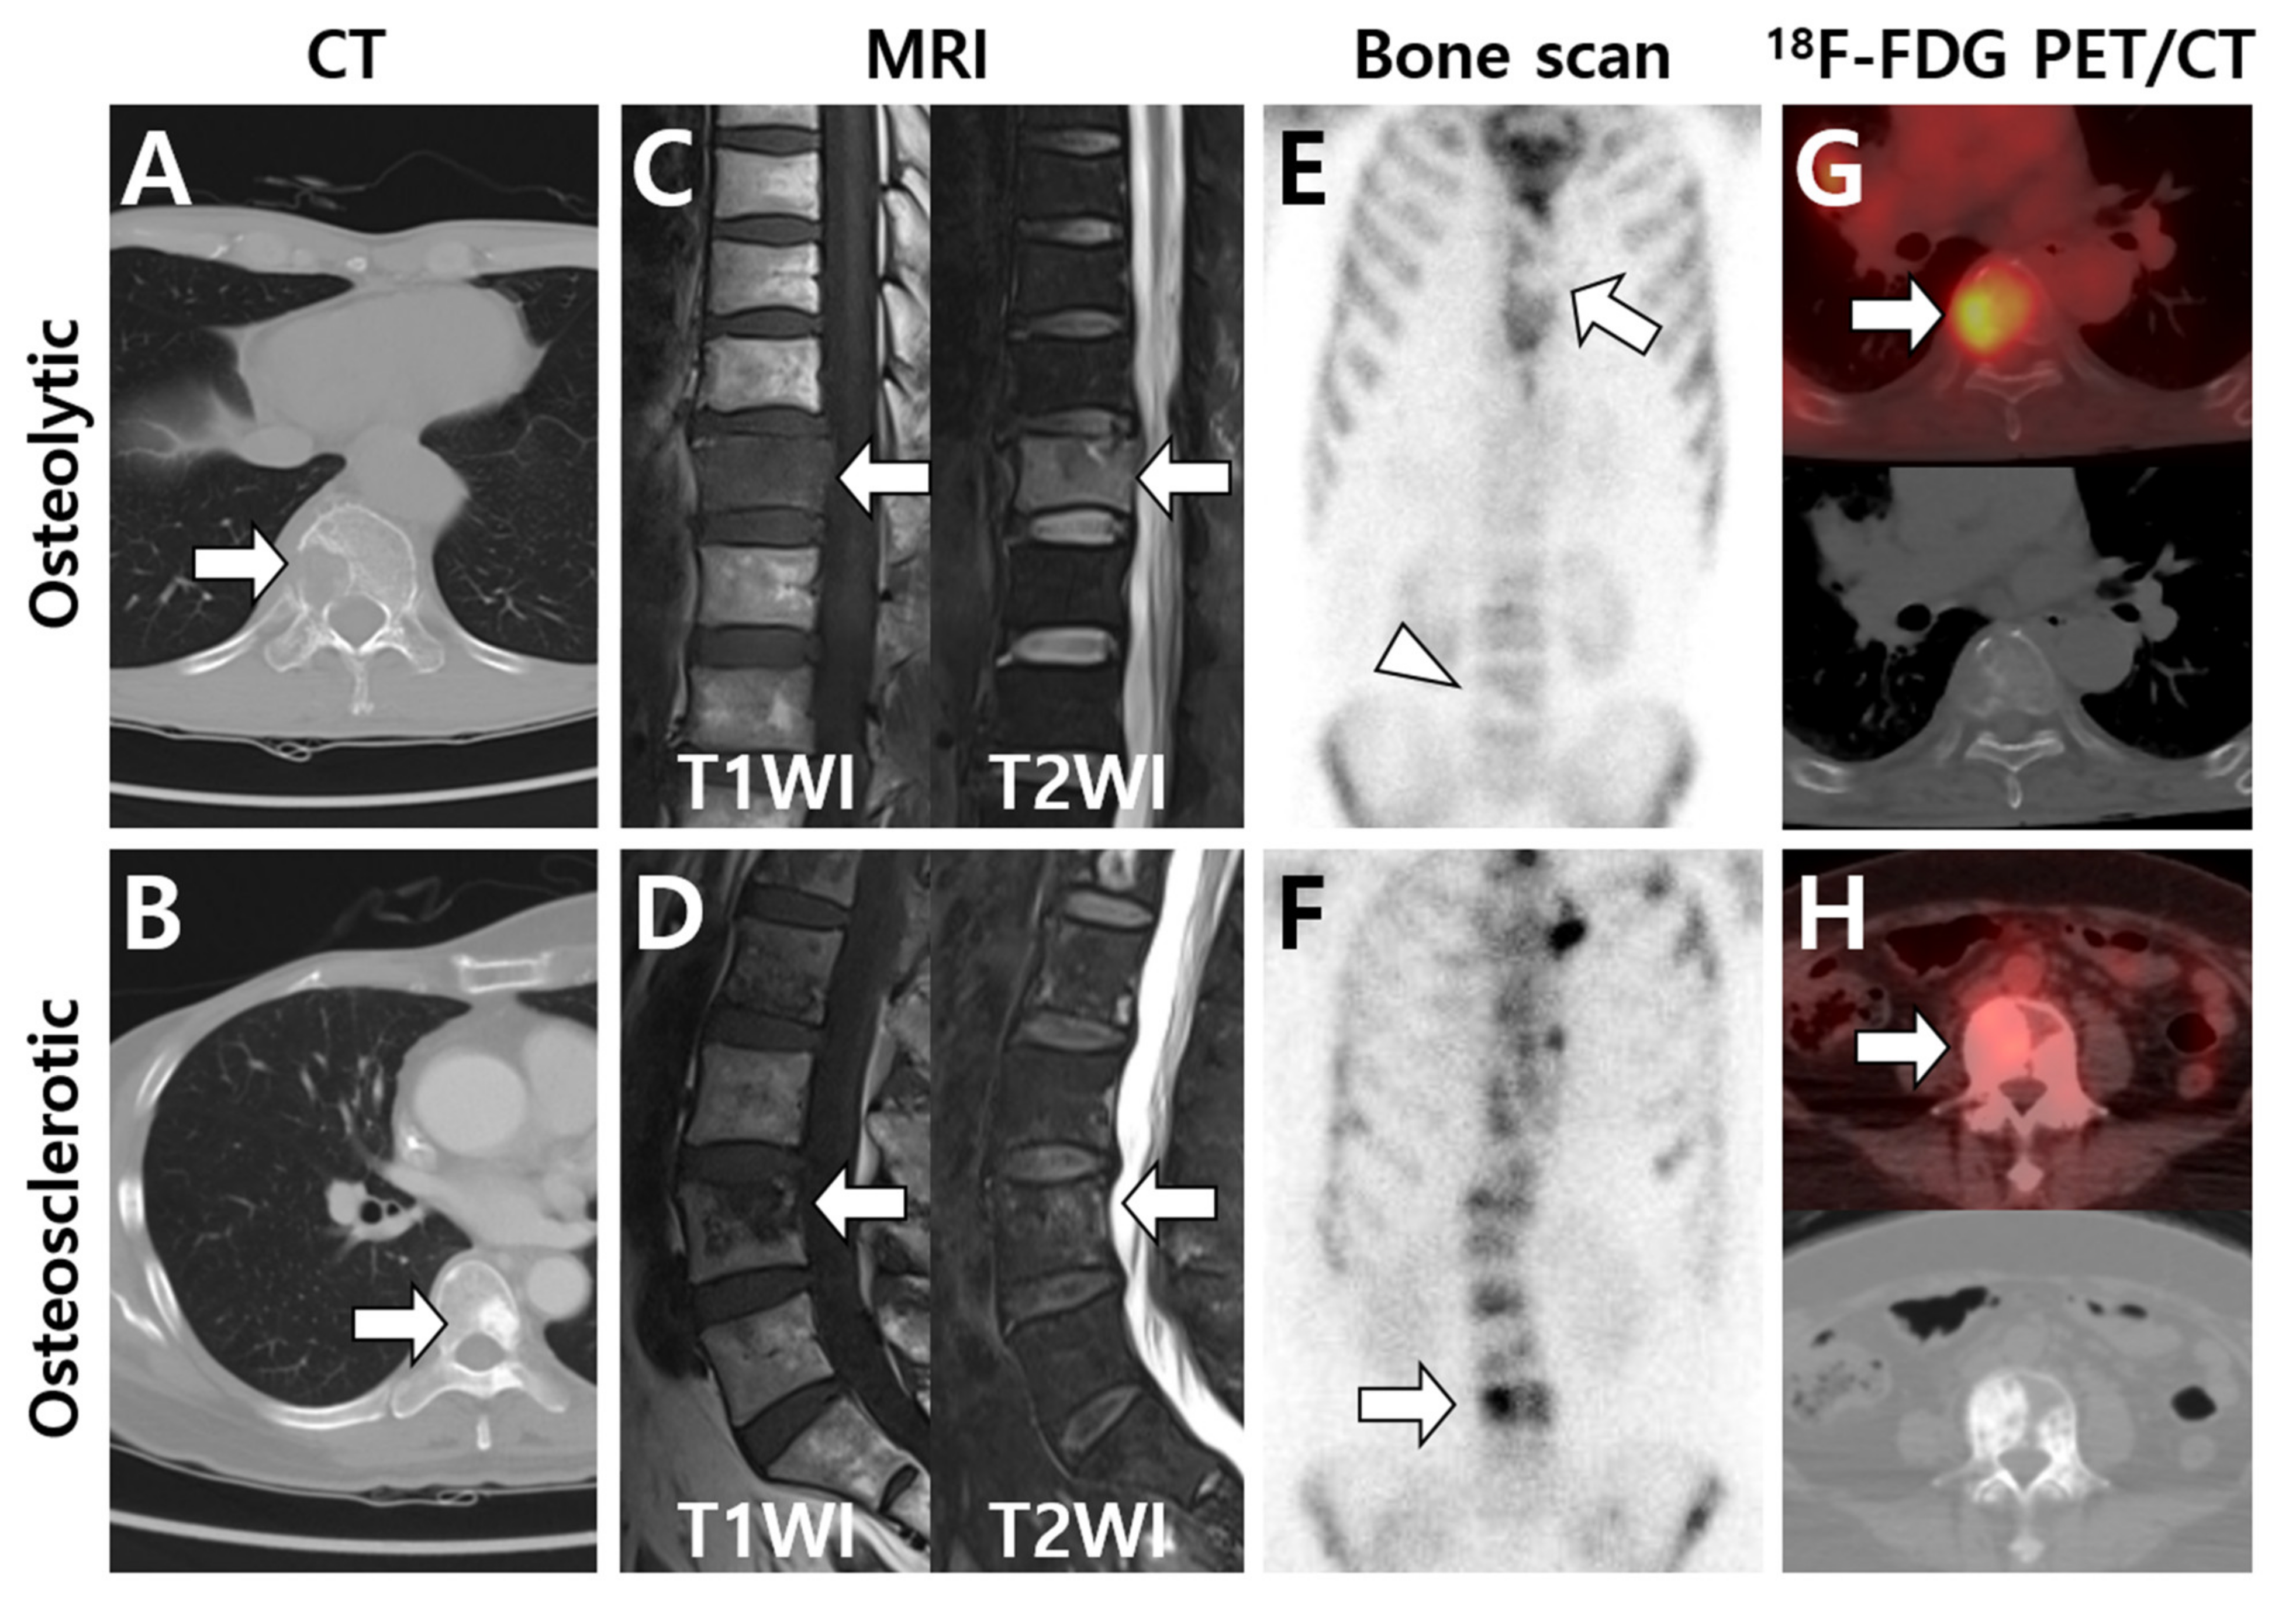
2.2. Diagnostic Principle for Imaging Modalities
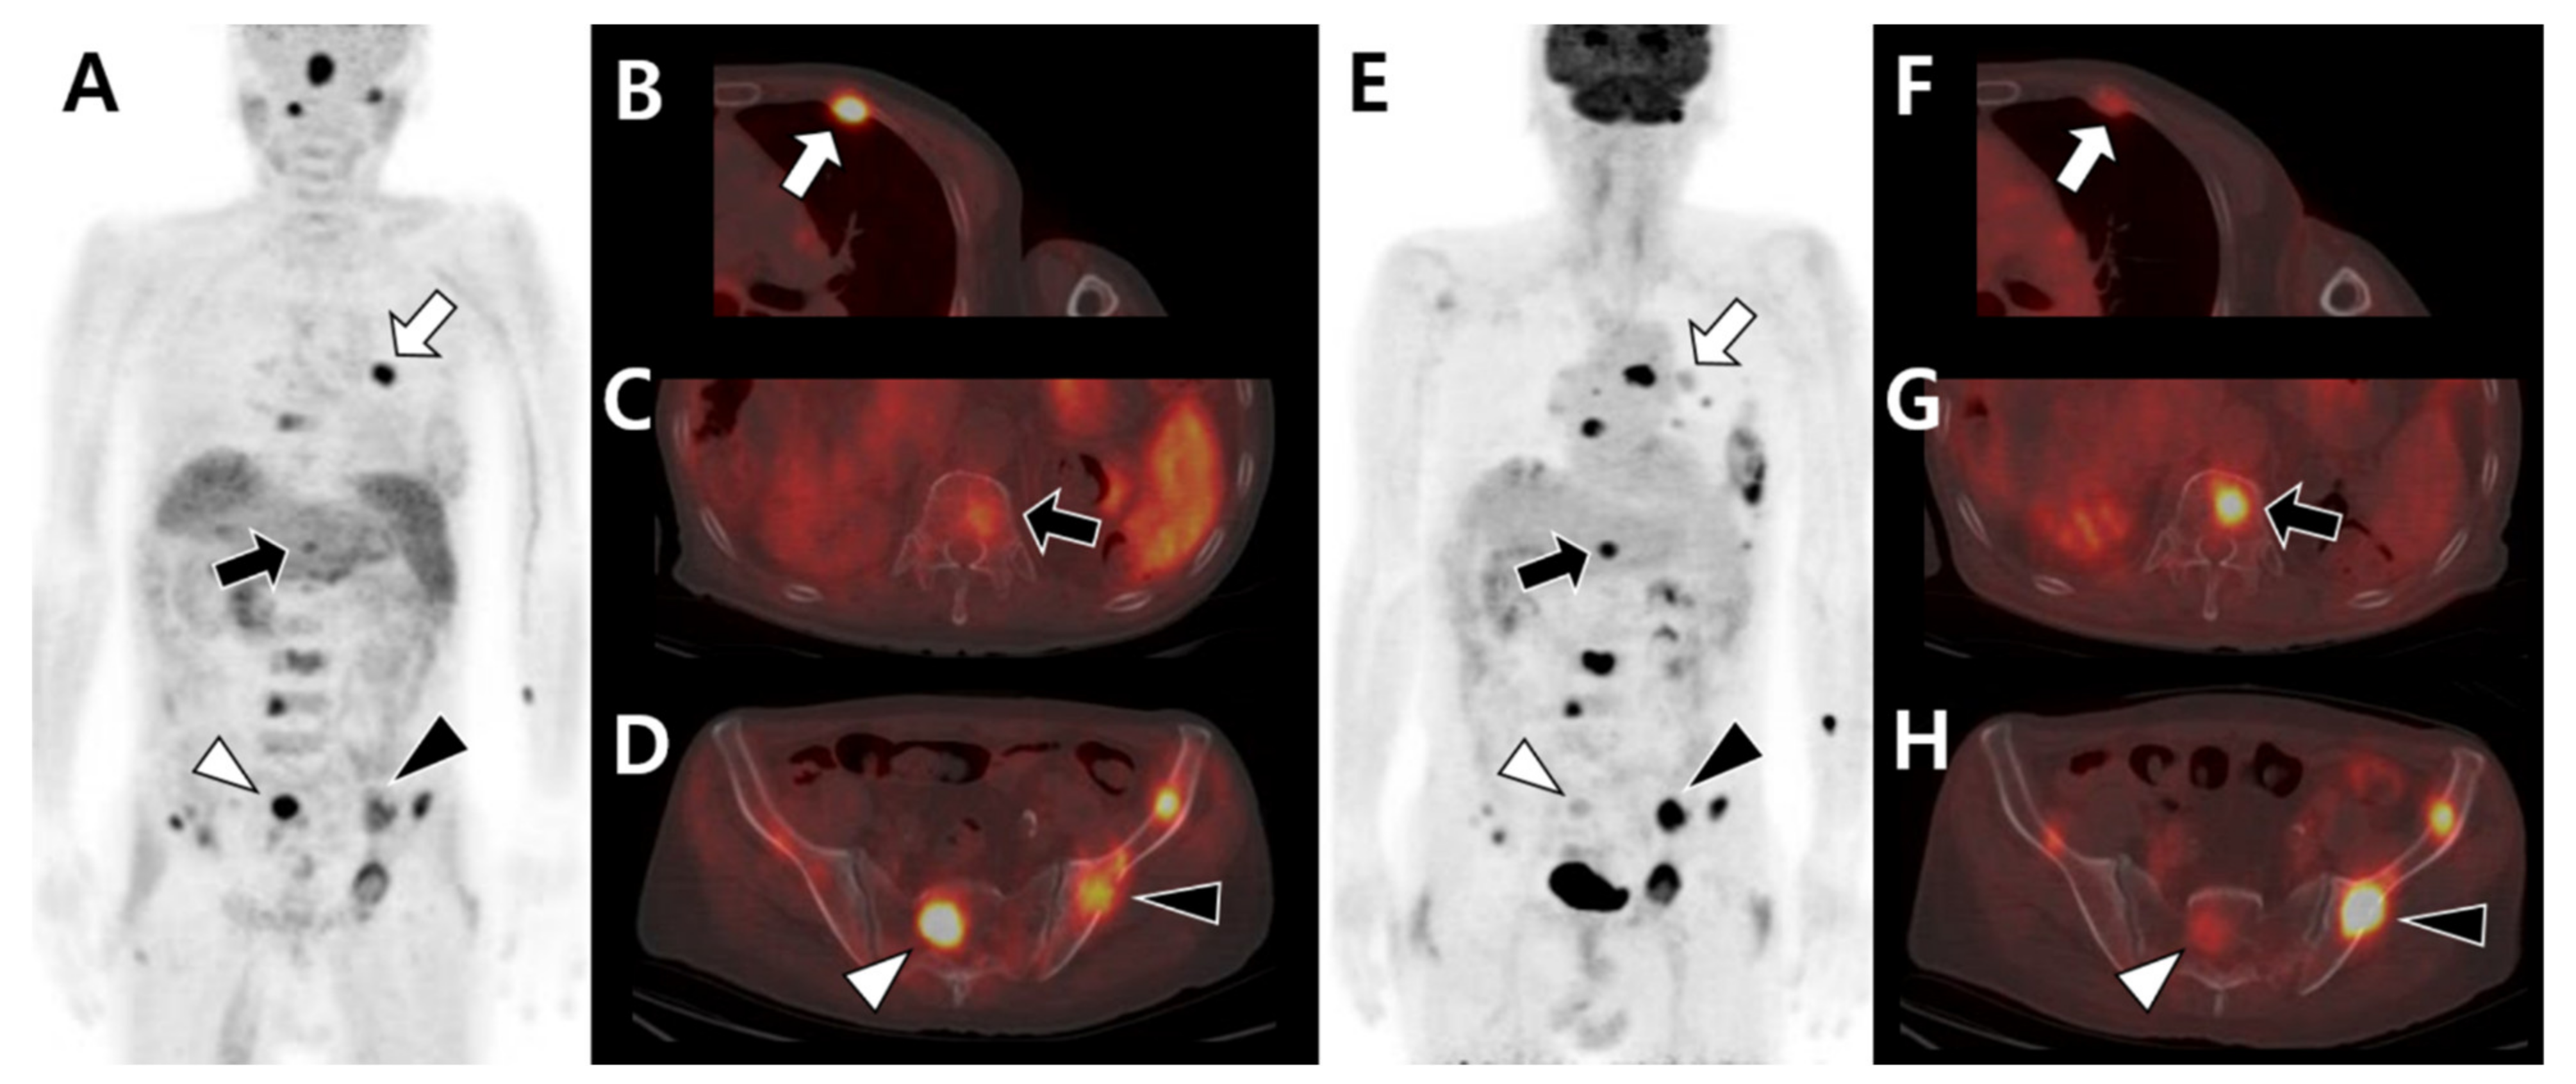
3. Imaging Patterns Based on Primary Tumor Characteristics
3.1. Multimodal Imaging According to the Primary Tumor Site and Histologic Type
3.2. Multimodal Imaging According to the Differentiation Status of the Primary Tumor
4. Imaging Patterns Based on the Bone Microenvironment
5. Conclusions
Author Contributions
Funding
Institutional Review Board Statement
Informed Consent Statement
Data Availability Statement
Conflicts of Interest
References
- Kinnane, N. Burden of bone disease. Eur. J. Oncol. Nurs. 2007, 11 (Suppl. S2), S28–S31. [Google Scholar] [CrossRef]
- Baek, Y.H.; Jeon, H.L.; Oh, I.S.; Yang, H.; Park, J.; Shin, J.Y. Incidence of skeletal-related events in patients with breast or prostate cancer-induced bone metastasis or multiple myeloma: A 12-year longitudinal nationwide healthcare database study. Cancer Epidemiol. 2019, 61, 104–110. [Google Scholar] [CrossRef]
- Hong, S.; Youk, T.; Lee, S.J.; Kim, K.M.; Vajdic, C.M. Bone metastasis and skeletal-related events in patients with solid cancer: A Korean nationwide health insurance database study. PLoS ONE 2020, 15, e0234927. [Google Scholar] [CrossRef] [PubMed]
- Laufer, I.; Rubin, D.G.; Lis, E.; Cox, B.W.; Stubblefield, M.D.; Yamada, Y.; Bilsky, M.H. The NOMS framework: Approach to the treatment of spinal metastatic tumors. Oncologist 2013, 18, 744–751. [Google Scholar] [CrossRef]
- Choi, D.; Fox, Z.; Albert, T.; Arts, M.; Balabaud, L.; Bunger, C.; Buchowski, J.M.; Coppes, M.H.; Depreitere, B.; Fehlings, M.G.; et al. Rapid improvements in pain and quality of life are sustained after surgery for spinal metastases in a large prospective cohort. Br. J. Neurosurg. 2016, 30, 337–344. [Google Scholar] [CrossRef] [PubMed]
- Kumar, N.; Malhotra, R.; Zaw, A.S.; Maharajan, K.; Naresh, N.; Kumar, A.; Vellayappan, B. Evolution in treatment strategy for metastatic spine disease: Presently evolving modalities. Eur. J. Surg. Oncol. 2017, 43, 1784–1801. [Google Scholar] [CrossRef] [PubMed]
- Nasser, S.M.; Sahal, A.; Hamad, A.; Elazzazy, S. Effect of denosumab versus zoledronic acid on calcium levels in cancer patients with bone metastasis: A retrospective cohort study. J. Oncol. Pharm. Pract. 2019, 25, 1846–1852. [Google Scholar] [CrossRef]
- Al Farii, H.; Frazer, A.; Farahdel, L.; Alfayez, S.; Weber, M. Zoledronic Acid Versus Denosumab for Prevention of Spinal Cord Compression in Advanced Cancers With Spine Metastasis: A Meta-Analysis of Randomized Controlled Trials. Glob. Spine J. 2020, 10, 784–789. [Google Scholar] [CrossRef] [PubMed]
- Park, C.C.; Bissell, M.J.; Barcellos-Hoff, M.H. The influence of the microenvironment on the malignant phenotype. Mol. Med. Today 2000, 6, 324–329. [Google Scholar] [CrossRef]
- Glunde, K.; Bhujwalla, Z.M.; Ronen, S.M. Choline metabolism in malignant transformation. Nat. Rev. Cancer 2011, 11, 835–848. [Google Scholar] [CrossRef] [PubMed]
- Hiraga, T. Bone metastasis: Interaction between cancer cells and bone microenvironment. J. Oral Biosci. 2019, 61, 95–98. [Google Scholar] [CrossRef] [PubMed]
- Kolb, A.D.; Shupp, A.B.; Mukhopadhyay, D.; Marini, F.C.; Bussard, K.M. Osteoblasts are “educated” by crosstalk with metastatic breast cancer cells in the bone tumor microenvironment. Breast Cancer Res. 2019, 21, 31. [Google Scholar] [CrossRef] [PubMed]
- Choi, J.; Raghavan, M. Diagnostic imaging and image-guided therapy of skeletal metastases. Cancer Control 2012, 19, 102–112. [Google Scholar] [CrossRef] [PubMed]
- Youn, H.; Hong, K.J. In vivo non invasive molecular imaging for immune cell tracking in small animals. Immune Netw. 2012, 12, 223–229. [Google Scholar] [CrossRef]
- Fang, M.; Peng, C.W.; Yuan, J.P.; Zhang, Z.L.; Pang, D.W.; Li, Y. Coevolution of the tumor microenvironment revealed by quantum dot-based multiplexed imaging of hepatocellular carcinoma. Future Oncol. 2013, 9, 1029–1037. [Google Scholar] [CrossRef]
- Narunsky, L.; Oren, R.; Bochner, F.; Neeman, M. Imaging aspects of the tumor stroma with therapeutic implications. Pharmacol. Ther. 2014, 141, 192–208. [Google Scholar] [CrossRef]
- LeBleu, V.S. Imaging the Tumor Microenvironment. Cancer J. 2015, 21, 174–178. [Google Scholar] [CrossRef] [PubMed]
- Longo, V.; Brunetti, O.; D’Oronzo, S.; Ostuni, C.; Gatti, P.; Silvestris, F. Bone metastases in hepatocellular carcinoma: An emerging issue. Cancer Metastasis Rev. 2014, 33, 333–342. [Google Scholar] [CrossRef] [PubMed]
- Meng, F.; Wu, G. The rejuvenated scenario of epithelial-mesenchymal transition (EMT) and cancer metastasis. Cancer Metastasis Rev. 2012, 31, 455–467. [Google Scholar] [CrossRef] [PubMed]
- Nervo, A.; Ragni, A.; Retta, F.; Gallo, M.; Piovesan, A.; Liberini, V.; Gatti, M.; Ricardi, U.; Deandreis, D.; Arvat, E. Bone metastases from differentiated thyroid carcinoma: Current knowledge and open issues. J. Endocrinol. Investig. 2021, 44, 403–419. [Google Scholar] [CrossRef]
- Pal, P.; Singh, B.; Kane, S.; Chaturvedi, P. Bone Metastases in Follicular Carcinoma of Thyroid. Indian J. Otolaryngol. Head Neck Surg. 2018, 70, 10–14. [Google Scholar] [CrossRef] [PubMed]
- Ishay-Ronen, D.; Diepenbruck, M.; Kalathur, R.K.R.; Sugiyama, N.; Tiede, S.; Ivanek, R.; Bantug, G.; Morini, M.F.; Wang, J.; Hess, C.; et al. Gain Fat-Lose Metastasis: Converting Invasive Breast Cancer Cells into Adipocytes Inhibits Cancer Metastasis. Cancer Cell 2019, 35, 17–32.e16. [Google Scholar] [CrossRef] [PubMed]
- Even-Sapir, E. Imaging of malignant bone involvement by morphologic, scintigraphic, and hybrid modalities. J. Nucl. Med. 2005, 46, 1356–1367. [Google Scholar] [PubMed]
- Rucci, N. Molecular biology of bone remodelling. Clin. Cases Miner. Bone Metab. 2008, 5, 49–56. [Google Scholar] [PubMed]
- Chen, K.; Jiao, Y.; Liu, L.; Huang, M.; He, C.; He, W.; Hou, J.; Yang, M.; Luo, X.; Li, C. Communications between Bone Marrow Macrophages and Bone Cells in Bone Remodeling. Front. Cell Dev. Biol. 2020, 8, 598263. [Google Scholar] [CrossRef]
- Ottewell, P.D. The role of osteoblasts in bone metastasis. J. Bone Oncol. 2016, 5, 124–127. [Google Scholar] [CrossRef]
- Rosenthal, D.I. Radiologic diagnosis of bone metastases. Cancer 1997, 80, 1595–1607. [Google Scholar] [CrossRef]
- Guise, T.A.; Mohammad, K.S.; Clines, G.; Stebbins, E.G.; Wong, D.H.; Higgins, L.S.; Vessella, R.; Corey, E.; Padalecki, S.; Suva, L.; et al. Basic mechanisms responsible for osteolytic and osteoblastic bone metastases. Clin. Cancer Res. 2006, 12, 6213s–6216s. [Google Scholar] [CrossRef] [PubMed]
- Sasaki, A.; Ishikawa, K.; Haraguchi, N.; Inoue, H.; Ishio, T.; Shibata, K.; Ohta, M.; Kitano, S.; Mori, M. Receptor activator of nuclear factor-kappaB ligand (RANKL) expression in hepatocellular carcinoma with bone metastasis. Ann. Surg. Oncol. 2007, 14, 1191–1199. [Google Scholar] [CrossRef] [PubMed]
- Maurizi, A.; Rucci, N. The Osteoclast in Bone Metastasis: Player and Target. Cancers 2018, 10, 218. [Google Scholar] [CrossRef] [PubMed]
- Cook, G.J.R.; Goh, V. Molecular Imaging of Bone Metastases and Their Response to Therapy. J. Nucl. Med. 2020, 61, 799–806. [Google Scholar] [CrossRef]
- O’Sullivan, G.J.; Carty, F.L.; Cronin, C.G. Imaging of bone metastasis: An update. World J. Radiol. 2015, 7, 202–211. [Google Scholar] [CrossRef] [PubMed]
- Helms, C.A.; Cann, C.E.; Brunelle, F.O.; Gilula, L.A.; Chafetz, N.; Genant, H.K. Detection of bone-marrow metastases using quantitative computed tomography. Radiology 1981, 140, 745–750. [Google Scholar] [CrossRef] [PubMed]
- Dong, Y.; Zheng, S.; Machida, H.; Wang, B.; Liu, A.; Liu, Y.; Zhang, X. Differential diagnosis of osteoblastic metastases from bone islands in patients with lung cancer by single-source dual-energy CT: Advantages of spectral CT imaging. Eur. J. Radiol. 2015, 84, 901–907. [Google Scholar] [CrossRef] [PubMed]
- Issa, G.; Davis, D.; Mulligan, M.E. The Ability of Dual-Energy Computed Tomography to Distinguish Normal Bone Marrow from Metastases Using Bone Marrow Color Maps. J. Comput. Assist. Tomogr. 2018, 42, 552–558. [Google Scholar] [CrossRef] [PubMed]
- Subramanian, G.; McAfee, J.G.; Blair, R.J.; Kallfelz, F.A.; Thomas, F.D. Technetium-99m-methylene diphosphonate—A superior agent for skeletal imaging: Comparison with other technetium complexes. J. Nucl. Med. 1975, 16, 744–755. [Google Scholar]
- Rybak, L.D.; Rosenthal, D.I. Radiological imaging for the diagnosis of bone metastases. Q. J. Nucl. Med. 2001, 45, 53–64. [Google Scholar] [PubMed]
- Hamaoka, T.; Madewell, J.E.; Podoloff, D.A.; Hortobagyi, G.N.; Ueno, N.T. Bone imaging in metastatic breast cancer. J. Clin. Oncol. 2004, 22, 2942–2953. [Google Scholar] [CrossRef]
- Costelloe, C.M.; Rohren, E.M.; Madewell, J.E.; Hamaoka, T.; Theriault, R.L.; Yu, T.K.; Lewis, V.O.; Ma, J.; Stafford, R.J.; Tari, A.M.; et al. Imaging bone metastases in breast cancer: Techniques and recommendations for diagnosis. Lancet Oncol. 2009, 10, 606–614. [Google Scholar] [CrossRef]
- Jehn, C.F.; Diel, I.J.; Overkamp, F.; Kurth, A.; Schaefer, R.; Miller, K.; Luftner, D. Management of Metastatic Bone Disease Algorithms for Diagnostics and Treatment. Anticancer Res. 2016, 36, 2631–2637. [Google Scholar] [PubMed]
- Soliman, M.; Taunk, N.K.; Simons, R.E.; Osborne, J.R.; Kim, M.M.; Szerlip, N.J.; Spratt, D.E. Anatomic and functional imaging in the diagnosis of spine metastases and response assessment after spine radiosurgery. Neurosurg. Focus 2017, 42, E5. [Google Scholar] [CrossRef] [PubMed]
- Stecco, A.; Trisoglio, A.; Soligo, E.; Berardo, S.; Sukhovei, L.; Carriero, A. Whole-Body MRI with Diffusion-Weighted Imaging in Bone Metastases: A Narrative Review. Diagnostics 2018, 8, 45. [Google Scholar] [CrossRef] [PubMed]
- Mossa-Basha, M.; Gerszten, P.C.; Myrehaug, S.; Mayr, N.A.; Yuh, W.T.; Jabehdar Maralani, P.; Sahgal, A.; Lo, S.S. Spinal metastasis: Diagnosis, management and follow-up. Br. J. Radiol. 2019, 92, 20190211. [Google Scholar] [CrossRef]
- Lee, J.H.; Yoo, G.S.; Yoon, Y.C.; Park, H.C.; Kim, H.S. Diffusion-weighted and dynamic contrast-enhanced magnetic resonance imaging after radiation therapy for bone metastases in patients with hepatocellular carcinoma. Sci. Rep. 2021, 11, 10459. [Google Scholar] [CrossRef] [PubMed]
- Qu, X.; Huang, X.; Yan, W.; Wu, L.; Dai, K. A meta-analysis of ¹⁸FDG-PET-CT, ¹⁸FDG-PET, MRI and bone scintigraphy for diagnosis of bone metastases in patients with lung cancer. Eur. J. Radiol. 2012, 81, 1007–1015. [Google Scholar] [CrossRef] [PubMed]
- Yoo, S.W.; Chowdhury, M.S.A.; Jeon, S.; Kang, S.R.; Lee, C.; Jabin, Z.; Kim, J.; Cho, S.G.; Song, H.C.; Bom, H.S.; et al. Clinical Impact of F-18 FDG PET-CT on Biopsy Site Selection in Patients with Suspected Bone Metastasis of Unknown Primary Site. Nucl. Med. Mol. Imaging 2020, 54, 192–198. [Google Scholar] [CrossRef]
- Suva, L.J.; Washam, C.; Nicholas, R.W.; Griffin, R.J. Bone metastasis: Mechanisms and therapeutic opportunities. Nat. Rev. Endocrinol. 2011, 7, 208–218. [Google Scholar] [CrossRef]
- Chen, H.Y.; Ma, X.M.; Bai, Y.R. Radiographic characteristics of bone metastases from hepatocellular carcinoma. Contemp. Oncol. 2012, 16, 424–431. [Google Scholar] [CrossRef]
- Umer, M.; Mohib, Y.; Atif, M.; Nazim, M. Skeletal metastasis in renal cell carcinoma: A review. Ann. Med. Surg. 2018, 27, 9–16. [Google Scholar] [CrossRef]
- Zhu, T.; Bao, X.; Chen, M.; Lin, R.; Zhuyan, J.; Zhen, T.; Xing, K.; Zhou, W.; Zhu, S. Mechanisms and Future of Non-Small Cell Lung Cancer Metastasis. Front. Oncol. 2020, 10, 585284. [Google Scholar] [CrossRef] [PubMed]
- Sohaib, S.A.; Cook, G.; Allen, S.D.; Hughes, M.; Eisen, T.; Gore, M. Comparison of whole-body MRI and bone scintigraphy in the detection of bone metastases in renal cancer. Br. J. Radiol. 2009, 82, 632–639. [Google Scholar] [CrossRef]
- Takenaka, D.; Ohno, Y.; Matsumoto, K.; Aoyama, N.; Onishi, Y.; Koyama, H.; Nogami, M.; Yoshikawa, T.; Matsumoto, S.; Sugimura, K. Detection of bone metastases in non-small cell lung cancer patients: Comparison of whole-body diffusion-weighted imaging (DWI), whole-body MR imaging without and with DWI, whole-body FDG-PET/CT, and bone scintigraphy. J. Magn. Reson. Imaging 2009, 30, 298–308. [Google Scholar] [CrossRef] [PubMed]
- Velloni, F.; Ramalho, M.; AlObaidy, M.; Matos, A.P.; Altun, E.; Semelka, R.C. Bone Metastases of Hepatocellular Carcinoma: Appearance on MRI Using a Standard Abdominal Protocol. AJR Am. J. Roentgenol. 2016, 206, 1003–1012. [Google Scholar] [CrossRef] [PubMed]
- Iñiguez-Ariza, N.M.; Bible, K.C.; Clarke, B.L. Bone metastases in thyroid cancer. J. Bone Oncol. 2020, 21, 100282. [Google Scholar] [CrossRef] [PubMed]
- Min, J.W.; Um, S.W.; Yim, J.J.; Yoo, C.G.; Han, S.K.; Shim, Y.S.; Kim, Y.W. The role of whole-body FDG PET/CT, Tc 99m MDP bone scintigraphy, and serum alkaline phosphatase in detecting bone metastasis in patients with newly diagnosed lung cancer. J. Korean Med. Sci. 2009, 24, 275–280. [Google Scholar] [CrossRef] [PubMed]
- Liu, N.; Ma, L.; Zhou, W.; Pang, Q.; Hu, M.; Shi, F.; Fu, Z.; Li, M.; Yang, G.; Yu, J. Bone metastasis in patients with non-small cell lung cancer: The diagnostic role of F-18 FDG PET/CT. Eur. J. Radiol. 2010, 74, 231–235. [Google Scholar] [CrossRef] [PubMed]
- Griffin, N.; Gore, M.E.; Sohaib, S.A. Imaging in metastatic renal cell carcinoma. AJR Am. J. Roentgenol. 2007, 189, 360–370. [Google Scholar] [CrossRef]
- Seo, H.J.; Kim, G.M.; Kim, J.H.; Kang, W.J.; Choi, H.J. ¹⁸F-FDG PET/CT in hepatocellular carcinoma: Detection of bone metastasis and prediction of prognosis. Nucl. Med. Commun. 2015, 36, 226–233. [Google Scholar] [CrossRef] [PubMed]
- Haider, M.T.; Smit, D.J.; Taipaleenmäki, H. The Endosteal Niche in Breast Cancer Bone Metastasis. Front. Oncol. 2020, 10, 335. [Google Scholar] [CrossRef] [PubMed]
- Pesapane, F.; Downey, K.; Rotili, A.; Cassano, E.; Koh, D.M. Imaging diagnosis of metastatic breast cancer. Insights Imaging 2020, 11, 79. [Google Scholar] [CrossRef] [PubMed]
- Abe, K.; Sasaki, M.; Kuwabara, Y.; Koga, H.; Baba, S.; Hayashi, K.; Takahashi, N.; Honda, H. Comparison of 18FDG-PET with 99mTc-HMDP scintigraphy for the detection of bone metastases in patients with breast cancer. Ann. Nucl. Med. 2005, 19, 573–579. [Google Scholar] [CrossRef] [PubMed]
- Cook, G.J.; Houston, S.; Rubens, R.; Maisey, M.N.; Fogelman, I. Detection of bone metastases in breast cancer by 18FDG PET: Differing metabolic activity in osteoblastic and osteolytic lesions. J. Clin. Oncol. 1998, 16, 3375–3379. [Google Scholar] [CrossRef] [PubMed]
- Shie, P.; Cardarelli, R.; Brandon, D.; Erdman, W.; Abdulrahim, N. Meta-analysis: Comparison of F-18 Fluorodeoxyglucose-positron emission tomography and bone scintigraphy in the detection of bone metastases in patients with breast cancer. Clin. Nucl. Med. 2008, 33, 97–101. [Google Scholar] [CrossRef] [PubMed]
- Berish, R.B.; Ali, A.N.; Telmer, P.G.; Ronald, J.A.; Leong, H.S. Translational models of prostate cancer bone metastasis. Nat. Rev. Urol. 2018, 15, 403–421. [Google Scholar] [CrossRef] [PubMed]
- Öztürk, H.; Karapolat, I. (18)F-fluorodeoxyglucose PET/CT for detection of disease in patients with prostate-specific antigen relapse following radical treatment of a local-stage prostate cancer. Oncol. Lett. 2016, 11, 316–322. [Google Scholar] [CrossRef] [PubMed]
- Turpin, A.; Girard, E.; Baillet, C.; Pasquier, D.; Olivier, J.; Villers, A.; Puech, P.; Penel, N. Imaging for Metastasis in Prostate Cancer: A Review of the Literature. Front. Oncol. 2020, 10, 55. [Google Scholar] [CrossRef]
- Ito, S.; Kato, K.; Ikeda, M.; Iwano, S.; Makino, N.; Tadokoro, M.; Abe, S.; Nakano, S.; Nishino, M.; Ishigaki, T.; et al. Comparison of 18F-FDG PET and bone scintigraphy in detection of bone metastases of thyroid cancer. J. Nucl. Med. 2007, 48, 889–895. [Google Scholar] [CrossRef] [PubMed]
- Phan, H.T.; Jager, P.L.; Plukker, J.T.; Wolffenbuttel, B.H.; Dierckx, R.A.; Links, T.P. Detection of bone metastases in thyroid cancer patients: Bone scintigraphy or 18F-FDG PET? Nucl. Med. Commun. 2007, 28, 597–602. [Google Scholar] [CrossRef] [PubMed]
- Qiu, Z.L.; Xue, Y.L.; Song, H.J.; Luo, Q.Y. Comparison of the diagnostic and prognostic values of 99mTc-MDP-planar bone scintigraphy, 131I-SPECT/CT and 18F-FDG-PET/CT for the detection of bone metastases from differentiated thyroid cancer. Nucl. Med. Commun. 2012, 33, 1232–1242. [Google Scholar] [CrossRef]
- Muresan, M.M.; Olivier, P.; Leclère, J.; Sirveaux, F.; Brunaud, L.; Klein, M.; Zarnegar, R.; Weryha, G. Bone metastases from differentiated thyroid carcinoma. Endocr. Relat. Cancer 2008, 15, 37–49. [Google Scholar] [CrossRef] [PubMed]
- Wexler, J.A. Approach to the thyroid cancer patient with bone metastases. J. Clin. Endocrinol. Metab. 2011, 96, 2296–2307. [Google Scholar] [CrossRef] [PubMed]
- Cook, G.J.; Fogelman, I. Skeletal metastases from breast cancer: Imaging with nuclear medicine. Semin. Nucl. Med. 1999, 29, 69–79. [Google Scholar] [CrossRef]
- Rong, J.; Wang, S.; Ding, Q.; Yun, M.; Zheng, Z.; Ye, S. Comparison of 18 FDG PET-CT and bone scintigraphy for detection of bone metastases in breast cancer patients. A meta-analysis. Surg. Oncol. 2013, 22, 86–91. [Google Scholar] [CrossRef]
- Song, J.W.; Oh, Y.M.; Shim, T.S.; Kim, W.S.; Ryu, J.S.; Choi, C.M. Efficacy comparison between (18)F-FDG PET/CT and bone scintigraphy in detecting bony metastases of non-small-cell lung cancer. Lung Cancer 2009, 65, 333–338. [Google Scholar] [CrossRef] [PubMed]
- Cheran, S.K.; Herndon, J.E., 2nd; Patz, E.F., Jr. Comparison of whole-body FDG-PET to bone scan for detection of bone metastases in patients with a new diagnosis of lung cancer. Lung Cancer 2004, 44, 317–325. [Google Scholar] [CrossRef] [PubMed]
- Chen, C.Y.; Wu, K.; Lin, W.H.; Lan, T.Y.; Wang, S.Y.; Sun, J.S.; Weng, P.W.; Yen, R.F.; Yang, R.S. High false negative rate of Tc-99m MDP whole-body bone scintigraphy in detecting skeletal metastases for patients with hepatoma. J. Formos. Med. Assoc. 2012, 111, 140–146. [Google Scholar] [CrossRef] [PubMed]
- Seo, H.J.; Choi, Y.J.; Kim, H.J.; Jeong, Y.H.; Cho, A.; Lee, J.H.; Yun, M.; Choi, H.J.; Lee, J.D.; Kang, W.J. Evaluation of Bone Metastasis from Hepatocellular Carcinoma Using (18)F-FDG PET/CT and (99m)Tc-HDP Bone Scintigraphy: Characteristics of Soft Tissue Formation. Nucl. Med. Mol. Imaging 2011, 45, 203–211. [Google Scholar] [CrossRef][Green Version]
- Ho, C.L.; Chen, S.; Cheng, T.K.; Leung, Y.L. PET/CT characteristics of isolated bone metastases in hepatocellular carcinoma. Radiology 2011, 258, 515–523. [Google Scholar] [CrossRef] [PubMed]
- Yoo, S.W.; Kim, D.Y.; Pyo, A.; Jeon, S.; Kim, J.; Kang, S.R.; Cho, S.G.; Lee, C.; Kim, G.J.; Song, H.C.; et al. Differences in diagnostic impact of dual-tracer PET/computed tomography according to the extrahepatic metastatic site in patients with hepatocellular carcinoma. Nucl. Med. Commun. 2021, 42, 685–693. [Google Scholar] [CrossRef] [PubMed]
- Liu, Y. The Place of FDG PET/CT in Renal Cell Carcinoma: Value and Limitations. Front. Oncol. 2016, 6, 201. [Google Scholar] [CrossRef]
- Revannasiddaiah, S.; Sood, A.; Thakur, P.; Sharma, M. Skeletal metastases from renal cell carcinoma: Diagnostic uncertainty with molecular imaging. BMJ Case Rep. 2012, 2012, bcr0220125910. [Google Scholar] [CrossRef] [PubMed]
- Vargas, H.A.; Schor-Bardach, R.; Long, N.; Kirzner, A.N.; Cunningham, J.D.; Goldman, D.A.; Moskowitz, C.S.; Sosa, R.E.; Sala, E.; Panicek, D.M.; et al. Prostate cancer bone metastases on staging prostate MRI: Prevalence and clinical features associated with their diagnosis. Abdom. Radiol. 2017, 42, 271–277. [Google Scholar] [CrossRef]
- Kitajima, K.; Murphy, R.C.; Nathan, M.A.; Sugimura, K. Update on positron emission tomography for imaging of prostate cancer. Int. J. Urol. 2014, 21, 12–23. [Google Scholar] [CrossRef]
- Jadvar, H. Prostate cancer: PET with 18F-FDG, 18F- or 11C-acetate, and 18F- or 11C-choline. J. Nucl. Med. 2011, 52, 81–89. [Google Scholar] [CrossRef] [PubMed]
- Ambrosini, V.; Nicolini, S.; Caroli, P.; Nanni, C.; Massaro, A.; Marzola, M.C.; Rubello, D.; Fanti, S. PET/CT imaging in different types of lung cancer: An overview. Eur. J. Radiol. 2012, 81, 988–1001. [Google Scholar] [CrossRef] [PubMed]
- Dashevsky, B.Z.; Goldman, D.A.; Parsons, M.; Gonen, M.; Corben, A.D.; Jochelson, M.S.; Hudis, C.A.; Morrow, M.; Ulaner, G.A. Appearance of untreated bone metastases from breast cancer on FDG PET/CT: Importance of histologic subtype. Eur. J. Nucl. Med. Mol. Imaging 2015, 42, 1666–1673. [Google Scholar] [CrossRef]
- Ueda, K.; Matsui, O.; Kitao, A.; Kobayashi, S.; Nakayama, J.; Miyagawa, S.; Kadoya, M. Tumor Hemodynamics and Hepatocarcinogenesis: Radio-Pathological Correlations and Outcomes of Carcinogenic Hepatocyte Nodules. ISRN Hepatol. 2014, 2014, 607628. [Google Scholar] [CrossRef] [PubMed]
- Choi, J.Y.; Lee, J.M.; Sirlin, C.B. CT and MR imaging diagnosis and staging of hepatocellular carcinoma: Part I. Development, growth, and spread: Key pathologic and imaging aspects. Radiology 2014, 272, 635–654. [Google Scholar] [CrossRef] [PubMed]
- Yoneda, N.; Matsui, O.; Kobayashi, S.; Kitao, A.; Kozaka, K.; Inoue, D.; Yoshida, K.; Minami, T.; Koda, W.; Gabata, T. Current status of imaging biomarkers predicting the biological nature of hepatocellular carcinoma. Jpn. J. Radiol. 2019, 37, 191–208. [Google Scholar] [CrossRef] [PubMed]
- Choi, J.Y.; Lee, J.M.; Sirlin, C.B. CT and MR imaging diagnosis and staging of hepatocellular carcinoma: Part II. Extracellular agents, hepatobiliary agents, and ancillary imaging features. Radiology 2014, 273, 30–50. [Google Scholar] [CrossRef] [PubMed]
- Ho, C.L.; Yu, S.C.; Yeung, D.W. 11C-acetate PET imaging in hepatocellular carcinoma and other liver masses. J. Nucl. Med. 2003, 44, 213–221. [Google Scholar] [PubMed]
- Park, J.W.; Kim, J.H.; Kim, S.K.; Kang, K.W.; Park, K.W.; Choi, J.I.; Lee, W.J.; Kim, C.M.; Nam, B.H. A prospective evaluation of 18F-FDG and 11C-acetate PET/CT for detection of primary and metastatic hepatocellular carcinoma. J. Nucl. Med. 2008, 49, 1912–1921. [Google Scholar] [CrossRef] [PubMed]
- Mazziotti, G.; Formenti, A.M.; Panarotto, M.B.; Arvat, E.; Chiti, A.; Cuocolo, A.; Dottorini, M.E.; Durante, C.; Agate, L.; Filetti, S.; et al. Real-life management and outcome of thyroid carcinoma-related bone metastases: Results from a nationwide multicenter experience. Endocrine 2018, 59, 90–101. [Google Scholar] [CrossRef]
- Oh, J.R.; Byun, B.H.; Hong, S.P.; Chong, A.; Kim, J.; Yoo, S.W.; Kang, S.R.; Kim, D.Y.; Song, H.C.; Bom, H.S.; et al. Comparison of 131I whole-body imaging, 131I SPECT/CT, and 18F-FDG PET/CT in the detection of metastatic thyroid cancer. Eur. J. Nucl. Med. Mol. Imaging 2011, 38, 1459–1468. [Google Scholar] [CrossRef] [PubMed]
- Wexler, J.A.; Sharretts, J. Thyroid and bone. Endocrinol. Metab. Clin. N. Am. 2007, 36, 673–705. [Google Scholar] [CrossRef]
- Warburg, O.; Wind, F.; Negelein, E. The metabolism of tumors in the body. J. Gen. Physiol. 1927, 8, 519–530. [Google Scholar] [CrossRef]
- Cheng, X.; Li, Y.; Xu, Z.; Bao, L.; Li, D.; Wang, J. Comparison of 18F-FDG PET/CT with bone scintigraphy for detection of bone metastasis: A meta-analysis. Acta Radiol. 2011, 52, 779–787. [Google Scholar] [CrossRef] [PubMed]
- Grassi, I.; Nanni, C.; Allegri, V.; Morigi, J.J.; Montini, G.C.; Castellucci, P.; Fanti, S. The clinical use of PET with (11)C-acetate. Am. J. Nucl. Med. Mol. Imaging 2012, 2, 33–47. [Google Scholar]
- Ho, C.L.; Chen, S.; Yeung, D.W.; Cheng, T.K. Dual-tracer PET/CT imaging in evaluation of metastatic hepatocellular carcinoma. J. Nucl. Med. 2007, 48, 902–909. [Google Scholar] [CrossRef]
- Spick, C.; Polanec, S.H.; Mitterhauser, M.; Wadsak, W.; Anner, P.; Reiterits, B.; Haug, A.R.; Hacker, M.; Beheshti, M.; Karanikas, G. Detection of Bone Metastases Using 11C-Acetate PET in Patients with Prostate Cancer with Biochemical Recurrence. Anticancer Res. 2015, 35, 6787–6791. [Google Scholar]
- Salskov, A.; Tammisetti, V.S.; Grierson, J.; Vesselle, H. FLT: Measuring tumor cell proliferation in vivo with positron emission tomography and 3’-deoxy-3’-[18F]fluorothymidine. Semin. Nucl. Med. 2007, 37, 429–439. [Google Scholar] [CrossRef]
- Everitt, S.J.; Ball, D.L.; Hicks, R.J.; Callahan, J.; Plumridge, N.; Collins, M.; Herschtal, A.; Binns, D.; Kron, T.; Schneider, M.; et al. Differential (18)F-FDG and (18)F-FLT Uptake on Serial PET/CT Imaging Before and During Definitive Chemoradiation for Non-Small Cell Lung Cancer. J. Nucl. Med. 2014, 55, 1069–1074. [Google Scholar] [CrossRef] [PubMed]
- Dittmann, H.; Dohmen, B.M.; Paulsen, F.; Eichhorn, K.; Eschmann, S.M.; Horger, M.; Wehrmann, M.; Machulla, H.J.; Bares, R. [18F]FLT PET for diagnosis and staging of thoracic tumours. Eur. J. Nucl. Med. Mol. Imaging 2003, 30, 1407–1412. [Google Scholar] [CrossRef]
- Ceci, F.; Castellucci, P.; Graziani, T.; Schiavina, R.; Chondrogiannis, S.; Bonfiglioli, R.; Costa, S.; Virgolini, I.J.; Rubello, D.; Fanti, S.; et al. 11C-choline PET/CT identifies osteoblastic and osteolytic lesions in patients with metastatic prostate cancer. Clin. Nucl. Med. 2015, 40, e265–e270. [Google Scholar] [CrossRef]
- Wondergem, M.; van der Zant, F.M.; van der Ploeg, T.; Knol, R.J. A literature review of 18F-fluoride PET/CT and 18F-choline or 11C-choline PET/CT for detection of bone metastases in patients with prostate cancer. Nucl. Med. Commun. 2013, 34, 935–945. [Google Scholar] [CrossRef] [PubMed]
- Picchio, M.; Spinapolice, E.G.; Fallanca, F.; Crivellaro, C.; Giovacchini, G.; Gianolli, L.; Messa, C. [11C]Choline PET/CT detection of bone metastases in patients with PSA progression after primary treatment for prostate cancer: Comparison with bone scintigraphy. Eur. J. Nucl. Med. Mol. Imaging 2012, 39, 13–26. [Google Scholar] [CrossRef] [PubMed]
- Beheshti, M.; Vali, R.; Waldenberger, P.; Fitz, F.; Nader, M.; Loidl, W.; Broinger, G.; Stoiber, F.; Foglman, I.; Langsteger, W. Detection of bone metastases in patients with prostate cancer by 18F fluorocholine and 18F fluoride PET-CT: A comparative study. Eur. J. Nucl. Med. Mol. Imaging 2008, 35, 1766–1774. [Google Scholar] [CrossRef]
- Beheshti, M.; Vali, R.; Waldenberger, P.; Fitz, F.; Nader, M.; Hammer, J.; Loidl, W.; Pirich, C.; Fogelman, I.; Langsteger, W. The use of F-18 choline PET in the assessment of bone metastases in prostate cancer: Correlation with morphological changes on CT. Mol. Imaging Biol. 2010, 12, 98–107. [Google Scholar] [CrossRef]
- Glaudemans, A.W.; Enting, R.H.; Heesters, M.A.; Dierckx, R.A.; van Rheenen, R.W.; Walenkamp, A.M.; Slart, R.H. Value of 11C-methionine PET in imaging brain tumours and metastases. Eur. J. Nucl. Med. Mol. Imaging 2013, 40, 615–635. [Google Scholar] [CrossRef] [PubMed]
- Hotta, M.; Minamimoto, R.; Miwa, K. 11C-methionine-PET for differentiating recurrent brain tumor from radiation necrosis: Radiomics approach with random forest classifier. Sci. Rep. 2019, 9, 15666. [Google Scholar] [CrossRef]
- Padhani, A.R.; Gogbashian, A. Bony metastases: Assessing response to therapy with whole-body diffusion MRI. Cancer Imaging 2011, 11, S129–S145. [Google Scholar] [CrossRef] [PubMed]
- Padhani, A.R.; Makris, A.; Gall, P.; Collins, D.J.; Tunariu, N.; de Bono, J.S. Therapy monitoring of skeletal metastases with whole-body diffusion MRI. J. Magn. Reson. Imaging 2014, 39, 1049–1078. [Google Scholar] [CrossRef]
- Schwarzenboeck, S.M.; Rauscher, I.; Bluemel, C.; Fendler, W.P.; Rowe, S.P.; Pomper, M.G.; Afshar-Oromieh, A.; Herrmann, K.; Eiber, M. PSMA Ligands for PET Imaging of Prostate Cancer. J. Nucl. Med. 2017, 58, 1545–1552. [Google Scholar] [CrossRef] [PubMed]
- Afshar-Oromieh, A.; Zechmann, C.M.; Malcher, A.; Eder, M.; Eisenhut, M.; Linhart, H.G.; Holland-Letz, T.; Hadaschik, B.A.; Giesel, F.L.; Debus, J.; et al. Comparison of PET imaging with a (68)Ga-labelled PSMA ligand and (18)F-choline-based PET/CT for the diagnosis of recurrent prostate cancer. Eur. J. Nucl. Med. Mol. Imaging 2014, 41, 11–20. [Google Scholar] [CrossRef]
- Zacho, H.D.; Ravn, S.; Afshar-Oromieh, A.; Fledelius, J.; Ejlersen, J.A.; Petersen, L.J. Added value of (68)Ga-PSMA PET/CT for the detection of bone metastases in patients with newly diagnosed prostate cancer and a previous (99m)Tc bone scintigraphy. EJNMMI Res. 2020, 10, 31. [Google Scholar] [CrossRef] [PubMed]
- Heitkötter, B.; Steinestel, K.; Trautmann, M.; Grünewald, I.; Barth, P.; Gevensleben, H.; Bögemann, M.; Wardelmann, E.; Hartmann, W.; Rahbar, K.; et al. Neovascular PSMA expression is a common feature in malignant neoplasms of the thyroid. Oncotarget 2018, 9, 9867–9874. [Google Scholar] [CrossRef] [PubMed]
- Lamberts, S.W.; Bakker, W.H.; Reubi, J.C.; Krenning, E.P. Somatostatin-receptor imaging in the localization of endocrine tumors. N. Engl. J. Med. 1990, 323, 1246–1249. [Google Scholar] [CrossRef]
- Lebtahi, R.; Cadiot, G.; Delahaye, N.; Genin, R.; Daou, D.; Peker, M.C.; Chosidow, D.; Faraggi, M.; Mignon, M.; Le Guludec, D. Detection of bone metastases in patients with endocrine gastroenteropancreatic tumors: Bone scintigraphy compared with somatostatin receptor scintigraphy. J. Nucl. Med. 1999, 40, 1602–1608. [Google Scholar]
- Tavares, C.; Coelho, M.J.; Eloy, C.; Melo, M.; da Rocha, A.G.; Pestana, A.; Batista, R.; Ferreira, L.B.; Rios, E.; Selmi-Ruby, S.; et al. NIS expression in thyroid tumors, relation with prognosis clinicopathological and molecular features. Endocr. Connect. 2018, 7, 78–90. [Google Scholar] [CrossRef]
- Smith, V.E.; Read, M.L.; Turnell, A.S.; Watkins, R.J.; Watkinson, J.C.; Lewy, G.D.; Fong, J.C.; James, S.R.; Eggo, M.C.; Boelaert, K.; et al. A novel mechanism of sodium iodide symporter repression in differentiated thyroid cancer. J. Cell Sci. 2009, 122, 3393–3402. [Google Scholar] [CrossRef] [PubMed]
- Loktev, A.; Lindner, T.; Mier, W.; Debus, J.; Altmann, A.; Jäger, D.; Giesel, F.; Kratochwil, C.; Barthe, P.; Roumestand, C.; et al. A Tumor-Imaging Method Targeting Cancer-Associated Fibroblasts. J. Nucl. Med. 2018, 59, 1423–1429. [Google Scholar] [CrossRef] [PubMed]
- Lindner, T.; Loktev, A.; Altmann, A.; Giesel, F.; Kratochwil, C.; Debus, J.; Jäger, D.; Mier, W.; Haberkorn, U. Development of Quinoline-Based Theranostic Ligands for the Targeting of Fibroblast Activation Protein. J. Nucl. Med. 2018, 59, 1415–1422. [Google Scholar] [CrossRef]
- Puré, E.; Blomberg, R. Pro-tumorigenic roles of fibroblast activation protein in cancer: Back to the basics. Oncogene 2018, 37, 4343–4357. [Google Scholar] [CrossRef] [PubMed]
- Derlin, T.; Kreipe, H.H.; Schumacher, U.; Soudah, B. PSMA Expression in Tumor Neovasculature Endothelial Cells of Follicular Thyroid Adenoma as Identified by Molecular Imaging Using 68Ga-PSMA Ligand PET/CT. Clin. Nucl. Med. 2017, 42, e173–e174. [Google Scholar] [CrossRef] [PubMed]
- Chen, W.; Lee, Z.; Awadallah, A.; Zhou, L.; Xin, W. Peritumoral/vascular expression of PSMA as a diagnostic marker in hepatic lesions. Diagn. Pathol. 2020, 15, 92. [Google Scholar] [CrossRef]
- Bychkov, A.; Vutrapongwatana, U.; Tepmongkol, S.; Keelawat, S. PSMA expression by microvasculature of thyroid tumors—Potential implications for PSMA theranostics. Sci. Rep. 2017, 7, 5202. [Google Scholar] [CrossRef]
- Hwang, S.; Panicek, D.M. Magnetic resonance imaging of bone marrow in oncology, Part 1. Skeletal Radiol. 2007, 36, 913–920. [Google Scholar] [CrossRef] [PubMed]
- Hwang, S.; Panicek, D.M. Magnetic resonance imaging of bone marrow in oncology, Part 2. Skeletal Radiol. 2007, 36, 1017–1027. [Google Scholar] [CrossRef]
- Baenke, F.; Peck, B.; Miess, H.; Schulze, A. Hooked on fat: The role of lipid synthesis in cancer metabolism and tumour development. Dis. Model. Mech. 2013, 6, 1353–1363. [Google Scholar] [CrossRef] [PubMed]
- Doval, D.C.; Bhatia, K.; Vaid, A.K.; Pavithran, K.; Sharma, J.B.; Hazarika, D.; Jena, A. Spinal cord compression secondary to bone metastases from hepatocellular carcinoma. World J. Gastroenterol. 2006, 12, 5247–5252. [Google Scholar] [CrossRef]
- Ferdinandus, J.; Fragoso Costa, P.; Kessler, L.; Weber, M.; Hirmas, N.; Kostbade, K.; Bauer, S.; Schuler, M.; Ahrens, M.; Schildhaus, H.U.; et al. Initial clinical experience with (90)Y-FAPI-46 radioligand therapy for advanced stage solid tumors: A case series of nine patients. J. Nucl. Med. 2021. [Google Scholar] [CrossRef] [PubMed]
- Uijen, M.J.M.; Derks, Y.H.W.; Merkx, R.I.J.; Schilham, M.G.M.; Roosen, J.; Prive, B.M.; van Lith, S.A.M.; van Herpen, C.M.L.; Gotthardt, M.; Heskamp, S.; et al. PSMA radioligand therapy for solid tumors other than prostate cancer: Background, opportunities, challenges, and first clinical reports. Eur. J. Nucl. Med. Mol. Imaging 2021, 1–19. [Google Scholar] [CrossRef] [PubMed]


| Primary Tumor | Image Findings of Bone Metastasis | |||
|---|---|---|---|---|
| CT | MRI | Bone Scan | 18F-FDG PET/CT | |
| Thyroid |
|
|
| |
| Breast |
|
| ||
| Lung |
|
|
| |
| Liver |
|
| ||
| Kidney |
|
| ||
| Prostate |
|
|
| |
| TME-Related Factors | Imaging Mechanism | Imaging Modality | References |
|---|---|---|---|
| Tumor Metabolism | |||
| Glucose | High expression of glucose transporters High glycolytic activity | 18F-FDG PET/CT | [96,97] |
| Lipid | Increased lipid synthesis | 11C/18F-acetate PET/CT | [98,99,100] |
| Nucleotide | Increased cellular proliferation and tyrosine kinases-1 activity | 18F-fluorothymidine PET/CT | [101,102,103] |
| Cellular membrane | Increased choline transporters and choline kinase activity (cellular membrane turnover) | 11C/18F-choline PET/CT | [104,105,106,107,108] |
| Amino acid | High expression of amino acid transporter and protein synthesis | 11C-methionine PET/CT | [109,110] |
| Cellular density | Altered cellular density | MRI | [111,112] |
| Receptor expression | |||
| Prostate-specific membrane antigen (PSMA) | High expression of PSMA in tumor | 68Ga-PSMA PET/CT | [113,114,115,116] |
| Somatostatin receptor (SSTR) | High expression of SSTRs | 111In-octreotide scintigraphy | [117,118] |
| Sodium iodide symporter (NIS) | High expression in differentiated thyroid cancer | 123I/131I whole-body scintigraphy | [94,119,120] |
| Stromal cell activation | |||
| Cancer-associated fibroblasts | High expression of fibroblast activation protein (FAP) | 68Ga-FAPI PET/CT | [121,122,123] |
| Tumor-associated neovasculature | High expression of PSMA in the endothelium | 68Ga-PSMA PET/CT | [116,124,125,126] |
| Bone marrow composition | Altered bone marrow composition | MRI | [127,128] |
Publisher’s Note: MDPI stays neutral with regard to jurisdictional claims in published maps and institutional affiliations. |
© 2021 by the authors. Licensee MDPI, Basel, Switzerland. This article is an open access article distributed under the terms and conditions of the Creative Commons Attribution (CC BY) license (https://creativecommons.org/licenses/by/4.0/).
Share and Cite
Moon, J.B.; Yoo, S.W.; Lee, C.; Kim, D.-Y.; Pyo, A.; Kwon, S.Y. Multimodal Imaging-Based Potential Visualization of the Tumor Microenvironment in Bone Metastasis. Cells 2021, 10, 2877. https://doi.org/10.3390/cells10112877
Moon JB, Yoo SW, Lee C, Kim D-Y, Pyo A, Kwon SY. Multimodal Imaging-Based Potential Visualization of the Tumor Microenvironment in Bone Metastasis. Cells. 2021; 10(11):2877. https://doi.org/10.3390/cells10112877
Chicago/Turabian StyleMoon, Jang Bae, Su Woong Yoo, Changho Lee, Dong-Yeon Kim, Ayoung Pyo, and Seong Young Kwon. 2021. "Multimodal Imaging-Based Potential Visualization of the Tumor Microenvironment in Bone Metastasis" Cells 10, no. 11: 2877. https://doi.org/10.3390/cells10112877
APA StyleMoon, J. B., Yoo, S. W., Lee, C., Kim, D.-Y., Pyo, A., & Kwon, S. Y. (2021). Multimodal Imaging-Based Potential Visualization of the Tumor Microenvironment in Bone Metastasis. Cells, 10(11), 2877. https://doi.org/10.3390/cells10112877